Article

Hyperparameter Optimization for 1D-CNN-Based Network Intrusion Detection Using GA and PSO

Department of Computer Engineering, Gachon University, Seongnam 1342, Gyeonggi, Republic of Korea
*
Author to whom correspondence should be addressed.
Mathematics 2023, 11(17), 3724; https://doi.org/10.3390/math11173724
Submission received: 3 July 2023 / Revised: 20 August 2023 / Accepted: 27 August 2023 / Published: 29 August 2023
(This article belongs to the Section Engineering Mathematics)

Abstract

:
This study presents a comprehensive exploration of the hyperparameter optimization in one-dimensional (1D) convolutional neural networks (CNNs) for network intrusion detection. The increasing frequency and complexity of cyberattacks have prompted an urgent need for effective intrusion-detection systems (IDSs). Herein, we focus on optimizing nine hyperparameters within a 1D-CNN model, using two well-established evolutionary computation methods—genetic algorithm (GA) and particle swarm optimization (PSO). The performances of these methods are assessed using three major datasets—UNSW-NB15, CIC-IDS2017, and NSL-KDD. The key performance metrics considered in this study include the accuracy, loss, precision, recall, and F1-score. The results demonstrate considerable improvements in all metrics across all datasets, for both GA- and PSO-optimized models, when compared to those of the original nonoptimized 1D-CNN model. For instance, on the UNSW-NB15 dataset, GA and PSO achieve accuracies of 99.31 and 99.28%, respectively. Both algorithms yield equivalent results in terms of the precision, recall, and F1-score. Similarly, the performances of GA and PSO vary on the CIC-IDS2017 and NSL-KDD datasets, indicating that the efficacy of the optimization algorithm is context-specific and dependent on the nature of the dataset. The findings of this study demonstrate the importance and effects of efficient hyperparameter optimization, greatly contributing to the field of network security. This study serves as a crucial step toward developing advanced, robust, and adaptable IDSs capable of addressing the evolving landscape of cyber threats.

1. Introduction

1.1. Research Context and Motivation

Network security has become an essential aspect of modern digital life as cyber threats and attacks continue to evolve. Organizations and individuals face significant challenges in protecting their digital assets and sensitive information. These risks can be mitigated to an extent by employing a network intrusion-detection system (NIDS) that can identify malicious activities and potential security breaches in real time [1].
A traditional NIDS relies on rule- or signature-based detection techniques; however, these techniques often fail to adapt to new and emerging threats. With the increasing complexity of cyberattacks, various machine learning (ML) and deep learning (DL) techniques have been introduced to improve the effectiveness of NIDSs. Among the various DL models, one-dimensional (1D) convolutional neural networks (CNNs) have demonstrated promise for detecting intrusion attempts [2].
However, the performance of a 1D-CNN-based NIDS relies significantly on the selection of appropriate hyperparameters, such as the number of layers, filter size, activation functions, and learning rate [3]. Hyperparameters, the parameters not learned from data but rather set before training a model, play a pivotal role in determining a model’s performance [4]. While manual tuning might seem like a logical step [5], it is akin to searching for a needle in a haystack given the extensive hyperparameter space and variances across datasets. Therefore, efficient hyperparameter-optimization techniques are required to improve the accuracy and efficiency of NIDSs [6]. Herein lies the motivation for this research: Can we harness evolutionary computation techniques, celebrated for their optimization prowess, to fine-tune hyperparameters for 1D-CNN-based NIDSs?
This study is underpinned by a dual motivation: First, to address the technical challenge of hyperparameter optimization, and second, to bolster the efficacy of NIDS, thereby contributing to the broader vision of creating safer digital ecosystems.
Genetic algorithm (GA) and particle swarm optimization (PSO) are two popular optimization techniques widely used in various applications, including hyperparameter optimization in DL models [7]. The motivation behind choosing GA and PSO lies in their adaptive search capabilities, which can potentially yield superior model configurations. Specifically, GA utilizes principles of natural evolution such as mutation, crossover, and selection, while PSO mimics the social behavior of bird flocking or fish schooling [8]. These nature-inspired processes enable a more dynamic and comprehensive exploration of the hyperparameter space, which can lead to more effective model configurations compared to standard grid or random search methods.

1.2. Research Aims and Contributions

In this study, we aim to investigate the application of GA and PSO in hyperparameter optimization for 1D-CNN-based NIDSs. We intend to demonstrate that using these algorithms can contribute to achieving higher model performance metrics, thereby enhancing the overall efficacy of NIDSs.
Furthermore, we aim to fine-tune the GA and PSO algorithms for the intrusion-detection task, adjusting their parameters to find the optimal balance between exploration and exploitation. By tuning these algorithms, we hope to increase the probability of finding the global optimal solution and avoid premature convergence to local optima, thus improving the performance of the optimized CNN models.
In this context, our research navigates through the intricate dynamics of network security, underpinned by specific aims to enhance the efficacy and efficiency of intrusion-detection mechanisms. The primary aims of this research are:
  • Hyperparameter optimization exploration: To comprehensively investigate the application of evolutionary computation techniques, particularly GA and PSO, for hyperparameter optimization in 1D-CNNs tailored for NIDSs.
  • Benchmarking and validation: To empirically assess and validate the performance of 1D-CNN models that have been optimized using GA and PSO against standard, non-optimized models. This aim seeks to establish the merits of using these evolutionary algorithms in a practical, real-world setting.
  • Fine-tuning and adaptation: Given the unique demands of intrusion detection, we aim to refine and adapt the GA and PSO algorithms, ensuring they are tailored specifically for this domain. This involves adjusting parameters and processes within these algorithms to achieve a harmonious balance between the exploration of new solution spaces and the exploitation of known, effective solutions.
  • Future-readiness: Given the constantly evolving nature of cyber threats, we aim to ensure that the methodologies and findings of this research not only address current challenges but also offer insights and frameworks that can be adaptable to future threats and technologies.
Through these articulated aims, this research endeavors to bridge existing gaps in the literature, provide robust and efficient solutions for present challenges, and lay a foundation for future advancements in the realm of network security.
The key contributions of this study are as follows:
  • Novel GA and PSO application in NIDSs: This study is among the first to investigate the application of GA and PSO for hyperparameter optimization in 1D-CNN-based NIDSs. We demonstrate that these optimization techniques can effectively explore the search space and identify optimal configurations to achieve improved intrusion-detection performance.
  • Comparative analysis: We comprehensively compare the GA and PSO, highlighting their strengths and weaknesses in the context of hyperparameter optimization in 1D-CNN-based NIDSs. This analysis can help practitioners and researchers make informed decisions when selecting an optimization technique for a specific NIDS application.
  • Performance improvement: The experimental results reveal that the application of GA and PSO can produce significant performance improvement in terms of accuracy, precision, recall, and F1-score, compared to that of models with manually tuned hyperparameters. This demonstrates that the GA and PSO techniques can be instrumental in enhancing the effectiveness of NIDSs, ultimately contributing to more robust and secure network systems.
  • Methodological framework: The systematic approach proposed in this study can be adapted and extended to other ML and DL models, offering a valuable resource for future research in network intrusion detection.
  • Practical implications: The findings of this study have practical implications for network-security practitioners tasked with designing and deploying effective NIDSs. Practitioners can achieve improved performances and reduce the time and effort required for manual hyperparameter tuning, thereby improving the overall efficiency of their network-security infrastructure.
These contributions advance our understanding of the potential of GA and PSO techniques in the context of network intrusion detection and offer valuable insights for both researchers and practitioners in the field of network security.

1.3. Structure of the Paper

The remainder of this study is organized as follows. Section 2 delves into extant methodologies for CNN optimization and furnishes a comparative analysis, positioning our contribution amidst the prevailing literature. Section 3 examines the distinct hyperparameters associated with 1D-CNNs and offers a comprehensive analysis of GA and PSO in the context of the network’s setup and fine-tuning. In Section 4, we introduce the proposed model, expound upon the mathematical formulation for 1D-CNN-based network access detection, and outline the architecture, dataset, and data processing stages pertinent to 1D-CNN. Section 5 outlines the experiments and their results, introduces the evaluation metrics, and discusses hyperparameter optimization using GA and PSO techniques. Section 6 offers an exhaustive analysis of the outcomes, juxtaposes the efficacy of GA- and PSO-centric models, underscores their merits and limitations, and contextualizes them within the ambit of established methods. Finally, Section 7 presents our conclusions, emphasizes the key findings, and suggests future research directions.

2. Related Works

While investigating the intricacies of hyperparameter optimization for NIDSs, we must consider the contexts of the myriad methodologies and optimization techniques previously proposed. This broad research encompassing various strategies and models serves as a vital foundation to shape our understanding and guide our exploration toward the development of more efficient and effective approaches in the realm of 1D-CNNs.
Hyperparameters directly regulate the performances of DL algorithms and significantly influence the model detection performance [5]. Therefore, the selection of hyperparameters plays a vital role in the successful execution of DL projects. An inappropriate selection of hyperparameters can produce inadequate learning outcomes. For instance, an excessively high learning rate may cause the model to miss important trends in the data or the model may fail to converge. Conversely, a low learning rate may cause the model to overlook key information, thereby slowing the learning process and degrading the overall performance.
Thus, managing hyperparameters and mitigating the need for substantial computational resources are crucial steps. To this end, the authors of [5] selected optimal hyperparameters for their proposed hybrid models by testing various hyperparameters and rigorously training each model. They proposed a comprehensive approach to hyperparameter optimization, emphasizing the importance of this step in model development and training.
The authors of [4] suggested a randomized search approach for hyperparameter optimization in their IDS model. Their technique randomly sampled hyperparameters from a predefined search space and evaluated their performance on a validation set. This process continued for a predetermined number of iterations or until a point of convergence was reached. This randomized search approach efficiently used a restricted computational budget to explore large configuration spaces and determine improved model parameters. In this method, the hyperparameters of the proposed IDS model were fine-tuned using deep convolutional neural networks (DCNNs).
In [3], the authors conducted hyperparameter optimization for the CNN architecture. The optimized hyperparameters comprised the number of layers, neurons per layer, learning rate, batch size, and other critical parameters influencing the model’s performance. To carry out the hyperparameter optimization, the authors employed the Hyperband algorithm, which involves a random search over a predefined set of hyperparameters. This iterative algorithm selects configurations based on validation loss and progressively trains them until a single optimal configuration is identified.
Another unique strategy [6] used a new metaheuristic optimization method called lion swarm optimization, to optimize the hyperparameters of their proposed optimized CNN hierarchical multiscale long short-term memory (OCNN-HMLSTM) model. The lion swarm optimization increased the learning rate for spatial features, whereas HMLSTM focused on temporal features. During cross-validation tests, the authors determined that the performance of their model was much better than that of the existing intrusion-detection system (IDS) models based on ML and DL.
The technique proposed in [9] utilized neuroevolution to automatically design neural networks. This method employed an evolutionary algorithm (EA) to identify suitable topologies and weights for neural networks. It began by applying a CNN model to distinguish various types of Internet of Things traffic records. Subsequently, an encoding scheme was proposed to transform the CNN’s architecture into a chromosome of a multiobjective EA based on decomposition (MOEA/D). This scheme effectively addressed the challenges of parameter tuning in DL. The detection performance and model complexity of the CNN were optimized using a modified MOEA/D to find an optimal topological architecture that offered a balance between detection performance and model complexity.
Reference [10] introduced an interesting approach to hyperparameter optimization, wherein the authors proposed using the poor and rich optimization algorithm (PROA) to enhance the detection rate of their CNN attention-based long short-term memory (ALSTM) model. The PROA is a unique method based on the wealth-distribution behavior observed in society. It primarily considers two distinct classes of individuals—wealthier individuals, whose wealth surpasses the average wealth, and less wealthy or poor individuals, whose wealth is less than the average wealth. In the context of the algorithm, the wealthier class continually attempts to widen the gap between themselves and the less wealthy class. Similarly, in the PROA, solutions in the “poorer’’ population shift toward the global optimum solutions in the search area by learning from the “richer’’ solutions determined in the “wealthier’’ population. This approach presented an innovative method for optimizing hyperparameters, highlighting the parallels between social wealth behaviors and solution search strategies. Thus, by applying the PROA, the authors claimed to have significantly improved the detection rate of their CNN-ALSTM model.
Reference [11] presented an additional innovative approach; the authors utilized the tree-structured Parzen estimator (TPE) algorithm for Bayesian hyperparameter optimization. This process comprised several steps. Initially, the hyperparameter search space was defined by outlining the hyperparameters to be optimized and their potential value ranges. Subsequently, a loss function was selected for the experiment, which was the categorical cross-entropy loss function, in this case. Then, the TPE algorithm was executed, and the candidate hyperparameters were systematically sampled in the search space until the preset conditions were satisfied. Finally, the optimal model parameters were determined. This Bayesian optimization technique offered a systematic and principled approach to hyperparameter tuning, striking a balance between exploration and exploitation in the search space.
In [12], the authors employed the Bayesian Optimization (BO) with TPE technique for hyperparameter optimization. BO-TPE was chosen for its capability to handle conditional dependencies among hyperparameters while efficiently yielding optimal performance results across diverse types of hyperparameters. The hyperparameters subjected to BO-TPE optimization included the number of epochs, batch size, learning rate, dropout rate, early stopping patience, and the number of frozen layers. This comprehensive hyperparameter optimization approach aimed to significantly enhance the overall performance and computational efficiency of the CNN models, aligning them effectively with the specific research objectives of the study.
In [8], the key hyperparameters of all base CNN models in the proposed framework were subjected to optimization through the utilization of PSO. The hyperparameters optimized in this research encompassed the percentage of frozen layers, the learning rate, the dropout rate, the batch size, the number of epochs, and early-stop patience. These hyperparameters directly influence the structural design, effectiveness, and efficiency of CNN models. However, considering that CNN models with default hyperparameter values already exhibited near 100% accuracy on the Car-Hacking dataset, the hyperparameter optimization process was exclusively implemented for the CICIDS2017 dataset.
In the study conducted by [13], the PSO algorithm was employed to optimize specific hyperparameters in the CNN model used for intrusion detection in smart farming. The hyperparameters subjected to optimization included frozen, epochs, patience, learning rate, and dropout rate. Through iterative adjustments of particle positions and velocities in the hyperparameter search space, guided by fitness evaluations, the PSO algorithm successfully converged towards the optimal set of hyperparameters. As a result, the intrusion-detection model was enhanced, demonstrating tailored efficacy for smart farming applications.
Table 1 provides a comprehensive overview of various models and their respective hyperparameter optimization techniques utilized in the realm of intrusion detection. The most commonly optimized hyperparameters across models include ‘Batch size’, ‘Learning rate’, and ‘Number of epochs’. The optimization techniques span from traditional ‘Manual tuning’ to heuristic methods such as ‘GA’. Notably, Amir et al. employ a dual-method optimization approach, exemplifying the evolving nature of research in this domain. In contrast, our model utilizes a 1D-CNN architecture and optimizes nine hyperparameters through both the GA and PSO, demonstrating our rigorous approach to improving model performance in intrusion detection.
Considering these strategies, this study aims to create a novel path in this field. Recognizing the potential of CNNs for handling complex datasets and the importance of selecting appropriate hyperparameters for achieving optimal model performance, we focus on the hyperparameter optimization in 1D-CNN models. We aim to leverage the strengths of the existing methodologies while addressing their shortcomings, thereby furthering progress in hyperparameter optimization and ultimately improving the effectiveness and efficiency of IDSs.

3. Optimization of 1D-CNN Hyperparameters

3.1. Hyperparameters of 1D-CNNs

Establishing and adjusting hyperparameters, technically known as hyperparameter tuning or optimization, is a primary challenge in 1D-CNNs. Hyperparameters play a crucial role in determining the functionality and characteristics of 1D-CNN models. They dictate the duration and computational resources required to execute the algorithm, as well as the structural configuration of the neural network model. Furthermore, they have considerable influence on the model prediction accuracy and capacity for generalization. Therefore, the manipulation and understanding of hyperparameters are key to controlling the performances and structural integrity of neural network models.
As a rule, the values of hyperparameters are predefined by an ML engineer or another relevant party, before training the model. Unlike parameters, hyperparameters are not learned autonomously from the data during training. Consequently, they must be fine-tuned to enhance the model performance. Variations in the hyperparameters allow the creation of distinct model architectures. Nonetheless, identifying ideal hyperparameter values remains a complex task in the ML and DL fields. Optimal hyperparameters are highly dependent on the volume and nature of the dataset, as well as on the specific problem that the model is designed to resolve.
The hyperparameters within a neural network can be classified by considering specific criteria, such as the structure of the network, learning and optimization strategies, and effect of regularization. Based on these criteria, we can categorize the hyperparameters as presented in Table 2.

3.2. Optimization Methods

When it comes to the crucial task of hyperparameter optimization in DL and other computational tasks, there are a myriad of applicable algorithms. From nature-inspired methods such as GA and PSO to more structured approaches such as Bayesian Optimization, each has its unique strengths as shown in Table 3. The following subsection breaks down a comparative analysis of various optimization algorithms, shedding light on their inherent characteristics and how they stand up against each other for hyperparameter tuning.
In the vast domain of hyperparameter optimization, however, two algorithms consistently stand out for their adaptability and efficiency: GA and PSO. GAs, inspired by natural evolution, excel in exploring extensive search spaces, using mechanisms such as mutation and crossover to strike a balance between broad exploration and solution refinement. Conversely, PSO, modeling the social behaviors of organisms, demonstrates rapid convergence towards optimal solutions, effectively leveraging both individual and collective wisdom.
While the world of hyperparameter optimization is populated with diverse techniques, each having its merits, GA and PSO have carved a special niche. Their unique blend of structured search strategies and inherent adaptability makes them prime choices for a broad range of hyperparameter tuning challenges.

3.3. GA and PSO Algorithms

This section delves into the intricacies of 1D CNN hyperparameters, shedding light on their significance and impact on model performance. Further, we introduce GA and PSO, two powerful heuristic optimization techniques, elucidating their mechanisms and attributes. Through a comparative lens, we aim to offer insights into the merits and potential limitations of each algorithm, paving the way for informed decisions in the realm of hyperparameter optimization for IDS.

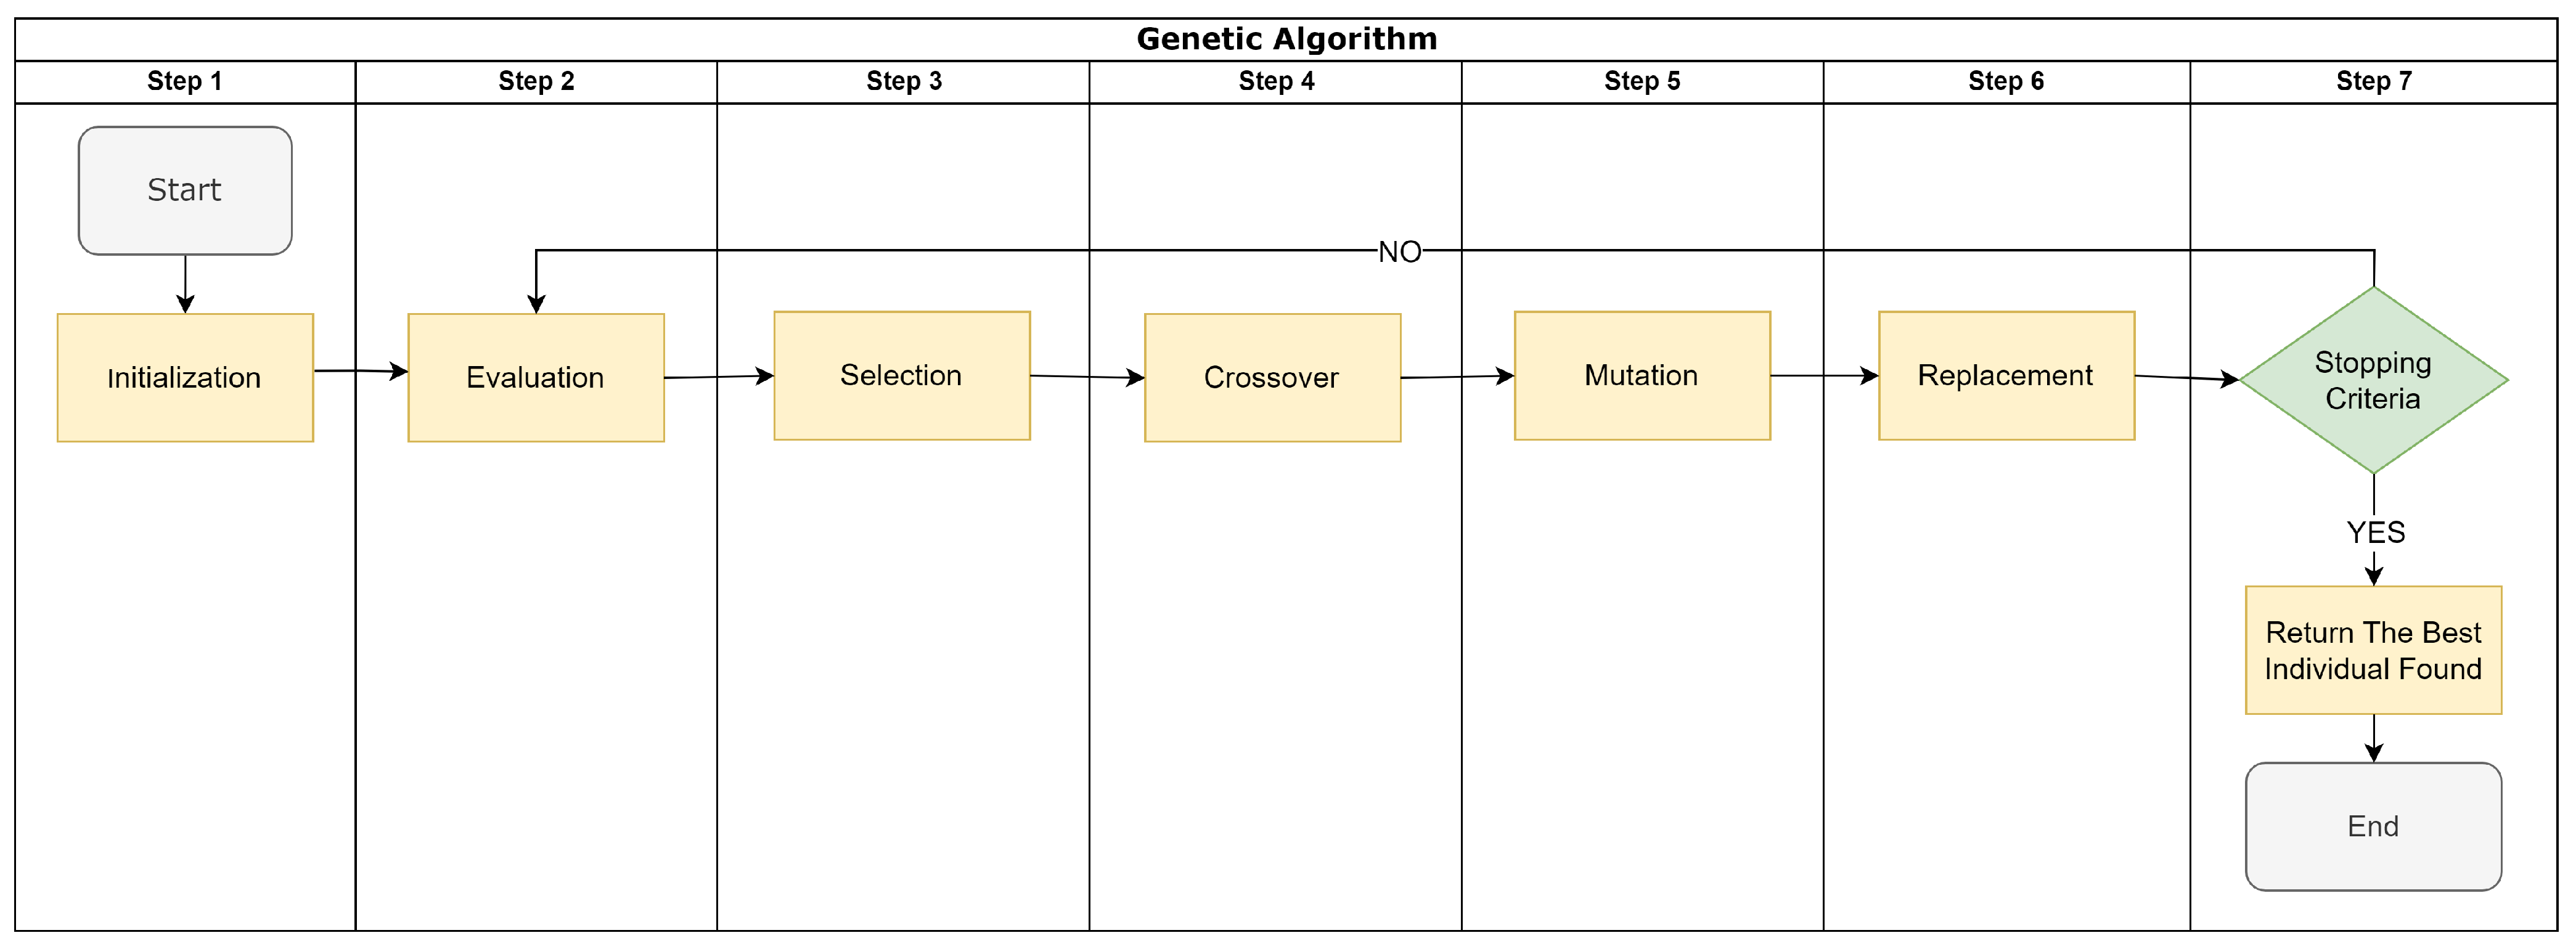
3.3.1. Genetic Algorithm (GA)

The GA is an optimization approach inspired by the principles of natural selection and evolution proposed by Charles Darwin. Conceptualized in the paradigm of biological evolution, GA operates under two primary mechanisms—natural selection and genetic mutation—which govern the survival and adaptation of diverse life forms to their environmental conditions. By applying these principles, the ultimate objective of GA is to attain optimal solutions for a given objective function, which is accomplished through a process that prioritizes the selection of the most efficient or “fittest’’ solutions. The algorithm accommodates the occasional incidence of mutations—a rarity that introduces a random variable into the selection process. Below we list the steps to use GA:
  • Step 1. Initialization: Generate a population of random solutions.
  • Step 2. Fitness evaluation: For each individual in the population, its fitness is validated, e.g., accuracy of the trained model.
  • Step 3. Selection: Select pairs of individuals from the population to be parents based on their fitness scores. Individuals with higher fitness have a higher chance of being selected.
  • Step 4. Crossover: For each pair of parents, create a child individual by randomly choosing from one of the two parents.
  • Step 5. Mutation: For each child individual, it has a small chance of being replaced by a randomly generated value.
  • Step 6. Replacement: Replace the least fit individuals in the population with the child individuals.
  • Step 7. Termination check: If the stopping criterion (e.g., reaching the maximum number of generations) is met, stop the algorithm and return the most fit individual in the population as the best set. Otherwise, go back to step 2.
Figure 1 illustrates a schematic of the operational procedure of GA. This visual representation provides a detailed understanding of the steps involved in the algorithm.

3.3.2. Particle Swarm Optimization (PSO)

The PSO technique embodies an optimization strategy based on the societal behavior observed in animal populations, such as the coordinated movement witnessed within flocks of birds or schools of fish. This concept was first introduced by Eberhart and Kennedy and has been extensively employed to address numerous optimization issues. The fundamental premise of PSO involves optimizing a problem through the iterative repositioning of a particle group toward an optimal location within a predetermined search space. The operational design of PSO incorporates five principal tenets inspired by the following animal behaviors:
  • Proximity: This principle underlines the algorithm’s capability to perform basic time and space computations.
  • Stability: The swarm retains its behavioral characteristics regardless of alterations in the environment.
  • Quality: It exhibits a keen sensitivity to changes in environmental quality, and adjusts its response accordingly.
  • Diverse response: It embodies the algorithm’s unrestricted adaptability in response to environmental shifts.
  • Adaptability: The algorithm can discern whether changes in the environment warrant a behavioral shift.
PSO employs two operators integral to the functioning of the algorithm: position update and velocity update. Figure 2 presents a schematic of the basic PSO algorithm, outlining the seven primary steps executed in each iterative process. We describe the sequential steps of the PSO method below:
  • Step 1. Initialization: The PSO algorithm starts by initializing a swarm of particles. Each particle represents a potential solution. The position of a particle in the search space corresponds to the specific values, and the velocity determines how much they change in each iteration.
  • Step 2. Fitness evaluation: Next, the fitness of each particle is evaluated. The fitness of the particle can be the validation accuracy, or 1-validation accuracy if you want a minimization problem.
  • Step 3. Update personal best: If the new fitness score of a particle is better than its personal best fitness score, the personal best is updated to the new fitness score.
  • Step 4. Update global best: The particle with the best fitness score in the entire swarm is identified, and its fitness score and particle values are stored as the global best.
  • Step 5. Update velocities and positions: The velocities and positions of the particles are updated based on a combination of their current velocities, the distance from their personal best positions, and the distance from the global best position. This involves some randomization to maintain diversity in the swarm, and certain parameters (the cognitive and social parameters) to control the influence of the personal best and global best on the new velocity.
  • Step 6. Termination check: If a termination criterion is met (such as reaching a maximum number of iterations, or achieving a sufficiently good fitness score), the algorithm stops, and the global best fitness score is returned. If the termination criterion is not met, the algorithm goes back to step 2.

4. Proposed 1D-CNN-Based Network Intrusion-Detection Model

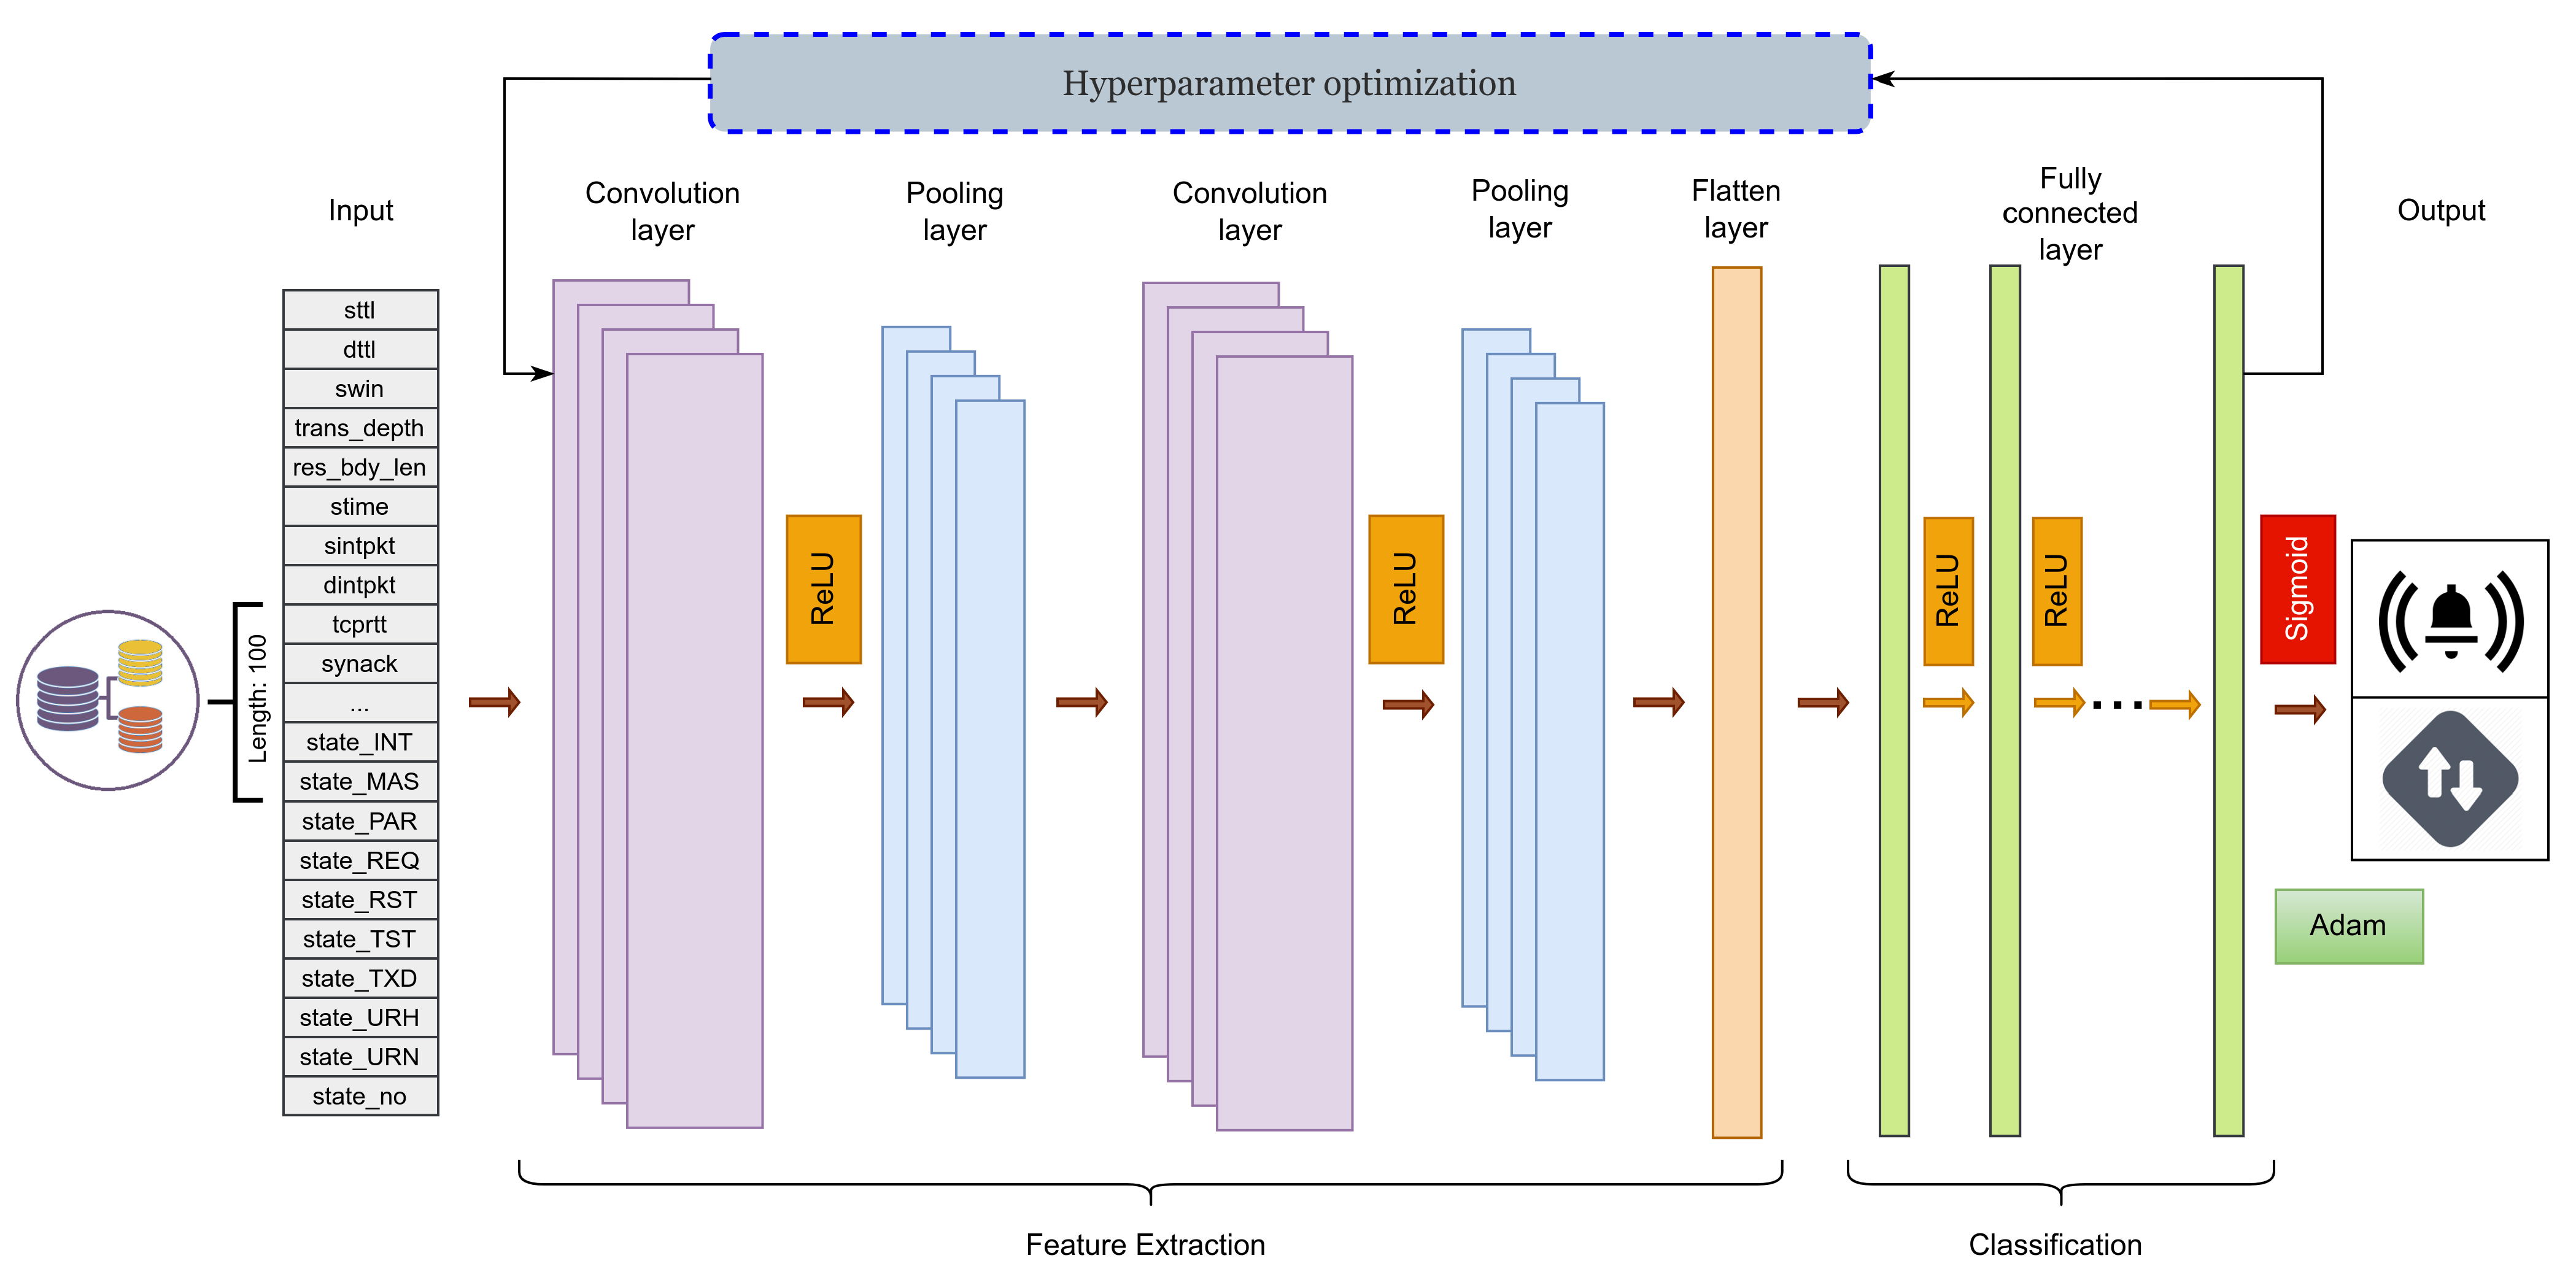
4.1. Overview of 1D-CNN Architecture

The proposed 1D-CNN model was designed with several layers, each performing a specific function in the learning process. Figure 3 presents an overview of this architecture.
(1) Input Layer. The input layer receives the input data, which is typically a 1D sequence of features. In our case, the input shape is specified as (sequence_length, 1), where “sequence_length” represents the length of the input sequence, and “1” signifies that we have a single feature for each element in the sequence.
(2) Convolutional Layers (Conv1D). The second part of our model consists of two 1D convolution layers, which are essential for extracting local features from the input sequences. The first layer receives the input sequence and applies a convolution operation using a set of learnable filters. Each filter slides over the input sequence and computes the dot products of the filter and sequence window, outputting a new feature map. The number of filters and size of the kernel (i.e., the length of the filter) are both hyperparameters that must be optimized. A larger number of filters enables the model to extract a broader range of features, and different kernel sizes allow the model to recognize patterns of varying lengths in the sequence.
(3) MaxPooling Layers (MaxPooling1D). After each convolution layer, we use a max pooling layer. These layers perform downsampling along the temporal dimension of the sequence, thereby reducing the dimensionality of the feature maps while retaining the most important information. A specific operation obtains the maximum value over a window with a specified pooling size. Similar to the convolution layers, the pooling size is a hyperparameter that must be optimized.
(4) Flatten Layer. After the sequence passes through the convolution and pooling layers, we apply a flattened layer to reshape the two-dimensional feature maps into a 1D vector. This layer is crucial for connecting the convolution layers with the dense layers, as the latter require input in this format.
(5) Dense Layers (Fully Connected Layers). Next in the sequence are the dense layers. These layers are fully connected neural network layers, in which each neuron is connected to every neuron in the previous layer. These layers perform higher-level reasoning on the features extracted by the convolution layers. We use a variable number of dense layers with varying numbers of neurons in each layer, both of which are hyperparameters for optimization. Each dense layer uses the rectified linear unit (ReLU) activation function to introduce nonlinearity into the model.
(6) Dropout Layers. To mitigate overfitting, we incorporate dropout layers after each dense layer. These layers randomly set a fraction of the input neurons to zero at each update during training, which helps prevent overfitting. The dropout rate is another hyperparameter that must be optimized.
(7) Output Layer. The final layer in our model is the output layer, which uses a sigmoid activation function to generate a probability output for the binary classification task. The output of this layer can be interpreted as the probability of the positive class [14].
Following the architectural configuration of the model, the learning process is guided by three additional hyperparameters: the learning rate, batch size, and number of epochs. The learning rate, which is pivotal for model training, determines the magnitude of the change applied to the model parameters with each update and directly influences the convergence speed and efficiency. The batch size, which defines the number of training samples utilized in a single iteration, balances the trade-off between the computational efficiency and quality of the learned model parameters. The number of epochs represents the number of complete passes through the entire dataset and ensures that the model is neither underfit nor overfit. These hyperparameters require delicate tuning for achieving optimal model performance. Our model is dynamically constructed based on the hyperparameters selected, which allows the architecture to adapt to the best structure for the given dataset and task.

4.2. Hyperparameter Optimization Problem of the 1D-CNN Model Training

The hyperparameter optimization problem of the 1D-CNN model for an intrusion-detection system (IDS) can be formulated as below:
OPT:
x * = arg max x ϕ ( x )
Subject to constraints:
x 1 { 16 , 32 , 64 , 128 , 256 } ,
x 2 { 3 , 5 , 7 , 9 , 11 } ,
2 < x 3 < 6 ,
1 < x 4 < 5 ,
x 5 { 16 , 32 , 64 , 128 , 256 } ,
0.1 < x 6 < 0.5 ,
1 × 10 5 < x 7 < 1 × 10 2
x 8 { 16 , 32 , 64 , 128 , 256 } ,
10 x 9 100 ,
where the fitness function ϕ () as the objective function measures the performance of the 1D-CNN model that is often the classification accuracy or a similar metric (such as F1-score, especially if the classes are imbalanced) for the input x = [ x 1 , x 2 , x 3 , x 4 , x 5 , x 6 , x 7 , x 8 ] ; x 1 is number of filters, x 2 is kernel size, x 3 is pooling size, x 4 is number of dense layers, x 5 is number of neurons in dense layers, x 6 is dropout rate and x 7 is learning rate, x 8 is batch size, and x 9 is number of epochs. We solve this combinatoric problem with sets of integer variables and real number variables, NP-hard using meta-hueristic algorithms, and GA and PSO.

4.2.1. GA Algorithm for Hyperparameter Optimization

In this section, we explain the GA-based hyperparameter optimization procedure, where P represents the population of solutions (i.e., set of hyperparameters for the 1D-CNN model) and G represent the maximum number of generations.
Below, we enumerate the steps involved in utilizing a GA for the optimization of 1D-CNN model hyperparameters:
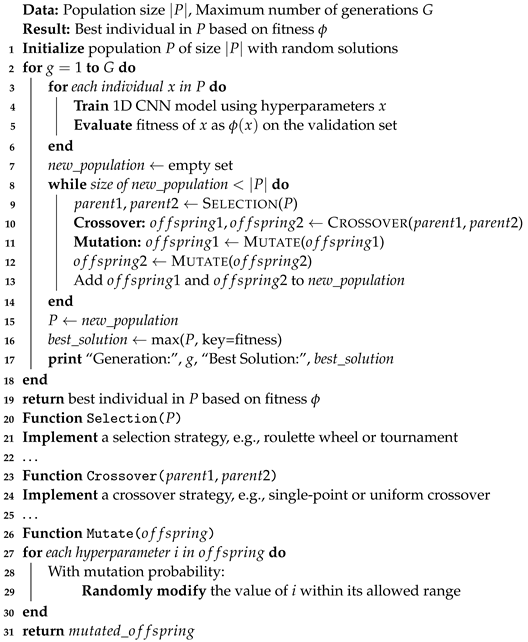
  • Initialization: Generate an initial population P 0 of size | P | with random solutions within the constraints.
  • Evaluation: For each individual x in the population P, compute its fitness ϕ ( x ) by training and validating the 1D-CNN model using the hyperparameters x .
  • Selection: Select individuals from P to be parents based on their fitness scores. Methods include roulette wheel selection, tournament selection, etc.
  • Crossover: Perform crossover on pairs of parents to produce offspring. This involves mixing the hyperparameters from two parents to produce one or more offspring.
  • Mutation: Apply mutation on offspring with a certain probability. This involves randomly changing some hyperparameters within their allowable range.
  • Replacement: Update the population by replacing less fit individuals with the offspring.
  • Termination: If a stopping criterion (such as reaching G generations or achieving a desired fitness) is met, return the individual with the highest fitness. Otherwise, go back to the Evaluation step.
In the context of hyperparameter tuning for a 1D-CNN model, the “population’’ within the framework of the GA comprises a set of models differentiated by distinct hyperparameter values. Algorithm 1 presents the pseudocode for implementing the GA within the scope of hyperparameter tuning [15]. This helps understand the procedural flow of the algorithm and its effectiveness in determining the optimal hyperparameter configurations for a 1D-CNN model.
This pseudo code gives a high-level idea of the optimization process. For a real-world application, we will need to dive deeper into specifics, such as the following:
  • Defining the appropriate initialization method to ensure diverse solutions in the initial population.
  • Deciding on the selection strategy (e.g., roulette wheel, tournament).
  • Choosing and implementing a crossover method (e.g., single-point, uniform).
  • Setting the mutation probability and method.
  • Ensuring hyperparameter constraints are always maintained.
  • Handling convergence criteria and early stopping, if desired.
This mathematical model and procedure gives a systematic way to represent the problem of optimizing 1D-CNN hyperparameters for IDS using GA. Practical implementation would require specifying the ranges for each hyperparameter, selecting suitable GA operators, and testing for convergence and performance.
Algorithm 1: Optimizing 1D CNN hyperparameters for IDS using GA.
Mathematics 11 03724 i001

4.2.2. PSO Algorithm for Hyperparameter Optimization

The hyperparameter optimization procedure based on the PSO algorithm is described below, where the S represents the swarm of particles (i.e., set of hyperparameters for the 1D-CNN model) and each particle p i has a position in the hyperparameter space representing a solution, and a velocity which dictates how its position will be updated. The p b e s t i is the personal best position of particle i (i.e., the set of hyperparameters that gave the best fitness for that particle). The g b e s t is the global best position among all particles in the swarm.
In the hyperparameter optimization of a 1D-CNN model, the term “swarm’’ in the PSO approach signifies a collection of models characterized by unique hyperparameter configurations. Algorithm 2 outlines the PSO algorithm for hyperparameter tuning. It depicts the algorithmic procedure and underlines its efficacy in identifying the most suitable hyperparameter arrangement for a 1D-CNN model. We outline the sequential steps of the PSO method for 1D-CNN hyperparameter optimization below:
  • Initialization: Randomly initialize each particle’s position x and velocity v within the bounds of the hyperparameter space.
  • Evaluation: For each particle p i in the swarm S, compute its fitness ϕ ( x ) by training and validating the 1D-CNN model using the hyperparameters represented by its position x .
  • Update Personal Best: If the current position of a particle has a better fitness than its personal best position p b e s t i , update p b e s t i with the current position.
  • Update Global Best: If any particle’s personal best position p b e s t i has a better fitness than the current global best position g b e s t , update g b e s t with p b e s t i .
  • Update Velocities and Positions: For each particle:
    • Update its velocity v using its current velocity, the difference between its personal best position p b e s t i and its current position, and the difference between the global best position g b e s t and its current position.
    • Update its position x based on the updated velocity v .
  • Termination: If a stopping criterion (e.g., reaching a maximum number of iterations or achieving a desired fitness) is met, return the global best position g b e s t as the best set of hyperparameters. Otherwise, go back to the Evaluation step.
Notes:
  • The function evaluate_fitness() would involve training the 1D CNN model on the training set with the given hyperparameters and evaluating its performance on the validation set.
  • The procedure’s logic focuses on maximizing the fitness value (i.e., performance metric such as accuracy or F1-score). Adjustments would be needed if a different optimization direction is required.
  • Specifics such as the initialization ranges, inertia weight adjustments, and other hyperparameters would need fine-tuning for a real-world application.
This mathematical model and procedure describes the PSO approach for optimizing hyperparameters for a 1D-CNN model used in IDS.
Algorithm 2: PSO for Hyperparameter Optimization.
Mathematics 11 03724 i002

4.2.3. Time and Space Complexity Analysis

Both GAs and PSO represent epitomes of heuristic search strategies. At their core, they deal with a collection of entities—be it chromosomes or particles. Let us juxtapose their computational footprints in time and space by drawing parallels in their operations.
Time complexity analysis:
The time complexity of a GA mainly depends on the size of the population, the number of generations, and the complexity of the fitness function. The time complexity of the PSO algorithm mainly hinges upon the number of particles in the swarm, the number of iterations the algorithm runs for, and the complexity of evaluating the fitness function (or objective function) for each particle [16]. As we are using the GA and PSO to tune hyperparameters for a 1D-CNN model, the fitness function involves training a model, which is generally time-consuming.
  • Initialization: For both GA and PSO, the initial setup involves generating a collection of entities.
    For GA, it is about establishing a set of chromosomes.
    For PSO, it means setting initial positions and velocities for particles.
    Complexity: O ( P × D ) where P denotes population (or swarm) size, and D represents the dimensionality (or chromosome length).
  • Evaluation: The process of evaluating the quality of each entity in the population:
    In GA, it is the fitness evaluation for each chromosome.
    In PSO, it is assessing the objective function for particle positions.
    Complexity: O ( P × T ) where T symbolizes the individual evaluation complexity.
  • Update Mechanisms: The processes of evolution or movement:
    In GA, this captures selection, crossover, and mutation operations.
    In PSO, it is about updating particle positions and velocities based on personal and global bests.
    Complexity: O ( P × D ) for both.
Aggregating the above segments, the time complexity per iteration or generation for both algorithms becomes O ( P × ( D + T ) ) . Over I iterations or generations, this amounts to O ( I × P × ( D + T ) ) .
Space complexity analysis:
Both algorithms need memory space to store the current state of their entities.
  • In GA, this relates to the chromosomes’ information.
  • In PSO, it is about particle positions, velocities, and personal bests.
Complexity: O ( P × D ) for both.
At a high level, GAs and PSO exhibit a harmonious dance of computational complexity, governed predominantly by the size of their populations and the intrinsic nature of the problems they address. By breaking down their operations into initialization, evaluation, and update steps, we discern the symmetries and shared principles underpinning these eminent optimization strategies.

4.3. Dataset Description

We selected three diverse datasets based on their complexity, scope, and relevance in the field of network intrusion detection (Figure 4). Each dataset was selected to present our model with various intrusion-detection scenarios, thereby ensuring a comprehensive assessment of the proposed 1D-CNN-based NIDS.
The University of New South Wales in Australia developed the UNSW-NB15 dataset in collaboration with the Cyber Range Lab of the Australian Centre for Cyber Security (ACCS) [17]. This dataset was created to solve the lack of comprehensive datasets for NIDSs. The UNSW-NB15 dataset contains a new set of network traffic features along with a wide range of contemporary attack categories, making it suitable for evaluating our hyperparameter optimization strategy. It comprises various modern attack types, including fuzzers, analysis, backdoors, denial-of-service (DoS), exploits, generic, reconnaissance, shellcode, and worms. All samples from the UNSW-NB15 dataset were used in our experiments.
The Canadian Institute for Cybersecurity (CIC) developed the CIC-IDS2017 dataset [18]. This comprehensive dataset includes a wide range of attacks, such as brute force, Heartbleed, Botnet, DoS, DDoS, web attacks, and infiltration. It contains labeled data for different types of network intrusions and is extremely useful for the training and testing of our model. The exhaustive feature set of CIC-IDS2017 is suitable for evaluating the robustness of our hyperparameter optimization approach.
NSL-KDD is a refined version of the widely used KDD Cup 1999 dataset, designed to address some of the inherent issues with the KDD’99 dataset, such as redundant and duplicate records [19]. This dataset contains a mixture of intrusions and normal connections and includes basic features derived from the packet headers as well as content features computed from the payloads of the initial packets and traffic features computed from a two-second time window. This combination of features makes NSL-KDD an excellent dataset for evaluating the efficacy of our 1D-CNN model. The attack types in the NSL-KDD dataset are divided into four main categories: DoS (Denial-of-Service), R2L (unauthorized access from a remote machine), U2R (unauthorized access to local superuser (root) privileges), and Probe (aurveillance and other probing).

4.4. Data Preprocessing

An essential component of our research is the rigorous data preprocessing step. The quality of the data and usefulness of its features directly affect the performance of our model [20]. Therefore, the dataset is first subjected to a null-value check to ensure that it does not contain missing values, which can skew our results or cause errors during model training. We perform a correlation analysis to prevent multicollinearity and minimize redundancy in our model. We compute a correlation matrix of our features and exclude any features with a correlation value greater than 0.95 with other features. This process is important to ensure that each feature contributes unique information to our model. Subsequently, we engage in feature engineering, a process that involves creating new features or modifying the existing features, to improve the model performance. We combine “sbytes’’ and “dbytes’’ to create a new feature: “network_bytes’’. This new feature aims to offer a more comprehensive perspective on network traffic. Next, we exclude irrelevant features, such as “srcip’’, “sport’’, “dstip’’, “dsport’’, and “attack_cat’’, from our specific use case, because they do not contribute to the specific binary classification task. The numerical features are standardized to ensure a uniform scale. By transforming these features to have a mean of 0 and standard deviation of 1, we ensure that any potential bias owing to differing feature magnitudes is eliminated. One-hot encoding is applied to the categorical variables “proto’’, “service’’, and “state’’, producing a total of 197 features. This transformation is necessary because ML algorithms require their input data to be numerical; one-hot encoding effectively satisfies this requirement while preserving categorical information. Chi-square statistical testing is used to identify the top 100 features for inclusion in the model, which helps focus on the learning process of the model and eliminates any noise or irrelevant information that may be present in the data. Finally, the processed dataset is split into training, validation, and testing sets in a ratio of 70:10:20. This strategy allows for rigorous assessment and tuning of the model’s performance on unseen data while ensuring that the model is trained well and validated on a substantial portion of the dataset.
In our experiments, we employ the entire CIC-IDS2017 dataset, which requires a unique set of preprocessing steps. The first step involves transforming the labels in the dataset, denoted by the “Label’’ column. We map “BENIGN’’ entries to 0 and all other entries to 1, representing various types of intrusions. This binary classification approach is a simplification that facilitates more straightforward model training and interpretation. Subsequently, we identify several features that are deemed irrelevant or unhelpful in our analysis. Features, such as “Bwd PSH Flags’’, “Bwd URG Flags’’, “Fwd Avg Bytes/Bulk’’, “Fwd Avg Packets/Bulk’’, “Fwd Avg Bulk Rate’’, “Bwd Avg Bytes/Bulk’’, “Bwd Avg Packets/Bulk’’, and “Bwd Avg Bulk Rate’’, are dropped from our dataset. We check and remove duplicate entries from the dataset to ensure the uniqueness of each data point for model training. This process helps prevent overfitting and bias toward repeated entries. The dataset is inspected for null, infinite, and NaN values. Any row containing these entries is excluded. This step is crucial for maintaining the integrity of the dataset and ensuring that no erroneous or incomplete data disrupt the learning process. Subsequently, we split the cleaned dataset into three parts: 70% for training, 10% for validation, and 20% for testing. This split helps us train, fine-tune, and test our model. In the final step, we apply feature scaling, which helps standardize the feature set to a standard Gaussian distribution with mean 0 and standard deviation 1. This accelerates the training process and helps avoid the dominance of features with larger values.
The third dataset used in this study is the NSL-KDD dataset. Similarly to the previous two datasets, this dataset undergoes a series of preprocessing steps to ensure optimal performance when fed to our model. Initially, we modify the labels in the dataset, converting “normal’’ entries to 0 and all other entries to 1, indicating various forms of intrusions. This binary classification simplifies the model training and the subsequent interpretation of results. Next, we identify the “num_outbound_cmds’’ feature, which has only a single unique value. In the context of ML, such a feature does not contribute valuable information for classification; hence, we exclude it from the dataset. In addition, the dataset is inspected for duplicate entries, which are removed to maintain data integrity and prevent bias toward repeated entries. The dataset has three categorical features: “protocol_type’’, “service’’, and “flag’’. To prepare these for our ML model, we first encode them in numerical form using the LabelEncoder function. Subsequently, we apply the OneHotEncoding function to these encoded features, effectively transforming each category value into a new column and assigning a binary value of 1 or 0. Each of these newly generated binary features indicates the presence or absence, respectively, of the respective category values in the original data record. A significant component of our preprocessing involves feature selection, specifically, using the SelectKBest function with the chi2 score function to select the top 100 features. This is a common practice in ML to reduce dimensionality and focus the model learning on the most influential features. Subsequently, we divide our processed dataset into training, validation, and testing subsets in a ratio of 70:10:20. Such a division is critical for model validation and evaluating the model’s ability to generalize its learning to new, unseen data. Finally, we apply feature scaling to all subsets. This step ensures that no particular feature dominates the others owing to differences in scale, providing an even playing field for all features during the model’s learning process. This facilitates faster model training and aids in preventing any single feature from unduly influencing the learning process owing to its larger scale. Such approaches to data preprocessing are recommended for similar ML applications to produce reliable, robust, and interpretable results.

5. Experiments and Results

The proposed model was built using the Python programming language with the Keras library (Table 4), which is a user-friendly neural network library [21] built on top of TensorFlow (https://github.com/TATU-hacker/NIDS-1D_CNN-GA_PSO.git (accessed on 1 July 2023)).

5.1. Evaluation Metrics

To evaluate the performance of our hyperparameter-optimized 1D-CNN-based network intrusion-detection model, we used a metric combination of precision, recall, F1-score, and accuracy. These four metrics provide a comprehensive picture of the effectiveness of our model in correctly identifying network intrusions with a low rate of false positives and negatives.
Precision: Ratio of correctly predicted positive observations to the total number of predicted positive observations. A high precision is associated with a low false-positive rate. We can represent precision as
P r e c i s i o n = T P T P + F P .
Recall (Sensitivity): The ratio of correctly predicted positive observations to all observations in an actual class. A high recall is associated with a low false-negative rate. The formula for recall is as follows:
R e c a l l = T P T P + F N .
F1-Score: The harmonic mean of precision and recall. It attempts to achieve a balance between precision and recall. An F1-score is considered perfect when it is 1, whereas the model is considered a failure when it is 0. The formula for the F1-score is
F 1 S c o r e = 2 ( R e c a l l P r e c i s i o n ) ( R e c a l l + P r e c i s i o n ) .
Accuracy: The most intuitive performance measure. This is simply the ratio of correctly predicted observations to the total number of observations. The formula for accuracy is as follows:
A c c u r a c y = T P + T N T P + T N + F P + F N .
Collectively, these metrics provide a comprehensive measure of the model’s performance. While accuracy shows the overall correctness of the model, precision and recall provide insights into the model’s capability to minimize false positives and negatives. The F1-score provides a balance between precision and recall. These metrics are crucial for network intrusion detection. A high precision indicates that our model correctly identifies actual intrusions, thereby reducing the risk of false alarms (false positives). A high recall ensures that the system detects most intrusions, thereby reducing the risk of missed threats (false negatives). The F1-Score is the metric that balances these factors.

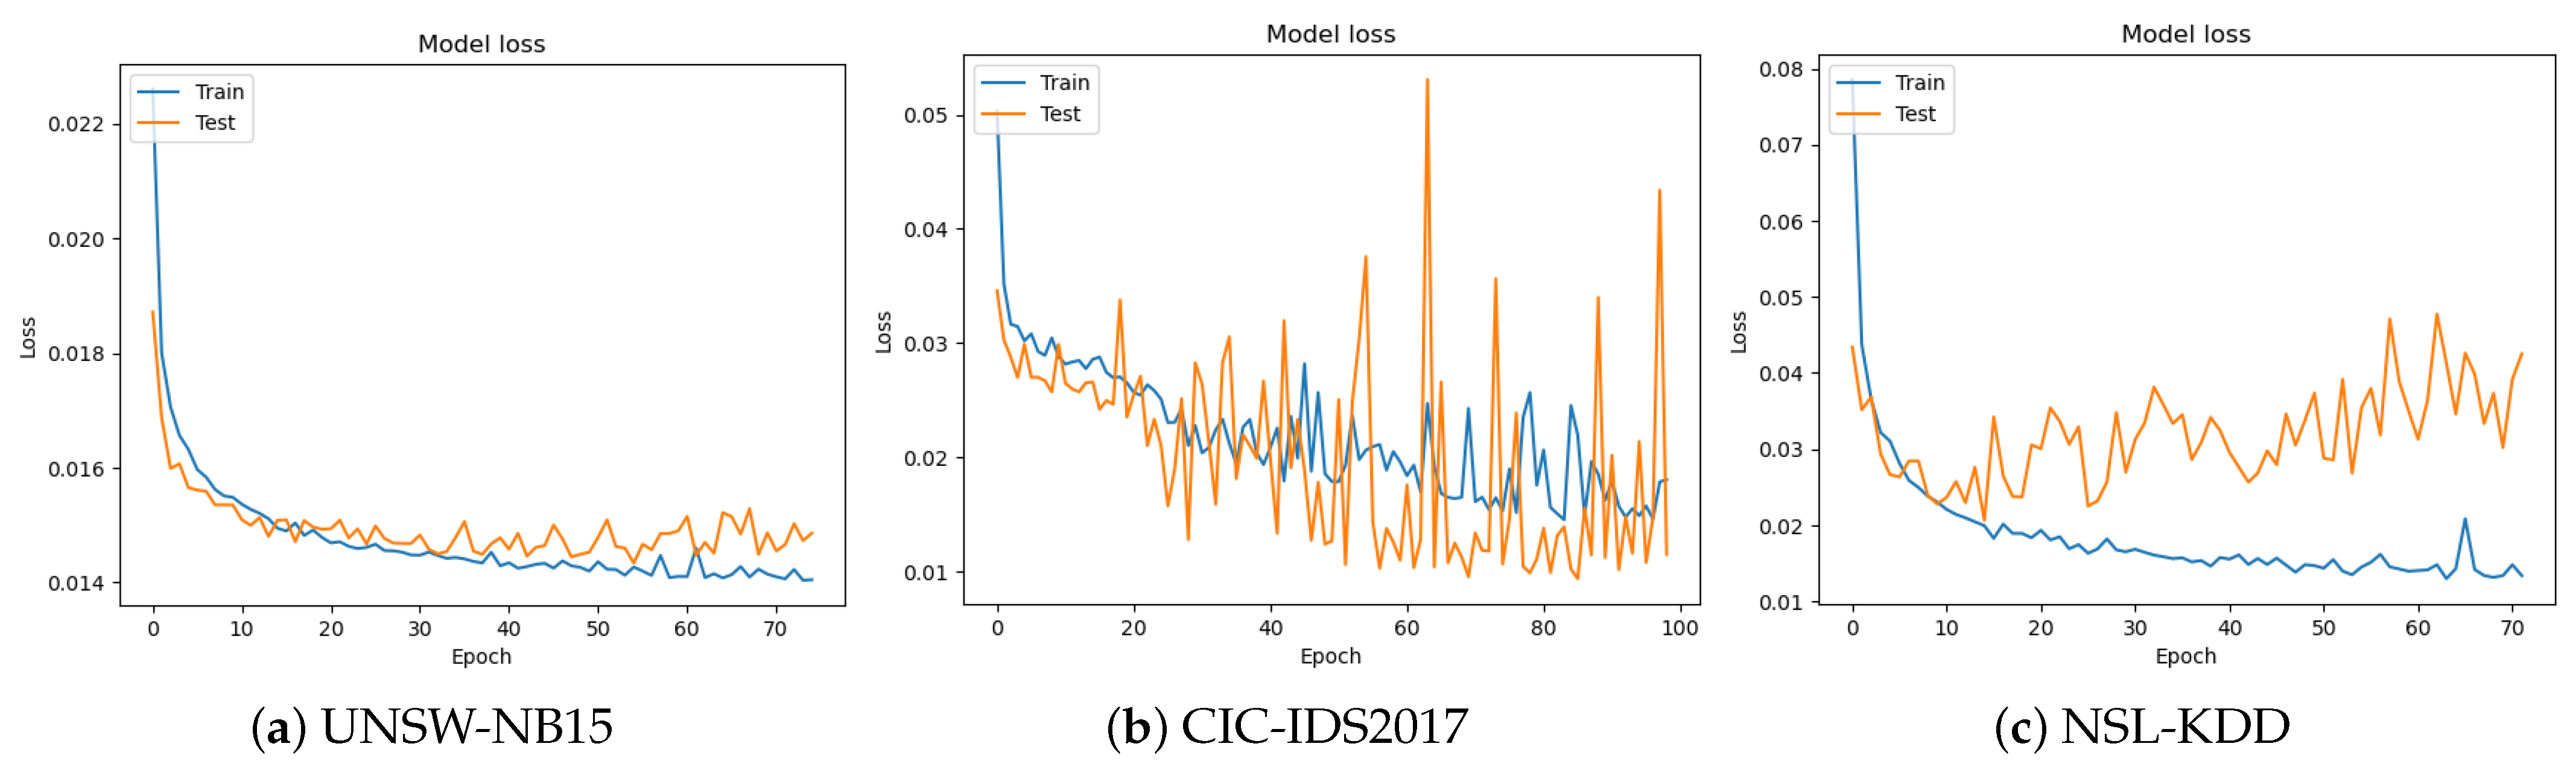
5.2. Optimizing Hyperparameters Using GA

In our experimental setup, we initialize a GA with a population size of 20 and set it to run for 10 generations to optimize the hyperparameters for a 1D-CNN model. The mutation rate is fixed at 0.1, and the crossover rate is defined as 0.5. The GA first generates an initial population of random hyperparameters for the CNN model. These parameters include the number of filters, kernel size, pooling size, number of dense layers, number of neurons in dense layers, dropout rate, learning rate, batch size, and number of epochs. For each generation, the algorithm assesses the fitness of each individual in the population. This fitness is determined by the validation accuracy achieved by a CNN model trained with a given individual’s hyperparameters. The selection process then selects parents for the subsequent generation based on their fitness scores; individuals with a higher fitness have a higher probability of being selected. The number of parents is determined using the crossover rate. The crossover phase generates offspring from the selected parents. For each parent pair, offspring are created by randomly selecting each parameter from the parent. To maintain diversity in the population, the algorithm introduces random mutations. For each parameter of each offspring, a probability is defined by the mutation rate, which is replaced by a randomly generated value. Finally, the algorithm replaces the worst-performing individuals in the population, defined as those with the lowest fitness scores, with the newly generated offspring. This process repeats for a predetermined number of generations. Upon completing the GA’s run, the hyperparameters of the individual with the highest fitness score are selected as the best parameters (Table 5).
Subsequently, we create and train a 1D-CNN model using these parameters. The training process involves fitting the model to the training data, followed by validation against the validation dataset. Finally, we evaluate the model performance using a separate test dataset. Table 6 and Figure 5 and Figure 6 present the results.
The model demonstrates remarkable performance on all three datasets:
  • On the UNSW-NB15 dataset, the model achieves an accuracy of 99.31% with a loss of 1.44.
  • On the CIC-IDS2017 dataset, the model achieves a higher accuracy of 99.71% with a lower loss of 1.15.
  • On the NSL-KDD dataset, the model achieves an accuracy of 99.63% with a loss of 1.78.
The high-accuracy scores indicate the efficacy of GA in optimizing the model’s hyperparameters, indicating the robustness and precision of our model.

5.3. Hyperparameter Optimization Using PSO

Our PSO implementation begins with a swarm of 20 particles and iterates for 10 cycles. The cognitive and social constants are set to 2. The search space boundaries for each hyperparameter are defined, following which the particles are randomly initialized within this space. The velocities of the particles are initialized to zero. A function, “ p o s i t i o n _ t o _ p a r a m s ”, is designed to convert the position of a particle to a set of CNN hyperparameters, considering the unique requirements of each hyperparameter (e.g., some should be integers and some have specific discrete choices). After initializing the personal and global best positions, the fitness of each particle is evaluated by training the CNN model using the corresponding hyperparameters and computing the validation accuracy. During each iteration, the fitness of each particle is calculated and compared with the personal and global best-fitness values. If a particle’s fitness is better than its personal or global best, the respective values are updated. The velocities and positions of the particles are then updated based on the PSO equations, using a factor of 0.5 as the inertia weight. The new position of each particle is constrained within the defined bounds for each hyperparameter. After running for a predetermined number of iterations, the PSO algorithm outputs a set of hyperparameters corresponding to the global best position, which achieves the highest validation accuracy. Table 7 lists these parameters.
After obtaining the optimal hyperparameters using the PSO process, we construct the final 1D-CNN model using these parameters. The model is trained using the training dataset for a specified number of epochs with the best batch sizes. Upon completing the training, the performance of the trained model is validated using a separate validation dataset. Finally, we evaluate the performance of the optimized model on an independent test dataset that is uninvolved in the previous stages of the model development or optimization. This dataset facilitates an unbiased performance assessment of the final model. Table 8 and Figure 7 and Figure 8 present the test performance results.
  • On the UNSW-NB15 dataset, the model achieves a loss of 1.47 and accuracy of 99.28%.
  • On the CIC-IDS2017 dataset, the model achieves a lower loss of 0.88 and higher accuracy of 99.74%.
  • On the NSL-KDD dataset, the model achieves a loss of 1.75 and accuracy of 99.52%.
This ability to maintain high accuracy across different datasets is a strong indicator of the model’s potential for real-world applications, such as intrusion detection and network security.

6. Discussion

6.1. Analysis of the Results of Models Based on GA and PSO

In this section, we present a comparative analysis of the models optimized using GA and PSO. These comparisons provide valuable insights into the effectiveness of the two optimization techniques in tuning the model hyperparameters. Table 9 presents the performance metrics of both models.
On the UNSW-NB15 dataset, the GA-optimized model achieves slightly better results in terms of the accuracy, loss, and F1-score, compared to the PSO-optimized model. Both models exhibit the same precision and recall. On the CIC-IDS2017 dataset, the PSO-optimized model slightly outperforms the GA model in terms of accuracy, loss, and F1-score, while achieving similar precision and recall. Finally, on the NSL-KDD dataset, the GA-optimized model achieves marginally better accuracy and slightly lower loss compared to the PSO model, while the precision, recall, and F1-score are similar. These results demonstrate that both the GA and PSO are effective for hyperparameter optimization in 1D-CNN models, with minor performance differences across different datasets. This indicates that both methods can reach near-optimal solutions, and choosing any one model depends on problem-specific considerations, such as computational cost and time constraints.
In cybersecurity, particularly in the context of IDSs, the ability to accurately identify attacks (intrusions) while maintaining a low false-alarm rate is vital. We further analyze the performance metrics of our GA- and PSO-based models using confusion matrices (Figure 9 and Figure 10).
On the UNSW-NB15 dataset, the GA model accurately identifies 442,273 of the 444,831 instances that are actually benign. This signifies a commendable true-negative (TN) rate. Intriguingly, the PSO model outperforms the GA by correctly classifying an additional 277 benign instances. However, for intrusion detection (true positives), the GA model performs slightly better, with 62,092 correctly identified intrusions, compared to PSO’s 61,777.
On the CIC-IDS2017 dataset, both models exhibit strong performances. The GA model correctly identifies 418,219 of 418,898 actual nonintrusive instances, and the PSO model narrowly surpasses this by identifying an additional 327 instances. When identifying intrusions, the GA model correctly classifies 84,466 instances as intrusive, whereas the PSO model precisely detects 84,314 instances. This indicates a slightly higher sensitivity of the GA model to intrusions, for the CIC-IDS2017 dataset.
On the NSL-KDD dataset, both the GA and PSO models are highly effective in identifying nonintrusions, with only minor discrepancies in their performances. Interestingly, in terms of correctly detecting intrusions, both models match perfectly, both identifying 12,359 instances.
These confusion matrices provide insights into how well our models distinguish between benign and intrusive behaviors. High counts along the diagonal (true negatives and positives) indicate an overall high accuracy. However, the delicate balance between sensitivity (true positive rate) and specificity (true negative rate) leans slightly toward the GA for intrusion detection, whereas PSO appears to be marginally superior in correctly identifying benign behavior. These findings are enlightening and will enable researchers and practitioners to make informed decisions regarding the deployment of such models in real-world cybersecurity systems.

6.2. Comparison with Existing Methods

In this section, we present a comparison of our novel models with the existing IDS schemes. We aim to illustrate the similarities and emphasize the distinctive benefits offered by our approach.
The fine-tuning of hyperparameters, which is often overlooked, can drastically improve a model’s ability to effectively detect and counter cyber intrusions. To emphasize this, we compare our models against established CNN-based IDS schemes (Table 10). Our models, fine-tuned with advanced hyperparameter-optimization techniques, such as the GA and PSO, significantly outperform their counterparts, thereby highlighting the underappreciated yet critical aspect of hyperparameter tuning in IDS models.
In addition to the traditional comparisons, we compare our GA- and PSO-optimized models with cutting-edge hybrid CNN-IDS schemes (Table 11). These state-of-the-art models typically incorporate the advantages of neural networks and classical ML methodologies to improve intrusion detection. Our models, improved by the robustness of GA and PSO, exhibit superior performance, compared to that of the hybrid models. This comparison affirms the relevance of our models in the contemporary IDS landscape and emphasizes their practical viability in addressing real-world cyber threats.
In all of these comparisons, our models consistently exhibit performances superior to that of existing methodologies, with improved precision and recall metrics across various testing scenarios. These results provide robust empirical evidence of the critical role GA and PSO play in fine-tuning IDS models for maximum efficiency and accuracy.
The inherent adaptive search capabilities of GA and PSO, derived from evolutionary mechanics and swarm behaviors, allow for efficient global optima searches, evading local minima, and ensuring parallel exploration. Furthermore, their customization potential ensures adaptability to the nuances of 1D-CNN-based NIDSs. Our empirical results underscore the method’s robustness, evidenced by its consistent outperformance across diverse datasets and its scalability, making it especially pertinent for real-world, extensive network security applications. In essence, by providing a harmonious blend of exploration and exploitation, our approach ensures comprehensive, adaptive, and efficient searches, proving critical for enhancing system security in network intrusion detection.

6.3. Strengths and Limitations

This section delves into a comprehensive analysis, highlighting the specific strengths and limitations of our models in contrast to other approaches.
The following are the strong points of our model:
  • Superior accuracy: The GA-1D-CNN and PSO-1D-CNN models demonstrated consistently high accuracy across all three datasets—UNSW-NB15, CIC-IDS2017, and NSL-KDD. Their accuracy surpassed existing models by a substantial margin, affirming the efficacy of GA and PSO in fine-tuning the models’ parameters to achieve more accurate predictions.
  • Enhanced precision and recall: Our models exhibited elevated precision and recall rates, indicating their proficiency in minimizing false positives while effectively identifying true intrusions. This ability is crucial in real-world applications, where precision and recall directly impact the effectiveness of an IDS.
  • Optimized hyperparameters: The key to our model’s success lies in the utilization of GA and PSO for hyperparameter optimization. This allows our models to fine-tune their configurations to extract the most salient features from the data, enhancing their discriminative power.
  • Robust generalization: The models showcased remarkable generalization across datasets, suggesting their ability to adapt to diverse network environments and handle varying intrusion patterns effectively.
Meanwhile, the limitations of our model are as below:
  • Computational complexity: The incorporation of GA or PSO does introduce some level of computational complexity, especially during hyperparameter optimization. While the models’ results justify the trade-off, it is essential to consider computational resources in practical deployment scenarios.
  • Domain dependency: Like most ML models, the performance of our models may depend on the specific characteristics of the datasets they are trained on. While our models demonstrated excellent results on the chosen datasets, further evaluations on different datasets may be necessary to establish their general applicability.
  • Data imbalance: Intrusion-detection datasets often suffer from class imbalance, where the number of intrusion instances is significantly lower than normal instances. While our models show resilience to this challenge, further investigations and potential techniques to address data imbalance could enhance their performance even further.

7. Conclusions

Our research aimed to improve the performance of 1D-CNNs in network intrusion detection through effective hyperparameter optimization. We focused on fine-tuning nine hyperparameters of a 1D-CNN model using two well-established evolutionary computation algorithms: GA and PSO.
Through rigorous experimentation on three prominent datasets—UNSW-NB15, CIC-IDS2017, and NSL-KDD—we demonstrated that our proposed models could significantly enhance the efficiency of 1D-CNNs in identifying network intrusions. Our findings reaffirmed that appropriate hyperparameter optimization could produce substantial improvements in model performance, thereby cementing its critical role in DL models for network intrusion detection.
By implementing GA- and PSO-based hyperparameter optimization, we observed a notable enhancement in the model’s detection accuracy and reduction in false-positive rates, compared to the original CNN models with default hyperparameters. However, the precise amount of improvement was not uniform across the datasets and was influenced by the nature of the data and type of attack in each dataset. Evidently, no universally superior method existed between GA and PSO because the most effective algorithm varied according to the dataset. Therefore, the choice of the optimization method had to be context-specific, emphasizing the need for a comprehensive understanding of the target datasets.
We expect these findings to serve as stepping stones for future research in this area. Future work can investigate a broader range of optimization algorithms or explore the potential of multiobjective optimization to enhance the model performance. Additionally, considering the continuous development of cyber threats, experiments on more recent and diverse datasets would be highly valuable for ensuring the robustness and adaptability of 1D-CNN-based IDSs.
This research contributes to the evolving field of network security by providing a pathway for optimizing DL algorithms for IDSs. Thus, it aids in creating more resilient and adaptable security systems capable of countering the increasingly sophisticated and evolving cyber threats of the digital age.

Author Contributions

This manuscript was designed and written by W.K. and D.K. W.K. conceived the main idea of this study. D.K. wrote the programs and conducted all experiments. W.K. and D.K. contributed to the analysis and discussion of the algorithms and results. All authors have read and agreed to the published version of the manuscript.

Funding

This research was funded by the Gachon University Research Fund (GCU-202110230001) and Basic Science Research Program through the National Research Foundation of Korea (NRF) funded by the Ministry of Science and ICT (2022R1F1A1074767).

Data Availability Statement

Not applicable.

Conflicts of Interest

The authors declare no conflict of interest.

References

  1. Ahmad, I.; Ul Haq, Q.E.; Imran, M.; Alassafi, M.O.; AlGhamdi, R.A. An Efficient Network Intrusion Detection and Classification System. Mathematics 2022, 10, 530. [Google Scholar] [CrossRef]
  2. Mohammadpour, L.; Ling, T.C.; Liew, C.S.; Aryanfar, A. A Survey of CNN-Based Network Intrusion Detection. Appl. Sci. 2022, 12, 8162. [Google Scholar] [CrossRef]
  3. Desta, A.K.; Ohira, S.; Arai, I.; Fujikawa, K. Rec-CNN: In-vehicle networks intrusion detection using convolutional neural networks trained on recurrence plots. Veh. Commun. 2022, 35, 100470. [Google Scholar] [CrossRef]
  4. Sheraz, N.; Yasir, S. Enhanced Network Intrusion Detection using Deep Convolutional Neural Networks. KSII Trans. Internet Inf. Syst. 2018, 12, 5159–5178. [Google Scholar] [CrossRef]
  5. Selvarajan, P.; Salman, R.; Ahamed, S.; Jayasuriya, P. Networks Intrusion Detection Using Optimized Hybrid Network. In Proceedings of the 2023 International Conference on Smart Computing and Application (ICSCA), Hail, Saudi Arabia, 5–6 February 2023; pp. 1–6. [Google Scholar] [CrossRef]
  6. Kanna, R.P.; Santhi, P. Unified Deep Learning approach for Efficient Intrusion Detection System using Integrated Spatial–Temporal Features. Knowl.-Based Syst. 2021, 226, 107132. [Google Scholar] [CrossRef]
  7. Zhao, X.; Su, H.; Sun, Z. An Intrusion Detection System Based on Genetic Algorithm for Software-Defined Networks. Mathematics 2022, 10, 3941. [Google Scholar] [CrossRef]
  8. Yang, L.; Shami, A. A Transfer Learning and Optimized CNN Based Intrusion Detection System for Internet of Vehicles. In Proceedings of the ICC 2022—IEEE International Conference on Communications, Foshan, China, 11–13 August 2022; pp. 2774–2779. [Google Scholar] [CrossRef]
  9. Chen, Y.; Lin, Q.; Wei, W.; Ji, J.; Wong, K.C.; Coello, C.A. Intrusion detection using multi-objective evolutionary convolutional neural network for Internet of Things in Fog computing. Knowl.-Based Syst. 2022, 244, 108505. [Google Scholar] [CrossRef]
  10. Ragab, M.; Sabir, F. Outlier detection with optimal hybrid deep learning enabled intrusion detection system for ubiquitous and smart environment. Sustain. Energy Technol. Assess. 2022, 52, 102311. [Google Scholar] [CrossRef]
  11. Yan, F.; Zhang, G.; Zhang, D.; Sun, X.; Hou, B.; Yu, N. TL-CNN-IDS: Transfer learning-based intrusion detection system using convolutional neural network. J. Supercomput. 2023, 242. [Google Scholar] [CrossRef]
  12. Okey, O.D.; Melgarejo, D.C.; Saadi, M.; Rosa, R.L.; Kleinschmidt, J.H.; Rodríguez, D.Z. Transfer Learning Approach to IDS on Cloud IoT Devices Using Optimized CNN. IEEE Access 2023, 11, 1023–1038. [Google Scholar] [CrossRef]
  13. El-Ghamry, A.; Darwish, A.; Hassanien, A.E. An optimized CNN-based intrusion detection system for reducing risks in smart farming. Internet Things 2023, 22, 100709. [Google Scholar] [CrossRef]
  14. Rosay, A.; Riou, K.; Carlier, F.; Leroux, P. Multi-layer perceptron for network intrusion detection: From a study on two recent data sets to deployment on automotive processor. Ann. Telecommun. 2022, 77, 371–394. [Google Scholar] [CrossRef]
  15. Obeidat, A.; Yaqbeh, R. Smart Approach for Botnet Detection Based on Network Traffic Analysis. J. Electr. Comput. Eng. 2022, 2022, 3073932. [Google Scholar] [CrossRef]
  16. Zhang, X.; Zou, D.; Shen, X. A Novel Simple Particle Swarm Optimization Algorithm for Global Optimization. Mathematics 2018, 6, 287. [Google Scholar] [CrossRef]
  17. Moustafa, N.; Slay, J. UNSW-NB15: A comprehensive data set for network intrusion detection systems (UNSW-NB15 network data set). In Proceedings of the 2015 Military Communications and Information Systems Conference (MilCIS), Canberra, Australia, 10–12 November 2015; pp. 1–6. [Google Scholar] [CrossRef]
  18. Sharafaldin, I.; Habibi Lashkari, A.; Ghorbani, A.A. Toward Generating a New Intrusion Detection Dataset and Intrusion Traffic Characterization. In Proceedings of the 4th International Conference on Information Systems Security and Privacy—ICISSP, Funchal, Portugal, 22–24 January 2018; pp. 108–116. [Google Scholar] [CrossRef]
  19. Tavallaee, M.; Bagheri, E.; Lu, W.; Ghorbani, A.A. A detailed analysis of the KDD CUP 99 data set. In Proceedings of the 2009 IEEE Symposium on Computational Intelligence for Security and Defense Applications, Ottawa, ON, Canada, 8–10 July 2009; pp. 1–6. [Google Scholar] [CrossRef]
  20. Gautam, S.; Henry, A.; Zuhair, M.; Rashid, M.; Javed, A.R.; Maddikunta, P.K.R. A Composite Approach of Intrusion Detection Systems: Hybrid RNN and Correlation-Based Feature Optimization. Electronics 2022, 11, 3529. [Google Scholar] [CrossRef]
  21. Preuveneers, D.; Rimmer, V.; Tsingenopoulos, I.; Spooren, J.; Joosen, W.; Ilie-Zudor, E. Chained Anomaly Detection Models for Federated Learning: An Intrusion Detection Case Study. Appl. Sci. 2018, 8, 2663. [Google Scholar] [CrossRef]
  22. Potluri, S.; Ahmed, S.; Diedrich, C. Convolutional Neural Networks for Multi-class Intrusion Detection System. In Proceedings of the Mining Intelligence and Knowledge Exploration, Cluj-Napoca, Romania, 20–22 December 2018; Groza, A., Prasath, R., Eds.; Springer International Publishing: Cham, Switzerland, 2018; pp. 225–238. [Google Scholar] [CrossRef]
  23. Azizjon, M.; Jumabek, A.; Kim, W. 1D CNN based network intrusion detection with normalization on imbalanced data. In Proceedings of the 2020 International Conference on Artificial Intelligence in Information and Communication (ICAIIC), Fukuoka, Japan, 19–21 February 2020; pp. 218–224. [Google Scholar] [CrossRef]
  24. Gamal, M.; Abbas, H.M.; Moustafa, N.; Sitnikova, E.; Sadek, R.A. Few-Shot Learning for Discovering Anomalous Behaviors in Edge Networks. Comput. Mater. Contin. 2021, 69, 1823–1837. [Google Scholar] [CrossRef]
  25. Al-Turaiki, I.; Altwaijry, N. A Convolutional Neural Network for Improved Anomaly-Based Network Intrusion Detection. Big Data 2021, 9, 233–252. [Google Scholar] [CrossRef]
  26. Mohammadpour, L.; Ling, T.C.; Liew, C.S.; Aryanfar, A. A mean convolutional layer for intrusion detection system. Secur. Commun. Netw. 2020, 2020, 8891185. [Google Scholar] [CrossRef]
  27. Aldarwbi, M.Y.; Lashkari, A.H.; Ghorbani, A.A. The sound of intrusion: A novel network intrusion detection system. Comput. Electr. Eng. 2022, 104, 108455. [Google Scholar] [CrossRef]
  28. Qazi, E.U.H.; Almorjan, A.; Zia, T. A One-Dimensional Convolutional Neural Network (1D-CNN) Based Deep Learning System for Network Intrusion Detection. Appl. Sci. 2022, 12, 7986. [Google Scholar] [CrossRef]
  29. Ding, Y.; Zhai, Y. Intrusion detection system for NSL-KDD dataset using convolutional neural networks. In Proceedings of the 2018 2nd International Conference on Computer Science and Artificial Intelligence, Shenzhen, China, 8–10 December 2018; pp. 81–85. [Google Scholar] [CrossRef]
  30. Zhang, X.; Ran, J.; Mi, J. An Intrusion Detection System Based on Convolutional Neural Network for Imbalanced Network Traffic. In Proceedings of the 2019 IEEE 7th International Conference on Computer Science and Network Technology (ICCSNT), Dalian, China, 19–20 October 2019; pp. 456–460. [Google Scholar] [CrossRef]
  31. Verma, A.K.; Kaushik, P.; Shrivastava, G. A Network Intrusion Detection Approach Using Variant of Convolution Neural Network. In Proceedings of the 2019 International Conference on Communication and Electronics Systems (ICCES), Coimbatore, India, 17–19 July 2019; pp. 409–416. [Google Scholar] [CrossRef]
  32. Li, Y.; Xu, Y.; Liu, Z.; Hou, H.; Zheng, Y.; Xin, Y.; Zhao, Y.; Cui, L. Robust detection for network intrusion of industrial IoT based on multi-CNN fusion. Measurement 2020, 154, 107450. [Google Scholar] [CrossRef]
  33. Yang, H.; Wang, F. Wireless Network Intrusion Detection Based on Improved Convolutional Neural Network. IEEE Access 2019, 7, 64366–64374. [Google Scholar] [CrossRef]
  34. Khan, R.U.; Zhang, X.; Alazab, M.; Kumar, R. An Improved Convolutional Neural Network Model for Intrusion Detection in Networks. In Proceedings of the 2019 Cybersecurity and Cyberforensics Conference (CCC), Melbourne, Australia, 8–9 May 2019; pp. 74–77. [Google Scholar] [CrossRef]
  35. Wang, H.; Cao, Z.; Hong, B. A network intrusion detection system based on convolutional neural network. J. Intell. Fuzzy Syst. 2020, 38, 7623–7637. [Google Scholar] [CrossRef]
  36. Wang, X.; Yin, S.; Li, H.; Wang, J.; Teng, L. A network intrusion detection method based on deep multi-scale convolutional neural network. Int. J. Wirel. Inf. Netw. 2020, 27, 503–517. [Google Scholar] [CrossRef]
  37. Jo, W.; Kim, S.; Lee, C.; Shon, T. Packet Preprocessing in CNN-Based Network Intrusion Detection System. Electronics 2020, 9, 1151. [Google Scholar] [CrossRef]
  38. Hu, Z.; Wang, L.; Qi, L.; Li, Y.; Yang, W. A Novel Wireless Network Intrusion Detection Method Based on Adaptive Synthetic Sampling and an Improved Convolutional Neural Network. IEEE Access 2020, 8, 195741–195751. [Google Scholar] [CrossRef]
  39. Akhtar, M.S.; Feng, T. Deep learning-based framework for the detection of cyberattack using feature engineering. Secur. Commun. Netw. 2021, 2021, 6129210. [Google Scholar] [CrossRef]
  40. Zhang, H.; Huang, L.; Wu, C.Q.; Li, Z. An effective convolutional neural network based on SMOTE and Gaussian mixture model for intrusion detection in imbalanced dataset. Comput. Netw. 2020, 177, 107315. [Google Scholar] [CrossRef]
  41. Meliboev, A.; Alikhanov, J.; Kim, W. Performance Evaluation of Deep Learning Based Network Intrusion Detection System across Multiple Balanced and Imbalanced Datasets. Electronics 2022, 11, 515. [Google Scholar] [CrossRef]
  42. Altunay, H.C.; Albayrak, Z. A hybrid CNN+LSTM-based intrusion detection system for industrial IoT networks. Eng. Sci. Technol. Int. J. 2023, 38, 101322. [Google Scholar] [CrossRef]
  43. Thilagam, T.; Aruna, R. LM-GA: A Novel IDS with AES and Machine Learning Architecture for Enhanced Cloud Storage Security. J. Mach. Comput. 2023, 3, 69–79. [Google Scholar] [CrossRef]
  44. Karthic, S.; Kumar, S.M. Hybrid Optimized Deep Neural Network with Enhanced Conditional Random Field Based Intrusion Detection on Wireless Sensor Network. Neural Process. Lett. 2023, 55, 459–479. [Google Scholar] [CrossRef]
  45. Khan, A.S.; Ahmad, Z.; Abdullah, J.; Ahmad, F. A Spectrogram Image-Based Network Anomaly Detection System Using Deep Convolutional Neural Network. IEEE Access 2021, 9, 87079–87093. [Google Scholar] [CrossRef]
  46. Mendonça, R.V.; Teodoro, A.A.M.; Rosa, R.L.; Saadi, M.; Melgarejo, D.C.; Nardelli, P.H.J.; Rodríguez, D.Z. Intrusion Detection System Based on Fast Hierarchical Deep Convolutional Neural Network. IEEE Access 2021, 9, 61024–61034. [Google Scholar] [CrossRef]
  47. Bowen, B.; Chennamaneni, A.; Goulart, A.; Lin, D. BLoCNet: A hybrid, dataset-independent intrusion detection system using deep learning. Int. J. Inf. Secur. 2023, 22, 893–917. [Google Scholar] [CrossRef]
  48. Li, S.; Li, Q.; Li, M. A Method for Network Intrusion Detection Based on GAN-CNN-BiLSTM. Int. J. Adv. Comput. Sci. Appl. 2023, 14, 507–515. [Google Scholar] [CrossRef]
  49. Nguyen, M.T.; Kim, K. Genetic convolutional neural network for intrusion detection systems. Future Gener. Comput. Syst. 2020, 113, 418–427. [Google Scholar] [CrossRef]
  50. Bhuvaneshwari, K.S.; Venkatachalam, K.; Hubálovský, S.; Trojovský, P.; Prabu, P. Improved Dragonfly Optimizer for Intrusion Detection Using Deep Clustering CNN-PSO Classifier. Comput. Mater. Contin. 2022, 70, 5949–5965. [Google Scholar] [CrossRef]
Figure 1. Operational procedure of GA.
Mathematics 11 03724 g001
Figure 2. Steps of the PSO Procedure.
Mathematics 11 03724 g002
Figure 3. 1D-CNN Model for NIDSs.
Mathematics 11 03724 g003
Figure 4. Percentage of datasets used in the CNN-IDS approaches [2].
Mathematics 11 03724 g004
Figure 5. Model accuracy when using GA.
Mathematics 11 03724 g005
Figure 6. Model loss when using GA.
Mathematics 11 03724 g006
Figure 7. Model accuracy when using PSO.
Mathematics 11 03724 g007
Figure 8. Model loss when using PSO.
Mathematics 11 03724 g008
Figure 9. Confusion matrix using GA.
Mathematics 11 03724 g009
Figure 10. Confusion matrix using PSO.
Mathematics 11 03724 g010
Table 1. Neural Network Hyperparameter Optimization Methods.
AuthorsModel Optimized HyperparametersOptimization Techniques
Selvarajan et al. [5]LSTM-CNN
2023
6Batch sizeManual tuning
Decay rate
Learning rate
Momentum
Number of epochs
Optimizer
Sheraz et al. [4]DCNN
2018
4ActivationRandomized search
Kernel initialization
Loss function
Optimizer
Desta et al. [3]Rec-CNN
2022
8Batch sizeHyperband
Decay rate
Decay steps
Dropout rate
Learning rate
Number of filters
Number of neurons in dense layers
Optimizer
Kanna et al. [6]OCNN-HMLSTM
2021
5Convolutional layerLion Swarm
Optimization
Fully connected layer
Hidden units/layer
Pooling layer
Pooling size
Chen et al. [9]MECNN
2022
3Batch sizeMultiobjective
evolutionary
algorithm
Learning rate
Learning rule
Mahmoud et al. [10]CNN-ALSTM
2022
--Poor and rich
optimization algorithm
Yan et al. [11]TL-CNN-IDS
2023
5Dropout rateTree-Structured Parzen
Estimator algorithm
Early-stop patience
Frozen layers
Learning rate
Number of epochs
Okey et al. [12]CNN
2023
6Batch sizeBayesian Optimization—
Tree Parzen Estimator
Dropout rate
Early-stop patience
Frozen layers
Learning rate
Number of epochs
Yang et al. [8]CNN
2023
6Batch sizeParticle Swarm
Optimization
Dropout rate
Early-stop patience
Frozen layers
Learning rate
Number of epochs
Amir et al. [13]CNN
2023
5Dropout rateRandom search
Early-stop patience
Frozen layers
Learning rate
Number of epochs
5Dropout rateParticle Swarm
Optimization
Early-stop patience
Frozen layers
Learning rate
Number of epochs
Proposed
optimization
method
1D-CNN
2023
9Batch sizeGenetic Algorithm
Dropout rate
Kernel size
Learning rate
Number of dense layers
Number of epochs
Number of filters
Number of neurons in dense layers
Pooling size
9Batch sizeParticle Swarm
Optimization
Dropout rate
Kernel size
Learning rate
Number of dense layers
Number of epochs
Number of filters
Number of neurons in dense layers
Pooling size
Table 2. Hyperparameters for 1D-CNNs.
CriteriaHyperparameterDescription
Network
structure
Number of layersDepth of the neural network. More layers can model more complex features, but can lead to overfitting.
Number of units per layerBreadth of each layer. More units can capture more complex features, but increase the risk of overfitting.
Number of filtersNumber of filters in a convolution layer. More filters allow the model to learn more complex patterns but increase the computational requirements.
Filter sizeSize of filters in a convolution layer. Small filters capture local patterns and large filters capture more global patterns.
Stride sizeAmount of movement over the input data. A larger stride results in a smaller output dimensionality.
PaddingHelps maintain the spatial dimensions of the input, allowing the network to learn from the edge and corner information.
Kernel sizeDetermines how many input data points each filter handles at a time.
Pooling sizeSize of the pooling operation, affecting the amount of downsampling in the network.
Number of dense
layers
Number of fully connected (dense) layers in a network. More layers can model complex patterns, but increase the risk of overfitting.
Number of neurons
in dense layers
Number of units in fully connected (dense) layers. More neurons can capture complex patterns, but increase the computational requirements and risk of overfitting.
Dilation rateIn dilated convolutions, the filter is applied to inputs with gaps; it is useful for capturing information across a wide range of inputs.
Learning
and
optimization
Learning rateDetermines how much the weights are adjusted during each update.
MomentumHelps prevent the optimization from falling into local minima by adding a fraction of the previous weight update to the current weight.
Batch sizeAffects how often the weights in the network are updated.
OptimizerDifferent optimization algorithms (such as SGD, Adam, and RMSprop) have different behaviors and may influence how quickly and effectively the model learns.
Number of epochsNumber of times the learning algorithm works through the entire training dataset.
Learning rate
Decay/Scheduler
Controls the change in learning rate over time or epoch. This can help the optimizer converge more effectively.
Regularization
effect
Dropout rateProbability that a given neuron will be turned off during training. Dropout is a regularization technique to prevent overfitting.
Weight decay
(L2 regularization)
Adds a penalty to the loss function based on the sizes of the weights. This helps prevent the weights from becoming too large and overfitting to the training data.
Early stoppingThe training process is stopped when the performance on a validation set stops improving. This helps prevent overfitting.
L1 regularizationAdds a penalty to the loss function based on the absolute values of the weights. It encourages the weights to be small and can lead to sparse weights, effectively achieving feature selection.
Table 3. Comparative Analysis of Optimization Algorithms.
AlgorithmNatureSearch StrategyApplicabilityStrengths in
Hyperparameter
Optimization
Genetic
Algorithms
Inspired by natural
evolution
Mutation,
crossover,
and selection
Both continuous
and discrete
Maintains diverse
population; balances
exploration and exploitation
Particle Swarm
Optimization
Inspired by
bird/fish social
behavior
Velocity and position
updates based on
best solutions
Primarily
continuous, can be
adapted
Rapid convergence to
good solutions; excellent
fine-tuning
Manual TuningHuman-guided
iterative adjustment
Relies on human
intuition
All types of
problems
Simple; no overhead,
but relies heavily on
human expertise
Randomized
Search
Purely random
exploration
Random
sampling of
hyperparameters
High-dimensional
spaces
Baseline method; can
sometimes find good
solutions quickly
HyperbandBandit-based
approach
Allocates resources
to different
configurations
Deep learning
models
Efficiently handles large
search spaces with
limited budget
TPE and Bayesian
Optimization
Probabilistic
modeling
Sequential
sampling to
maximize acquisition
function
Expensive
evaluations, e.g.,
deep learning
Systematic; builds on
prior evaluations; can
be very precise
Gradient
Descent
Iterative based
on gradient
Moves opposite
to the gradient
Differentiable
functions
Direct; efficient for
specific problems but
requires gradient
Simulated
Annealing
Metallurgy-inspired
probabilistic
method
Occasional uphill
moves to escape
local optima
Both continuous
and discrete
problems
Ability to escape local
minima; probabilistic
balance between search
areas
Other Swarm
Methods (e.g.,
Lion Swarm
Optimization)
Various inspirations
(e.g., lions)
Various (e.g.,
hunting, mating
tactics)
Continuous
optimization
problems
Specialized tactics; often
problem-specific benefits
Tabu SearchIterative with
memory structures
Uses memory to
avoid revisiting
solutions
Combinatorial
optimization
Efficient for combinatorial
tasks with its memory use
Table 4. Software environment in which the proposed model functions.
ToolDescription
PythonThe code was written in Python, a popular language for data science and ML.
TensorFlowTensorFlow was used as the backend for Keras.
KerasKeras is a high-level neural network API, written in Python and capable of running on top of TensorFlow, CNTK, and Theano.
NumPyNumPy is a library for the Python programming language, which provides support for large, multidimensional arrays and matrices along with a large collection of high-level mathematical functions to operate on these arrays.
Table 5. GA-based hyperparameter optimization results.
HyperparameterRangeUNSW-NB15CIC-IDS2017NSL-KDD
Number of filters[16, 32, 64, 128, 256]64, 12864, 12832, 64
Kernel size[3, 5, 7, 9, 11]599
Pooling size(2, 6)355
Number of dense layers(1, 5)221
Number of neurons in dense layers[16, 32, 64, 128, 256]128256128
Dropout rate(0.1, 0.5)0.2772050.1135850.253378
Learning rate(1 × 10 5 , 1 × 10 2 )0.0034880.0011930.000471
Batch size[16, 32, 64, 128, 256]2566432
Number of epochs(10, 100)759972
Table 6. Comparison of the effectiveness of GA on various datasets.
DatasetUNSW-NB15CIC-IDS2017NSL-KDD
Loss1.441.151.78
Accuracy99.31%99.71%99.63%
Table 7. Hyperparameter optimization results when using PSO.
HyperparameterRangeUNSW-NB15CIC-IDS2017NSL-KDD
Number of filters[16, 32, 64, 128, 256]128, 256128, 256128, 256
Kernel size[3, 5, 7, 9, 11]71111
Pooling size(2, 6)354
Number of dense layers(1, 5)335
Number of neurons in dense layers[16, 32, 64, 128, 256]128256256
Dropout rate(0.1, 0.5)0.1615830.3683900.053669
Learning rate(1 × 10 5 , 1 × 10 2 )0.0008410.0007820.001330
Batch size[16, 32, 64, 128, 256]166464
Number of epochs(10, 100)808465
Table 8. Comparing the effectiveness of PSO for various datasets.
DatasetUNSW-NB15CIC-IDS2017NSL-KDD
Loss1.470.881.75
Accuracy99.28%99.74%99.52%
Table 9. Performance metrics for different datasets and algorithms.
DatasetMetricAlgorithm
GAPSO
UNSW-NB15Loss1.441.47
Accuracy99.31%99.28%
Precision99%99%
Recall98%98%
F1-score98%98%
CIC-IDS2017Loss1.150.88
Accuracy99.71%99.74%
Precision100%100%
Recall99%99%
F1-score99%100%
NSL-KDDLoss1.781.75
Accuracy99.63%99.52%
Precision99%99%
Recall99%99%
F1-score99%99%
Table 10. Comparative analysis of our models with the existing CNN-based models.
DatasetModelYearAccuracyPrecisionRecallF1-Score
UNSW-NB15CNN [22]201894.9---
1D-CNN [23]201991.287.5396.1791.59
CNN-IDS [24]202191---
BCNN [25]202190.25919090.45
GA-1D-CNN202399.31999898
PSO-1D-CNN202399.28999898
CIC-IDS2017CNN-MCL [26]202099.4699.7699.1599.46
CNN [27]202299.41---
1D-CNN [28]202298.6899.298.9498.96
GA-1D-CNN202399.711009999
PSO-1D-CNN202399.7410099100
NSL-KDDCNN [29]201880.13---
SMOTE-ENN [30]201983.3196.97--
CNN-1D [31]201984.2974.62--
Multi-CNN [32]201986.9589.5687.2588.41
IBWNIDM [33]201995.3695.55--
Improved CNN [34]201999.23---
IDS-CNN [35]202097.7---
DMCNN [36]202094.6596.66--
CNN(AVG) [37]202088.82--90.67
AS-CNN [38]202084.0880--
BCNN-DFS [25]202190.14909090
CNN [39]202199989797
CNN-B [27]202284.8285.7487.96-
GA-1D-CNN202399.63999999
PSO-1D-CNN202399.52999999
Table 11. Comparison of our models with hybrid CNN and ML IDS.
DatasetModelYearAccuracyPrecisionRecallF1-Score
UNSW-NB15SGM-CNN [40]202098.8299.74-95.53
OCNN-HMLSTM [6]202196.3310095.8798.13
CNN + LSTM [41]202287.685.590.688
ODODL-IDS [10]202292.8797.3377.5372.53
CNN + LSTM [42]202393.21---
CNN-LSTM [43]202396.9995.45--
OHDNN + ECRF [44]202398.397.596.797.1
GA-1D-CNN202399.31999898
PSO-1D-CNN202399.28999898
CIC-IDS2017SDCNN [45]202199.35---
Tree-CNN [46]202198--98
ODODL-IDS [10]202297.6297.2697.2599
CNN 1D + BLSTM [47]202398868481
GAN-CNN-BiLSTM [48]202396.3296.5595.3896.04
GA-1D-CNN202399.711009999
PSO-1D-CNN202399.7410099100
NSL-KDDDCNN [4]201885.2297--
IFS-CNN-BG [49]202098.2495.44--
PSO-CCNN [50]202198.71---
OCNN-HMLSTM [6]202190.6786.7195.1991.46
CNN + LSTM [41]202295.299.590.894.9
ODODL-IDS [10]202289.0995.3899.6578.44
CNN-LSTM [43]202397.2396.45--
OHDNN [44]202397.1797.3297.0295.92
TL-CNN-IDS [11]202399.5397.6396.7797.13
LSTM-CNN [5]202397.893.7196.1995.46
GA-1D-CNN202399.63999999
PSO-1D-CNN202399.52999999
Disclaimer/Publisher’s Note: The statements, opinions and data contained in all publications are solely those of the individual author(s) and contributor(s) and not of MDPI and/or the editor(s). MDPI and/or the editor(s) disclaim responsibility for any injury to people or property resulting from any ideas, methods, instructions or products referred to in the content.

