
Assessing Knowledge Quality Using Fuzzy MCDM Model


Abstract
1. Introduction
2. Literature Review
2.1. Knowledge Quality
2.2. Fuzzy Set and Group Decision Making
- (1)
- Let the fuzzy number of the expert’s opinion of A and B be and ; then, the distance between and can be computed using Equation (5), and the similarity between and can be obtained using Equation (6).where , U is the universe of discourse, and .
- (2)
- Set the initial aggregated weight as the weight of the first expert. and , n is the number of criteria, and iteration .
- (3)
- Compute aggregated opinion using Equation (8); is the ith expert’s individual opinion.
- (4)
- Let aggregated weight , and compute using Equation (9).
- (5)
- If , stop; otherwise, , go to Step (3).
3. Model Formulation
3.1. Knowledge Quality Fuzziness Index
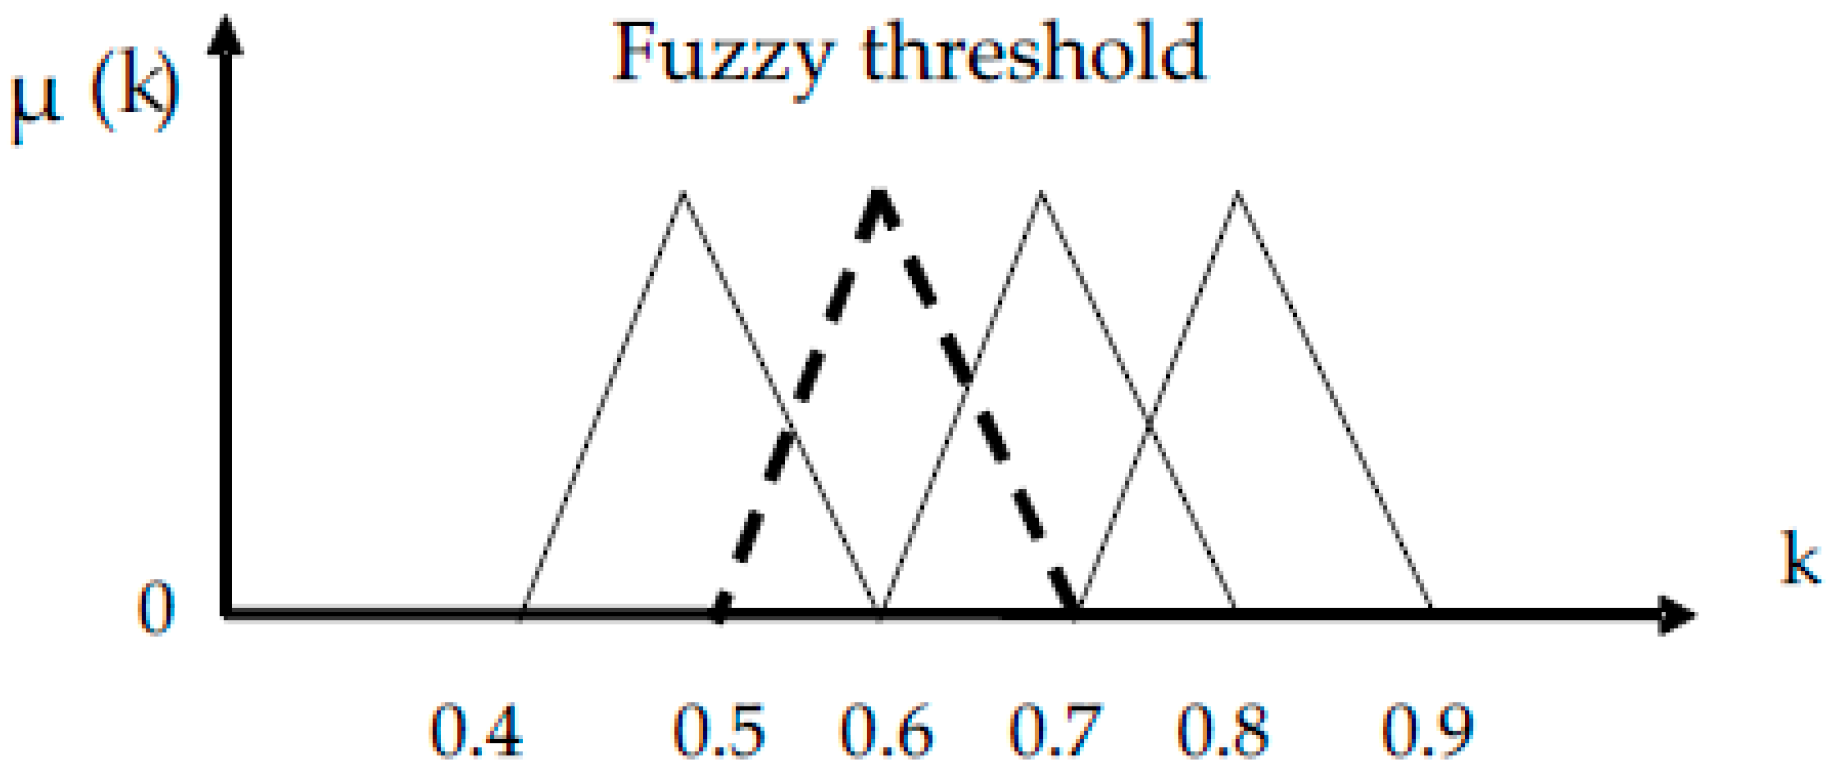
3.2. Fuzzy Gate Selection
- (a)
- Compute fuzzy preference z based on Equation (13).
- (b)
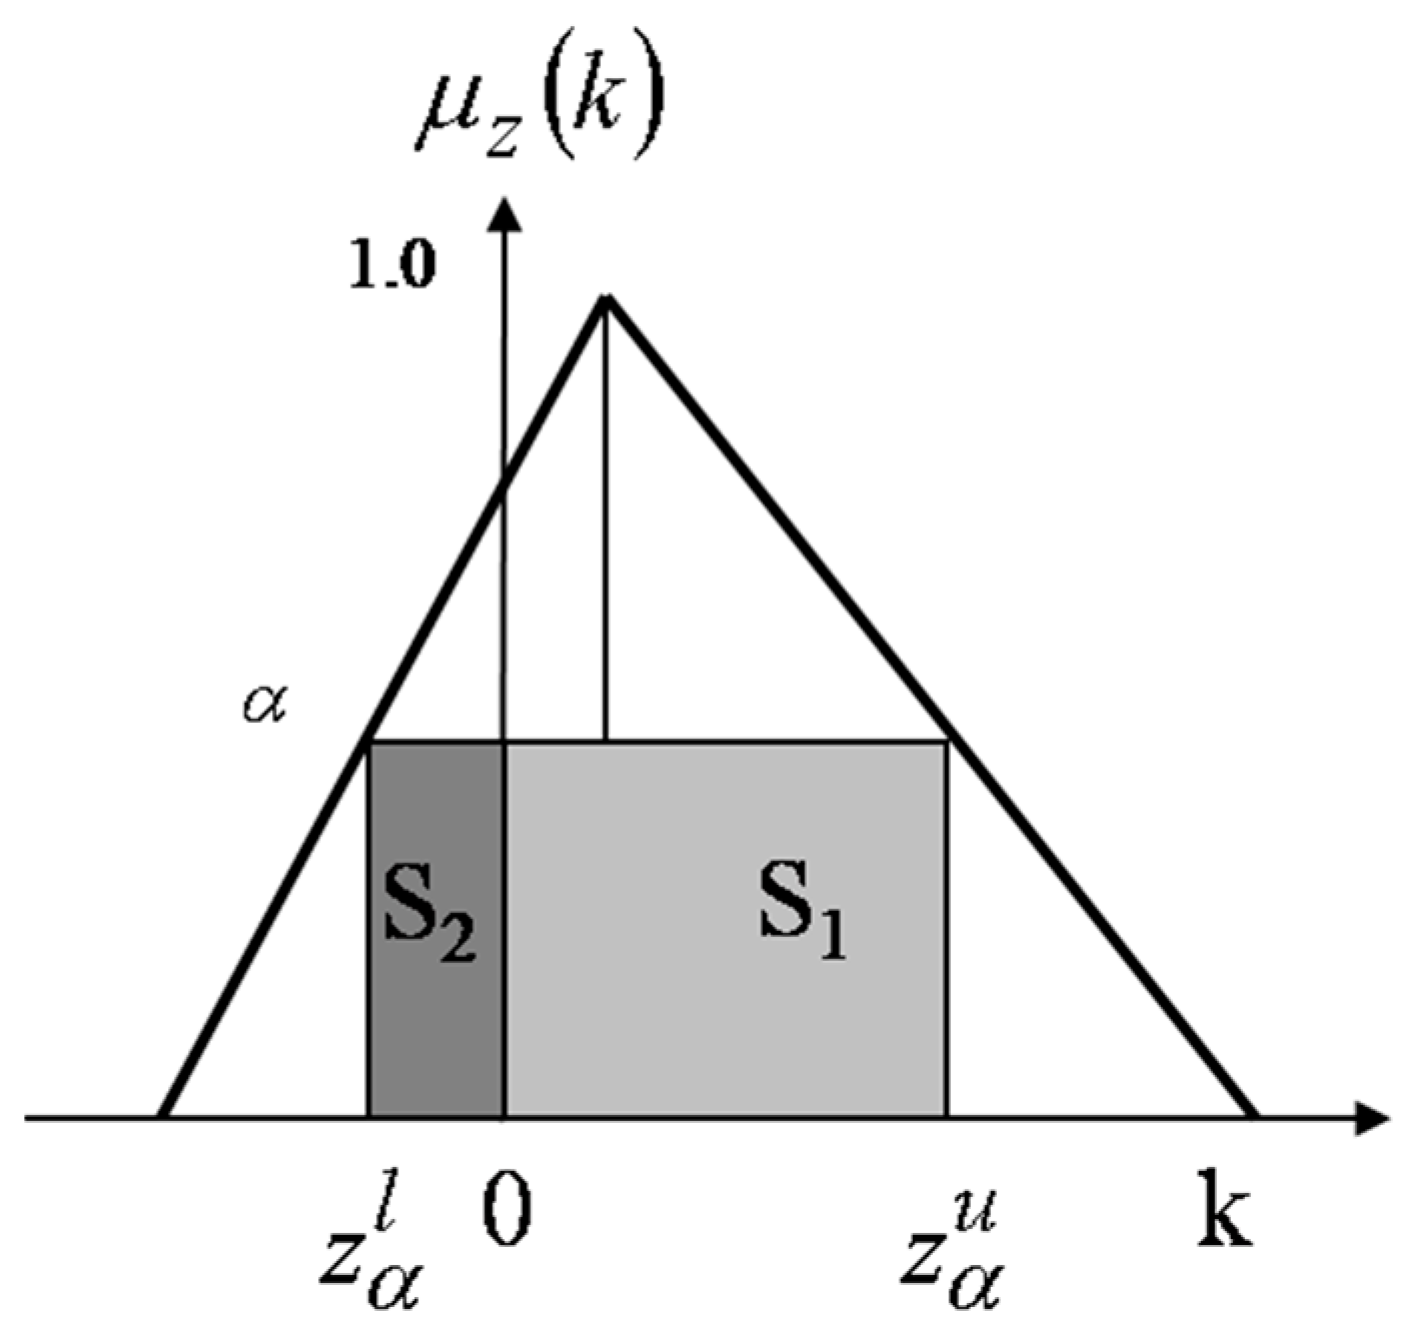
- Conduct -cut to z and obtain and as in Figure 2 and Equation (14).
- (c)
- Compute the level of goodness of KQFI to FT using Equations (15) and (16); if , then the knowledge proposal is qualified and accepted.
3.3. Implementation Procedures
- The expert penal receives the knowledge proposal and decides the assessment criteria, the linguistic variables, and the fuzzy number.
- Experts assess the criteria weight and quality performance of knowledge proposals, and obtain the consensus of the expert decision.
- Obtain the membership function of the KQFI for each knowledge proposal.
- Specify the FT value according to enterprise strategic objectives.
- Compute fuzzy preference z and level of goodness , and make a Go/No go decision for each knowledge proposal.
3.4. Size of Expert Panel
4. Case Implementation
- The expert panel composed of five experts receives nine knowledge proposals; decides the assessment criteria of knowledge quality as (1) originality (A1), (2) applicability (A2), (3) practicality (A3), (4) value (A4), and (5) uniqueness (A5); and uses linguistic variables of very good, good, fair, poor, and very poor, and the triangular fuzzy number listed in Table 1, to assess the criteria weight and knowledge quality.
- Experts assess the criteria weight and quality performance of knowledge proposals (Table 2) and obtain the consensus of the expert opinion. D1 to D5 indicate experts and K1 to K9 represent knowledge proposals in Table 2. The consensus of the expert decision is described below.
- (i)
- Let c = 1.5, m = 2, and , where the initial aggregated weight is set as the weight of the first expert, i.e., . Then, the aggregated opinion can be obtained using Equation (8), and is the opinion of an individual expert.
- (ii)
- The similarity between the individual and the aggregated are computed using Equation (6), where u = 0.7.
- (iii)
- The new aggregated weight can be computed using Equation (9) and obtained as. and can be computed as below:
- (iv)
- The new aggregated opinion can be computed using Equation (8) as below:can be obtained as .
- (v)
- Obtain the membership function of KQFI1 to KQFI9 using Equations (11) and (12) at different values of α-cut. The results are listed in Table 5.
- Specify FT value as (0.5, 0.6, 0.7) according to the enterprise strategic objectives.
4.1. Summary
4.2. Comparisons with Past Method
5. Conclusions
Author Contributions
Funding
Data Availability Statement
Conflicts of Interest
References
- Liu, W.; Wang, Y.; Li, L. Research on the optimal aggregation method of judgment matrices based on spatial steiner-weber point. J. Syst. Sci. Complex. 2023, 36, 1228–1249. [Google Scholar] [CrossRef]
- Ko, A.; Vas, R.; Kovacs, T.; Szabo, I. Knowledge Creation from the perspective of the supply chain, the role of ICT. Soc. Econ. 2019, 41, 311–329. [Google Scholar]
- Nonaka, I. A Dynamic Theory of Organizational Knowledge Creation; Institute of Business Research, Hitotsubashi University: Kunitachi, Japan, 1994; pp. 14–37. [Google Scholar]
- Lynn, M.R. Determination and quantification of content validity. Nurs. Res. 1986, 35, 382–386. [Google Scholar] [CrossRef]
- Mohajan, H.K. The impact of knowledge management models for the development of organizations. J. Environ. Treat. Tech. 2017, 5, 12–33. [Google Scholar]
- Chen, W.; Tan, J.S.H.; Pi, Z. The spiral model of collaborative knowledge improvement: An exploratory study of a networked collaborative classroom. Int. J. Comput. Support. Collab. Learn. 2021, 16, 7–35. [Google Scholar] [CrossRef]
- Spangler, S.C.; Skovira, R.J.; Kohun, F.G. Key factors in a successful knowledge management model. Online J. Appl. Knowl. Manag. 2015, 3, 51–60. [Google Scholar]
- Aljuwaiber, A. Communities of practice as an initiative for knowledge sharing in business organizations: A literature review. J. Knowl. Manag. 2016, 20, 731–748. [Google Scholar] [CrossRef]
- Choi, H.J.; Ahn, J.C.; Jung, S.H.; Kim, J.H. Communities of practice and knowledge management systems: Effects on knowledge management activities and innovation performance. Knowl. Manag. Res. Pract. 2020, 18, 53–68. [Google Scholar] [CrossRef]
- Chakrabarti, D.; Arora, M.; Sharma, P. Evaluating knowledge quality in knowledge management systems. J. Stat. Appl. Probab. 2018, 7, 75–84. [Google Scholar] [CrossRef]
- Waheed, M.; Kaur, K. Knowledge quality: A review and a revised conceptual model. Inf. Dev. 2016, 32, 271–284. [Google Scholar] [CrossRef]
- Arora, M.; Chakrabarti, D. Knowledge Quality Assessment in Knowledge Management Systems. Int. J. Knowl. Manag. Pract. 2014, 2, 1. [Google Scholar]
- Xiang, Y.D.; Zhang, P.Z.; Wu, S. Content-based knowledge quality assessment and its application in health management system. J. Shanghai Jiaotong Univ. 2021, 26, 116–128. [Google Scholar] [CrossRef]
- Yoo, D.K.; Vonderembse, M.A.; Ragu-Nathan, T.S. Knowledge quality: Antecedents and consequence in project teams. J. Knowl. Manag. 2011, 15, 329–343. [Google Scholar]
- Leonardo, M.A.; Szczerbicki, E.; Sanín, C. A proposal for a knowledge market based on quantity and quality of knowledge. Cybern. Syst. 2013, 44, 118–132. [Google Scholar]
- Krishnaraj, N. Windows Vista: Why did it fail? TechTalkers, 22 June 2020. [Google Scholar]
- Lim, R.A.; Siew Lee, H.A.; Lim, T.M. A Study on Knowledge Quality and Job Performance of Knowledge Workers by Analyzing Content of Social Network Sites Using Sentiment Network Analysis. Inf. Manag. Bus. Rev. 2013, 5, 525–530. [Google Scholar]
- Zhou, X.; Min, M.; Zhang, Z. Research on the social capital, knowledge quality and product innovation performance of knowledge-intensive firms in China. Front. Psychol. 2022, 13, 946062. [Google Scholar] [CrossRef] [PubMed]
- Abdollahbeigi, B.; Salehi, F. Knowledge quality and non-financial performance-A Malaysian experience. Knowl. Process Manag. 2021, 29, 12–22. [Google Scholar] [CrossRef]
- Ganguly, A.; Talukdar, A.; Chatterjee, D. Evaluating the role of social capital, tacit knowledge sharing, knowledge quality and reciprocity in determining innovation capability of an organization. J. Knowl. Manag. 2019, 23, 1105–1135. [Google Scholar] [CrossRef]
- Zubielqui, G.; Lindsay, N.; Lindsay, W. Knowledge quality, innovation and firm performance: A study of knowledge transfer in SMEs. Small Bus. Econ. 2019, 53, 145–164. [Google Scholar] [CrossRef]
- Chen, C.T. Extensions of the TOPIS for group decision-making under fuzzy environment. Fuzzy Sets Syst. 2000, 114, 1–9. [Google Scholar] [CrossRef]
- Clement, A.M.; Bharatraj, J. Theory of triangular fuzzy number. In Proceedings of the National Conference on Advanced Trends in Mathematics, Tamil Nadu, India, 27 March 2017. [Google Scholar]
- Sudha, T.; Jayalalitha, G. Fuzzy triangular numbers in—Sierpinski triangle and right-angle triangle. J. Phys. Conf. Ser. 2022, 1597. [Google Scholar] [CrossRef]
- Tamilmani, C. Arithmetic operation of fuzzy numbers using A-cut method. Int. J. Innov. Sci. Eng. Technol. 2015, 2, 299–315. [Google Scholar]
- Zhang, G.; Lu, J. An integrated group decision-making method dealing with fuzzy preference for alternatives and individual judgments for selection criteria. Group Decis. Negot. 2003, 12, 501–515. [Google Scholar] [CrossRef]
- Li, H.L.; Yang, J.Q.; Xiang, Z.Q. A fuzzy linguistic multi-criteria decision-making approach to assess emergency suppliers. Sustainability 2022, 14, 13114. [Google Scholar] [CrossRef]
- Kukkurainen, P. Fuzzy logic and Zadeh algebra. Adv. Pure Math. 2017, 7, 350–365. [Google Scholar] [CrossRef][Green Version]
- Efe, B. An integrated fuzzy multi criteria group decision making approach for ERP system selection. Appl. Soft Comput. 2016, 38, 106–117. [Google Scholar] [CrossRef]
- Lin, C.; Tan, B.; Hsieh, P.J. Application of the fuzzy weighted average in strategic portfolio management. Decis. Sci. 2005, 36, 489–510. [Google Scholar] [CrossRef]
- Pavlacka, O.; Pavlackova, M.; Hetflei, V. Fuzzy weighted average as a fuzzified aggregation operator and its properties. Kybernetika 2017, 53, 137–160. [Google Scholar] [CrossRef][Green Version]
- Pavlacka, O.; Pavlackova, M. On the properties of the fuzzy weighted average of fuzzy numbers with normalized fuzzy weights. Iran. J. Fuzzy Syst. 2021, 18, 1–17. [Google Scholar]
- Wang, R.C.; Chu, S.J. Group decision-making using a fuzzy linguistic approach for evaluating the flexibility in a manufacturing system. Eur. J. Oper. Res. 2004, 154, 563–572. [Google Scholar] [CrossRef]
- Kaushik, M.; Kumar, M. Distance and similarity-based aggregation method in intuitionistic fuzzy fault tree analysis. SSRN 2023. [Google Scholar] [CrossRef]
- Lee, D.H.; Park, D. An efficient algorithm for fuzzy weight average. Fuzzy Sets Syst. 1997, 87, 39–45. [Google Scholar] [CrossRef]
- Lee, H.S. Optimal consensus of fuzzy opinions under group decision making environment. Fuzzy Sets Syst. 2002, 132, 303–315. [Google Scholar] [CrossRef]
- Stojčić, M.; Zavadskas, E.K.; Pamučar, D.; Stević, Ž.; Mardani, A. Application of MCDM Methods in Sustainability Engineering: A Literature Review 2008–2018. Symmetry 2019, 11, 350. [Google Scholar] [CrossRef]
- Zavadskas, E.K.; Turskis, Z.; Kildienė, S. State of art surveys of overviews on MCDM/MADM methods. Technol. Econ. Dev. Econ. 2014, 20, 165–179. [Google Scholar] [CrossRef]
- Jamwal, A.; Agrawal, R.; Sharma, M.; Kumar, V. Review on multi-criteria decision analysis in sustainable manufacturing decision making. Int. J. Sustain. Eng. 2021, 14, 202–225. [Google Scholar] [CrossRef]
- Kumar, A.; Sah, B.; Singh, A.R.; Deng, Y.; He, X.N.; Kumar, P.; Bansal, R.C. A review of multi criteria decision making (MCDM) towards sustainable renewable energy development. Renew. Sustain. Energy Rev. 2017, 69, 596–609. [Google Scholar] [CrossRef]
- Chang, P.T.; Hung, K.C. Applying the fuzzy-weighted-average approach to evaluate network security systems. Comput. Math. Appl. 2005, 49, 1797–1814. [Google Scholar] [CrossRef]
- Leonardo, M.A.; Sanín, C.; Szczerbicki, E. Quality assessment of experiential knowledge. Cybern. Syst. 2012, 43, 96–113. [Google Scholar]
- Lin, C.; Hsieh, P.J. A fuzzy decision support system for strategic portfolio management. Decis. Support Syst. 2004, 38, 383–398. [Google Scholar] [CrossRef]
- Lin, C.T.; Chen, C.T. Bid/no-bid decision-making—A fuzzy linguistic approach. Int. J. Proj. Manag. 2004, 22, 585–593. [Google Scholar] [CrossRef]
- Verma, R.; Sharma, B. Intuitionistic fuzzy Einstein prioritized weighted average operators and their application to multiple attribute group decision making. Appl. Math. Inf. Sci. 2015, 9, 3095–3107. [Google Scholar]
- Dong, W.M.; Wong, F.S. Fuzzy weighted averages and implementation of the extension principle. Fuzzy Sets Syst. 1987, 21, 183–199. [Google Scholar] [CrossRef]
- Kao, C.; Liu, S.T. Fractional programming approach to fuzzy weighted average. Fuzzy Sets Syst. 2001, 120, 435–444. [Google Scholar] [CrossRef]
- Cheng, S.L.; Kuan, Y.W. A fuzzy logic-based knowledge management performance measurement system for SMEs. Cybern. Syst. 2017, 48, 277–302. [Google Scholar]
- Cheng, C.H.; Lin, Y. Evaluating the main battle tank using fuzzy decision theory with linguistic criteria evaluation. Eur. J. Oper. Res. 2002, 142, 174–186. [Google Scholar] [CrossRef]
- Chu, P.V. A decision support for project portfolio selection. Comput. Ind. 1996, 32, 141–149. [Google Scholar] [CrossRef]
- Fan, Z.P. An approach to multiple attribute decision making based on fuzzy preference information on alternative. Fuzzy Sets Syst. 2002, 131, 101–106. [Google Scholar] [CrossRef]
- Hsu, H.M.; Chen, C.T. Aggregation of fuzzy opinions under group decision making. Fuzzy Sets Syst. 1996, 79, 279–285. [Google Scholar]
- Hashmi, N.; Shankaranarayanan, G.; Malone, T.W. Is bigger better? A study of the effect of group size on collective intelligence in online groups. Decis. Support Syst. 2023, 167, 113914. [Google Scholar] [CrossRef]
- Emmerling, T.; Rooders, D. 7 strategies for better group decision-making. Harvard Business Review, 22 September 2022. [Google Scholar]
- Axtell, P. The most productive meetings have fewer than 8 people. Harvard Business Review, 22 June 2018. [Google Scholar]
- Taylor, E. We Agree, Don’t We? The Delphi method for health environments research. Health Environ. Res. Des. J. 2020, 13, 11–23. [Google Scholar] [CrossRef] [PubMed]


| Weight | Quality | TFN |
|---|---|---|
| VL (Very low) | VP (Very poor) | (0, 0, 0.1) |
| L (Low) | P (Poor) | (0, 0.1, 0.3) |
| ML (Medium low) | MP (Medium poor) | (0.1, 0.3, 0.5) |
| M (Medium) | M (Medium) | (0.3, 0.5, 0.7) |
| MH (Medium high) | MG (Medium good) | (0.5, 0.7, 0.9) |
| H (High) | G (Good) | (0.7, 0.9, 1.0) |
| VH (Very high) | VG (Very good) | (0.9, 1.0, 1.0) |
| Expert | D1 | D2 | W D3 | D4 | D5 | D1 | D2 | K1 D3 | D4 | D5 | D1 | D2 | K2 D3 | D4 | D5 | D1 | D2 | K3 D3 | D4 | D5 | D1 | D2 | K4 D3 | D4 | D5 | |
| Criteria | ||||||||||||||||||||||||||
| A1 | M | M | H | MH | M | G | VG | G | MG | MG | G | M | MG | M | MG | M | MP | M | MG | M | G | VG | MG | MG | MG | |
| A2 | MH | M | H | VH | MH | G | G | M | M | G | G | G | MG | G | G | M | M | VG | VG | G | MG | MG | M | M | G | |
| A3 | H | VH | MH | H | H | G | G | MG | MG | G | G | M | M | M | G | G | MG | G | MG | G | MG | G | M | MG | G | |
| A4 | MH | M | H | H | M | G | G | G | MG | G | G | G | G | MG | MG | M | MG | MG | MG | M | G | G | G | MG | G | |
| A5 | MH | M | H | H | M | MP | MG | M | MG | M | M | MG | MG | MG | M | M | M | G | MG | MG | MG | MG | MG | G | MG | |
| Expert | D1 | D2 | K5 D3 | D4 | D5 | D1 | D2 | K6 D3 | D4 | D5 | D1 | D2 | K7 D3 | D4 | D5 | D1 | D2 | K8 D3 | D4 | D5 | D1 | D2 | K9 D3 | D4 | D5 | |
| Criteria | ||||||||||||||||||||||||||
| A1 | M | M | MG | G | MG | G | G | M | G | MG | MP | M | M | M | MG | M | M | MG | M | MG | G | M | MG | M | MG | |
| A2 | M | M | MG | M | G | M | M | M | G | G | MP | M | G | M | G | MG | G | MG | M | G | MG | G | G | MG | M | |
| A3 | G | G | MG | M | MG | M | MP | M | M | G | G | MG | MG | MG | M | MG | M | M | MG | M | M | G | M | M | M | |
| A4 | MP | MG | MG | M | M | MP | M | MG | M | G | M | MG | MG | MG | G | MP | M | M | M | G | MP | M | M | MG | M | |
| A5 | MG | MG | MG | G | MG | M | MG | MG | MG | M | M | M | M | MG | G | MG | MP | G | M | M | M | MG | MG | MG | M | |
| 0 | 1 | 0 | 0 | 0 | 0 | 0.3000 | 0.5000 | 0.5000 | 0.7000 |
| 1 | 0.2865 | 0.2865 | 0.1812 | 0.2463 | 0.2865 | 0.3981 | 0.5981 | 0.5981 | 0.7854 |
| 2 | 0.2651 | 0.2651 | 0.2073 | 0.2630 | 0.2650 | 0.4228 | 0.6228 | 0.6228 | 0.8058 |
| 3 | 0.2592 | 0.2592 | 0.2152 | 0.2668 | 0.2591 | 0.4302 | 0.6302 | 0.6302 | 0.8118 |
| 4 | 0.2574 | 0.2574 | 0.2176 | 0.2679 | 0.2573 | 0.4324 | 0.6324 | 0.6324 | 0.8134 |
| 5 | 0.2569 | 0.2569 | 0.2184 | 0.2682 | 0.2568 | 0.4331 | 0.6331 | 0.6331 | 0.8141 |
| 6 | 0.2567 | 0.2567 | 0.2186 | 0.2683 | 0.2566 | 0.4333 | 0.6333 | 0.6333 | 0.8143 |
| 7 | 0.2567 | 0.2567 | 0.2187 | 0.2684 | 0.2567 | 0.4334 | 0.6334 | 0.6334 | 0.8144 |
| 8 | 0.2567 | 0.2567 | 0.2187 | 0.2684 | 0.2567 | 0.4334 | 0.6334 | 0.6334 | 0.8144 |
| Criteria | A1 | A2 | A3 | A4 | A5 | |
|---|---|---|---|---|---|---|
| Knowledge | ||||||
| Weight | (0.4332, 0.6332, 0.8142) | (0.6131, 0.7931, 0.9155) | (0.6002, 0.8002, 0.9503) | (0.6552, 0.8552, 0.9776) | (0.5686, 0.7686, 0.9158) | |
| K1 | (0.7065, 0.8837, 0.9516) | (0.5002, 0.7002, 0.8502) | (0.6001, 0.8001, 0.9501) | (0.6601, 0.8601, 0.9801) | (0.3572, 0.5476, 0.7287) | |
| K2 | (0.4332, 0.6334, 0.8142) | (0.6601, 0.8601, 0.9801) | (0.3576, 0.5574 0.7432) | (0.6601, 0.8601, 0.9801) | (0.3652, 0.5652, 0.7652) | |
| K3 | (0.3001, 0.5001, 0.7001) | (0.5883, 0.7402, 0.8443) | (0.6001, 0.8001, 0.9501) | (0.4586, 0.6584, 0.8586) | (0.4586, 0.6584, 0.8586) | |
| K4 | (0.6328, 0.8141, 0.9475) | (0.4001, 0.6001, 0.8001) | (0.5016, 0.7018, 0.8797) | (0.6601, 0.8601, 0.9801) | (0.4332, 0.6334, 0.8144) | |
| K5 | (0.3186, 0.5186, 0.7141) | (0.3436, 0.5436, 0.7436) | (0.5688, 0.7686, 0.9158) | (0.3652, 0.5652, 0.7652) | (0.5018, 0.7016, 0.8795) | |
| K6 | (0.6424, 0.8424, 0.9568) | (0.3574, 0.5576, 0.7432) | (0.2537, 0.4539, 0.6537) | (0.3001, 0.5001, 0.7001) | (0.4586, 0.6584, 0.8586) | |
| K7 | (0.2547, 0.4547, 0.6547) | (0.3204, 0.5203, 0.7032) | (0.5447, 0.7448, 0.9226) | (0.4561, 0.6564, 0.8562) | (0.346, 0.5436, 0.7436) | |
| K8 | (0.3416, 0.5414, 0.7416) | (0.5016, 0.7016, 0.8797) | (0.4001, 0.6001, 0.8001) | (0.2537, 0.4537, 0.6537) | (0.4023, 0.6025, 0.7811) | |
| K9 | (0.4332, 0.6332, 0.8142) | (0.6001, 0.8001, 0.9501) | (0.3574, 0.5574, 0.7432) | (0.3001, 0.5001, 0.7001) | (0.4586, 0.6584, 0.8586) | |
| KQFI | z | Result | Decision | ||||
|---|---|---|---|---|---|---|---|
| K1 | (0.5352, 0.7561, 0.9101) | (−0.1648, 0.1561, 0.4102) | (−0.0042, 0.2833) | (0.1415, 0.0023) | 0.9851 | >0.5 | Go |
| K2 | (0.4721, 0.7007, 0.8838) | (−0.1648, 0.1563, 0.4102) | (−0.0635, 0.2422) | (0.1213, 0.0317) | 0.7923 | >0.5 | Go |
| K3 | (0.4675, 0.6786, 0.8614) | (−0.2323, 0.0786, 0.3616) | (−0.0768, 0.2202) | (0.1101, 0.0385) | 0.7412 | >0.5 | Go |
| K4 | (0.5028, 0.7207, 0.8986) | (−0.1972, 0.1207, 0.3984) | (−0.0382, 0.2598) | (0.1297, 0.0192) | 0.8718 | >0.5 | Go |
| K5 | (0.4019, 0.6226, 0.8247) | (−0.2982, 0.0226, 0.3247) | (−0.1378, 0.1737) | (0.0868, 0.0688) | 0.5578 | >0.5 | Go |
| K6 | (0.3642, 0.5901, 0.7982) | (−0.3358, −0.0097, 0.2982) | (−0.1728, 0.1443) | (0.0722, 0.0865) | 0.4548 | <0.5 | No go |
| K7 | (0.3694, 0.5912,0.8047) | (−0.3306, −0.0088, 0.3047) | (−0.1698, 0.1481) | (0.0741, 0.0847) | 0.4657 | <0.5 | No go |
| K8 | (0.3646, 0.5791, 0.7831) | (−0.3354, −0.0207, 0.2831) | (−0.1782, 0.1312) | (0.0657, 0.0892) | 0.4241 | <0.5 | No go |
| K9 | (0.4092, 0.6272, 0.8276) | (−0.2909, 0.0273, 0.3276) | (−0.1318, 0.1775) | (0.0886, 0.0658) | 0.5736 | >0.5 | Go |
| Method | Expert Penal | Criteria | Weight | Knowledge Evaluation | Knowledge Quality | Go/No Threshold |
|---|---|---|---|---|---|---|
| Proposed | v | v | Linguistic assessment | direct | absolute | v |
| AHP | v | v | pairwise comparison | indirect | relative | x |
Disclaimer/Publisher’s Note: The statements, opinions and data contained in all publications are solely those of the individual author(s) and contributor(s) and not of MDPI and/or the editor(s). MDPI and/or the editor(s) disclaim responsibility for any injury to people or property resulting from any ideas, methods, instructions or products referred to in the content. |
© 2023 by the authors. Licensee MDPI, Basel, Switzerland. This article is an open access article distributed under the terms and conditions of the Creative Commons Attribution (CC BY) license (https://creativecommons.org/licenses/by/4.0/).
Share and Cite
Wei, C.-C.; Tai, C.-C.; Lee, S.-C.; Chang, M.-L. Assessing Knowledge Quality Using Fuzzy MCDM Model. Mathematics 2023, 11, 3673. https://doi.org/10.3390/math11173673
Wei C-C, Tai C-C, Lee S-C, Chang M-L. Assessing Knowledge Quality Using Fuzzy MCDM Model. Mathematics. 2023; 11(17):3673. https://doi.org/10.3390/math11173673
Chicago/Turabian StyleWei, Chiu-Chi, Chih-Chien Tai, Shun-Chin Lee, and Meng-Ling Chang. 2023. "Assessing Knowledge Quality Using Fuzzy MCDM Model" Mathematics 11, no. 17: 3673. https://doi.org/10.3390/math11173673
APA StyleWei, C.-C., Tai, C.-C., Lee, S.-C., & Chang, M.-L. (2023). Assessing Knowledge Quality Using Fuzzy MCDM Model. Mathematics, 11(17), 3673. https://doi.org/10.3390/math11173673