
Threat Hunting System for Protecting Critical Infrastructures Using a Machine Learning Approach

Abstract
1. Introduction
Paper Layout
2. Motivation and Previous Work
3. Machine Learning
3.1. Techniques
3.1.1. Clustering
K-Means
Affinity Propagation
Mean Shift
Spectral Clustering
Hierarchical Clustering
DBSCAN
3.1.2. Neural Network
LSTM RNN
BiLSTM
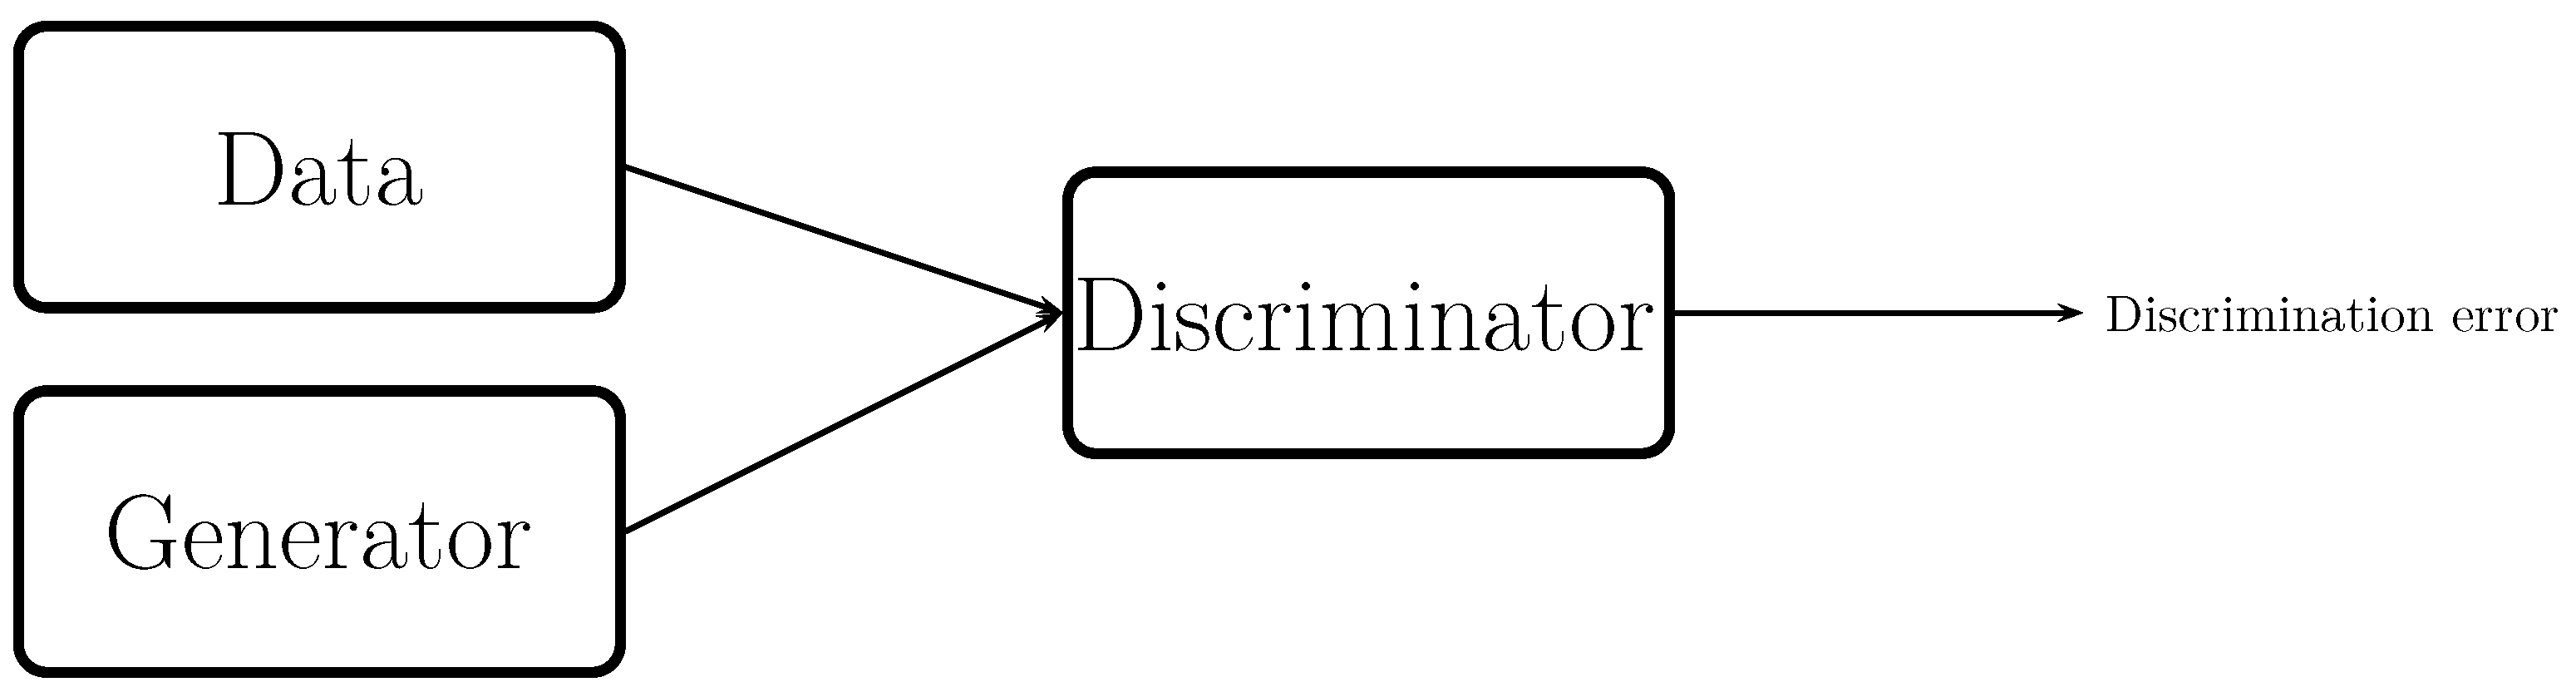
C-RNN-GAN
Graph Neural Networks
3.1.3. Natural Language Processing
BERT
TF-IDF
3.2. Comparison
3.3. Use Cases
3.3.1. TTP Discovery
3.3.2. Behaviour Analysis
3.3.3. Alert Priority
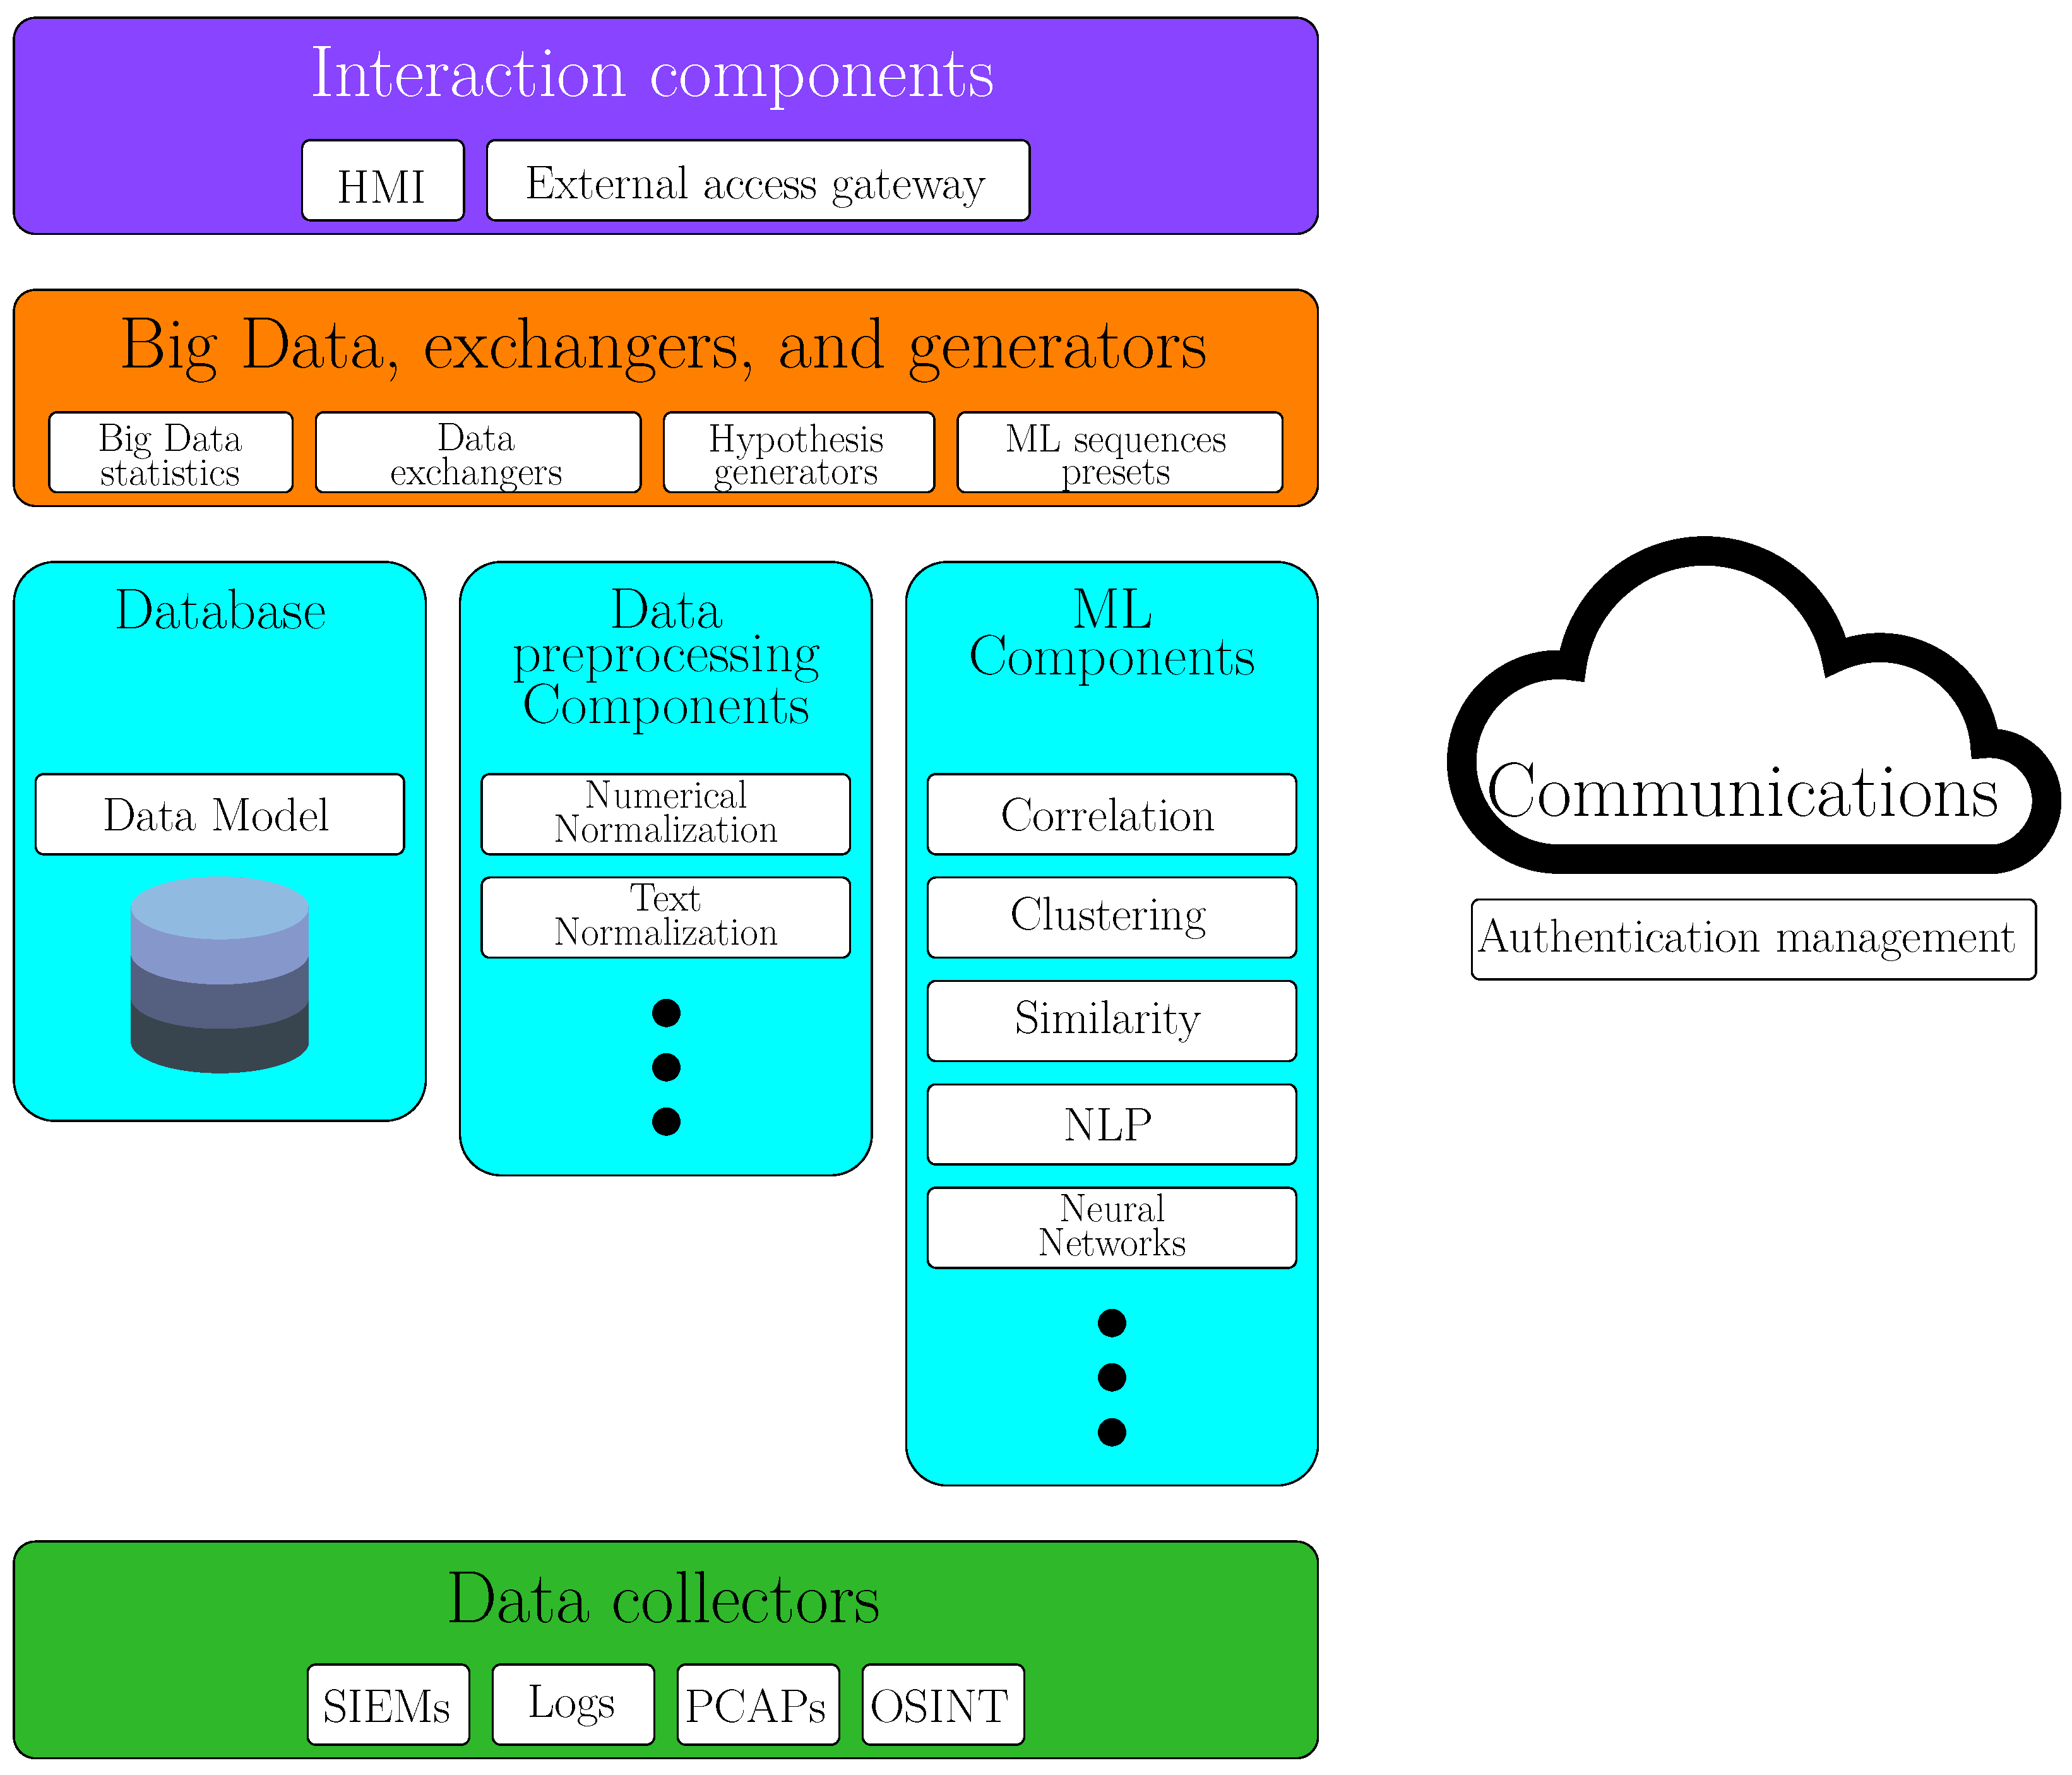
4. Prototype
4.1. Prototype Evaluation
- 16 CPU × 2.10 GHz;
- 140 GB RAM;
- 5 TB HDD;
- 6 CPU × 2.10 GHz;
- 32 GB RAM;
- 500 GB HDD;
- Main router;
- WAN network:
- -
- Attackers;
- Prototype network:
- -
- Data collectors;
- -
- Pre-processing components;
- -
- ML components;
- -
- ML sequence preset component;
- -
- Big Data components;
- -
- HMI component;
- -
- …
- Industrial network:
- -
- Modbus TCP devices;
- -
- Profinet devices;
- -
- KNX devices;
- -
- …
- Critical Infrastructure network:
- -
- Hosts with Linux;
- -
- Hosts with Windows;
- -
- Domain Controllers;
- -
- …
- DMZ:
- -
- Apache servers;
- -
- NGINX servers;
- -
- DNS servers;
- -
- Exchange servers;
- -
- …
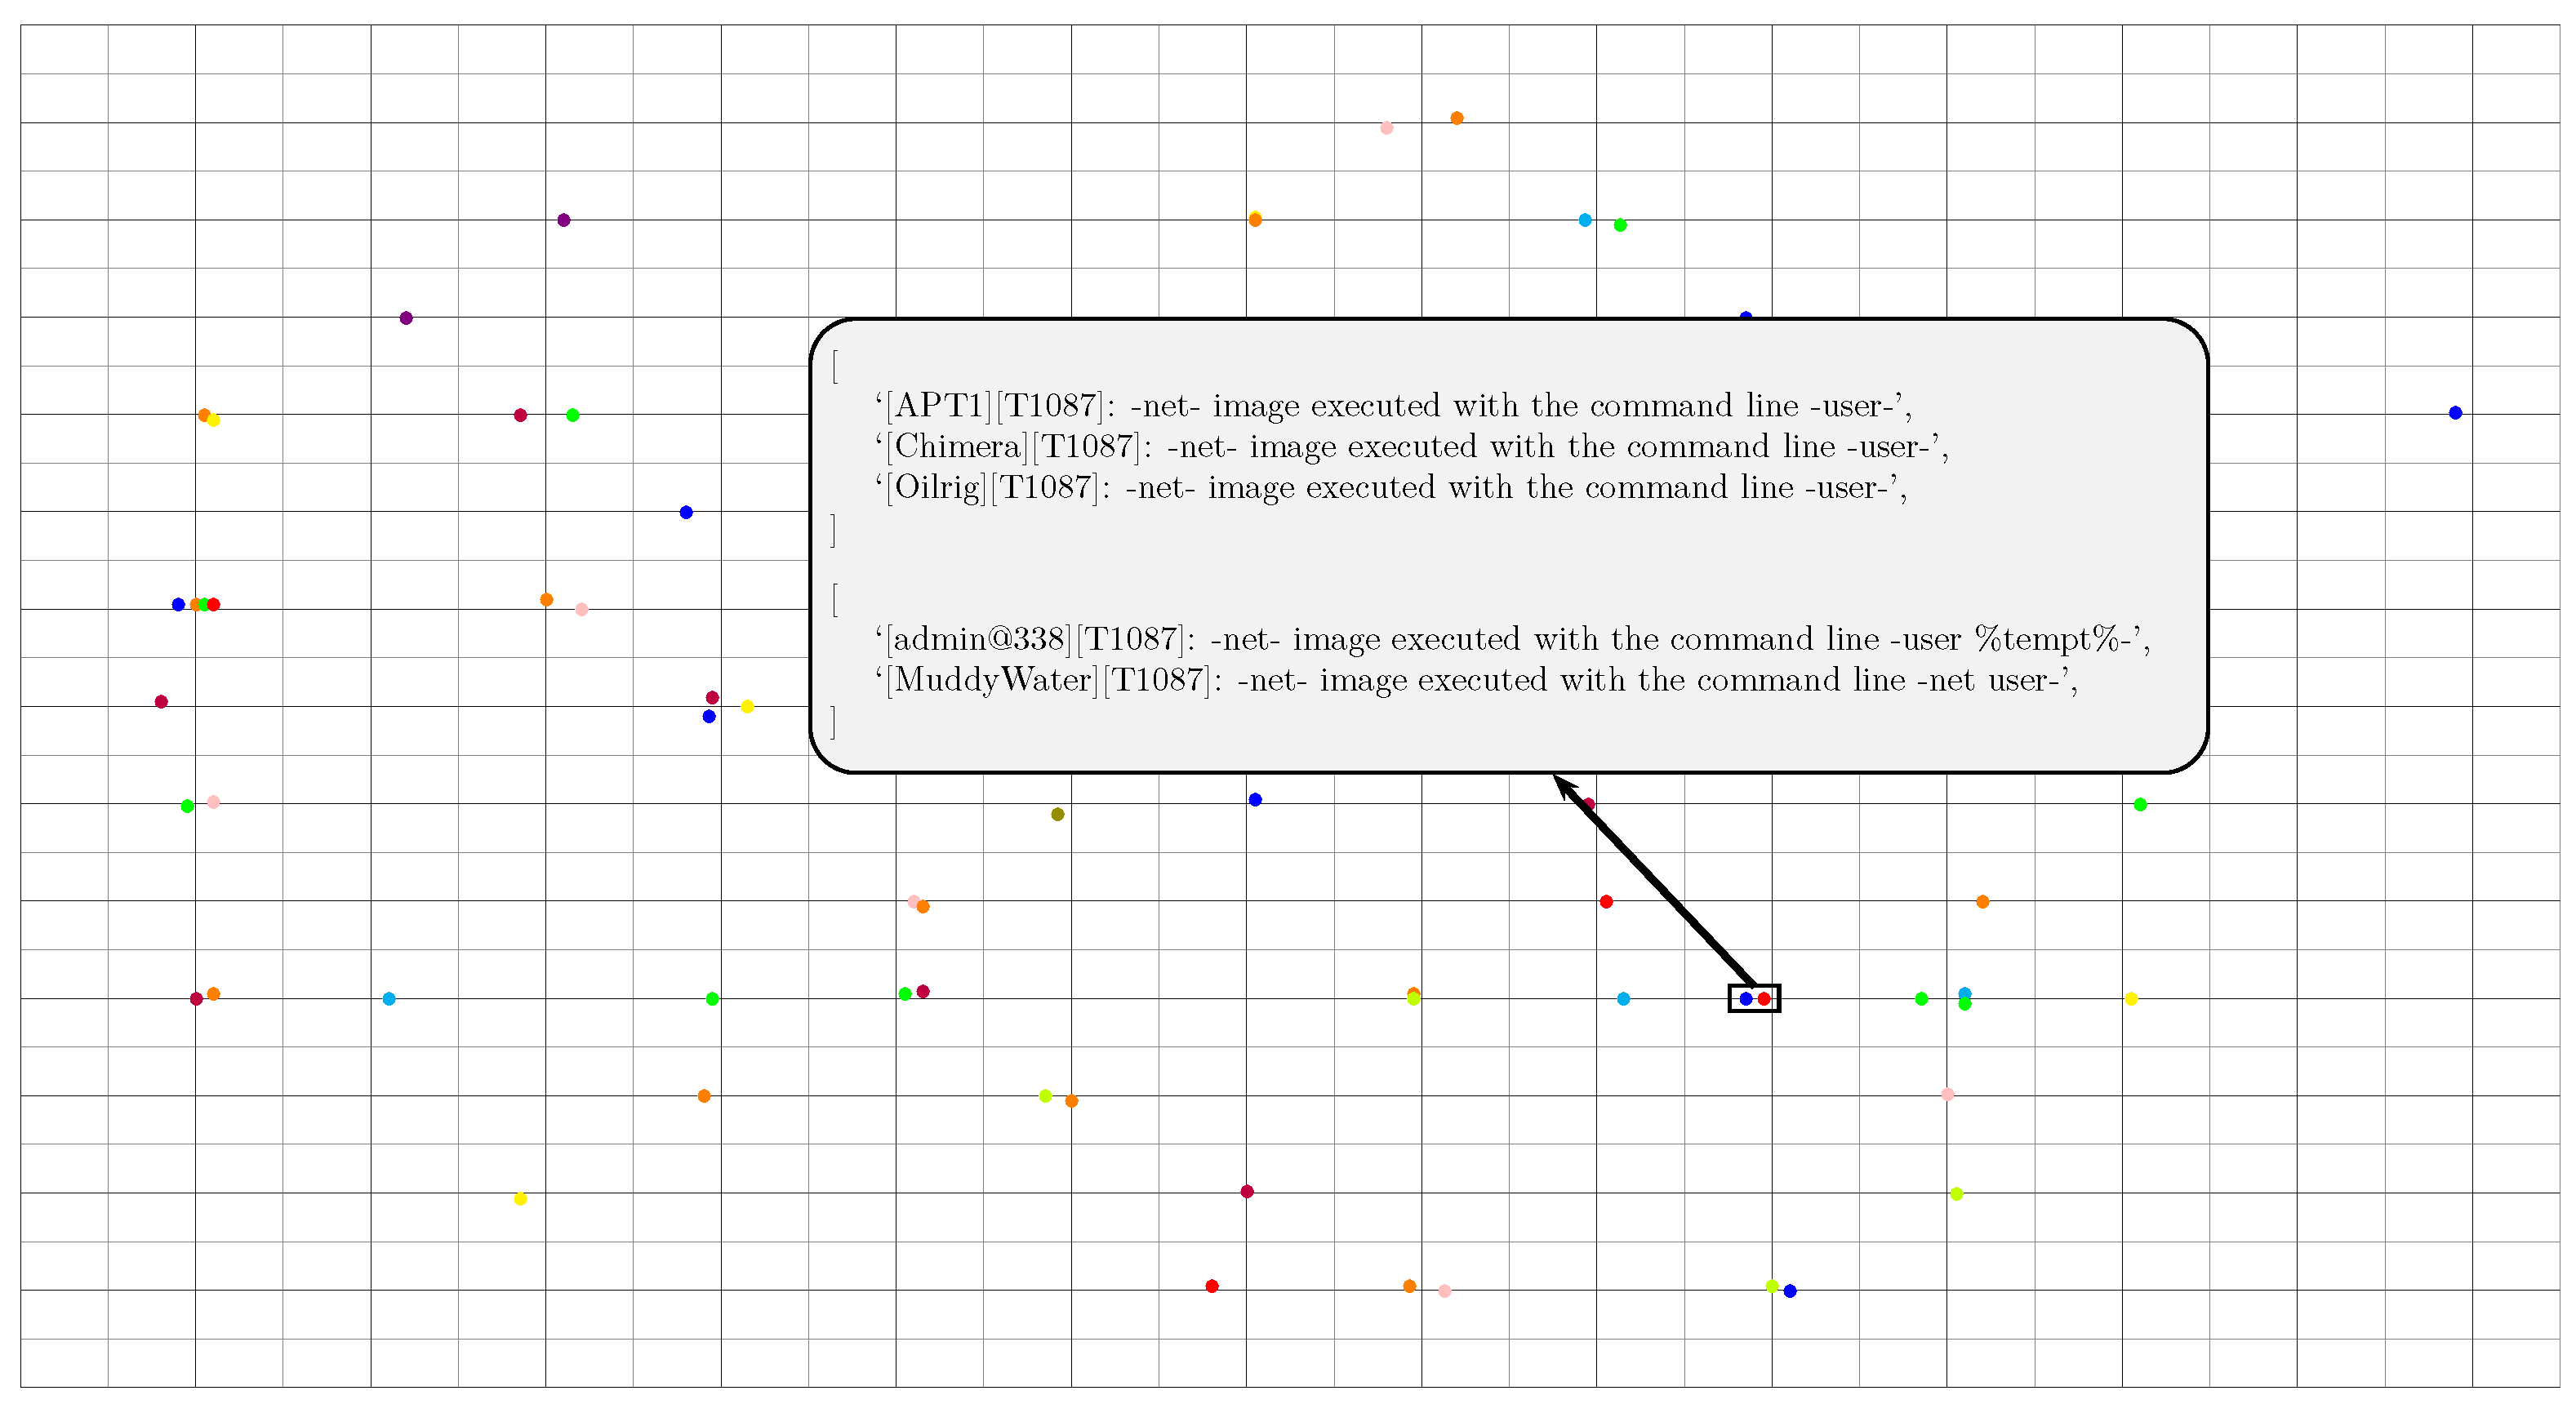
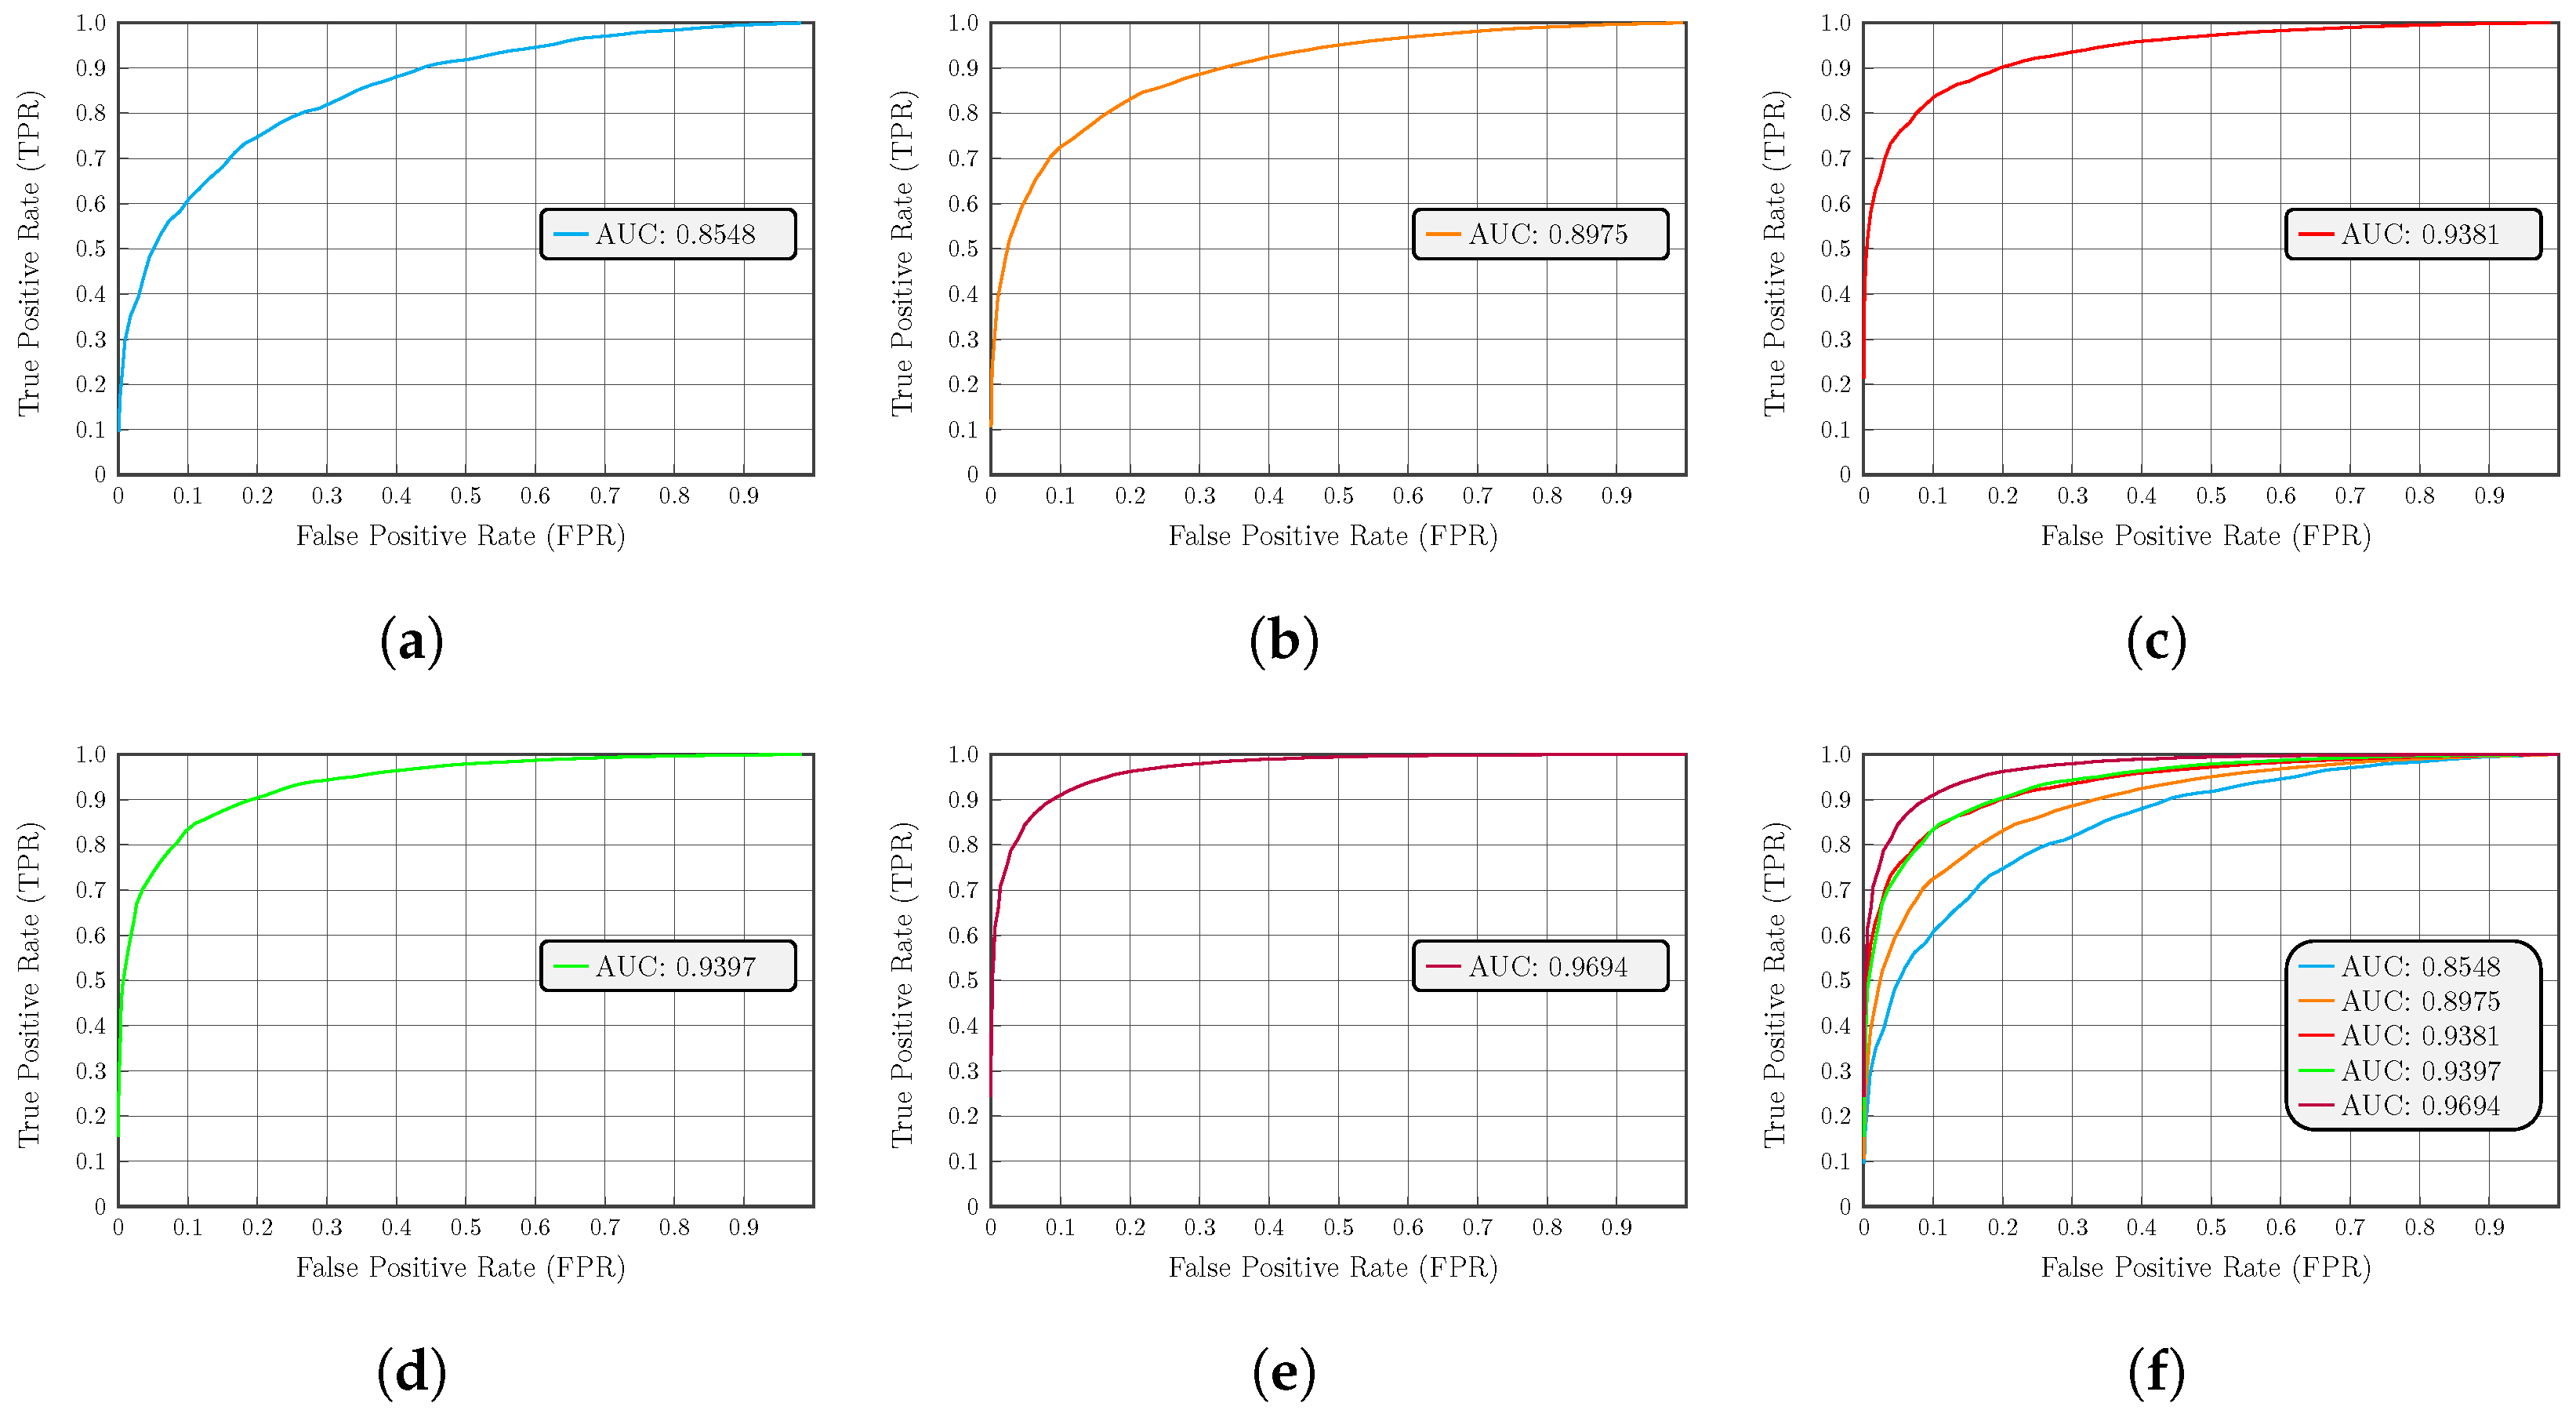
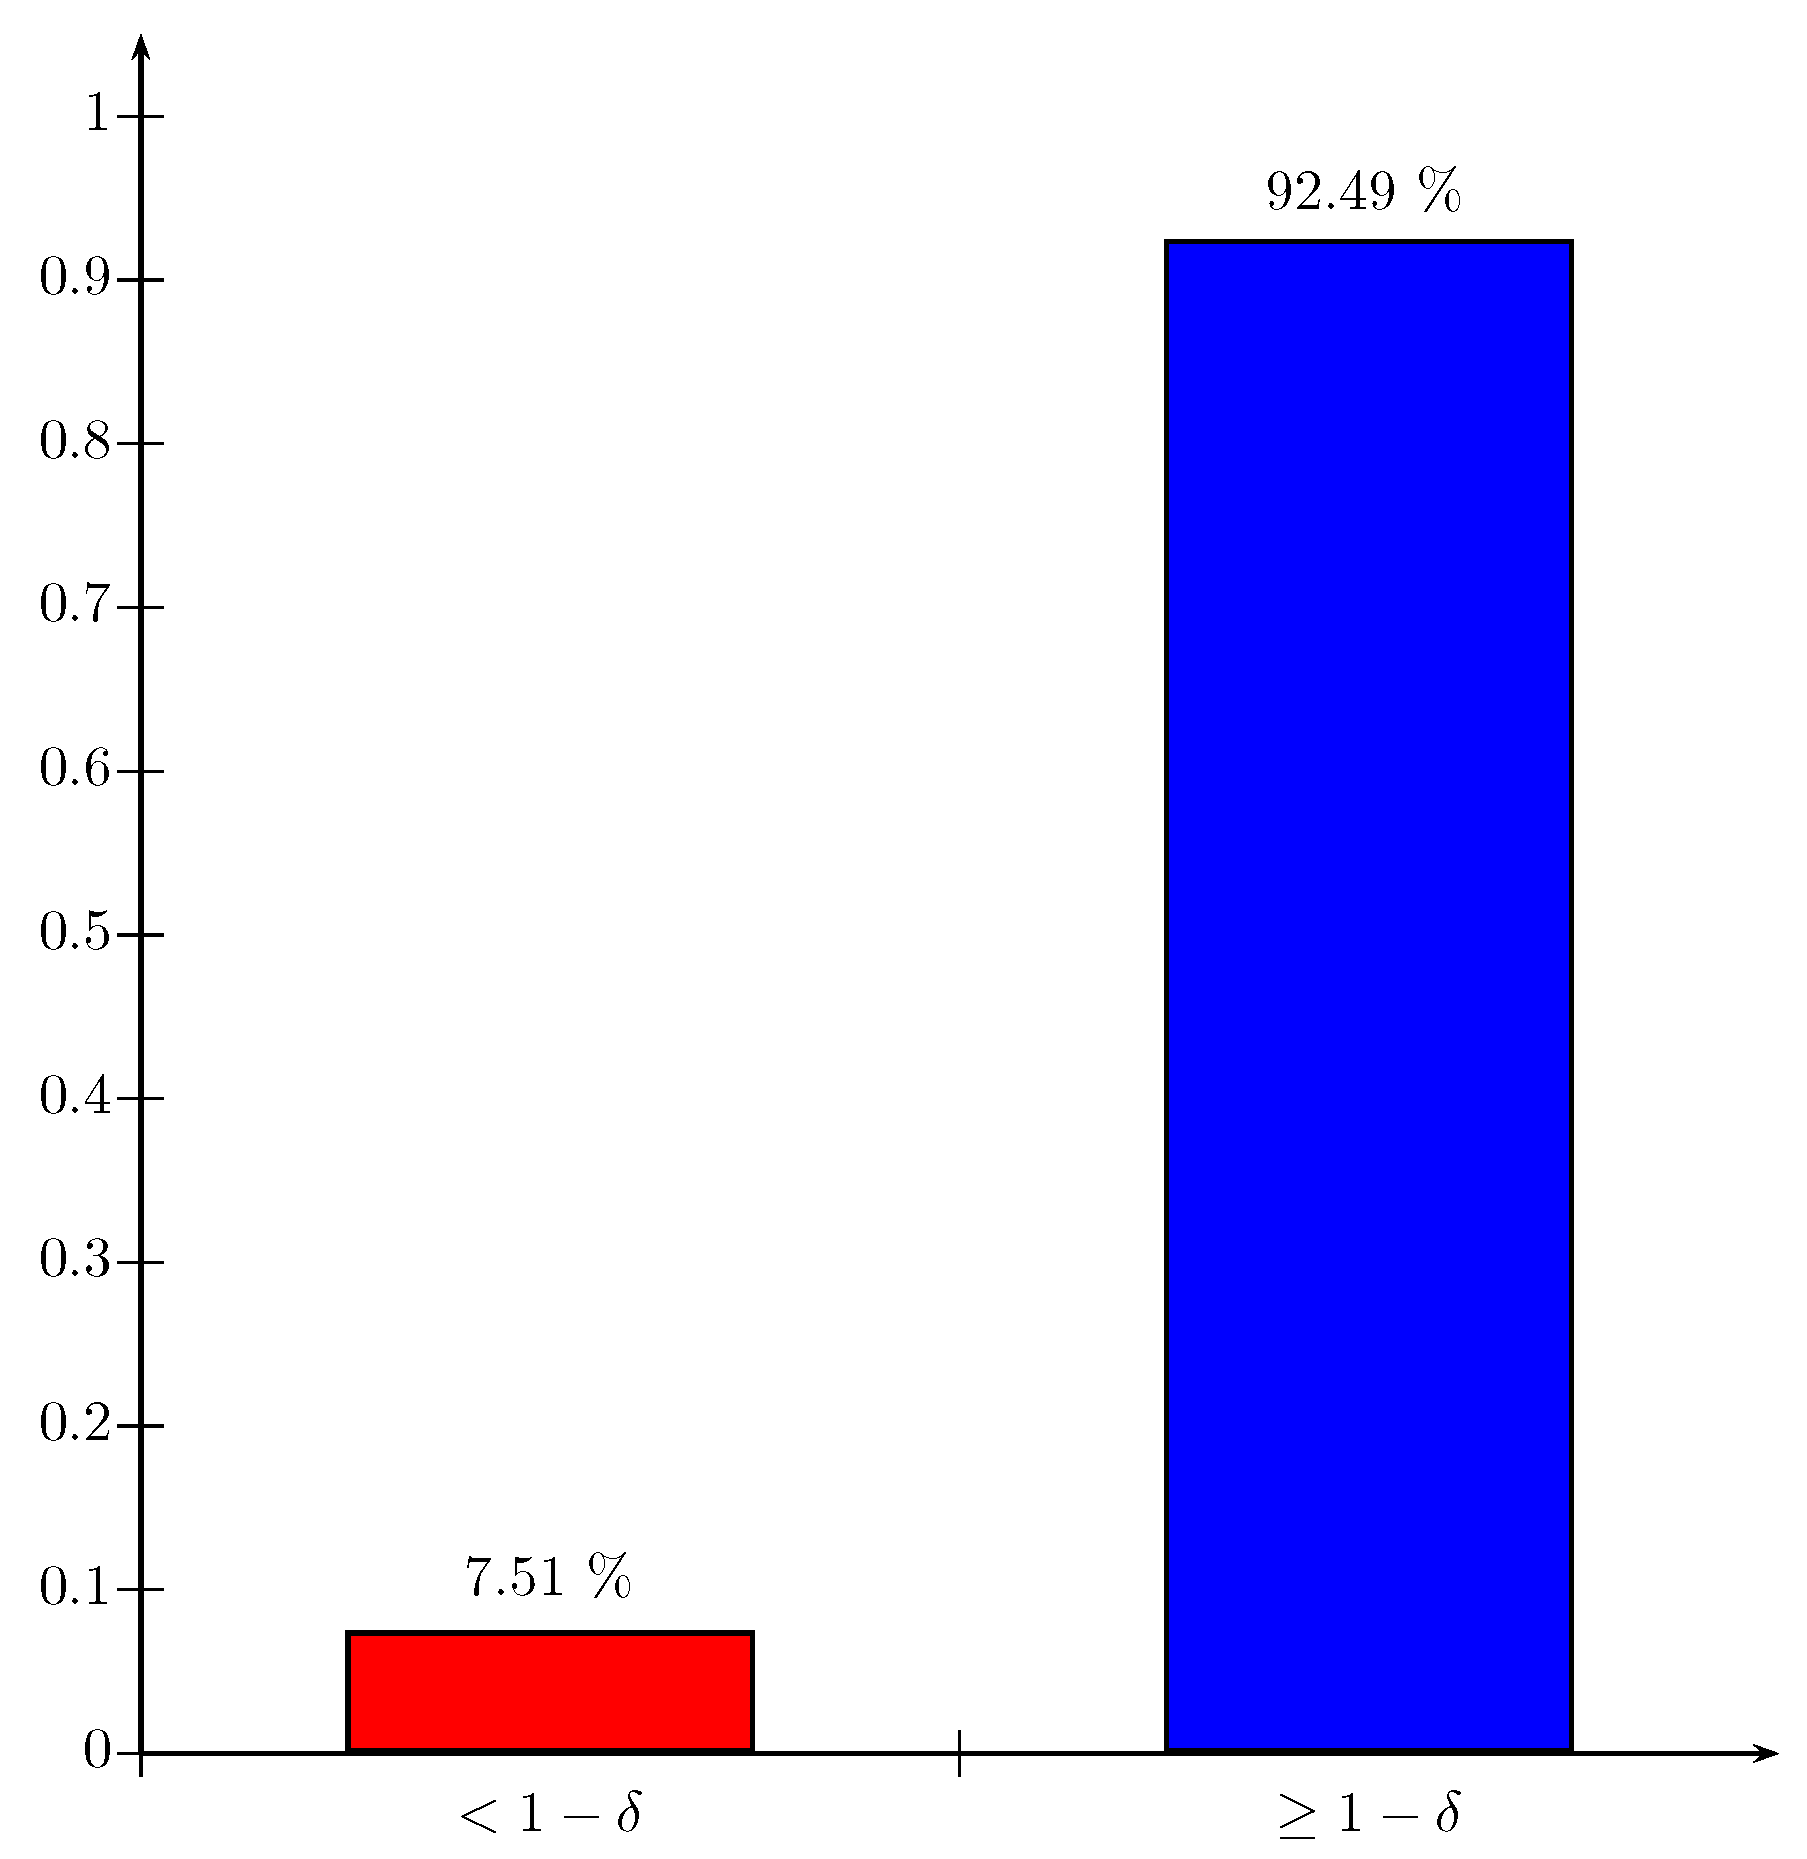
Prototype Evaluation Results
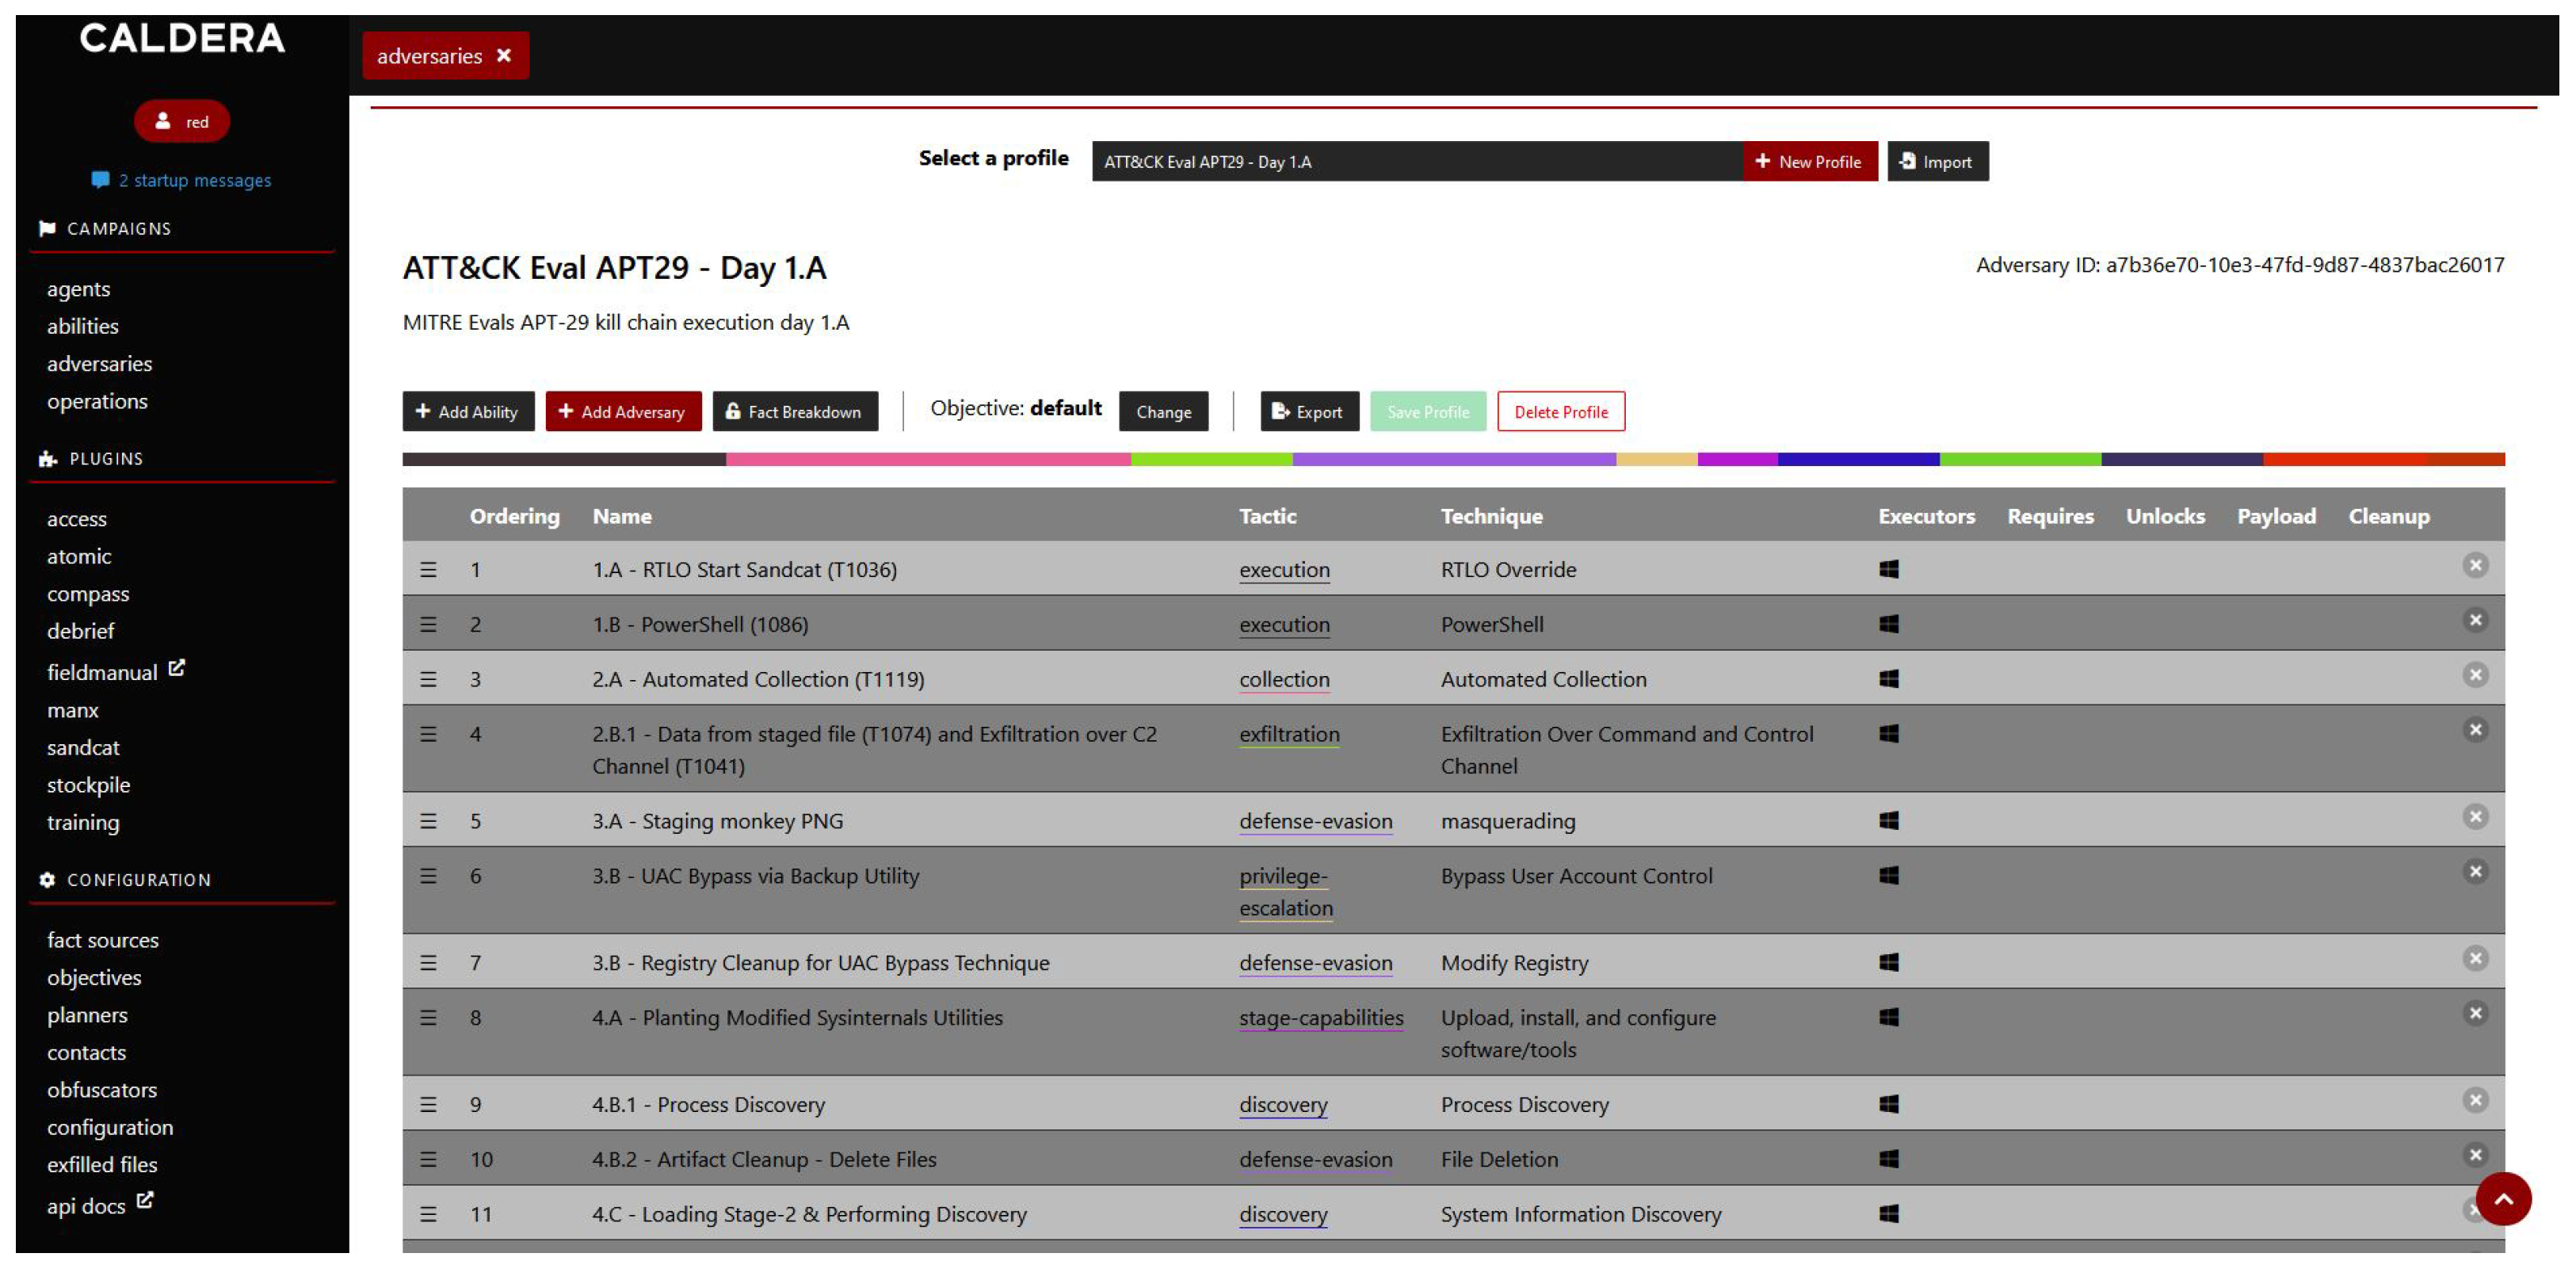
- RTLO Start Sandcat (T1036);
- PowerShell (T1086);
- Automated Collection (T1119);
- Data from staged file (T1074) and Exfiltration over C2 Channel (T1041);
- Staging Monkey PNG;
- UAC Bypass via Backup Utility;
- Registry Cleanup for UAC Bypass Technique;
- Planting Modified Sysinternals Utilities;
- Process Discovery;
- Artifact Cleanup—Delete Files;
- Persistent Service—1 and 2;
- Credentials in Files (T1081)—Chrome;
- Credentials in Files (T1081)—Private Keys Extraction;
- Staging Files for PowerShell Module Imports;
- Screen Capturing;
- Automated Collection (T1119)—Clipboard (T1115);
- Automated Collection (T1119)—Input Capture (T1417);
- Data from Staged File (T1074) and Exfiltration over C2 Channel (T1041);
- Remote System Discovery (T1018);
- Identifying Current User on Other Machines;
- Copy Sandcat File;
- Startup Folder Persistence Execution;
- Artifact Cleanup.
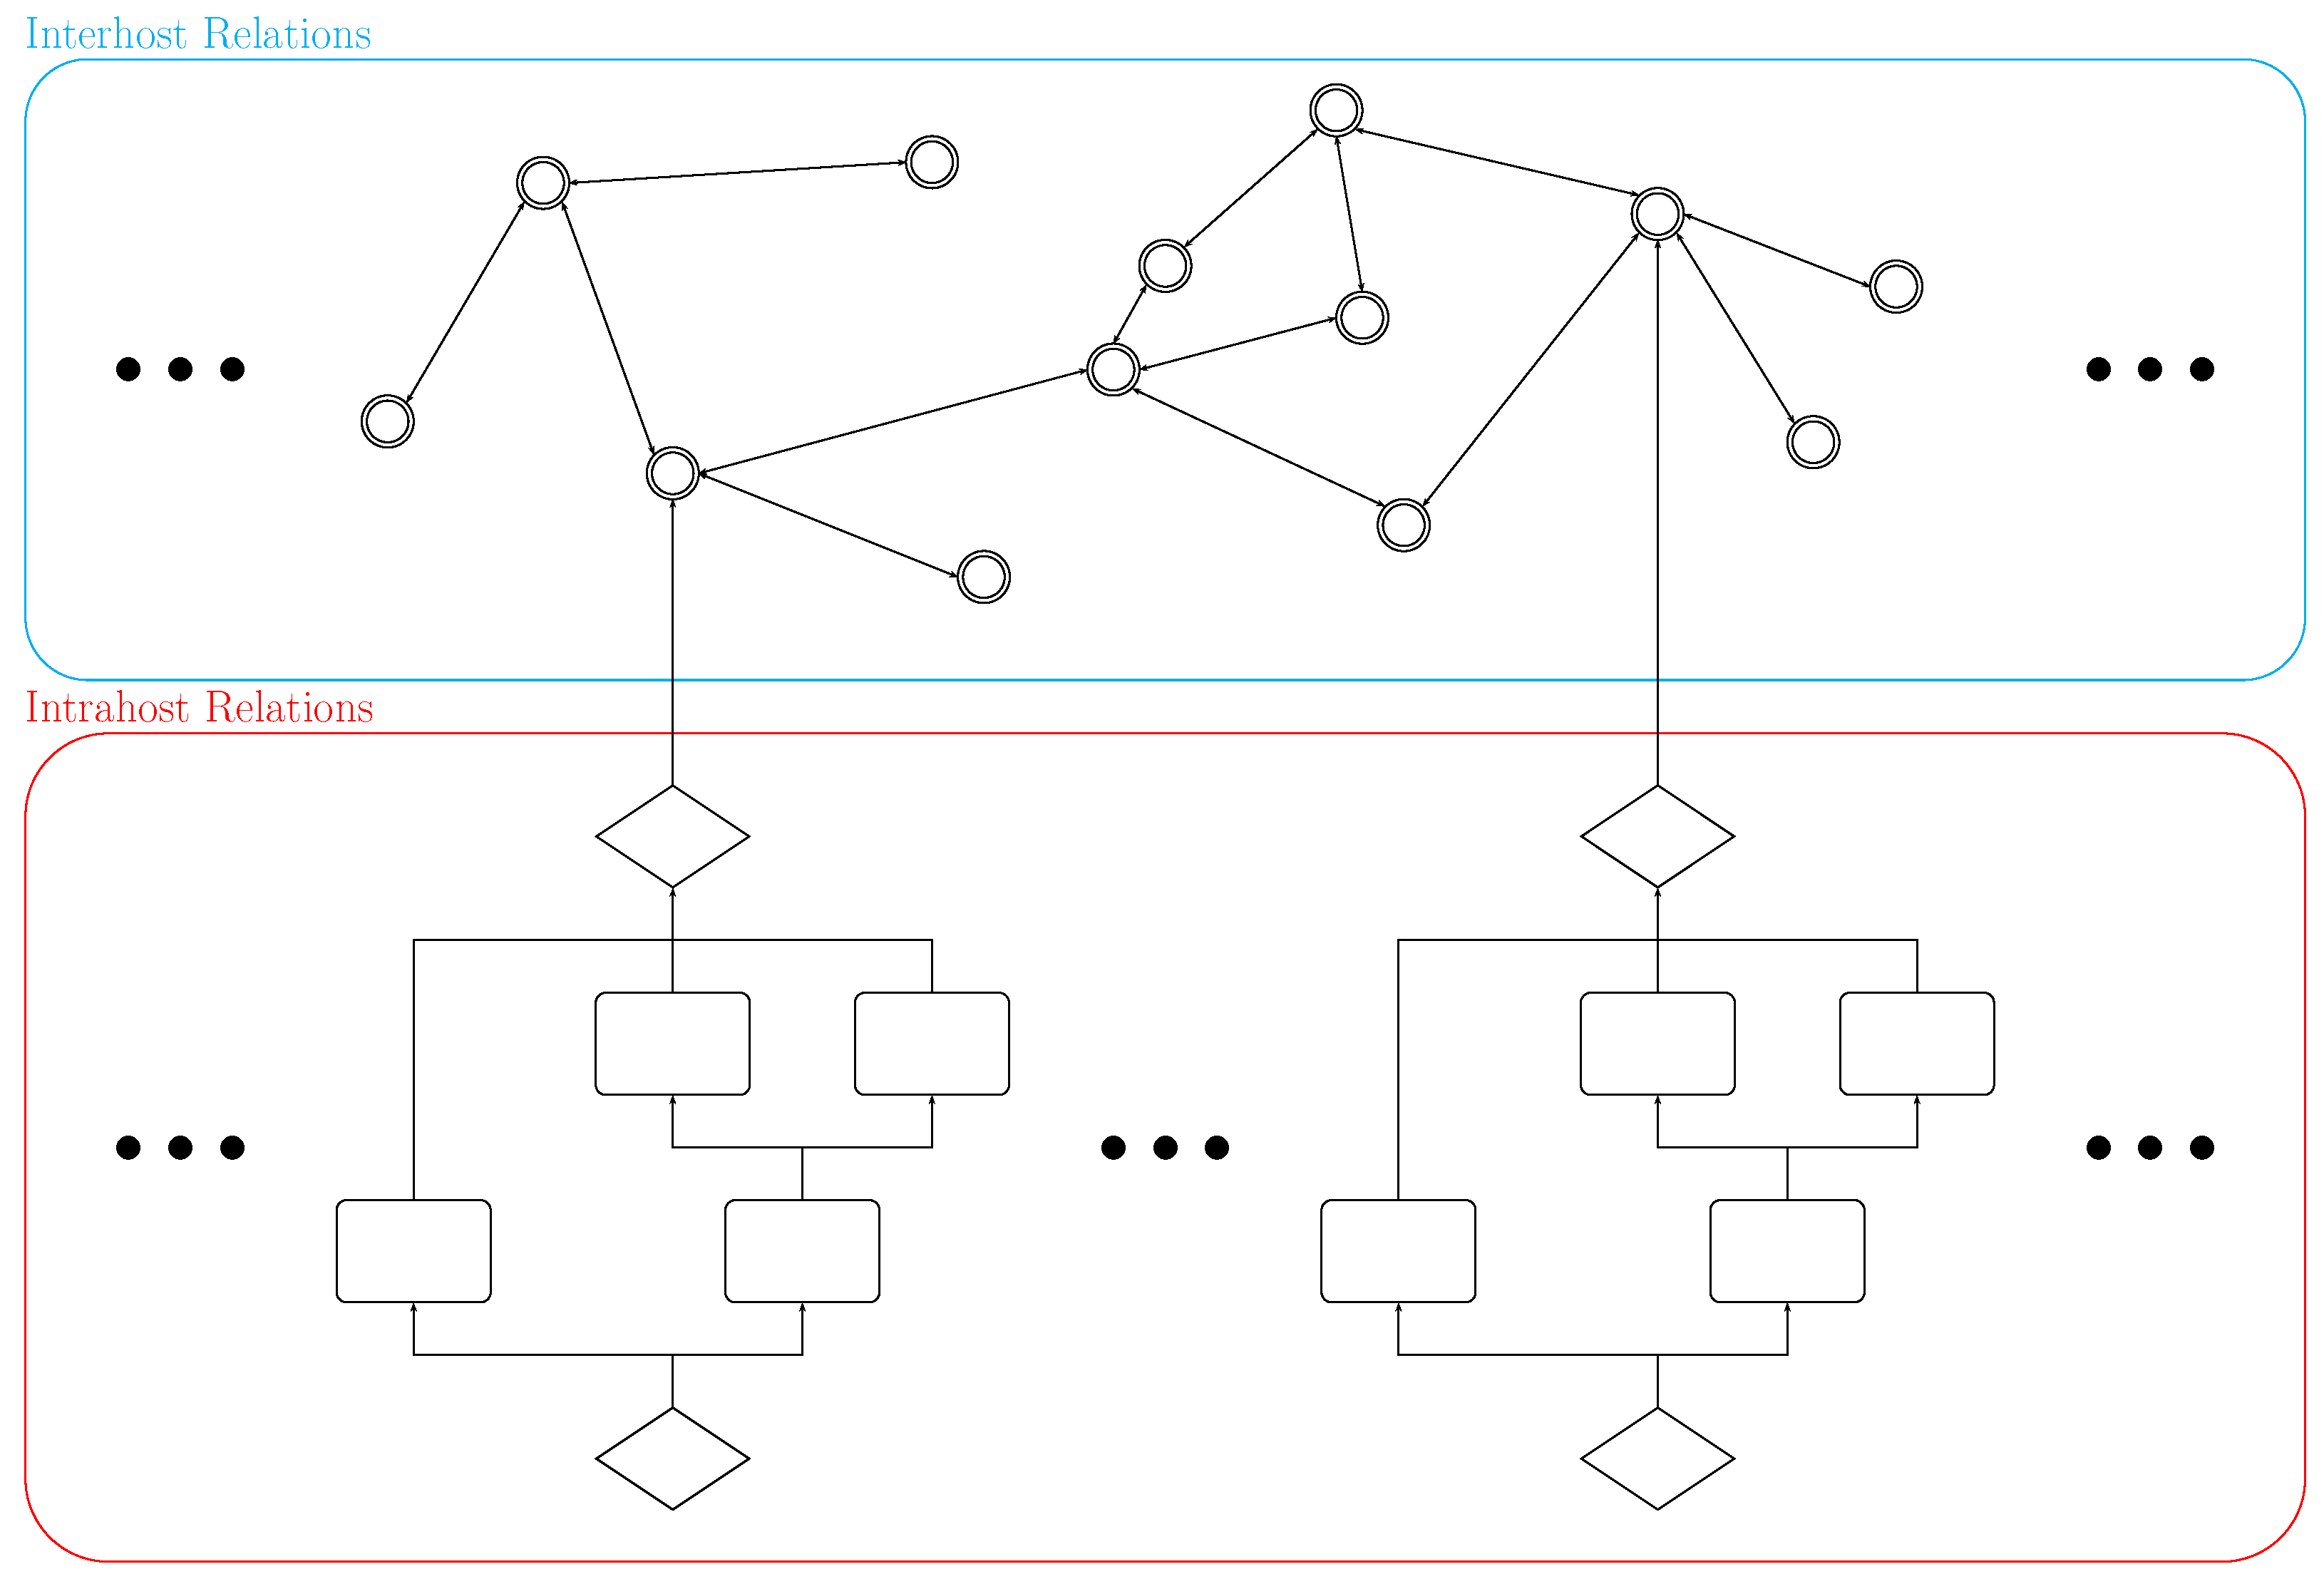
- is the probability of the edge to be taken;
- N is the number of available edges;
- There are 2 available edges and the given possibility for the detected edge is , the result would be ;
- There are 100 available edges and the given possibility for the detected edge is , the result would be ;
- There are 2 available edges and the given possibility for the detected edge is , the result would be .
- HTTP requests without previous DNS requests.
- Processes started without a known parent.
- Running processes with no footprint in the file system.
- Outbound persistent connections.
4.2. Prototype Improvements
5. Conclusions
Author Contributions
Funding
Institutional Review Board Statement
Informed Consent Statement
Data Availability Statement
Conflicts of Interest
Abbreviations
| APT | Advanced persistent threat |
| BERT | Bidirectional encoder representations from transformers |
| BiLSTM | Bidirectional LSTM |
| C-RNN-GAN | Continuous recurrent neural networks with adversarial training |
| CI | Critical infrastructures |
| DBSCAN | Density-based spatial clustering of applications with noise |
| DDoS | Distributed denial of service |
| DoS | Denial of service |
| FDBSCAN | Fast DBSCAN |
| GNN | Graph neural networks |
| IoC | Indicators of compromise |
| IoT | Internet of things |
| IP | Internet protocol |
| IT | Information technology |
| LSTM RNN | Long short-term memory recurrent neural network |
| ML | Machine learning |
| NLP | Natural language processing |
| RNN | Recurrent neural network |
| SDN | Software-defined networks |
| SIEM | Security information and event management |
| SME | Small and medium enterprise |
| TF-IDF | Term frequency inverse document frequency |
| TTP | Tactics, techniques, and procedures |
| VDBSCAN | Varied DBSCAN |
References
- PRAETORIAN. D3.1 Transitioning Risk Management. PRAETORIAN H2020 Project Deliverables. 2021; in press.
- Li, J.H. Cyber security meets artificial intelligence: A survey. Front. Inf. Technol. Electron. Eng. 2018, 19, 1462–1474. [Google Scholar] [CrossRef]
- Falandays, J.B.; Nguyen, B.; Spivey, M.J. Is prediction nothing more than multi-scale pattern completion of the future? Brain Res. 2021, 1768, 147578. [Google Scholar] [CrossRef]
- Federmeier, K.D. Thinking ahead: The role and roots of prediction in language comprehension. Psychophysiology 2007, 44, 491–505. [Google Scholar] [CrossRef] [PubMed]
- Riegler, A. The role of anticipation in cognition. In Proceedings of the AIP Conference Proceedings, Liege, Belgium, 7–12 August 2000; American Institute of Physics: Melville, NY, USA, 2001; Volume 573, pp. 534–541. [Google Scholar]
- Slattery, T.J.; Yates, M. Word skipping: Effects of word length, predictability, spelling and reading skill. Q. J. Exp. Psychol. 2018, 71, 250–259. [Google Scholar] [CrossRef] [PubMed]
- Lehner, P.; Seyed-Solorforough, M.M.; O’Connor, M.F.; Sak, S.; Mullin, T. Cognitive biases and time stress in team decision making. IEEE Trans. Syst. Man Cybern.-Part A Syst. Humans 1997, 27, 698–703. [Google Scholar] [CrossRef]
- Bilge, L.; Dumitraş, T. Before we knew it: An empirical study of zero-day attacks in the real world. In Proceedings of the 2012 ACM Conference on Computer and Communications Security, Raleigh, NC, USA, 16–12 October 2012; pp. 833–844. [Google Scholar]
- Jahromi, A.N.; Hashemi, S.; Dehghantanha, A.; Parizi, R.M.; Choo, K.K.R. An enhanced stacked LSTM method with no random initialization for malware threat hunting in safety and time-critical systems. IEEE Trans. Emerg. Top. Comput. Intell. 2020, 4, 630–640. [Google Scholar] [CrossRef]
- Schmitt, S. Advanced Threat Hunting over Software-Defined Networks in Smart Cities; University of Tennessee at Chattanooga: Chattanooga, TN, USA, 2018. [Google Scholar]
- Schmitt, S.; Kandah, F.I.; Brownell, D. Intelligent threat hunting in software-defined networking. In Proceedings of the 2019 IEEE International Conference on Consumer Electronics (ICCE), Las Vegas, NV, USA, 11–13 January 2019; pp. 1–5. [Google Scholar]
- HaddadPajouh, H.; Dehghantanha, A.; Khayami, R.; Choo, K.K.R. A deep recurrent neural network based approach for internet of things malware threat hunting. Future Gener. Comput. Syst. 2018, 85, 88–96. [Google Scholar] [CrossRef]
- Raju, A.D.; Abualhaol, I.Y.; Giagone, R.S.; Zhou, Y.; Huang, S. A survey on cross-architectural IoT malware threat hunting. IEEE Access 2021, 9, 91686–91709. [Google Scholar] [CrossRef]
- Xu, Z.; Qian, M. Predicting Popularity of Viral Content in Social Media through a Temporal-Spatial Cascade Convolutional Learning Framework. Mathematics 2023, 11, 3059. [Google Scholar] [CrossRef]
- Homayoun, S.; Dehghantanha, A.; Ahmadzadeh, M.; Hashemi, S.; Khayami, R. Know abnormal, find evil: Frequent pattern mining for ransomware threat hunting and intelligence. IEEE Trans. Emerg. Top. Comput. 2017, 8, 341–351. [Google Scholar] [CrossRef]
- Neto, A.J.H.; dos Santos, A.F.P. Cyber threat hunting through automated hypothesis and multi-criteria decision making. In Proceedings of the 2020 IEEE International Conference on Big Data (Big Data), Atlanta, GA, USA, 10–13 December 2020; pp. 1823–1830. [Google Scholar]
- Gonzalez-Granadillo, G.; Faiella, M.; Medeiros, I.; Azevedo, R.; Gonzalez-Zarzosa, S. ETIP: An Enriched Threat Intelligence Platform for improving OSINT correlation, analysis, visualization and sharing capabilities. J. Inf. Secur. Appl. 2021, 58, 102715. [Google Scholar] [CrossRef]
- Azevedo, R.; Medeiros, I.; Bessani, A. PURE: Generating quality threat intelligence by clustering and correlating OSINT. In Proceedings of the 2019 18th IEEE International Conference on Trust, Security and Privacy in Computing and Communications/13th IEEE International Conference on Big Data Science and Engineering (TrustCom/BigDataSE), Rotorua, New Zealand, 5–8 August 2019; pp. 483–490. [Google Scholar]
- Alves, F.; Ferreira, P.M.; Bessani, A. OSINT-based Data-driven Cybersecurity Discovery. In Proceedings of the 12th Eurosys Doctoral Conference, Porto, Portugal, 23 April 2018; pp. 1–5. [Google Scholar]
- Aragonés Lozano, M.; Pérez Llopis, I.; Esteve Domingo, M. Threat hunting architecture using a machine learning approach for critical infrastructures protection. Big Data Cogn. Comput. 2023, 7, 65. [Google Scholar] [CrossRef]
- Reed, J. Threat Hunting with ML: Another Reason to SMLE. Available online: https://www.splunk.com/en_us/blog/platform/threat-research-at-splunk-using-smle.html (accessed on 22 June 2023).
- Liang, J.; Kim, Y. Evolution of Firewalls: Toward Securer Network Using Next Generation Firewall. In Proceedings of the 2022 IEEE 12th Annual Computing and Communication Workshop and Conference (CCWC), Las Vegas, NV, USA, 26–29 January 2022; pp. 0752–0759. [Google Scholar]
- IBM X-Force Exchange. Available online: https://exchange.xforce.ibmcloud.com/ (accessed on 3 March 2023).
- The Security Immune System: An Integrated Approach to Protecting Your Organization. 2018. Available online: https://www.midlandinfosys.com/pdf/qradar-siem-cybersecurity-ai-products.pdf (accessed on 3 March 2023).
- Anomali ThreatStream: Automated Threat Intelligence Management at Scale. Available online: https://www.anomali.com/products/threatstream (accessed on 3 March 2023).
- Chinnasamy, P.; Deepalakshmi, P.; Dutta, A.K.; You, J.; Joshi, G.P. Ciphertext-policy attribute-based encryption for cloud storage: Toward data privacy and authentication in AI-enabled IoT system. Mathematics 2021, 10, 68. [Google Scholar] [CrossRef]
- Wei, P.; Wang, D.; Zhao, Y.; Tyagi, S.K.S.; Kumar, N. Blockchain data-based cloud data integrity protection mechanism. Future Gener. Comput. Syst. 2020, 102, 902–911. [Google Scholar] [CrossRef]
- Chinnasamy, P.; Albakri, A.; Khan, M.; Raja, A.A.; Kiran, A.; Babu, J.C. Smart Contract-Enabled Secure Sharing of Health Data for a Mobile Cloud-Based E-Health System. Appl. Sci. 2023, 13, 3970. [Google Scholar] [CrossRef]
- Hossain, M.; Abufardeh, S. A New Method of Calculating Squared Euclidean Distance (SED) Using pTree Technology and Its Performance Analysis. In Proceedings of the CATA, Honolulu, HI, USA, 18–20 March 2019; pp. 45–54. [Google Scholar]
- Ahmed, M.; Seraj, R.; Islam, S.M.S. The k-means algorithm: A comprehensive survey and performance evaluation. Electronics 2020, 9, 1295. [Google Scholar] [CrossRef]
- Zhao, W.L.; Deng, C.H.; Ngo, C.W. k-means: A revisit. Neurocomputing 2018, 291, 195–206. [Google Scholar] [CrossRef]
- Givoni, I.; Chung, C.; Frey, B.J. Hierarchical affinity propagation. arXiv 2012, arXiv:1202.3722. [Google Scholar]
- Wang, K.; Zhang, J.; Li, D.; Zhang, X.; Guo, T. Adaptive affinity propagation clustering. arXiv 2008, arXiv:0805.1096. [Google Scholar]
- Derpanis, K.G. Mean shift clustering. Lect. Notes 2005, 32, 1–4. [Google Scholar]
- DeMenthon, D.; Megret, R. Spatio-Temporal Segmentation of Video by Hierarchical Mean Shift Analysis; Computer Vision Laboratory, Center for Automation Research, University of Maryland: College Park, MD, USA, 2002. [Google Scholar]
- Von Luxburg, U. A tutorial on spectral clustering. Stat. Comput. 2007, 17, 395–416. [Google Scholar] [CrossRef]
- Nielsen, F.; Nielsen, F. Hierarchical clustering. In Introduction to HPC with MPI for Data Science; Springer: Berlin/Heidelberg, Germany, 2016; pp. 195–211. [Google Scholar]
- Murtagh, F.; Contreras, P. Algorithms for hierarchical clustering: An overview. Wiley Interdiscip. Rev. Data Min. Knowl. Discov. 2012, 2, 86–97. [Google Scholar] [CrossRef]
- Khan, K.; Rehman, S.U.; Aziz, K.; Fong, S.; Sarasvady, S. DBSCAN: Past, present and future. In Proceedings of the Fifth International Conference on the Applications of Digital Information and Web Technologies (ICADIWT 2014), Bangalore, India, 17–19 February 2014; pp. 232–238. [Google Scholar]
- Liu, P.; Zhou, D.; Wu, N. VDBSCAN: Varied density based spatial clustering of applications with noise. In Proceedings of the 2007 International Conference on Service Systems and Service Management, Chengdu, China, 9–11 June 2007; pp. 1–4. [Google Scholar]
- Zhou, S.; Zhou, A.; Jin, W.; Fan, Y.; Qian, W. FDBSCAN: A fast DBSCAN algorithm. J. Softw. 2000, 11, 735–744. [Google Scholar]
- Staudemeyer, R.C.; Morris, E.R. Understanding LSTM—A tutorial into long short-term memory recurrent neural networks. arXiv 2019, arXiv:1909.09586. [Google Scholar]
- Singh, K.; Grover, S.S.; Kumar, R.K. Cyber Security Vulnerability Detection Using Natural Language Processing. In Proceedings of the 2022 IEEE World AI IoT Congress (AIIoT), Seattle, WA, USA, 6–9 June 2022; pp. 174–178. [Google Scholar]
- Siami-Namini, S.; Tavakoli, N.; Namin, A.S. The performance of LSTM and BiLSTM in forecasting time series. In Proceedings of the 2019 IEEE International Conference on Big Data (Big Data), Los Angeles, CA, USA, 9–12 December 2019; pp. 3285–3292. [Google Scholar]
- Mogren, O. C-RNN-GAN: Continuous recurrent neural networks with adversarial training. arXiv 2016, arXiv:1611.09904. [Google Scholar]
- Yuan, H.; Yu, H.; Gui, S.; Ji, S. Explainability in graph neural networks: A taxonomic survey. IEEE Trans. Pattern Anal. Mach. Intell. 2022, 45, 5782–5799. [Google Scholar] [CrossRef]
- González-Carvajal, S.; Garrido-Merchán, E.C. Comparing BERT against traditional machine learning text classification. arXiv 2020, arXiv:2005.13012. [Google Scholar]
- Das, M.; Kamalanathan, S.; Alphonse, P. A Comparative Study on TF-IDF Feature Weighting Method and Its Analysis Using Unstructured Dataset. In Proceedings of the COLINS, Lviv, Ukraine, 22–23 April 2021; pp. 98–107. [Google Scholar]
- Lakshmanarao, A.; Babu, M.R.; Krishna, M.B. Malicious URL Detection using NLP, Machine Learning and FLASK. In Proceedings of the 2021 International Conference on Innovative Computing, Intelligent Communication and Smart Electrical Systems (ICSES), Chennai, India, 24–25 September 2021; pp. 1–4. [Google Scholar]
- Safavian, S.R.; Landgrebe, D. A survey of decision tree classifier methodology. IEEE Trans. Syst. Man Cybern. 1991, 21, 660–674. [Google Scholar] [CrossRef]
- Al-Shaer, R.; Spring, J.M.; Christou, E. Learning the associations of mitre att & ck adversarial techniques. In Proceedings of the 2020 IEEE Conference on Communications and Network Security (CNS), Avignon, France, 29 June–1 July 2020; pp. 1–9. [Google Scholar]
- Alexander, O.; Belisle, M.; Steele, J. MITRE ATT&CK for Industrial Control Systems: Design and Philosophy; The MITRE Corporation: Bedford, MA, USA, 2020. [Google Scholar]
- Ahmed, M.; Panda, S.; Xenakis, C.; Panaousis, E. MITRE ATT&CK-driven cyber risk assessment. In Proceedings of the 17th International Conference on Availability, Reliability and Security, Vienna, Austria, 23–26 August 2022; pp. 1–10. [Google Scholar]
- Cole, E. Advanced Persistent Threat: Understanding the Danger and How to Protect Your Organization; Syngress: Waltham, MA, USA, 2012. [Google Scholar]
- Orbinato, V.; Barbaraci, M.; Natella, R.; Cotroneo, D. Automatic Mapping of Unstructured Cyber Threat Intelligence: An Experimental Study. arXiv 2022, arXiv:2208.12144. [Google Scholar]
- Karbab, E.B.; Debbabi, M. Maldy: Portable, data-driven malware detection using natural language processing and machine learning techniques on behavioral analysis reports. Digit. Investig. 2019, 28, S77–S87. [Google Scholar] [CrossRef]
- Saad, S.; Traore, I.; Ghorbani, A.; Sayed, B.; Zhao, D.; Lu, W.; Felix, J.; Hakimian, P. Detecting P2P botnets through network behavior analysis and machine learning. In Proceedings of the 2011 Ninth Annual International Conference on Privacy, Security and Trust, Montreal, QC, Canada, 19–21 July 2011; pp. 174–180. [Google Scholar]
- G. Martín, A.; Fernández-Isabel, A.; Martín de Diego, I.; Beltrán, M. A survey for user behavior analysis based on machine learning techniques: Current models and applications. Appl. Intell. 2021, 51, 6029–6055. [Google Scholar] [CrossRef]
- Mohamed, N. Study of bypassing Microsoft Windows Security using the MITRE CALDERA framework. F1000Research 2022, 11, 422. [Google Scholar] [CrossRef] [PubMed]
- Li, W. Automatic Log Analysis Using Machine Learning: Awesome Automatic Log Analysis Version 2.0; Uppsala University: Uppsala, Sweden, 2013. [Google Scholar]
- Hoo, Z.H.; Candlish, J.; Teare, D. What Is an ROC Curve? Emerg. Med. J. 2017, 34, 357–359. [Google Scholar] [CrossRef] [PubMed]
- Long, M. Adversary Emulation Library. Available online: https://github.com/center-for-threat-informed-defense/adversary_emulation_library (accessed on 22 June 2023).
- Li, Z.; Cheng, X.; Sun, L.; Zhang, J.; Chen, B. A hierarchical approach for advanced persistent threat detection with attention-based graph neural networks. Secur. Commun. Netw. 2021, 2021, 9961342. [Google Scholar] [CrossRef]


| Technique | Type | Parameters | Supervised |
|---|---|---|---|
| K-means | Clustering | Yes | No |
| Affinity Propagation | Clustering | Yes | No |
| Mean Shift | Clustering | No | No |
| Spectral Clustering | Clustering | Yes | No |
| Hierarchical Clustering | Clustering | Yes | No |
| DBSCAN | Clustering | Yes | No |
| LSTM RNN | Neural Network | Yes | No |
| BiLSTM | Neural Network | Yes | No |
| C-RNN-GAN | Neural Network | Yes | No |
| GNN | Neural Network | Yes | No |
| BERT | NLP | Yes | No |
| TF-IDF | NLP | Yes | No |
Disclaimer/Publisher’s Note: The statements, opinions and data contained in all publications are solely those of the individual author(s) and contributor(s) and not of MDPI and/or the editor(s). MDPI and/or the editor(s) disclaim responsibility for any injury to people or property resulting from any ideas, methods, instructions or products referred to in the content. |
© 2023 by the authors. Licensee MDPI, Basel, Switzerland. This article is an open access article distributed under the terms and conditions of the Creative Commons Attribution (CC BY) license (https://creativecommons.org/licenses/by/4.0/).
Share and Cite
Aragonés Lozano, M.; Pérez Llopis, I.; Esteve Domingo, M. Threat Hunting System for Protecting Critical Infrastructures Using a Machine Learning Approach. Mathematics 2023, 11, 3448. https://doi.org/10.3390/math11163448
Aragonés Lozano M, Pérez Llopis I, Esteve Domingo M. Threat Hunting System for Protecting Critical Infrastructures Using a Machine Learning Approach. Mathematics. 2023; 11(16):3448. https://doi.org/10.3390/math11163448
Chicago/Turabian StyleAragonés Lozano, Mario, Israel Pérez Llopis, and Manuel Esteve Domingo. 2023. "Threat Hunting System for Protecting Critical Infrastructures Using a Machine Learning Approach" Mathematics 11, no. 16: 3448. https://doi.org/10.3390/math11163448
APA StyleAragonés Lozano, M., Pérez Llopis, I., & Esteve Domingo, M. (2023). Threat Hunting System for Protecting Critical Infrastructures Using a Machine Learning Approach. Mathematics, 11(16), 3448. https://doi.org/10.3390/math11163448