Abstract
With the rapid increase in data scale, real-world datasets tend to exhibit long-tailed class distributions (i.e., a few classes account for most of the data, while most classes contain only a few data points). General solutions typically exploit class rebalancing strategies involving resampling and reweighting based on the sample number for each class. In this work, we explore an orthogonal direction, category splitting, which is motivated by the empirical observation that naive splitting of majority samples could alleviate the heavy imbalance between majority and minority classes. To this end, we propose a novel classwise splitting (CWS) method built upon a dynamic cluster, where classwise prototypes are updated using a moving average technique. CWS generates intra-class pseudo labels for splitting intra-class samples based on the point-to-point distance. Moreover, a group mapping module was developed to recover the ground truth of the training samples. CWS can be plugged into any existing method as a complement. Comprehensive experiments were conducted on artificially induced long-tailed image classification datasets, such as CIFAR-10-LT, CIFAR-100-LT, and OCTMNIST. Our results show that when trained with the proposed class-balanced loss, the network is able to achieve significant performance gains on long-tailed datasets.
Keywords:
deep learning; class-imbalance learning; feature clustering; long-tailed classification; classwise splitting MSC:
68T07
1. Introduction
With the emergence of large-scale and high-quality datasets, such as ImageNet [1] and COCO [2], deep neural networks (DNNs) have achieved resounding success in many visual discriminative tasks, including image recognition, object detection, and semantic segmentation. Most existing datasets are carefully well-designed and maintain a roughly balanced distribution over different categories. However, real-world datasets typically exhibit long-tailed data distributions [3,4], where a few classes occupy plenty of samples but the others are associated with only a few samples. Learning in such a real-world scenario is challenging due to the biased training of high-frequency ones, which undoubtedly hinders the practical applications of DNNs with significant performance degradation [5,6].
To tackle the imbalanced problem, early rebalancing strategies mainly focus on resampling [7,8] and reweighting [9,10] to pay more attention to minority classes. The intuition behind the above methods is to adjust the training data distribution based on importance estimation. Then, logit-based regularization was introduced to calibrate the shifted distribution between the training test data, encouraging the large margins for minority classes. These strategies could improve recognition performance for minority categories; however, the majority categories easily suffer from relatively lower accuracy because of over-emphasizing minority samples. Recently, it was indicated that the mismatch between representative and classifier learning plays a vital role in long-tailed recognition [11,12,13]. Thus, a two-stage training strategy was developed to decouple feature and classifier learning and has led to significant improvement over joint training. Motivated by this finding, the recent state-of-the-art performance has been attained through either self-supervised pretraining to obtain high-quality representations or employing ensemble experts for fair classifiers, implicitly increasing the training cost [14].
In this work, we argue that better representations and fair classifiers could be jointly obtained by decomposing majority classes into smaller ones. We observe that a naively trained model on decomposed classes with roughly balanced distribution has better recognition performance with respect to the original label space. This motivates our work to incorporate decomposed classes (called the classwise splitting trick) into the end-to-end training mode, while maintaining the original label space for long-tailed recognition. To this end, we exploit three simple techniques to balance both representations and classifiers. We first explore online clustering to split majority classes for balancing representative learning. Then, intra-class clusters are maintained via the moving average approach to reduce computational costs. Finally, a group mapping module is formulated to recover the original label space for balancing classifier learning. Please refer to Figure 1 for an overall framework of our work.
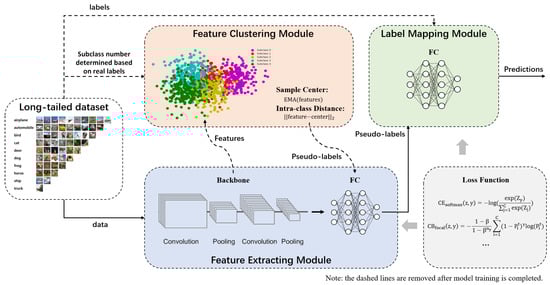
Figure 1.
Overall architecture of the classwise splitting (CWS) method. The framework contains three parts: a feature-extracting module, a feature clustering module, and a label-mapping module. During training, the feature-extracting module uses the backbone network to extract the features of input images, and then the feature clustering module assigns pseudo-labels to the features according to their intra-class distances, and finally the feature mapping module maps the pseudo-labels to real labels. During inference, the feature clustering module will be removed.
The main contributions can be summarized as follows: (1) We design a novel framework to improve the classification of long-tailed datasets by proposing a classwise splitting (CWS) method. (2) Our framework can achieve significant performance improvement by clustering majority categories into several subclasses, assigning pseudo-labels, and then mapping the predictions to the real labels. (3) Experiments show that our framework can be used as a generic method for visual recognition by outperforming the previous state-of-the-art performances on long-tailed CIFAR-10 and CIFAR-100 datasets [15].
2. Related Works
Most of the previous efforts on long-tailed datasets could be divided into two regimes: resampling [7,8] and reweighting [9,10].
Resampling. Resampling is a data-level method widely used to address the problem of imbalanced classification. It adjusts the training data distribution by undersampling the majority categories or oversampling the minority categories [16]. However, it is difficult to reconcile the classification performance of the majority and minority categories. Oversampling can easily lead to the overfitting of samples, while undersampling can lead to the loss of some useful information. The more imbalanced the dataset, the more pronounced the shortcomings of the resampling strategy.
Reweighting. Reweighting is a class-level method that is widely used to address the problem of imbalance learning by modulating the weighting factors of categories in the data [17]. The common reweighting methods include focal loss [18], class-balanced (CB) loss [19], and label-distribution-aware margin (LDAM) loss [20]. Among them, focal loss applies a moderation term to cross-entropy loss, focusing on learning the minority categories in the imbalanced dataset. CB loss introduces the effective number to approximate the expected volume of samples of each category instead of the label frequency. LDAM loss addresses the overfitting of the majority categories by regularizing the margins.
Two-stage Training Strategy. The two-stage training strategy was initially used to solve the conflict problem arising from different rebalancing strategies. Due to the overlapping effects between different rebalancing strategies, directly combining two rebalancing strategies for long-tailed data classification tasks will significantly reduce the model’s generalization ability [20,21]. Kang et al. [13] applied this strategy to decoupling training, which divides the original joint training method into two stages of training, greatly reducing the degree of coupling between different modules of the model, and allowing the network to search for parameters with stronger generalization ability during the training process. Here, inspired by this strategy, we also adopted a similar approach to [22] to achieve this goal.
Clustering For Classification. Clustering is a typical unsupervised learning method, whose core idea is to divide the whole sample set into multiple disjoint subsets by comparing the distances of samples in a low-dimensional space, so as to complete the classification [23,24]. The imbalance classification task based on clustering has been widely studied in recent years [25,26]. Singh et al. [27] use the distance between a minority class sample and its respective cluster centroid to infer the number of new samples. Swarnalatha et al. [6,28] divide each class into smaller subclasses, and then classify them based on feature metrics to achieve compactness. Indeed, clustering-based methods have proven to be helpful in addressing class imbalance problems in the past. However, they mainly obtain fine subclasses by clustering the samples directly, and the subclass centers are usually invariant in the subsequent training tasks. These static clustering methods may limit the upper optimization of network parameters. Therefore, inspired by previous research, we embed clustering techniques into the training process of deep neural networks, using the extracted features for dynamical clustering to obtain pseudo-labels, which in turn are used to train deep neural networks. Finally, a mapping network is used to establish the correspondence between the pseudo-labels and the real labels.
3. Method
Preliminaries. Given a training set with N training samples, the represents the i-th training sample and represents the corresponding label. The total number of training samples is , where C denotes the total number of categories and denotes the number of training samples of the c-th class. The general assumption of long-tailed distribution is that the classes are sorted in decreasing order of the sample number. Assume that the training sample numbers of the and classes are denoted as and , respectively, then if . In this case, the target of the recognition task for long-tailed distributed data is to learn a deep neural network with parameter , which can achieve good recognition performance on a balanced test set.
Given a training sample , the network predicts its label , where the prediction error between and the ground truth is calculated using a cost function , e.g., a cross-entropy (CE) loss. To train the network , we optimize by minimizing over the whole training set D:
Naively solving Equation (1) produces an imbalanced feature distribution that has biased decision boundaries toward common classes. Therefore, we are motivated to learn a balanced feature extractor by splitting majority classes into sub-classes. Such artificially balanced label distributions can also balance the weights of the classifier for sub-classes, then we can transform this pseudo label space into the original one via a mapping module. The proposed framework is shown in Figure 1.
Our proposed method mainly contains three modules: a feature-extracting module, a feature clustering module, and a label-mapping module. In order to realize the collaborative training of multiple modules, we combine unsupervised learning (clustering techniques) with supervised learning to propose a two-stage classification algorithm. In the first stage, the feature-extracting module uses a backbone network to extract features from input images, and the feature clustering module uses clustering technique to assign pseudo-labels to these features, which are used in the training of the feature-extracting module. We use the pseudo-labels as input to the label-mapping module and then use ground truth labels to train this module.
3.1. Feature Clustering Module
The role of the feature clustering module is to cluster the features into a specified number of subclasses and assign unique pseudo-labels to them. Specifically, during training, a CNN backbone is used to extract the embeddings of training samples. Then features belonging to the same category are divided into several subclasses according to their distance away from the sample center, which is achieved by a dynamic clustering strategy. Finally, each subclass would be given a pseudo-label for calculating loss. The dynamic clustering can be described as follows:
where denotes the sample center of a certain category in the t-th batch. denotes the i-th sample of this category. denotes the subclass number of this category. The maximum distance between the samples and sample center is equally divided into intervals and the length of each interval is .
During training, samples are fed into the framework in batches. In each batch, the following operation is repeated for each category of samples: the sample center is first calculated based on the features of all the samples, then the maximum distance between the sample and the sample center is computed; subsequently, the maximum distance is divided into several intervals. Eventually, the distance between each sample and the sample center is counted to decide which interval it belongs to so that a unique pseudo-label is assigned to that sample accordingly. Notably, the subclass number is taken as a hyperparameter whose value is related to the total sample number of the category. The sample center and subclass number are determined as follows:
Sample Center. The mini-batch training strategy is widely used for vision tasks, which leads to an expensive cost for the cluster center calculation. To efficiently calculate the sample center, an exponential moving average method is utilized, which makes the sample center of each category in each batch closer to the overall situation of the corresponding category in the dataset. The sample center is calculated as follows:
where (0 1) indicates the attenuation degree of the weight. denotes the average value of the features of a certain category in the t-th batch. denotes the exponential moving average value of the features of a certain category in the t-th batch, i.e., sample center.
Subclass number. The determination of the subclass number depends on the degree of data imbalance and the intra-class distance. On the one hand, our method aims to generate more subclasses for majority categories, especially for heavily imbalanced data. On the other hand, we experimentally analyzed the effect of the subclass number and obtained the following conclusions: the larger the subclass number, the smaller the intra-class distance of the samples, which will reduce the classification accuracy. Therefore, when determining the subclass number, we will perform a cluster analysis on this category. The subclass number should be as large as possible without the intra-class distance being too small. The ablation experiments of this parameter are detailed in Section 4.
3.2. Label-Mapping Module
To map the pseudo-label space to the real label space, we formulate a label-mapping module following the feature-extracting module, which a three-layer perceptron is employed. In the training process, because the feature clustering module will cluster each category of samples into several subclasses, the total number of pseudo-labels will be greater than the number of real labels. Therefore, in order to map all pseudo-labels of samples of the same category to its real label, the input dimension of the three-layer perceptron should be equal to the number of pseudo-labels, and the output dimension should be equal to the total number of real labels.
3.3. Two-Stage Training Strategy
Given that the feature-extracting module and the label-mapping module are relatively independent networks, a two-stage training approach is implemented to update the weight parameters of the entire framework. The two stages involve separate training processes, each focusing on updating the weight parameters of a specific module.
In the first stage, the pseudo-labels generated by the feature clustering module are utilized as the ground truth for the backbone network. The loss is calculated based on the comparison between the predicted pseudo-labels and the generated pseudo-labels, allowing for the update of the weight parameters in the feature-extracting module. This stage aims to optimize the feature extraction process to ensure accurate and discriminative feature representation. Similarly, in the second stage, the real labels are employed as the ground truth for the three-layer perceptron in the label-mapping module. The loss is computed by comparing the predicted labels with the true labels, facilitating the update of weight parameters in the label-mapping module. This stage focuses on fine-tuning the label-mapping process to ensure effective alignment between the pseudo-labels and the true labels.
The first and second stages are performed alternately, allowing for iterative refinement of the framework. Notably, the loss function remains consistent across both stages of training, ensuring that the overall objective remains unchanged. By adopting this two-stage training method, we can effectively optimize the feature extraction and label-mapping processes within the framework, improving the overall performance and accuracy of the model.
4. Experiments and Discussions
4.1. Datasets and Experimental Settings
Long-tailed CIFAR-10 and CIFAR-100. CIFAR-10 and CIFAR-100 are commonly used datasets in long-tailed classification problems; these datasets consist of 60,000 images, with the training dataset containing 50,000 samples and the test dataset containing 10,000 samples [29]. To obtain the long-tailed version of the CIFAR dataset and ensure fairness, we follow [30] to split the existing dataset. Specially, we use the imbalance ratio factor to control the imbalance degree of the dataset, where and represent the most and the least frequent class numbers from the training samples, respectively. In our experiments, the imbalance factors are set to 0.05, 0.02, 0.01, and 0.1, respectively. Our framework was verified on the long-tailed versions of CIFAR-10 and CIFAR-100 datasets with different imbalance factors. Notably, the test set remains unchanged. The distribution of the long-tailed CIFAR-10 dataset is shown in Figure 2.
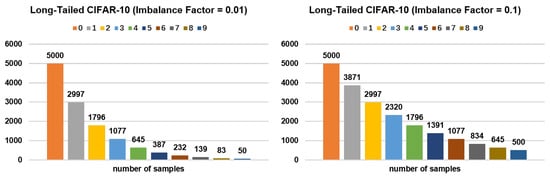
Figure 2.
The distribution of the long-tailed CIFAR-10 dataset with imbalance factors of 0.01 and 0.1.
OCTMNIST. OCTMNIST [31] is a new medical dataset built from the previous retinal OCT image classification dataset, which contains 109,309 images. For a fair comparison, we selected four types of data for training and testing. The training dataset is naturally imbalanced, while the test dataset exhibits a balanced distribution in terms of the number of samples. OCTMNIST is an application-oriented dataset from the real world, which can better demonstrate the effectiveness of our method.
Baselines. We compare our method with previous state-of-the-art techniques and their combinations: (1) Cross-entropy (CE) loss [32], which does not change the loss of samples; (2) focal loss [18], which increases the loss for hard samples and down-weights well-classified samples; (3) LDAM loss [20], which regularizes the minority categories to have larger margins; (4) resampling [33], which resamples the samples according to the inverse of the effective number of samples in each category; (5) reweighting [34], which reweights the samples according to the inverse of the effective number of samples in each category; (6) DRW [20], which makes the model learn the initial feature representation and then performs reweighting or resampling. The above three loss functions (i.e., CE loss, focal loss, and LDAM loss) were employed in the experiments, each of which was combined with three training methods (i.e., reweighting, resampling, and DRW). The parameter settings of reweighting and resampling methods were consistent with [19].
Implementation Details. We used PyTorch [35] to implement and train all the models in the work, and we used ResNet [36] architecture for all datasets. For the long-tailed CIFAR-10 and CIFAR-100 datasets, random initialization was used for our model, which adopts ResNet-32 as the backbone network. The networks were trained for 200 epochs with stochastic gradient descent (SGD) (momentum = 0.9). Following the training strategy in [19], the initial learning rate was set to 0.1 and then decayed by 0.01 at 160 epochs and again at 180 epochs. Furthermore, we used a linear warm-up of the learning rate in the first five epochs. We trained the models for the long-tailed CIFAR-10 and CIFAR-100 datasets on a single NVIDIA RTX 3090 with a batch size of 128.
4.2. Classification Experiment Results
Table 1 and Table 2 show the test accuracy of our framework on the long-tailed CIFAR-10 and CIFAR-100 datasets under different combinations of loss functions and training methods. The loss curves along with training are shown in Figure 3.

Table 1.
The test accuracy on the long-tailed CIFAR-10 datasets between our method and the baseline.
Table 2.
The test accuracy on the long-tailed CIFAR-100 datasets between our method and the baseline.
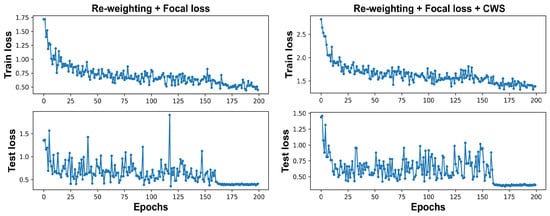
Figure 3.
The loss curves of baseline (reweighting plus focal loss) trained on long-tailed CIFAR-10 (imbalance factor = 0.1) with or without the CWS method.
Clearly, without incorporating loss functions and training methods that can mitigate the data imbalance, our framework can achieve comparable performance to the previous state-of-the-art techniques. For example, on the long-tailed CIFAR-10 dataset with the imbalance factor set to 0.1, our framework has a classification accuracy of 87.91%, which almost exceeds the classification accuracy of all other methods and their combinations on this dataset. Compared to the long-tailed CIFAR-10 dataset with the imbalance factor being set to 0.1, our framework improves the baseline performance more significantly on the dataset, with the imbalance factor set to 0.01. For example, on the dataset (imbalance factor = 0.01), the performance improvement of the baseline (CE loss plus none) is up to about 4%, while the performance improvement of this baseline is only 1.5% on the dataset (imbalance factor = 0.1). This means that the more imbalanced the data distribution, the more significant the effect of our framework. The experiments show that our framework can significantly improve the performance of most combinations of loss functions and training methods in the baseline.
Notably, when there is a large number of categories, it is difficult to determine the subclass number. An inappropriate subclass number can easily lead to non-convergence of the model. For example, our framework combining LDAM loss and the resampling method does not work well on the long-tailed CIFAR-100 dataset. This is because for datasets with a large number of categories, resampling and clustering may result in the absence of samples in some subclasses.
To validate the effectiveness of our proposed algorithm in real applications, we report the experimental results of the algorithm on the medical dataset OCTMNIST. Figure 4 shows the classification results of our proposed method on the OCTMNIST dataset after combining it with different backbone networks. It can be seen that our method has achieved optimal ACC and considerably good AUC. Compared with ResNet-50, the accuracy of our proposed method has obtained a nearly 7.5% improvement, while our method only adds two MLP parameters based on ResNet-32. Therefore, this can effectively demonstrate the effectiveness of our proposed method.
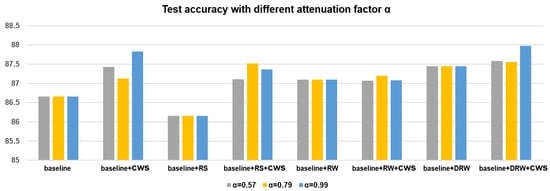
Figure 4.
The test accuracy of baselines (focal loss plus different training method) or combinations of baselines and the CWS method on the long-tailed CIFAR-10 (imbalance factor = 0.1) with different attenuation factors . (RS: resampling, RW: reweighting).
4.3. Ablation Experiment Results
To choose an appropriate subclass number, we performed a series of ablation experiments on the long-tailed CIFAR-10 and CIFAR-100 datasets, and some of the experimental results are shown in Table 3 and Table 4. It can be seen that the performance of our framework is not proportional to the subclass number. When the subclass number increases, the classification accuracies of some combinations of baselines and the CWS method increase (e.g., CE plus none, focal plus reweighting), while those of some combinations slightly decrease (e.g., CE plus resampling, LDAM plus resampling). This is because a large subclass number leads to too little discriminability between subclasses. When the subclass number increases to a certain extent, the combinations (e.g., LDAM plus resampling) cannot converge because some subclasses have no samples after clustering. Thus, considering the stability and performance of the framework, the subclass numbers for the long-tailed CIFAR-10 are set to [5, 3, 2, 2, 1, 1, 1, 1, 1, 1]. That is, the samples in the largest category were clustered into five subclasses, and those in the smallest category remained as one category. We repeated each element in [5, 3, 2, 2, 1, 1, 1, 1, 1, 1, 1, 1] ten times as the subclass number for each category in the long-tailed CIFAR-100 dataset, i.e., [5, 5, …, 5, 3, 3, …, 3, 2, 2, …, 2, 1, 1, …, 1].
Table 3.
The test accuracy on the long-tailed CIFAR-10 (imbalance factor = 0.01) with different subclass numbers.
Table 4.
The test accuracy on the OCTMNIST dataset. We compared a large number of baseline networks with larger parameter quantities than our proposed method.
We also performed a series of ablation experiments for the attenuation factor of the exponential moving average in Equation (4), and the experimental results are shown in Figure 4. It can be seen that when the attenuation factor is set to 0.99, our framework combined with other loss functions or training methods can achieve the highest performance. Thus, the attenuation factor is set to 0.99 in our classification experiments.
5. Discussion and Conclusions
In this paper, we propose a novel method to enhance the classification performance of long-tailed datasets by introducing a classwise splitting (CWS) strategy. The core concept revolves around clustering the sample features into multiple subclasses based on their intra-class distance. The method consists of three main modules: the feature extraction module, the feature clustering module, and the label-mapping module. The feature extraction module is responsible for extracting informative features from input images. These extracted features are then fed into the feature clustering module, which performs clustering to group them into distinct subclasses. Additionally, the feature clustering module assigns pseudo-labels to the samples within each subclass. Finally, the label-mapping module is employed to map the pseudo-labels to the corresponding ground truth labels. Experimental results conducted on the CIFAR-10-LT, CIFAR-100-LT, and OCTMNIST datasets validate the effectiveness of our proposed method in tackling long-tailed image classification tasks. The results demonstrate that our approach significantly improves the classification accuracy of long-tailed datasets. By introducing the classwise splitting strategy and leveraging the three modular components, our method demonstrates promising potential in addressing the challenges posed by long-tailed datasets and achieving enhanced classification performance.
The method we proposed, based on the idea of dynamic reclustering, is a general visual framework designed for long-tailed distribution data. The experimental results have demonstrated that our framework can be effectively combined with existing rebalancing strategies, such as resampling, reweighting, focal loss, and LDAM, indicating its strong generality. This means that our framework can be applied to other similar long-tailed distribution tasks.
Moreover, our method introduces a learnable label-mapping network that can efficiently fit a mapping function from pseudo-labels to ground truth labels with a small training cost. This idea holds heuristic significance for other unsupervised and semi-supervised learning tasks, as it provides inspiration for achieving an efficient label-mapping in these scenarios.
However, it is worth noting that the proposed framework’s learnable label-mapping network may not perform well in joint learning scenarios. The experimental results have revealed that the upper limit of this method is dependent on the initial subdivision of subclasses. The improper subdivision of subclasses can significantly impact the performance of the final model. Therefore, using our framework requires a two-stage training strategy to ensure the stability of feature extraction and the feasibility of subsequent downstream task training. Extensive experimentation is necessary to identify the most suitable subclass number for each class.
In the future, we will explore ways to automatically determine the optimal number of subclasses and investigate approaches for joint training to further reduce training costs. By addressing these challenges, we aim to enhance the efficiency and effectiveness of the framework.
Author Contributions
Y.Y.: software, formal analysis, and writing—original draft; J.W.: writing—reviewing and editing; X.X.: formal analysis; R.L.: data curation; Y.Z.: data curation; L.W.: formal analysis; Q.L.: writing—reviewing and editing; N.L.: supervision and funding acquisition. All authors have read and agreed to the published version of the manuscript.
Funding
This study is supported by the Young Scientists Fund of the National Natural Science Foundation of China (grant no. 62206175), the Pujiang Talents Plan of Shanghai (grant no. 2019PJD035), and the Artificial Intelligence Innovation and Development Special Fund of Shanghai (grant no. 2019RGZN01041).
Institutional Review Board Statement
Not applicable.
Informed Consent Statement
Not applicable.
Data Availability Statement
The data that support the findings of this study are available from the corresponding author upon reasonable request.
Conflicts of Interest
The authors declare no conflict of interest.
References
- Deng, J.; Dong, W.; Socher, R.; Li, L.J.; Li, K.; Li, F.F. Imagenet: A large-scale hierarchical image database. In Proceedings of the 2009 IEEE Conference on Computer Vision and Pattern Recognition, Miami, FL, USA, 20–25 June 2009; IEEE: Piscataway, NJ, USA, 2009; pp. 248–255. [Google Scholar]
- Lin, T.Y.; Maire, M.; Belongie, S.; Hays, J.; Perona, P.; Ramanan, D.; Dollár, P.; Zitnick, C.L. Microsoft coco: Common objects in context. In Proceedings of the Computer Vision–ECCV 2014: 13th European Conference, Zurich, Switzerland, 6–12 September 2014; Proceedings, Part V 13. Springer: Berlin/Heidelberg, Germany, 2014; pp. 740–755. [Google Scholar]
- Liu, Z.; Miao, Z.; Zhan, X.; Wang, J.; Gong, B.; Yu, S.X. Large-scale long-tailed recognition in an open world. In Proceedings of the IEEE/CVF Conference on Computer Vision and Pattern Recognition, Long Beach, CA, USA, 15–20 June 2019; pp. 2537–2546. [Google Scholar]
- Yang, L.; Jiang, H.; Song, Q.; Guo, J. A survey on long-tailed visual recognition. Int. J. Comput. Vis. 2022, 130, 1837–1872. [Google Scholar] [CrossRef]
- Buda, M.; Maki, A.; Mazurowski, M.A. A systematic study of the class imbalance problem in convolutional neural networks. Neural Netw. 2018, 106, 249–259. [Google Scholar] [CrossRef] [PubMed]
- Swarnalatha, K.; Guru, D.; Anami, B.S.; Suhil, M. Classwise clustering for classification of imbalanced text data. In Proceedings of the Emerging Research in Electronics, Computer Science and Technology: Proceedings of International Conference, ICERECT 2018, New York, NY, USA, 22–24 August 2018; Springer: Berlin/Heidelberg, Germany, 2019; pp. 83–94. [Google Scholar]
- Li, Y.; Vasconcelos, N. Repair: Removing representation bias by dataset resampling. In Proceedings of the IEEE/CVF Conference on Computer Vision and Pattern Recognition, Long Beach, CA, USA, 15–20 June 2019; pp. 9572–9581. [Google Scholar]
- Shi, H.; Zhang, Y.; Chen, Y.; Ji, S.; Dong, Y. Resampling algorithms based on sample concatenation for imbalance learning. Knowl. Based Syst. 2022, 245, 108592. [Google Scholar] [CrossRef]
- Peng, H.; Pian, W.; Sun, M.; Li, P. Dynamic Re-Weighting for Long-Tailed Semi-Supervised Learning. In Proceedings of the IEEE/CVF Winter Conference on Applications of Computer Vision, Waikoloa, HI, USA, 2–7 January 2023; pp. 6464–6474. [Google Scholar]
- Wang, Z.; Men, M.; Zhong, P. Re-weighting regression and sparsity regularization for multi-view classification. Appl. Intell. 2022, 52, 7442–7458. [Google Scholar] [CrossRef]
- Alshammari, S.; Wang, Y.X.; Ramanan, D.; Kong, S. Long-tailed recognition via weight balancing. In Proceedings of the IEEE/CVF Conference on Computer Vision and Pattern Recognition, New Orleans, LA, USA, 18–24 June 2022; pp. 6897–6907. [Google Scholar]
- Fu, Y.; Xiang, L.; Zahid, Y.; Ding, G.; Mei, T.; Shen, Q.; Han, J. Long-tailed visual recognition with deep models: A methodological survey and evaluation. Neurocomputing 2022, 509, 290–309. [Google Scholar] [CrossRef]
- Kang, B.; Xie, S.; Rohrbach, M.; Yan, Z.; Gordo, A.; Feng, J.; Kalantidis, Y. Decoupling representation and classifier for long-tailed recognition. arXiv 2020, arXiv:1910.09217. [Google Scholar]
- Zhang, Y.; Hooi, B.; Hong, L.; Feng, J. Self-supervised aggregation of diverse experts for test-agnostic long-tailed recognition. Adv. Neural Inf. Process. Syst. 2022, 35, 34077–34090. [Google Scholar]
- Zhu, J.; Wang, Z.; Chen, J.; Chen, Y.P.P.; Jiang, Y.G. Balanced contrastive learning for long-tailed visual recognition. In Proceedings of the IEEE/CVF Conference on Computer Vision and Pattern Recognition, New Orleans, LA, USA, 18–24 June 2022; pp. 6908–6917. [Google Scholar]
- Mullick, S.S.; Datta, S.; Das, S. Generative adversarial minority oversampling. In Proceedings of the IEEE/CVF International Conference on Computer Vision, Seoul, Republic of Korea, 27 October–2 November 2019; pp. 1695–1704. [Google Scholar]
- Ye, H.J.; Chen, H.Y.; Zhan, D.C.; Chao, W.L. Identifying and compensating for feature deviation in imbalanced deep learning. arXiv 2020, arXiv:2001.01385. [Google Scholar]
- Lin, T.Y.; Goyal, P.; Girshick, R.; He, K.; Dollár, P. Focal loss for dense object detection. In Proceedings of the IEEE International Conference on Computer Vision, Venice, Italy, 22–29 October 2017; pp. 2980–2988. [Google Scholar]
- Cui, Y.; Jia, M.; Lin, T.Y.; Song, Y.; Belongie, S. Class-balanced loss based on effective number of samples. In Proceedings of the IEEE/CVF Conference on Computer Vision and Pattern Recognition, Long Beach, CA, USA, 15–20 June 2019; pp. 9268–9277. [Google Scholar]
- Cao, K.; Wei, C.; Gaidon, A.; Arechiga, N.; Ma, T. Learning imbalanced datasets with label-distribution-aware margin loss. Adv. Neural Inf. Process. Syst. 2019, 32, 1567-–1578. [Google Scholar]
- Zhou, B.; Cui, Q.; Wei, X.S.; Chen, Z.M. Bbn: Bilateral-branch network with cumulative learning for long-tailed visual recognition. In Proceedings of the CVPR, Seattle, WA, USA, 13–19 June 2020. [Google Scholar]
- Zhong, Z.; Cui, J.; Lo, E.; Li, Z.; Sun, J.; Jia, J. Rebalanced Siamese Contrastive Mining for Long-Tailed Recognition. arXiv 2022, arXiv:2203.11506. [Google Scholar]
- Hartigan, J.A.; Wong, M.A. Algorithm AS 136: A k-means clustering algorithm. J. R. Stat. Soc. Ser. C (Appl. Stat.) 1979, 28, 100–108. [Google Scholar] [CrossRef]
- Abdullah, D.; Susilo, S.; Ahmar, A.S.; Rusli, R.; Hidayat, R. The application of K-means clustering for province clustering in Indonesia of the risk of the COVID-19 pandemic based on COVID-19 data. Qual. Quant. 2022, 56, 1283–1291. [Google Scholar] [CrossRef] [PubMed]
- Zhang, Y.; Shuai, L.; Ren, Y.; Chen, H. Image classification with category centers in class imbalance situation. In Proceedings of the 2018 33rd Youth Academic Annual Conference of Chinese Association of Automation (YAC), Nanjing, China, 18–20 May 2018; IEEE: Piscataway, NJ, USA, 2018; pp. 359–363. [Google Scholar]
- Johnson, J.M.; Khoshgoftaar, T.M. Survey on deep learning with class imbalance. J. Big Data 2019, 6, 1–54. [Google Scholar] [CrossRef]
- Singh, N.D.; Dhall, A. Clustering and learning from imbalanced data. arXiv 2018, arXiv:1811.00972. [Google Scholar]
- Guru, D.; Swarnalatha, K.; Kumar, N.V.; Anami, B.S. Effective technique to reduce the dimension of text data. Int. J. Comput. Vis. Image Process. 2020, 10, 67–85. [Google Scholar] [CrossRef]
- Cui, J.; Liu, S.; Tian, Z.; Zhong, Z.; Jia, J. Reslt: Residual learning for long-tailed recognition. IEEE Trans. Pattern Anal. Mach. Intell. 2022, 45, 3695–3706. [Google Scholar] [CrossRef] [PubMed]
- Shu, J.; Xie, Q.; Yi, L.; Zhao, Q.; Zhou, S.; Xu, Z.; Meng, D. Meta-weight-net: Learning an explicit mapping for sample weighting. arXiv 2019, arXiv:1902.07379. [Google Scholar]
- Yang, J.; Shi, R.; Ni, B. Medmnist classification decathlon: A lightweight automl benchmark for medical image analysis. In Proceedings of the 2021 IEEE 18th International Symposium on Biomedical Imaging (ISBI), Nice, France, 13–16 April 2021; IEEE: Piscataway, NJ, 2021; pp. 191–195. [Google Scholar]
- Zhang, Y.; Kang, B.; Hooi, B.; Yan, S.; Feng, J. Deep long-tailed learning: A survey. IEEE Trans. Pattern Anal. Mach. Intell. 2023; early access. [Google Scholar]
- Park, S.; Lim, J.; Jeon, Y.; Choi, J.Y. Influence-Balanced Loss for Imbalanced Visual Classification. In Proceedings of the IEEE/CVF International Conference on Computer Vision, Montreal, QC, Canada, 10–17 October 2021; pp. 735–744. [Google Scholar]
- Wang, Y.; Ramanan, D.; Hebert, M.H. Learning to Model the Tail; Curran Associates Inc.: Red Hook, NY, USA, 2017. [Google Scholar]
- Paszke, A.; Gross, S.; Chintala, S.; Chanan, G.; Yang, E.; DeVito, Z.; Lin, Z.; Desmaison, A.; Antiga, L.; Lerer, A. Automatic Differentiation in Pytorch. 2017. Available online: https://openreview.net/forum?id=BJJsrmfCZ (accessed on 2 July 2023).
- He, K.; Zhang, X.; Ren, S.; Sun, J. Deep residual learning for image recognition. In Proceedings of the IEEE Conference on Computer Vision and Pattern Recognition, Las Vegas, NV, USA, 27–30 June 2016; pp. 770–778. [Google Scholar]
Disclaimer/Publisher’s Note: The statements, opinions and data contained in all publications are solely those of the individual author(s) and contributor(s) and not of MDPI and/or the editor(s). MDPI and/or the editor(s) disclaim responsibility for any injury to people or property resulting from any ideas, methods, instructions or products referred to in the content. |
© 2023 by the authors. Licensee MDPI, Basel, Switzerland. This article is an open access article distributed under the terms and conditions of the Creative Commons Attribution (CC BY) license (https://creativecommons.org/licenses/by/4.0/).