Article

Application of Leak 2D to Describe Preferential Water Flow in a Soil Containing Artificial Macropores

by
Charalampos Paraskevas
,
Dimitrios Karpouzos
* and
Christos Babajimopoulos
Department of Hydraulics, Soil Science and Agricultural Engineering, School of Agriculture, Aristotle University of Thessaloniki, 54124 Thessaloniki, Greece
*
Author to whom correspondence should be addressed.
Mathematics 2023, 11(13), 2889; https://doi.org/10.3390/math11132889
Submission received: 24 May 2023 / Revised: 18 June 2023 / Accepted: 25 June 2023 / Published: 27 June 2023
(This article belongs to the Section Engineering Mathematics)

Abstract

:
Leak 2D is a new two-dimensional dual permeability mathematical model for the simulation of the preferential flow in the vadose zone. In this model, water flow in the soil matrix domain is described by the two-dimensional h-based Richards’ equation. Water flow in the fracture domain is estimated using the kinematic wave approach. Richards’ equation is solved by a combination of the alternating direction implicit (A.D.I.) method and the Douglas and Jones predictor−corrector method. The kinematic wave equation is solved explicitly. In the present paper, Leak 2D is calibrated and validated with data obtained in a Hele–Shaw apparatus filled with sand. Preferential flow is achieved by inserting four artificial macropores of various sizes into the soil. Six irrigations of various intensities and durations were used for the calibration and validation process. The water content at various depths was recorded by five sensors that were inserted into the soil. A comparison of the simulated water content with the measured profiles shows that Leak 2D can sufficiently describe preferential flow into the unsaturated zone of the soil, even under extreme irrigation conditions.

1. Introduction

Preferential flow through structural voids, desiccation cracks, fissures, biopores, wormholes, or zones of a high conductivity is very common in agricultural soils. The quantification of these flows is crucial because of their intensity and ability to transport contaminants to the groundwater [1,2,3]. Very often, these flows are studied by mathematical models. However, no matter the simplicity or complexity of these models, their ability to simulate preferential flow must be verified. The methods of verification for these models can be classified into three main categories based on (a) experimental data obtained in the laboratory, (b) lysimeters, or (c) in the field.
In the first category, the work of [4] is one of the first attempts to simulate preferential flow in the unsaturated zone. They used the model RZWQM to simulate flow in soil columns, in which they created artificial macropores 3 mm in diameter all along the vertical axis of the columns. The authors of [5] also compared the one-dimensional version of the Hydrus model [6] with the two-dimensional version [7] using first- and second-order terms of water exchange between the two phases (soil matrix and fracture domain). A soil column (80 cm high and 24 cm in diameter) was used to obtain the necessary data, in the center of which an artificial macropore was installed. The authors of [8] developed and compared double and single permeability models to describe the movement of water in soil columns (67 cm high and 30 cm in diameter) under constant wetting conditions. Soil moisture inside the columns was measured with TDR sensors. The work of [9] also belongs in the first category. They applied a new kinematic–dispersive wave van Genuchten model calibrated and validated with the observations of four different rainfall intensities applied on the surface of a soil column with artificial preferential pathways.
In the second category, which is the verification of models with data obtained in lysimeters, in the work of [10], the authors compared the MACRO model [11,12] with the SLIM model [13], the SOIL model [14], the LEACHW model [15], and the NCSWAP [16] model for the effect of preferential flow on drainage simulation. This study was carried out in experimental fields of lysimeters (area 0.465 m2 and depth 1.2 m) cultivated with corn. The soil of the lysimeters contained cracks, fissures, and roots. The authors of [17] also used HYDRUS-1D to simulate water flow and leaching of fecal coliforms and bromide (Br) through six undisturbed soil lysimeters (70 cm depth by 50 cm diameter) under field conditions. The authors of [18] used lumped-parameter modeling to investigate water flow in the unsaturated zone of two vegetated lysimeters characterized by a different soil texture.
Among the works that used data collected in the field to verify a mathematical model, the work of [19] is included. Their objective was to study the effects of the mass transfer coefficients on bromide (Br) leaching in a two-dimensional dual-permeability concept. Br leaching was simulated with data from a Br tracer irrigation experiment on a drained field. The authors of [20] used the MACRO model to simulate soil water movement in an experimental field in Northern Greece. In this work, the MACRO model was calibrated and validated during a growing season in an irrigated corn field and during a winter season in a field with bare soil.
In the Leak 2D model, the soil water flow in the soil matrix domain is computed by the two-dimensional h-based Richards’ equation [21,22]. Water flow in the fracture domain is estimated using the kinematic wave approach [23]. Richards’ equation is solved in a cell-centered grid. The method of solution is a combination of the alternating direction implicit (A.D.I.) method and the Douglas and Jones predictor−corrector method [24,25,26]. The kinematic wave equation is solved explicitly. The main objective of the present paper is to present the calibration and validation of the Leak 2D. Experimental data were obtained in a Hele-Shaw device, which was specifically constructed for this particular purpose, where artificial macropores were installed in the soil of Hele-Shaw to artificially simulate water flow in the fracture domain.

2. Materials and Methods

2.1. Model Description

Leak 2D is a two-dimensional dual-permeability model to describe the preferential flow of water in the vadose zone. As in [27], it is assumed that the soil can be separated into two pore domains. Each one of these domains has different hydraulic properties and different degrees of saturation. In addition, water flow in these two domains is described by different equations. These two pore domains are (a) the soil matrix (subscript m) and (b) fracture (subscript f). During the execution of the model, the equations in each domain are solved sequentially in every time step. The interaction of the flow between the two domains takes place in the case where specific conditions are met. This approach is an alteration of the [27] concept for water flow in structured soils. A detailed presentation of the development of Leak 2D is made in [28]. In the same article, a sensitivity analysis of the input parameters of the fracture domain equations is accomplished.
The model adopts the advantages of the Richards-based models and the kinematic wave models; however, it avoids their drawbacks. It combines the two-dimensional Richards equation only in the matrix domain (where this equation is always valid) and the kinematic wave equation in the fracture domain (where the validity of Richards equation under certain circumstances can be questionable), allowing for water transfer between the two domains.
As in [27], the relative volumetric proportion of the fracture domain is defined by the variable w [-] (0 < w < 1), which is defined as follows:
w = V t , f / V t
where Vt,f is the volume of fracture domain of the soil and Vt is the total volume of the soil.
According to (1), there is a different water content expression for each soil domain. A local one (θ), referring to the volumetric water content relative to the volume of each domain, and an overall one (Θ), referring to the volumetric water content relative to the total volume of the soil.
The soil water flow in the soil matrix domain is computed by the two-dimensional h-based Richards equation:
C m h m t = θ m t = z K m h m z 1 + x K m h m x + Γ w 1 w
where z is the vertical coordinate (positive downward) [L], x is the horizontal coordinate [L], hm is the pressure head at the matrix domain [L], Km is the hydraulic conductivity of the matrix domain [L/T], Cm is the specific water capacity (∂θm/∂hm) [L−1], and Γw is the water exchange term between the two domains [Τ−1].
The Richards equation is commonly used to describe the flow of water through unsaturated porous media, such as soils. It plays a crucial role in understanding various real-world phenomena related to water movement in soil systems. The Richards equation captures the changes in soil moisture content over time, which is crucial for understanding water availability for plants, groundwater recharge, and soil water management. Finally, the Richards equation plays an important role in predicting capillary rise and drainage. Capillary rise refers to the upward movement of water in soil due to capillary forces. The Richards equation helps to quantify this phenomenon by considering the capillary pressure head hm and hydraulic conductivity Km. Additionally, the equation also describes drainage, which occurs when excess water drains through the soil profile under gravity.
According to [12], the water flow in the fracture domain is dominated by gravity and the capillarity is assumed to be negligible (∂h/∂z = 0). Therefore, the governing water flow equation in the fracture domain is as follows:
θ f t = q f z Γ w w
where qf is the flow in the fracture domain [L/T], which is described by the kinematic wave approach [23] as follows:
q f = K s , f θ f / θ s , f α = K f
where Ks,f is saturated hydraulic conductivity in the fracture domain [L/T], α (= ~2) is the kinematic exponent (reflecting the fracture size distribution and tortuosity) [12], and Kf is the unsaturated hydraulic conductivity of the fracture domain.
Replacing qf in Equation (3) by (4), the following equation is obtained for the water flow in the fracture domain.
θ f t = z Κ s , f θ f / θ s , f α Γ w w
In dual permeability models, the flow separation between the two domains (soil matrix and fracture) is achieved using a critical value for the pressure head hcr [L] (threshold). The flow in the fracture domain is activated when the pressure head in the soil matrix overcomes this critical value. Moreover, the local θcr water content, the total Θcr water content, and the hydraulic conductivity Kcr corresponding to hcr are also defined.
The water transfer rate from the fracture to the matrix domain Γw [T−1] is estimated as a first-order approximation of the water diffusion equation, with an assumption of rectangular-slab geometry for the aggregates [22,29]:
Γ w = Θ m t = G f D w γ w d 2 Θ c r Θ m
where d is the effective diffusion path-length related to the soil aggregate size (the value of d is taken equal to the half of the aggregate width or half of the fracture spacing) [L], Dw is the water’s effective diffusivity, Gf is the aggregate’s geometry factor (for rectangular aggregate’s geometry is set equal to 3 [30]), γw is the correction factor in order to match the exact results with the approximated solutions of the diffusion problem [31]. The value of γw depends on the initial soil moisture and the hydraulic properties of the soil. However, this dependence is not strong; thus, for simplicity, the value of γw is set equal to 0.4 [27].
Equation (6) describes water flow from the fracture to the soil matrix domain based on the soil water deficit of the soil matrix domain. The flow from the soil matrix to the fracture takes place in every time step of the numerical solution when the water content of the soil matrix exceeds the value of θcr (also when h > hcr), following the soil physics principal that governs the water filling of pores when the water entry pressure value is exceeded [12].
Richards Equation (2) is solved using a method that combines the alternating direction implicit (A.D.I.) method and the Douglas and Jones predictor−corrector method [24,26]. Equation (5), which describes the one-dimensional water flow in the fracture domain, is solved explicitly.
In single domain models, the atmospheric boundary conditions can be described by the following simple equation:
ASF = r E
where ASF is the actual surface flux [L/T], r is the applied water in soil surface (irrigation or rainfall) [L/T], and E is the evaporation rate from the soil surface [L/T].
In dual domain (permeability) models, the water inflow must be separated proportionally in each domain (soil matrix and fracture). In Leak 2D, the total actual surface flux is separated by the following equation [32]:
ASF = A S F f w + A S F m ( 1 w )
where ASFf and ASFm are the actual surface fluxes in the fracture and in the soil matrix domain, respectively.
The free-drainage bottom boundary condition is described computationally, making the assumption that in both domains, the flow in the bottom is gravitational forced and not capillary forced.
The unique approach of the Leak 2D model in modeling the preferential flow in both the matrix and fracture domain provides significant value in the fields of agricultural water management as it influences irrigation practices and their efficiency, and the root zone drainage. Furthermore, Leak 2D’s capability to accurately simulate preferential flow becomes highly beneficial in groundwater pollution problems, as it can estimate the distribution of pollutants (e.g., nitrate). It aids in comprehending and predicting water movement within complex subsurface environments. This knowledge plays a vital role in designing more effective strategies for remediation and optimizing the utilization of water resources.

2.2. Hele-Shaw Cell

As described in [33], the Hele-Shaw device was constructed from acrylic glass (1.2 cm thickness) capable of withstanding the internal pressures from the swelling of the soil. The choice of acrylic glass and the avoidance of using metal parts was made for the convenience of moving and handling the device. The Hele-Shaw device is presented in Figure 1. The device is designed so that its one side can be removed, allowing for easier soil sampling. The Hele-Shaw cell was filled with sand. This option was chosen to minimize the drain completion times. Details of the device’s specific characteristics and the sand’s hydraulic properties can be found in Table 1 and in [33].
The composition of the soil in both samples (first sample at 0–25 cm layer and second at 25–50 cm layer) was similar. More specifically, in both samples, the percentage of sand (diameters of 50–2000 μm) was 99.39% (top layer) and 99.49% (bottom layer) [33].
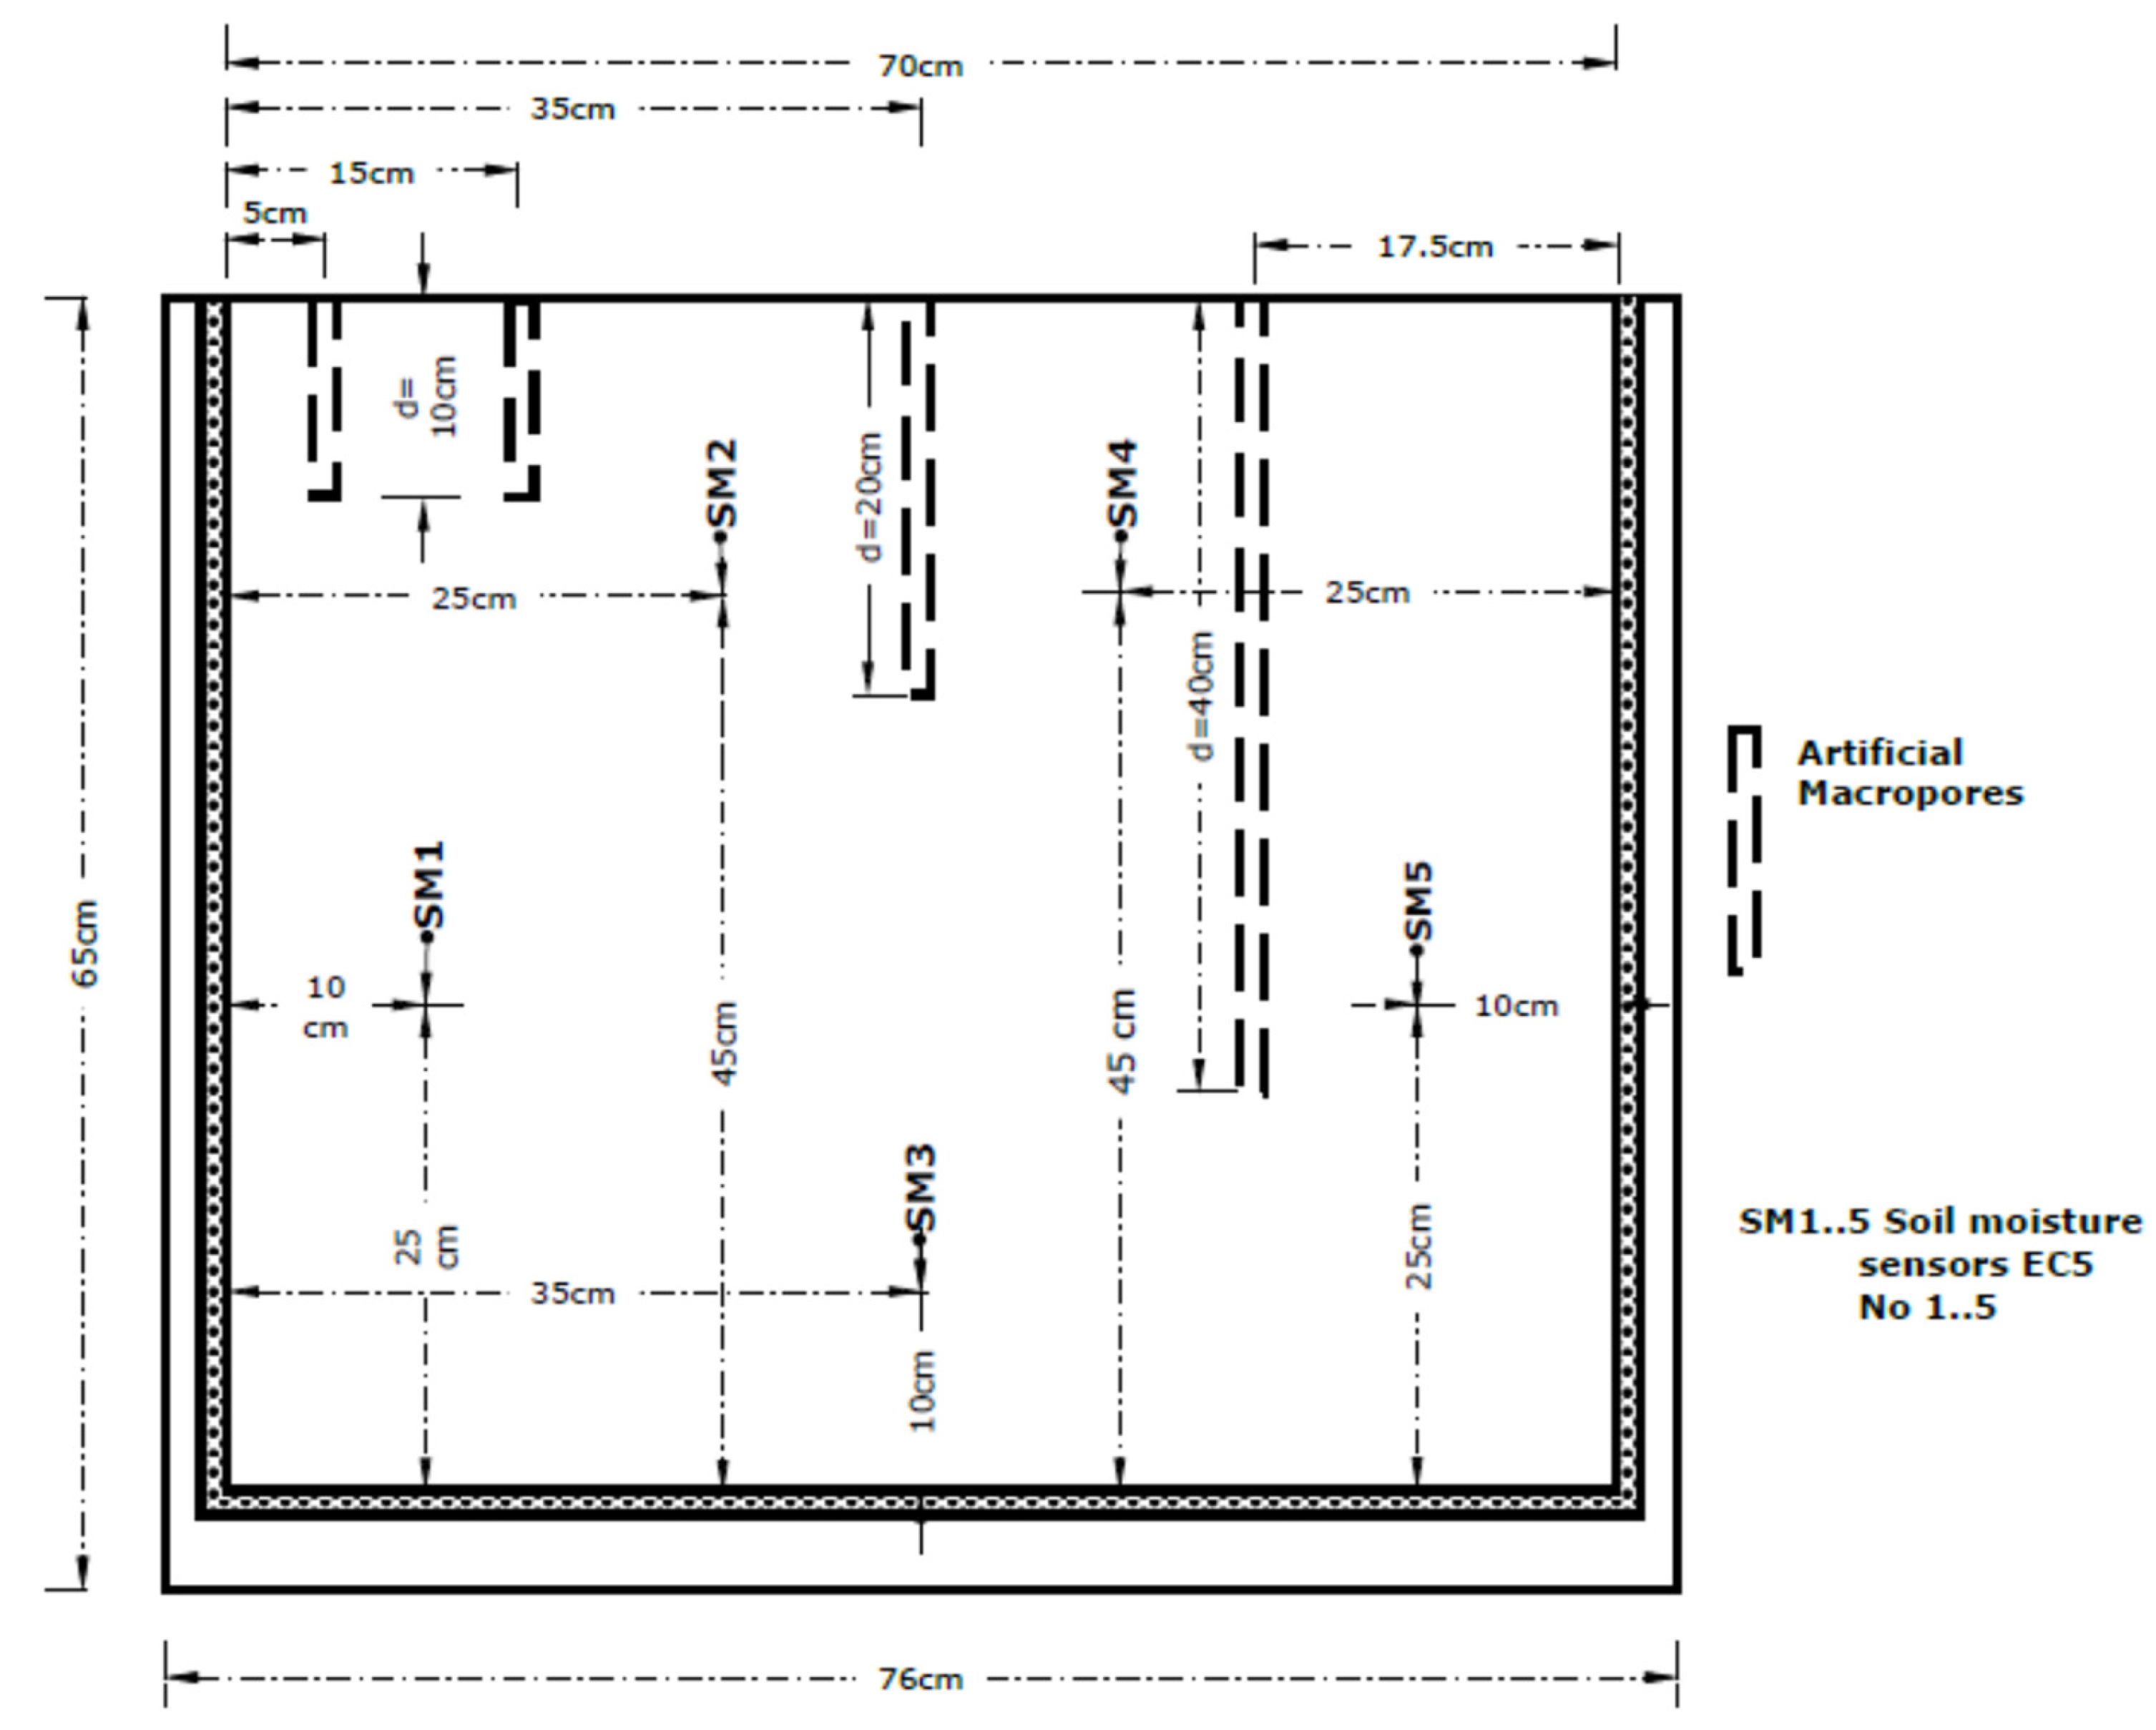
The use of sand was not expected to create preferential flow conditions inside the device. As sand is not expected to create preferential flow conditions, artificial macropores were created, as it they are very common for studying preferential flow in sandy soils [34,35,36,37,38]. Specifically, four perforated stainless-steel pipes (Figure 2) were used as artificial macropores. The outer diameter of the macropores was 6.5 mm and the inner was 3.85 mm. Two of these macropores had a length of 10 cm. The other two had a length of 20 cm and 40 cm, respectively. The position of the four macropores in the device is shown in Figure 3.
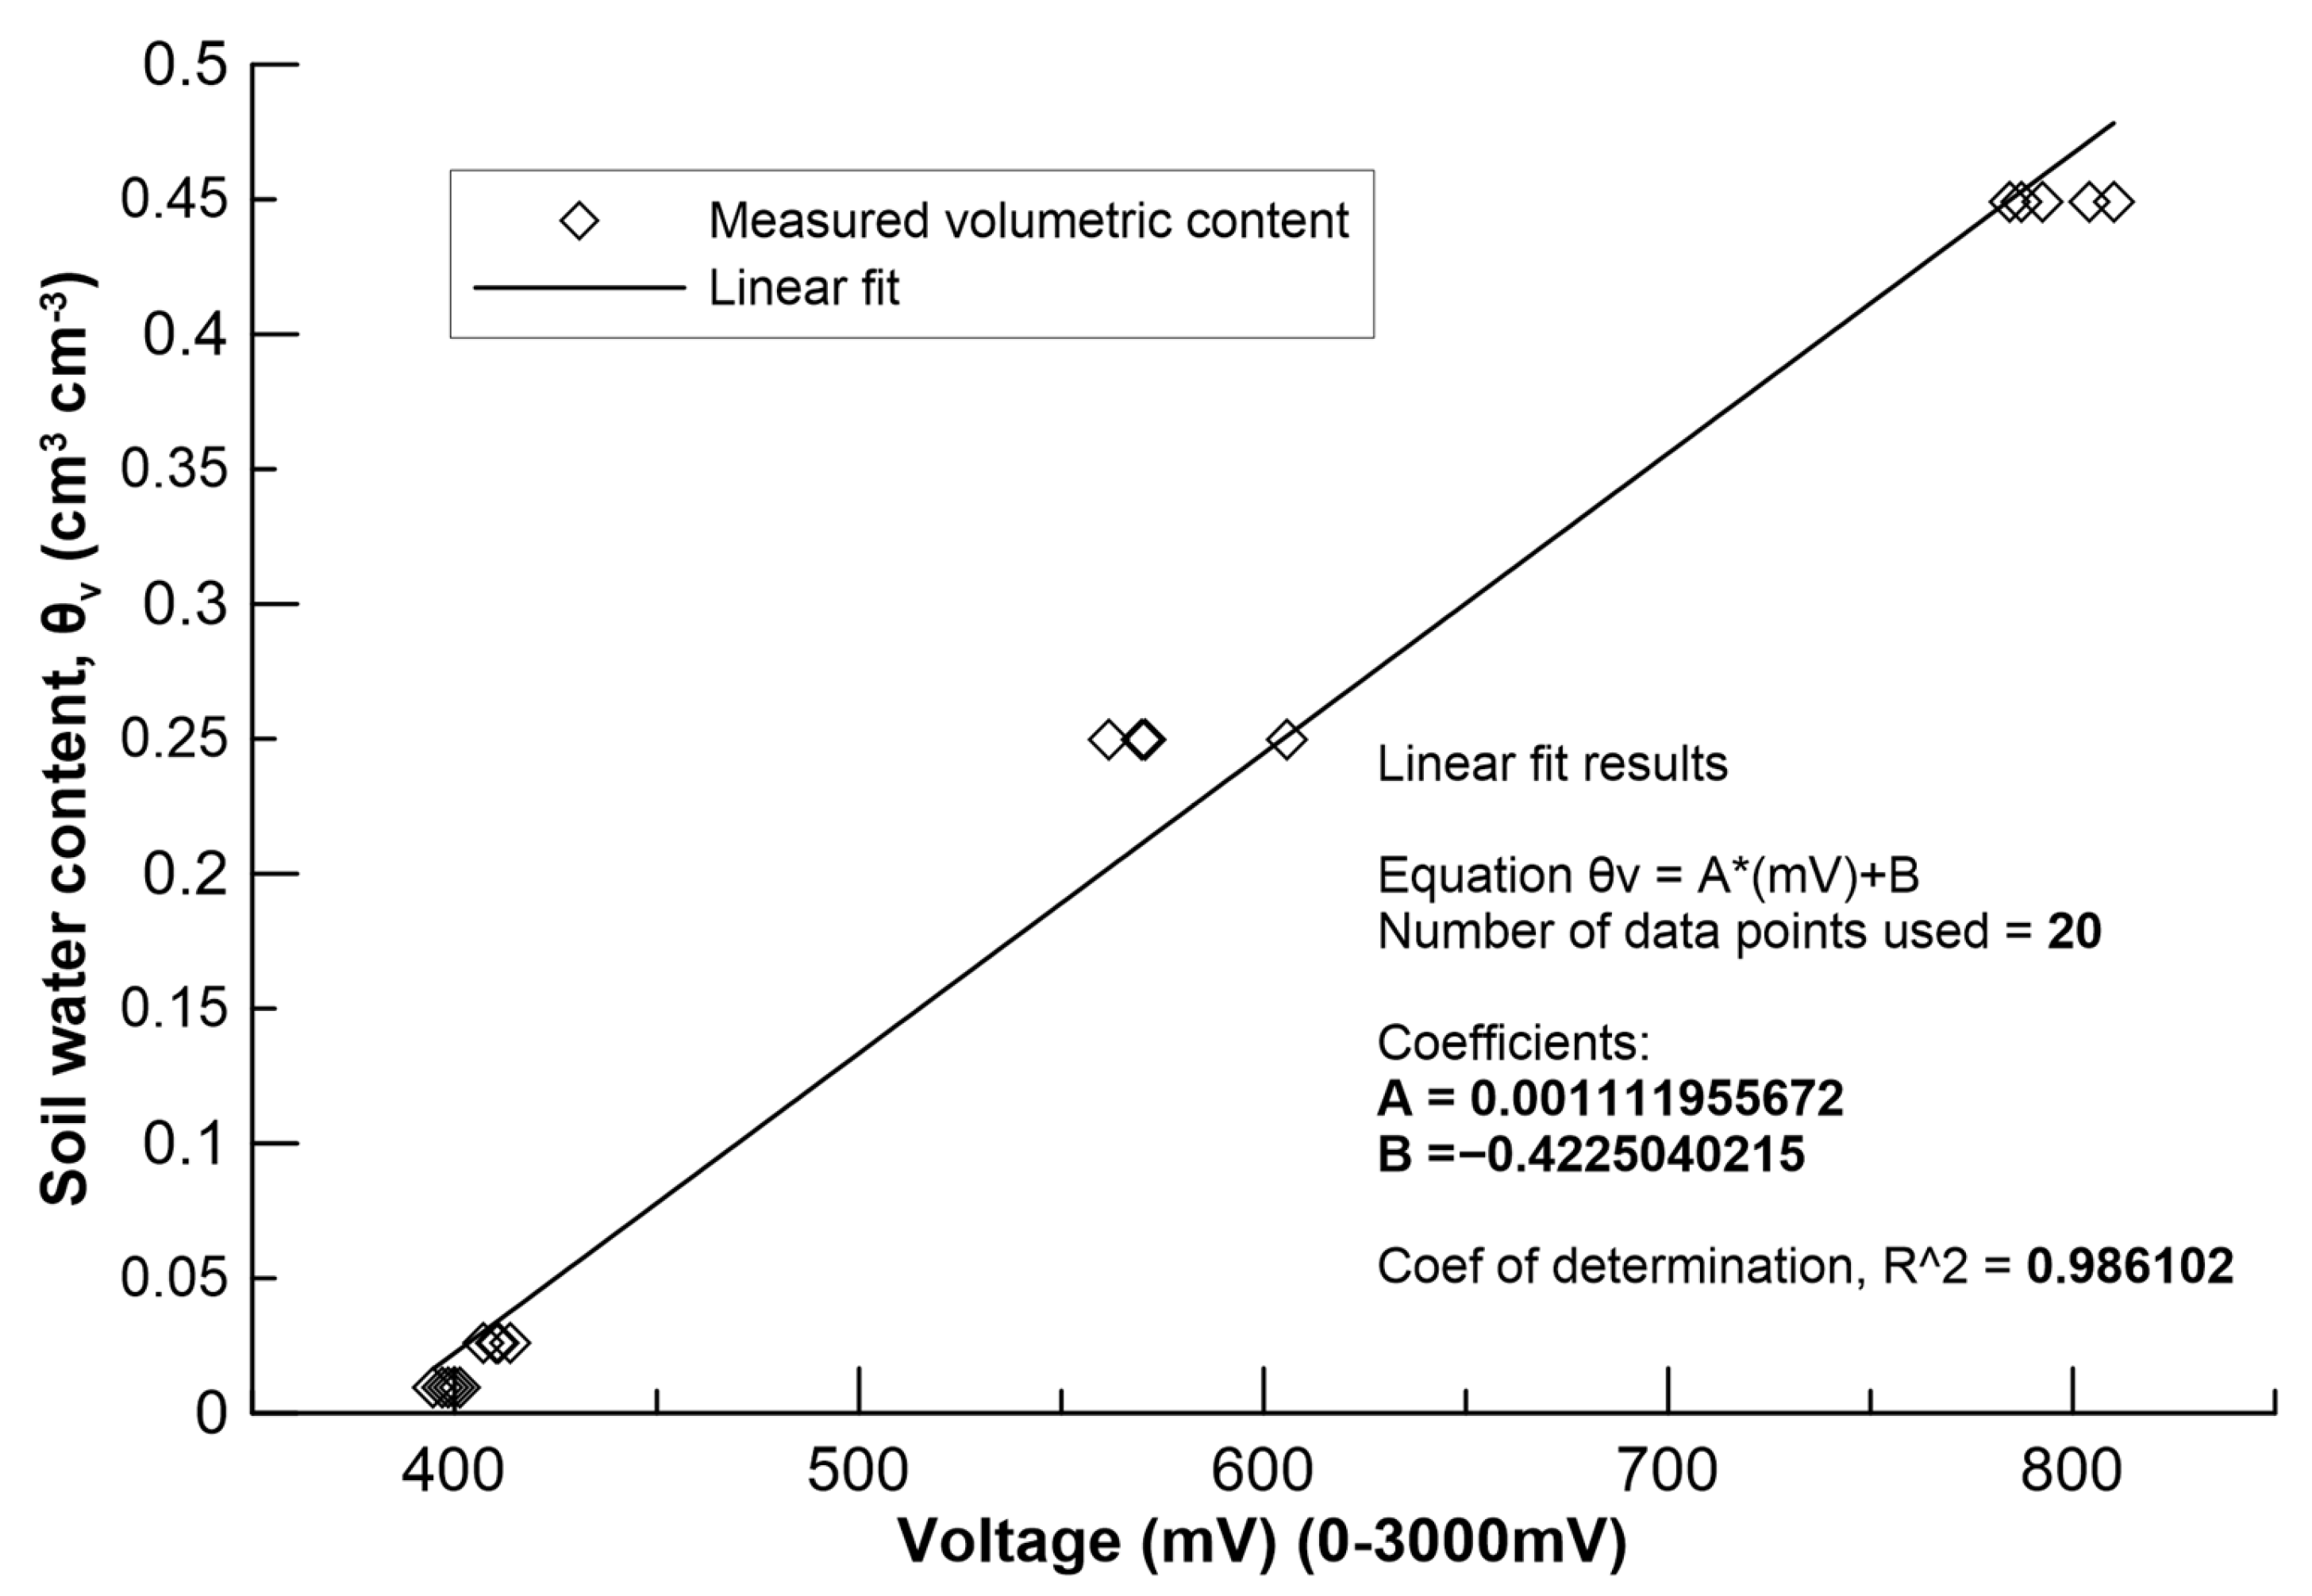
The soil water content was quantified by five EC-5 ECH2O sensors [39], placed in various depths in the soil. The sensors were selected based on their small size, as well as their small measuring volume. Their dimensions were 8.9 cm long, 1.8 cm wide, and 0.7 cm thick. Their accuracy, after onsite calibration, could reach 1–2% for the volumetric soil water content [39]. Sensors 1 and 5 were placed at 25 cm from the device’s base (Figure 3) and at 10 cm from the left and right edge, respectively. Sensors 2 and 4 were placed 45 cm from the base of the Hele-Shaw device and 25 cm from the left and right edge of the device, respectively. Finally, sensor 3 was placed 10 cm from the base of the device and 35 cm from its side edges. A data logger able to store up to 36,000 data was also used to record the voltage values, which were converted to the water content according to the following equation:
θ v = A mV + B
where A, B are the calibration coefficients and mV is the voltage values of the sensors.
The sensors were calibrated by measuring the soil moisture gravimetrically [40]. The calculation of the calibration coefficients A, B was accomplished by applying Equation (1) to the soil moisture data. The calibration results are shown in Figure 4.

2.3. Hydraulic Properties

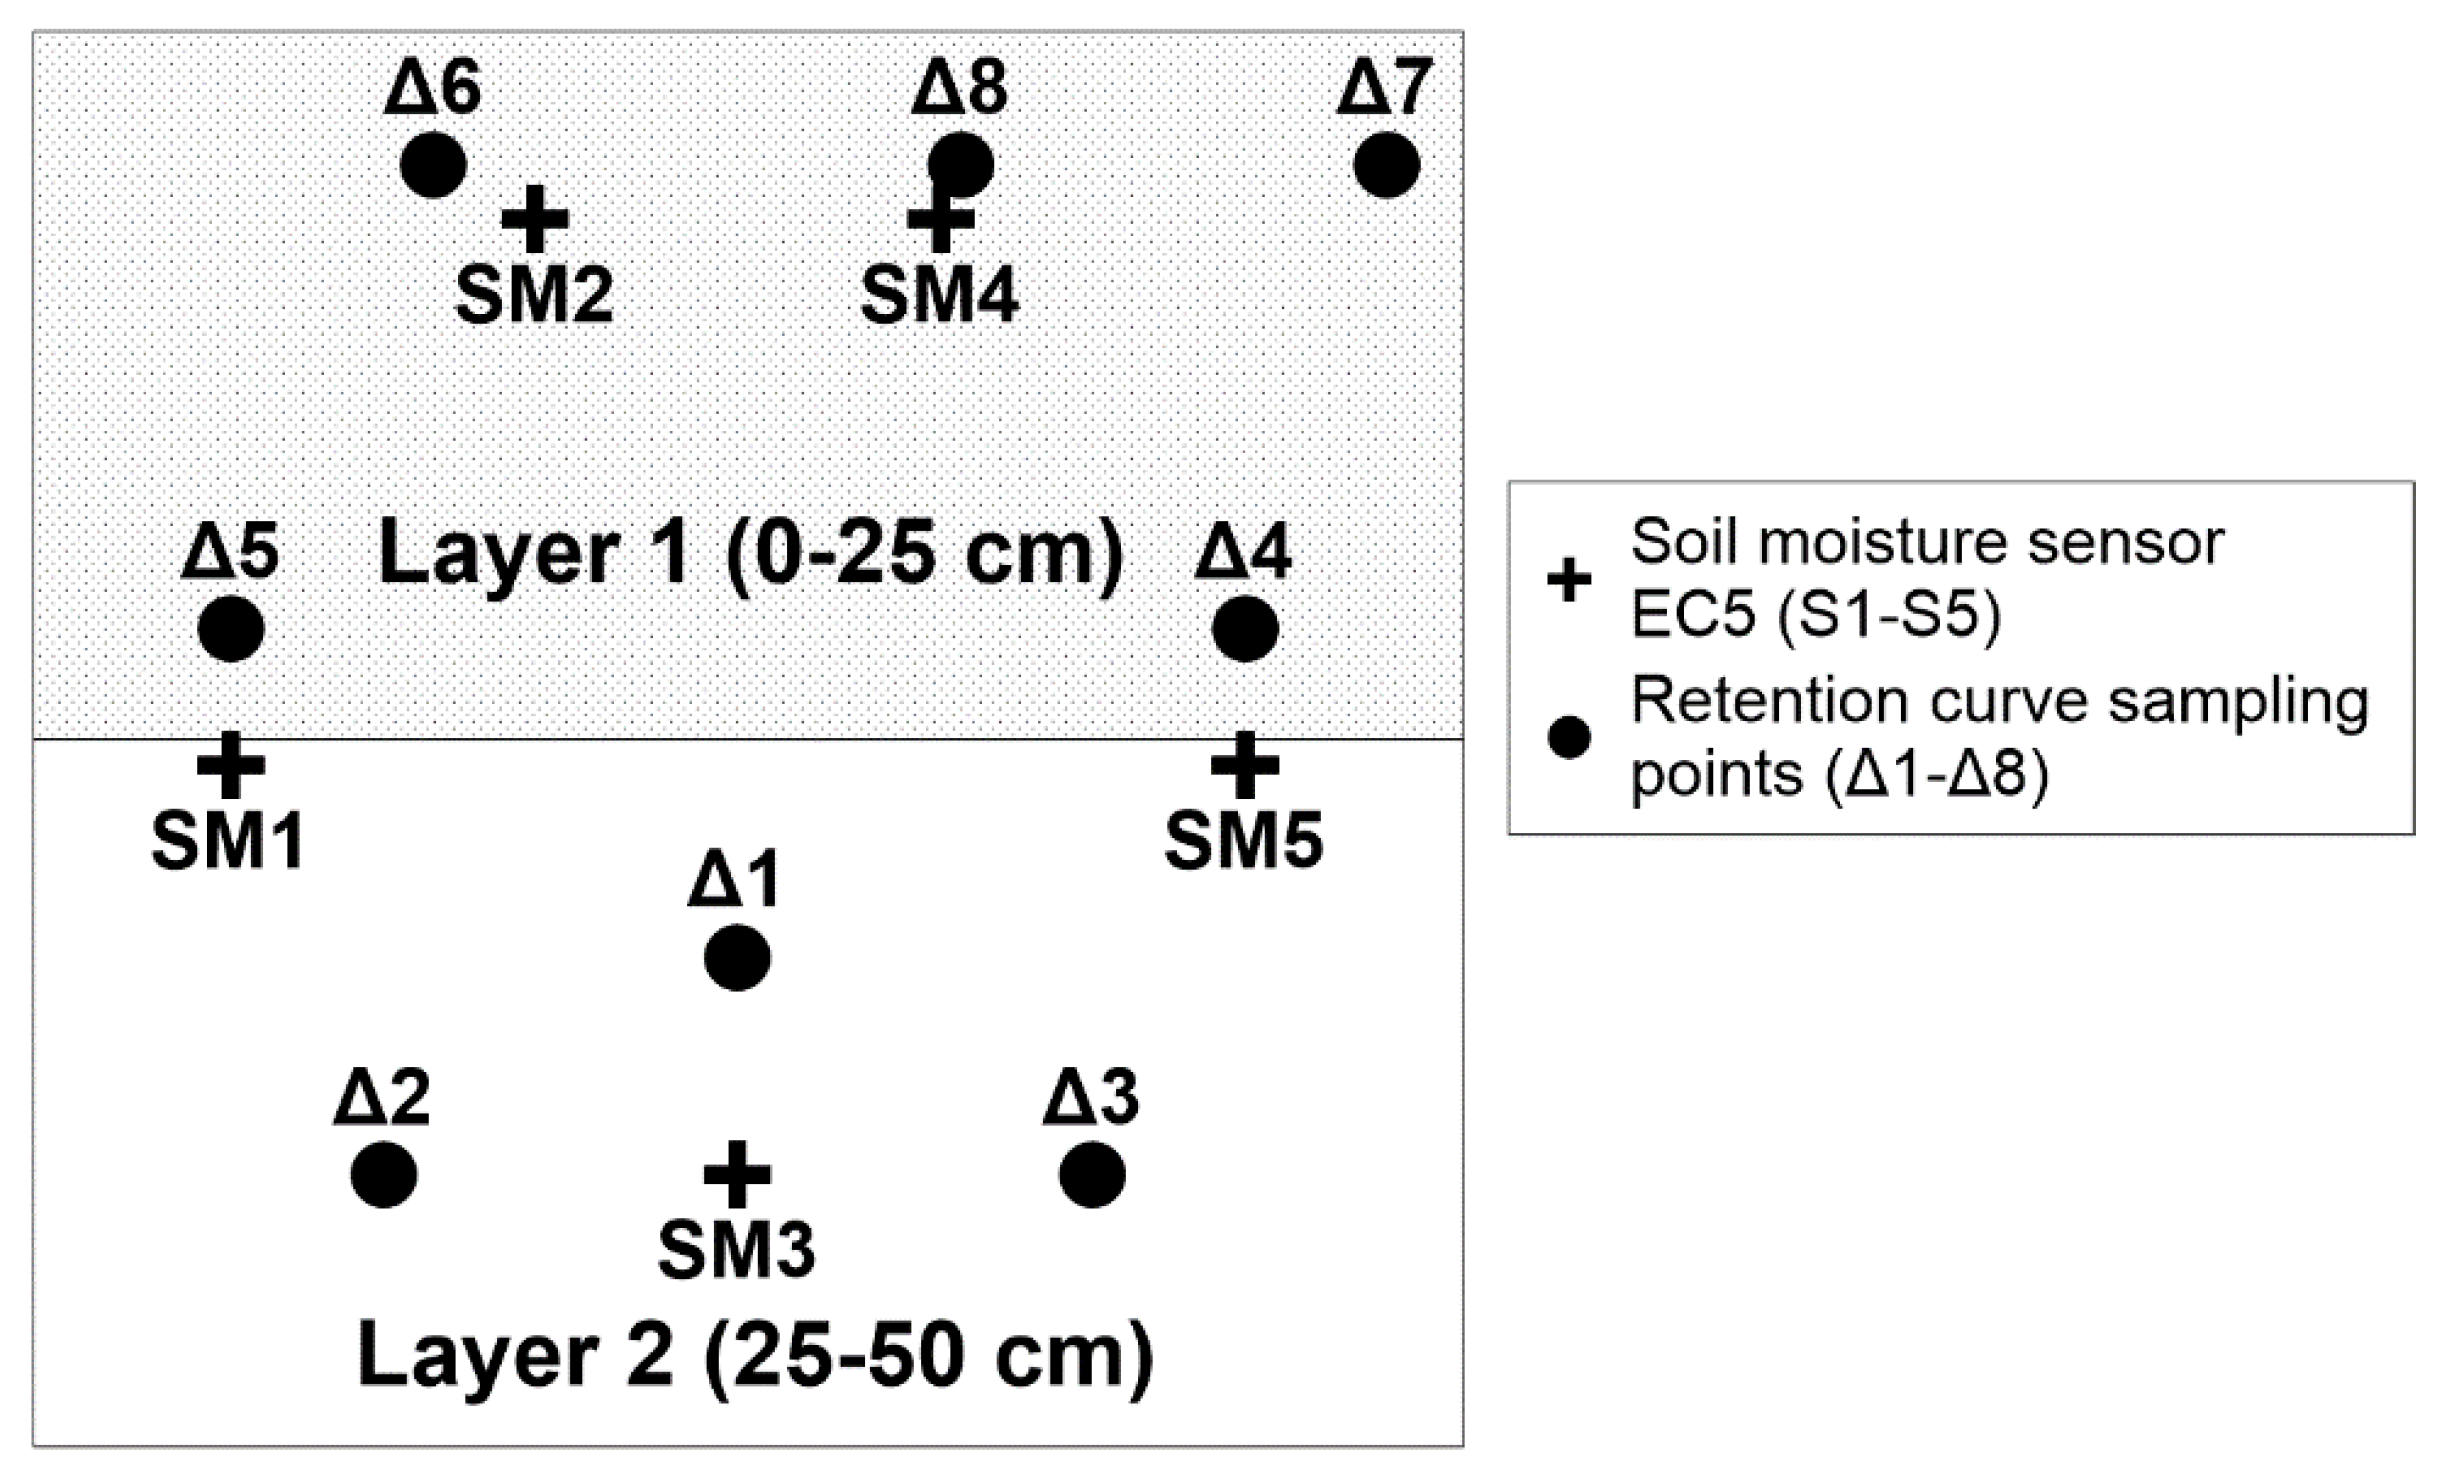
For computational purposes, the soil in the Hele-Shaw cell was divided into two layers of 0–25 cm and 25–50 cm (Figure 5). The average values of the soil hydraulic properties were used in each layer. For this purpose, eight undisturbed soil samples were taken by removing one side of the device. Five samples in the first layer and three samples in the second layer were used. The position of the samples is shown in Figure 5. The soil water retention curve was estimated in each sample using the pressure plate method. The values of θr, a, and n of the [41] model were determined by nonlinear regression of the soil water retention data. The values of moisture content at saturation, θs, and bulk density, ρb, were also determined using undisturbed soil samples. The average values of the hydraulic parameters in the two layers of the soil are shown in Table 1.

3. Results

Six applications of irrigation doses were used for the calibration and the verification of the model. The first two irrigations were used to calibrate the retention curve of the two soil layers before inserting the artificial macropores into the device. After the completion of the calibration, the artificial macropores were inserted into the device. Therefore, the remaining four irrigations were used for the validation of the model in both domains of the soil, matrix, and fracture.
In all of the simulations (calibration and validation), the dimensions of the computational cells were 2.5 × 2.5 cm and the time step was constant and equal to 0.9 s. It was found that this time step was sufficient for the convergence of the solution system and it was also small enough to follow the large hydraulic slopes created during the sudden wetting of the soil. All of the simulations used a known flux at the top end and free drainage at the bottom end as boundary conditions.
The values of hydraulic conductivity at saturation Ks were estimated using the optical flow method [33].

3.1. Calibration of the Mathematical Model

The two first irrigations used for the calibration of the model were quite extreme in terms of the amount of the water and its intensity (Table 2). In this case, the contribution of the fracture domain to these irrigations was minimal due to the absence of the artificial macropores.
Inverse modeling was used [42] to estimate the retention curve parameters. The HYDRUS-1D [6] inverse modeling capability was used to estimate the best values for the retention curve parameters. An objective function that includes deviations between predicted and measured water contents at different times and depths was minimized [43]. This minimization procedure followed the least-squares Levenberg−Marquardt nonlinear method [44].
A set of 150 data were used for the calibration procedure for each of the five sensors for each irrigation. Therefore, the total number of measurements for all of the sensors for the two irrigations was 1500 (750 measurements per irrigation). The measured retention curves parameters were used as the initial conditions for the calibration procedure (Table 1).
The calibrated retention curve in comparison with the measured one is shown in Figure 6a,b.
The statistical criteria used for the evaluation of the results of the model were the root mean square (RMS), the mean absolute error (MAE), the model efficiency factor (MEF), and the coefficient of residual mass (CRM) [45].
The first irrigation (denoted by A) started 5 min after the beginning of the simulation. The initial moisture condition was very low, equal to 0.025 cm3/cm3 for both layers.
The second irrigation (denoted by B) started 10 min after the start of the simulation, and the initial moisture condition was higher than the previous irrigation (A) and differed for each sensor. In both irrigations, the water content was recorded each minute in all five sensors for 150 min. After 150 min, a complete normalization of the phenomenon and a minimal variation of the water content in the soil were observed.
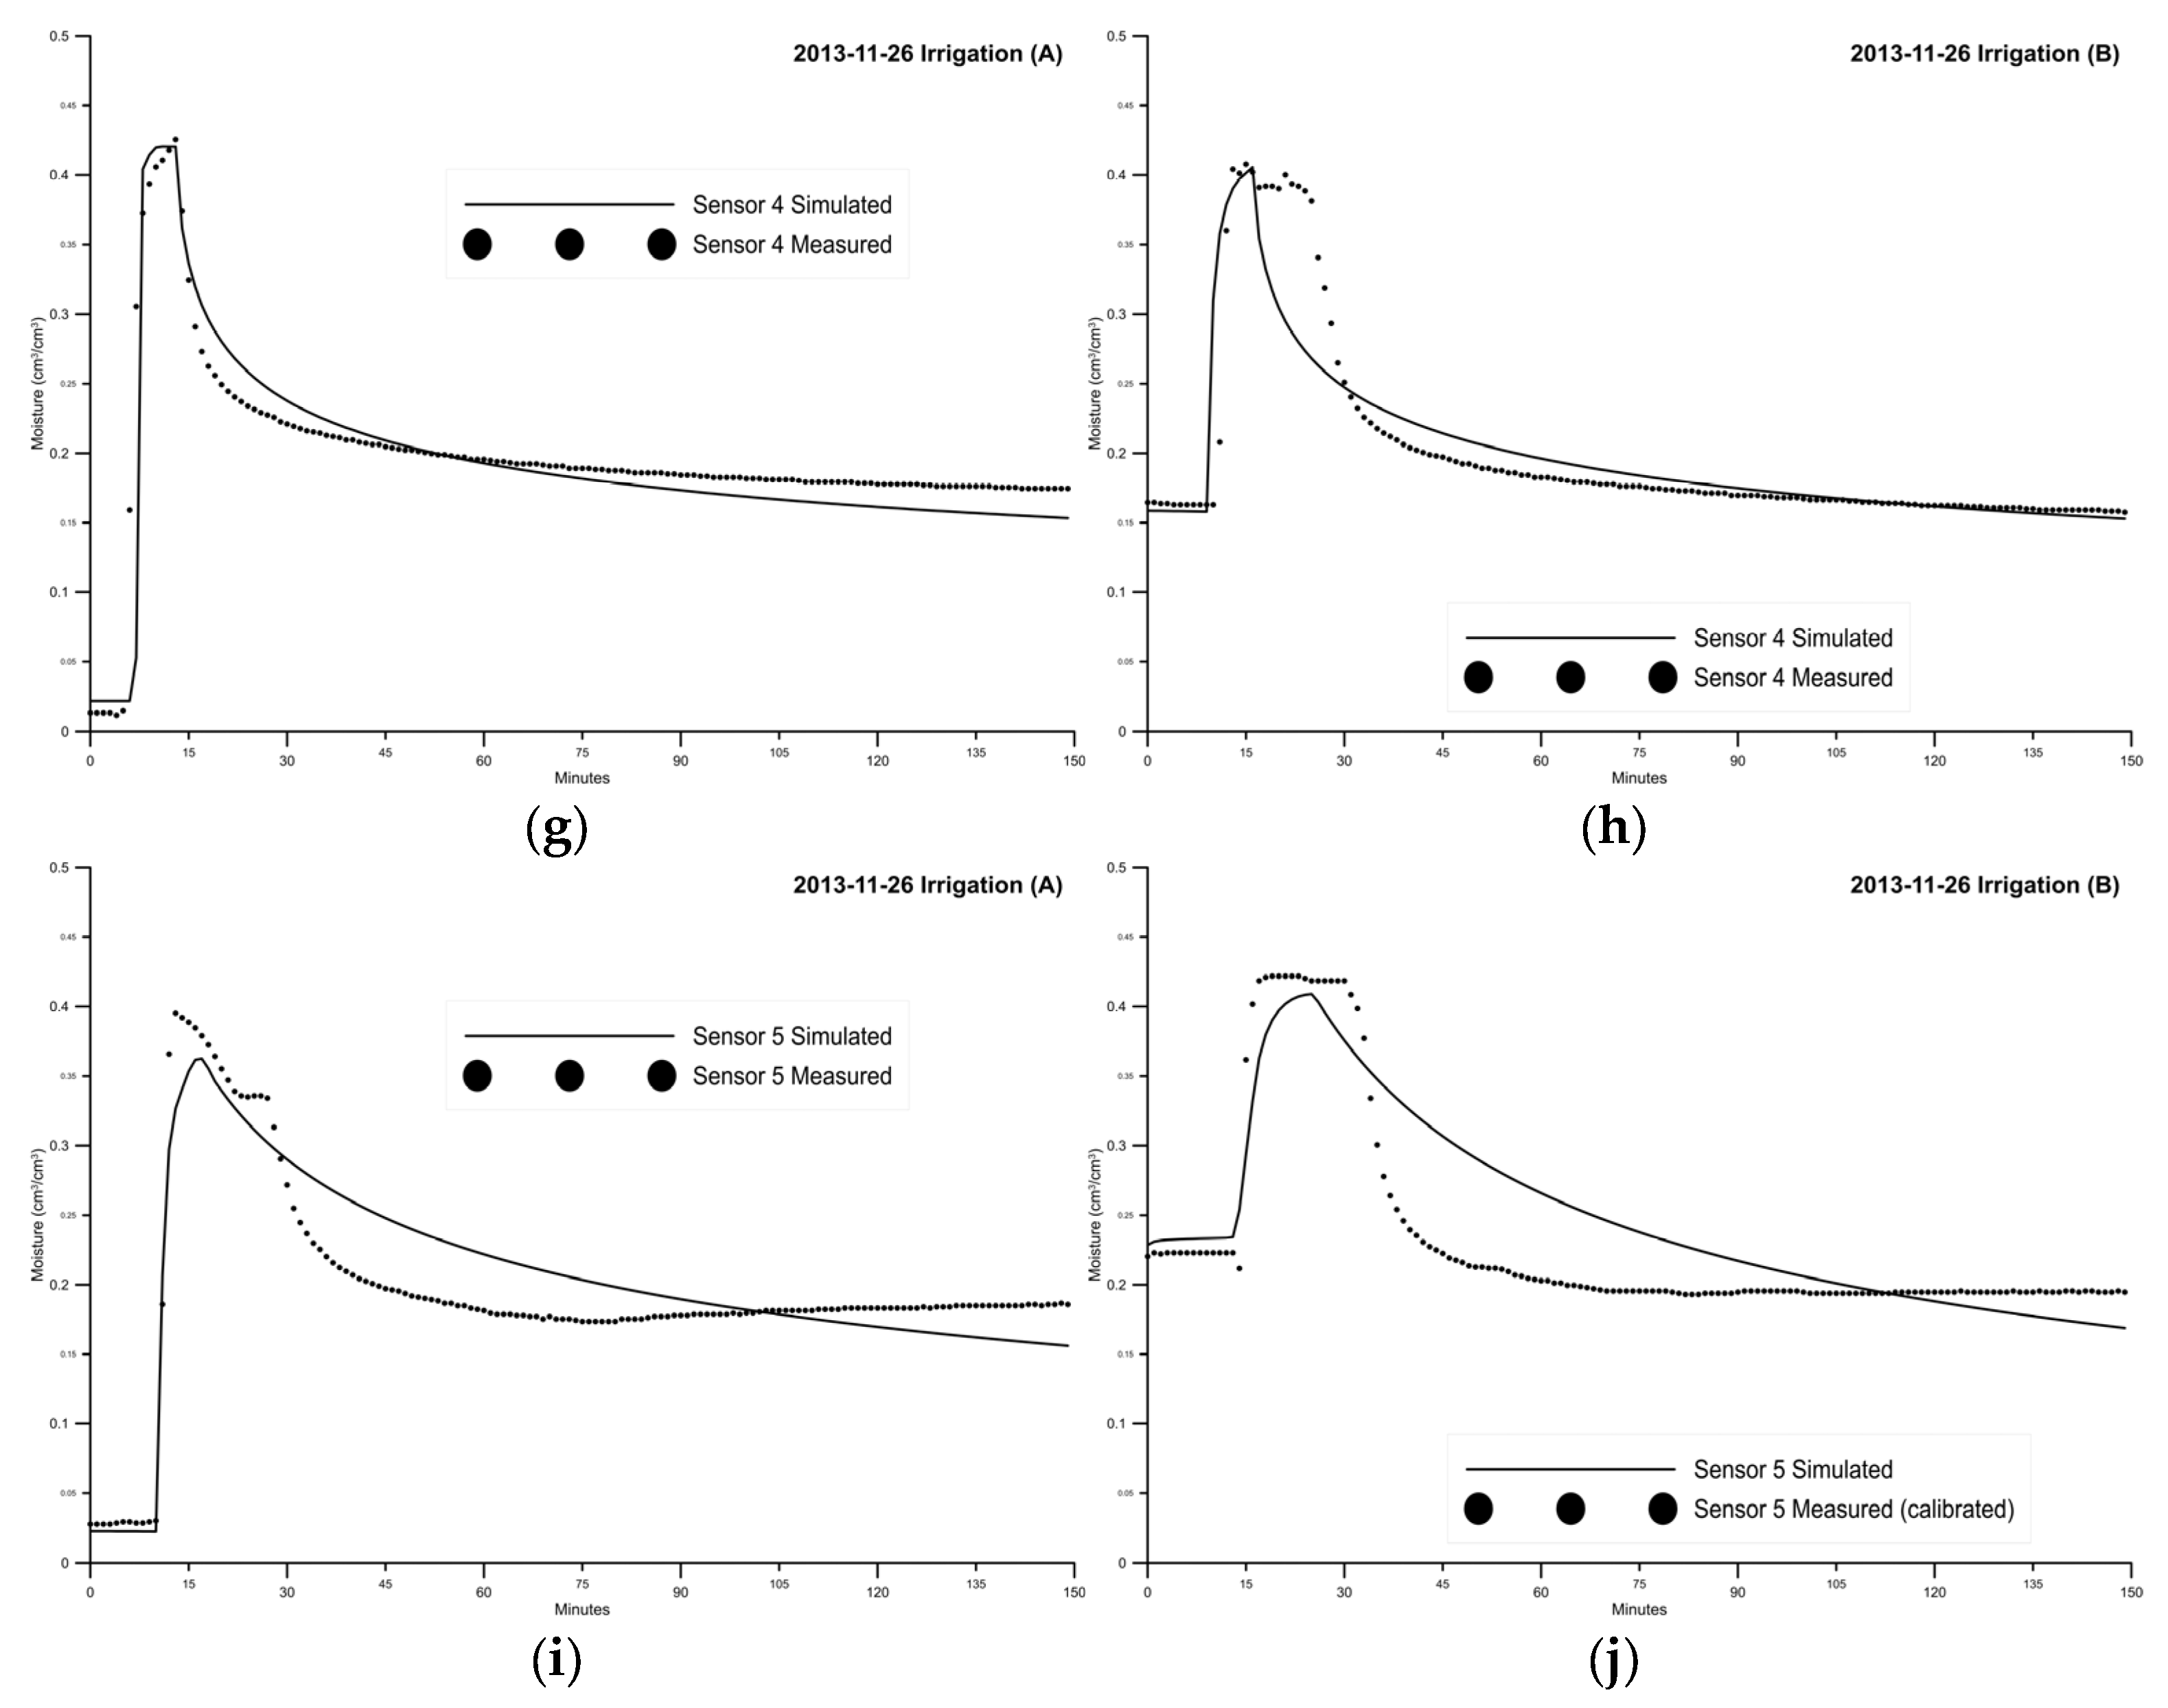
Figure 7a–j shows the comparison of the simulated with the measured water content profiles at the five sensors for the two irrigations used for the calibration of the model.
As shown in Figure 7a–j the calibrated mathematical model, in general, satisfactorily simulated the water flow in the soil. More specifically, the model accurately predicted the maximum water content in all five sensors and the final water content in both layers. However, the model showed a smoother response for predicting the sharp decrease in the water content for some period after it reached its maximum value.
Table 2 shows the statistical criteria resulting from the comparison of the simulated with the measured water content at the five sensors for irrigation A and B used for the calibration of the model. In addition, in this Table, ‘Total’ refers to the comparison of all (n = 750) measurements with the corresponding simulated results.
The height of the irrigation, h, and the duration of the irrigation, t, the temperature, θ and relative humidity, RH of the surrounding area are also presented in the same table.
According to the statistical criteria of Table 2, for the first irrigation, 2013-11-26 (A), the model more accurately predicted the water content at the deepest sensor, SM3, and at one of the most shallow sensors, SM2. In sensor 3, the best values for RMS and MEF (0.023 and 0.910, respectively) were obtained, while in sensor 2, the best values for MAE and CRM (0.012 and −0.003, respectively) were obtained.
For the second irrigation, 2013-11-26 (B), the statistical criteria indicated that the simulated results were more accurate in the second sensor of the top layer (SM4) and at the deepest sensor 3. In SM4, the best values for RMS, MAE, and CRM were obtained (0.031. 0.015, and 0.003, respectively), while in the deepest sensor 3, the best MEF (=0.892) value was obtained.
As evident in the ‘Total’ statistical criteria presented in Table 2, it can be observed that all of the sensor values consistently demonstrated that the model’s simulations were highly accurate and exhibited a significant proximity to the measured values for the water content.

3.2. Validation of the Mathematical Model

The calibrated model was used to predict the flow in the apparatus under four different irrigation regimes. In these simulations, the artificial macropores were inserted into the device. It was considered that the value of w (the ratio of the volume of the macropores to the total volume of the soil) in the cells where the macropores were placed was 3% [46], while in the rest of the cells it was considered that w was equal to 1%.
The first irrigation took place on 13/12/2013. It started 32 min after the start of the simulation. As it was expected, water ponding appeared on the surface of the Hele-Shaw device, initiating the flow into the macropores (Figure 8).
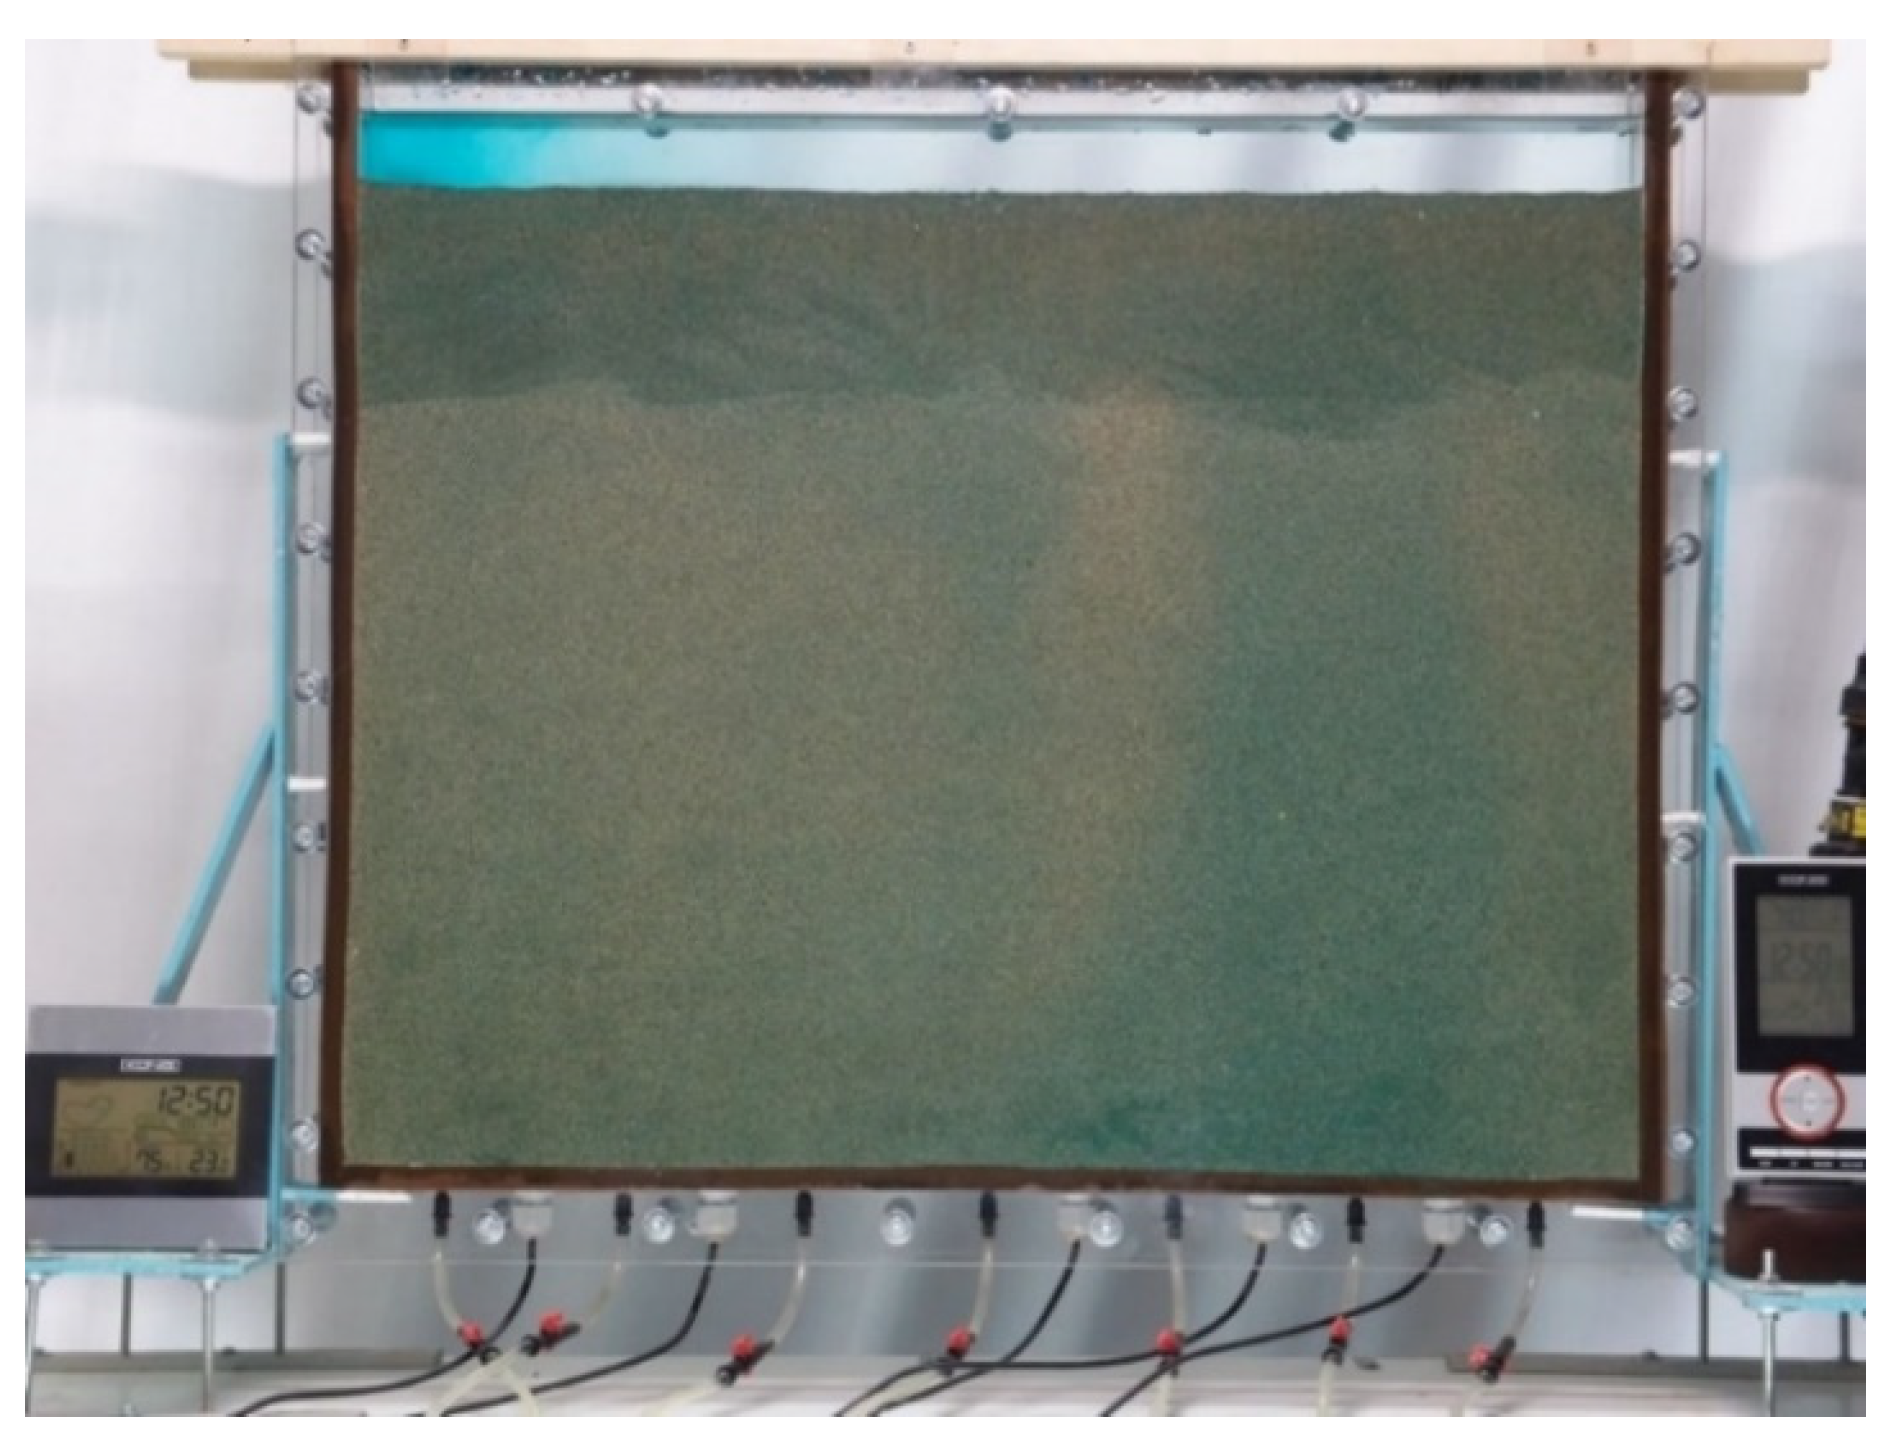
The second irrigation, used for the validation of the model, took place on 11/5/2014. In this experiment, the dye Erioglausine A [47] was used to depict the phenomenon better. This dye is often used in similar works [48,49,50,51] to have a better view of the water flow (Figure 9). The amount of dye used was 6 g. In this figure, the effect of the longest macropore (40 cm) is most evident in the right part of the figure. The effect of the middle macropore (20 cm) is shown in the middle of the photo, while the effect of the two smallest macropores (10 cm) is shown on the left part of the picture.
The third irrigation took place on 7/10/14 and was similar in quantity and duration to the previous irrigation. However, in this irrigation, only water (without dye) was used to clean the soil of the device from the dye (Figure 10).
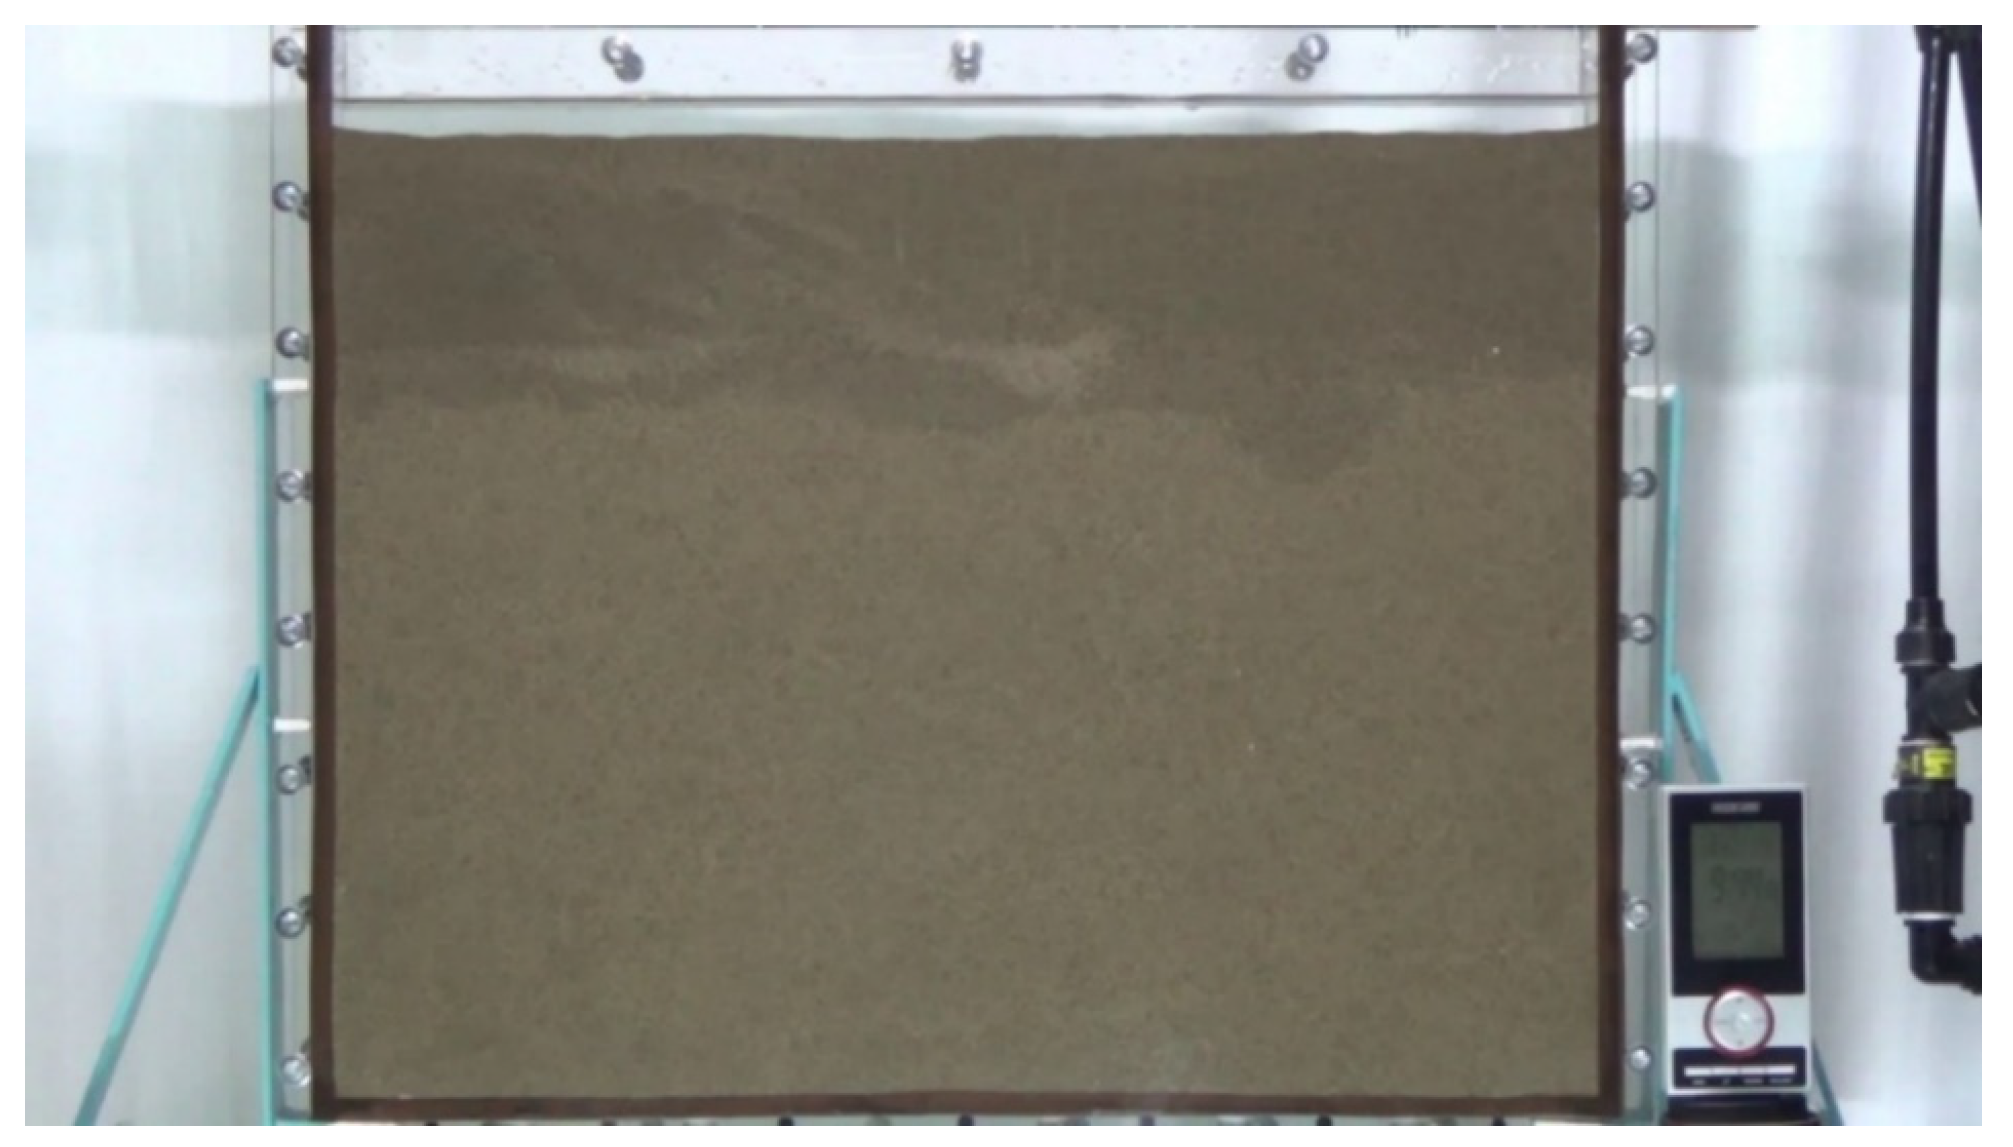
The fourth irrigation took place on 21/10/14 and was larger than the previous ones. The irrigation water was applied without any dye. Because of the large amount of water applied, the ponding was larger than the previous irrigation, as shown in Figure 11.
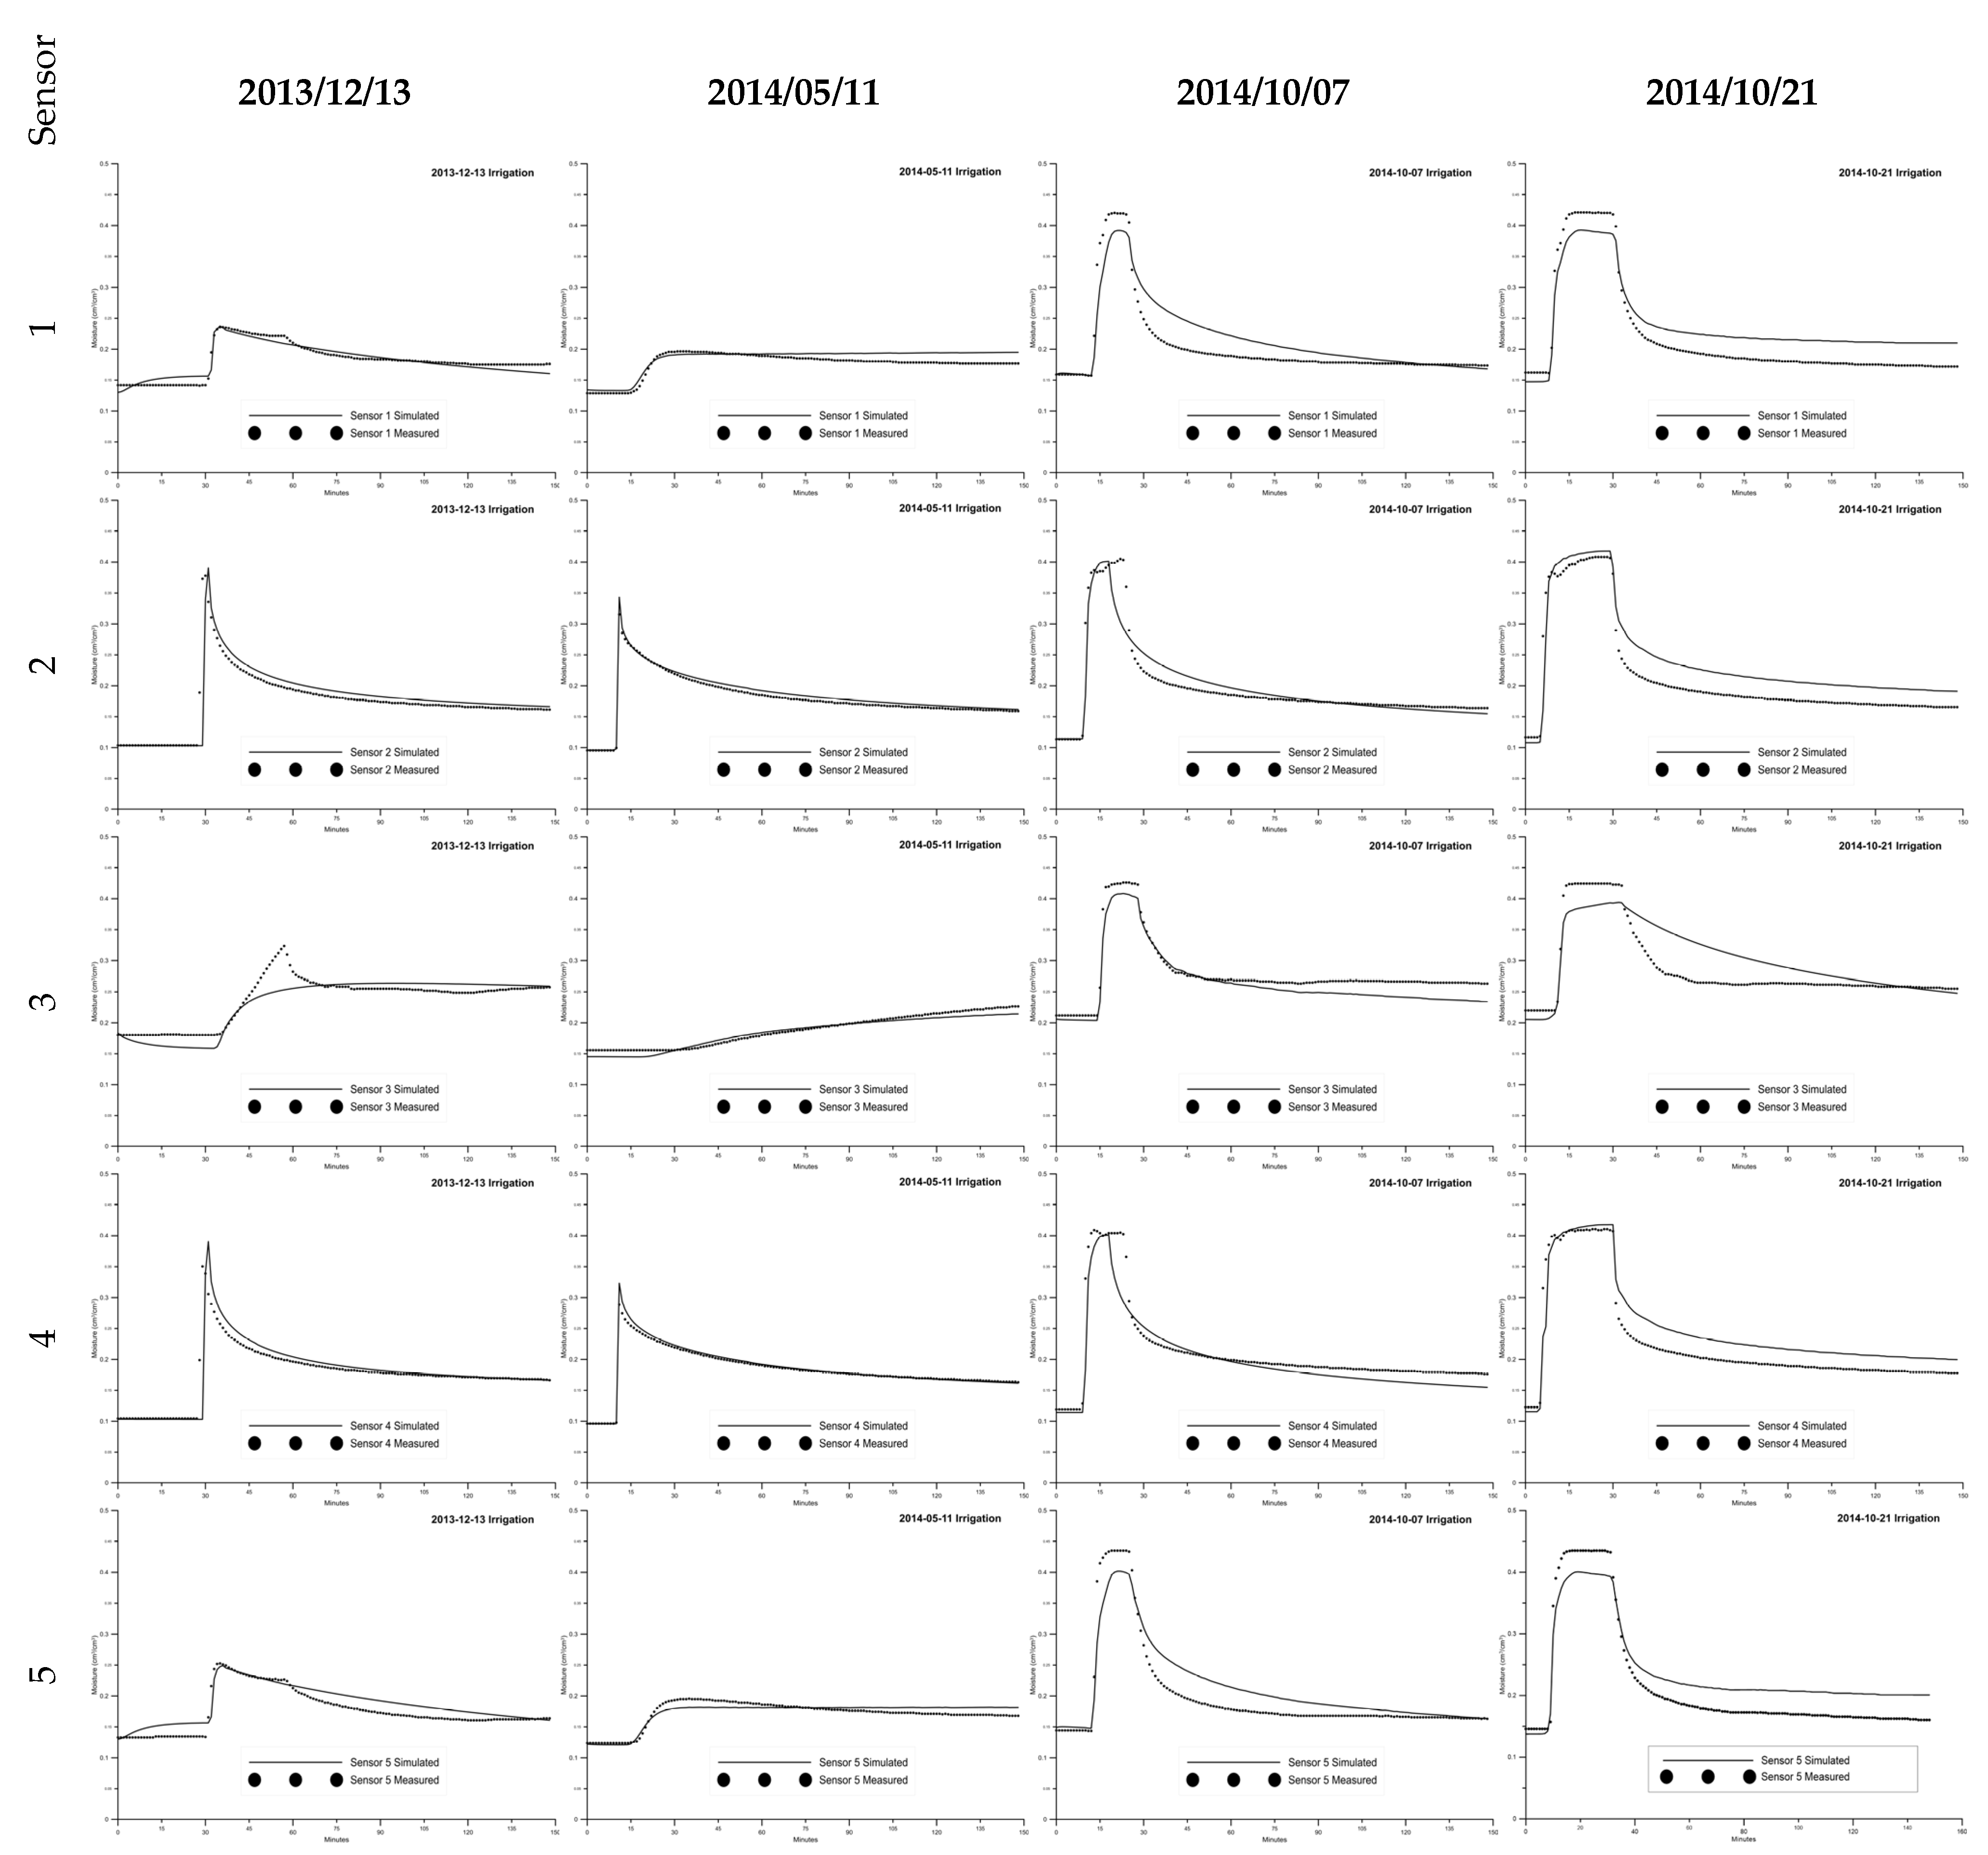
Figure 12 shows the comparison of the simulated water content with the measured water content profiles at the five sensors for the four irrigations used for the validation of the model.
Table 3 presents the statistical criteria resulting from the comparison of the simulated results with the measurements at the five sensors. The best value found for each statistical criterion per irrigation is underlined. In the same table, the irrigation’s height (h in mm) and duration (t in mins), and the temperature (θ in °C) and the relative humidity (RH in %) are also shown.
Specifically for the first irrigation (2013/12/13), the RMS value ranged from 0.008 and 0.025. The mean absolute error (MAE, cm3/cm3) varied between 0.007 and 0.013 cm3/cm3. The efficiency of the model (MEF, -) for all of the sensors ranged from 0.717 to 0.913, very close to the optimal value of the criterion (=1). Τhe mass deficit coefficient (CRM, -) ranged from −0.057 to 0.018. It was negative for sensors 2, 4, and 5, where the model underestimated the water content and was positive for sensors 1 and 3, where the model overestimated the water content.
For the second irrigation (2014/05/11), the RMS value ranged from 0.004 and 0.011. The mean absolute error (MAE, cm3/cm3) varied between 0.002 and 0.009 cm3/cm3. The efficiency of the model (MEF, -) for all of the sensors ranged from 0.681 to 0.984 and approached the optimal value for the criterion (=1). Finally, the mass deficit coefficient (CRM, -) ranged from −0.045 to 0.017. It was negative for sensors 1, 2, 4, and 5, showing that the model slightly underestimated the water content, while was positive for sensor 3. In general, the observation that all of the values of CRM, both positive and negative, were close to zero indicates that the Leak 2D model adequately simulated all irrigations with a high degree of accuracy.
For the third irrigation (2014/10/07), the RMS value ranged from 0.018 and 0.029. The mean absolute error (MAE, cm3/cm3) was between 0.013 and 0.022 cm3/cm3. The efficiency of the model (MEF, -) for all the sensors was positive and approached the optimal value of the criterion (=1) and its value ranged from 0.808 to 0.887. The mass deficit coefficient (CRM, -) for sensors 1, 2, and 5 was negative and positive for sensors 3 and 4. For sensors 1, 2, and 5, the model underestimated the moisture. Its values ranged from −0.066 to 0.061.
For the fourth irrigation (2014/10/21) the RMS value ranged from 0.029 and 0.035. The mean absolute error (MAE, cm3/cm3) was between 0.025 and 0.033 cm3/cm3. The efficiency of the model (MEF, -) for all of the sensors was positive and approached the optimal value of the criterion (=1) and its value ranged from 0.661 to 0.874. Finally, the mass deficit coefficient (CRM, -) for all sensors was negative (the model underestimates the moisture). Its values ranged from −0.066 to 0.061.
In general terms, it was observed that there was an inverse relation between the irrigation height and the accuracy of the simulated results. The statistical criteria of the simulations (Table 3) were improved with smaller irrigation heights. This might be explained by the higher hydraulic gradients, which were observed in the larger irrigation heights. In addition, as expected, the simulation results were similar for the sensors inserted to the same depth (2 and 4, and 1 and 5). The small differences in the values of the statistical criteria at the sensors located at the same depth were attributed to the different lengths of the artificial macropores close to the corresponding sensors.
In general, the results of the deepest Sensor 3 showed a more significant difference between the measured and simulated values. This can be justified by the effect of the bottom boundary condition (free drainage) on the results of the model, as well as the distance between the sensor location and the artificial macropores. The effect of boundary conditions or hydraulic gradients on the model boundaries could be the cause of any discrepancies between the model results compared with the measured values.
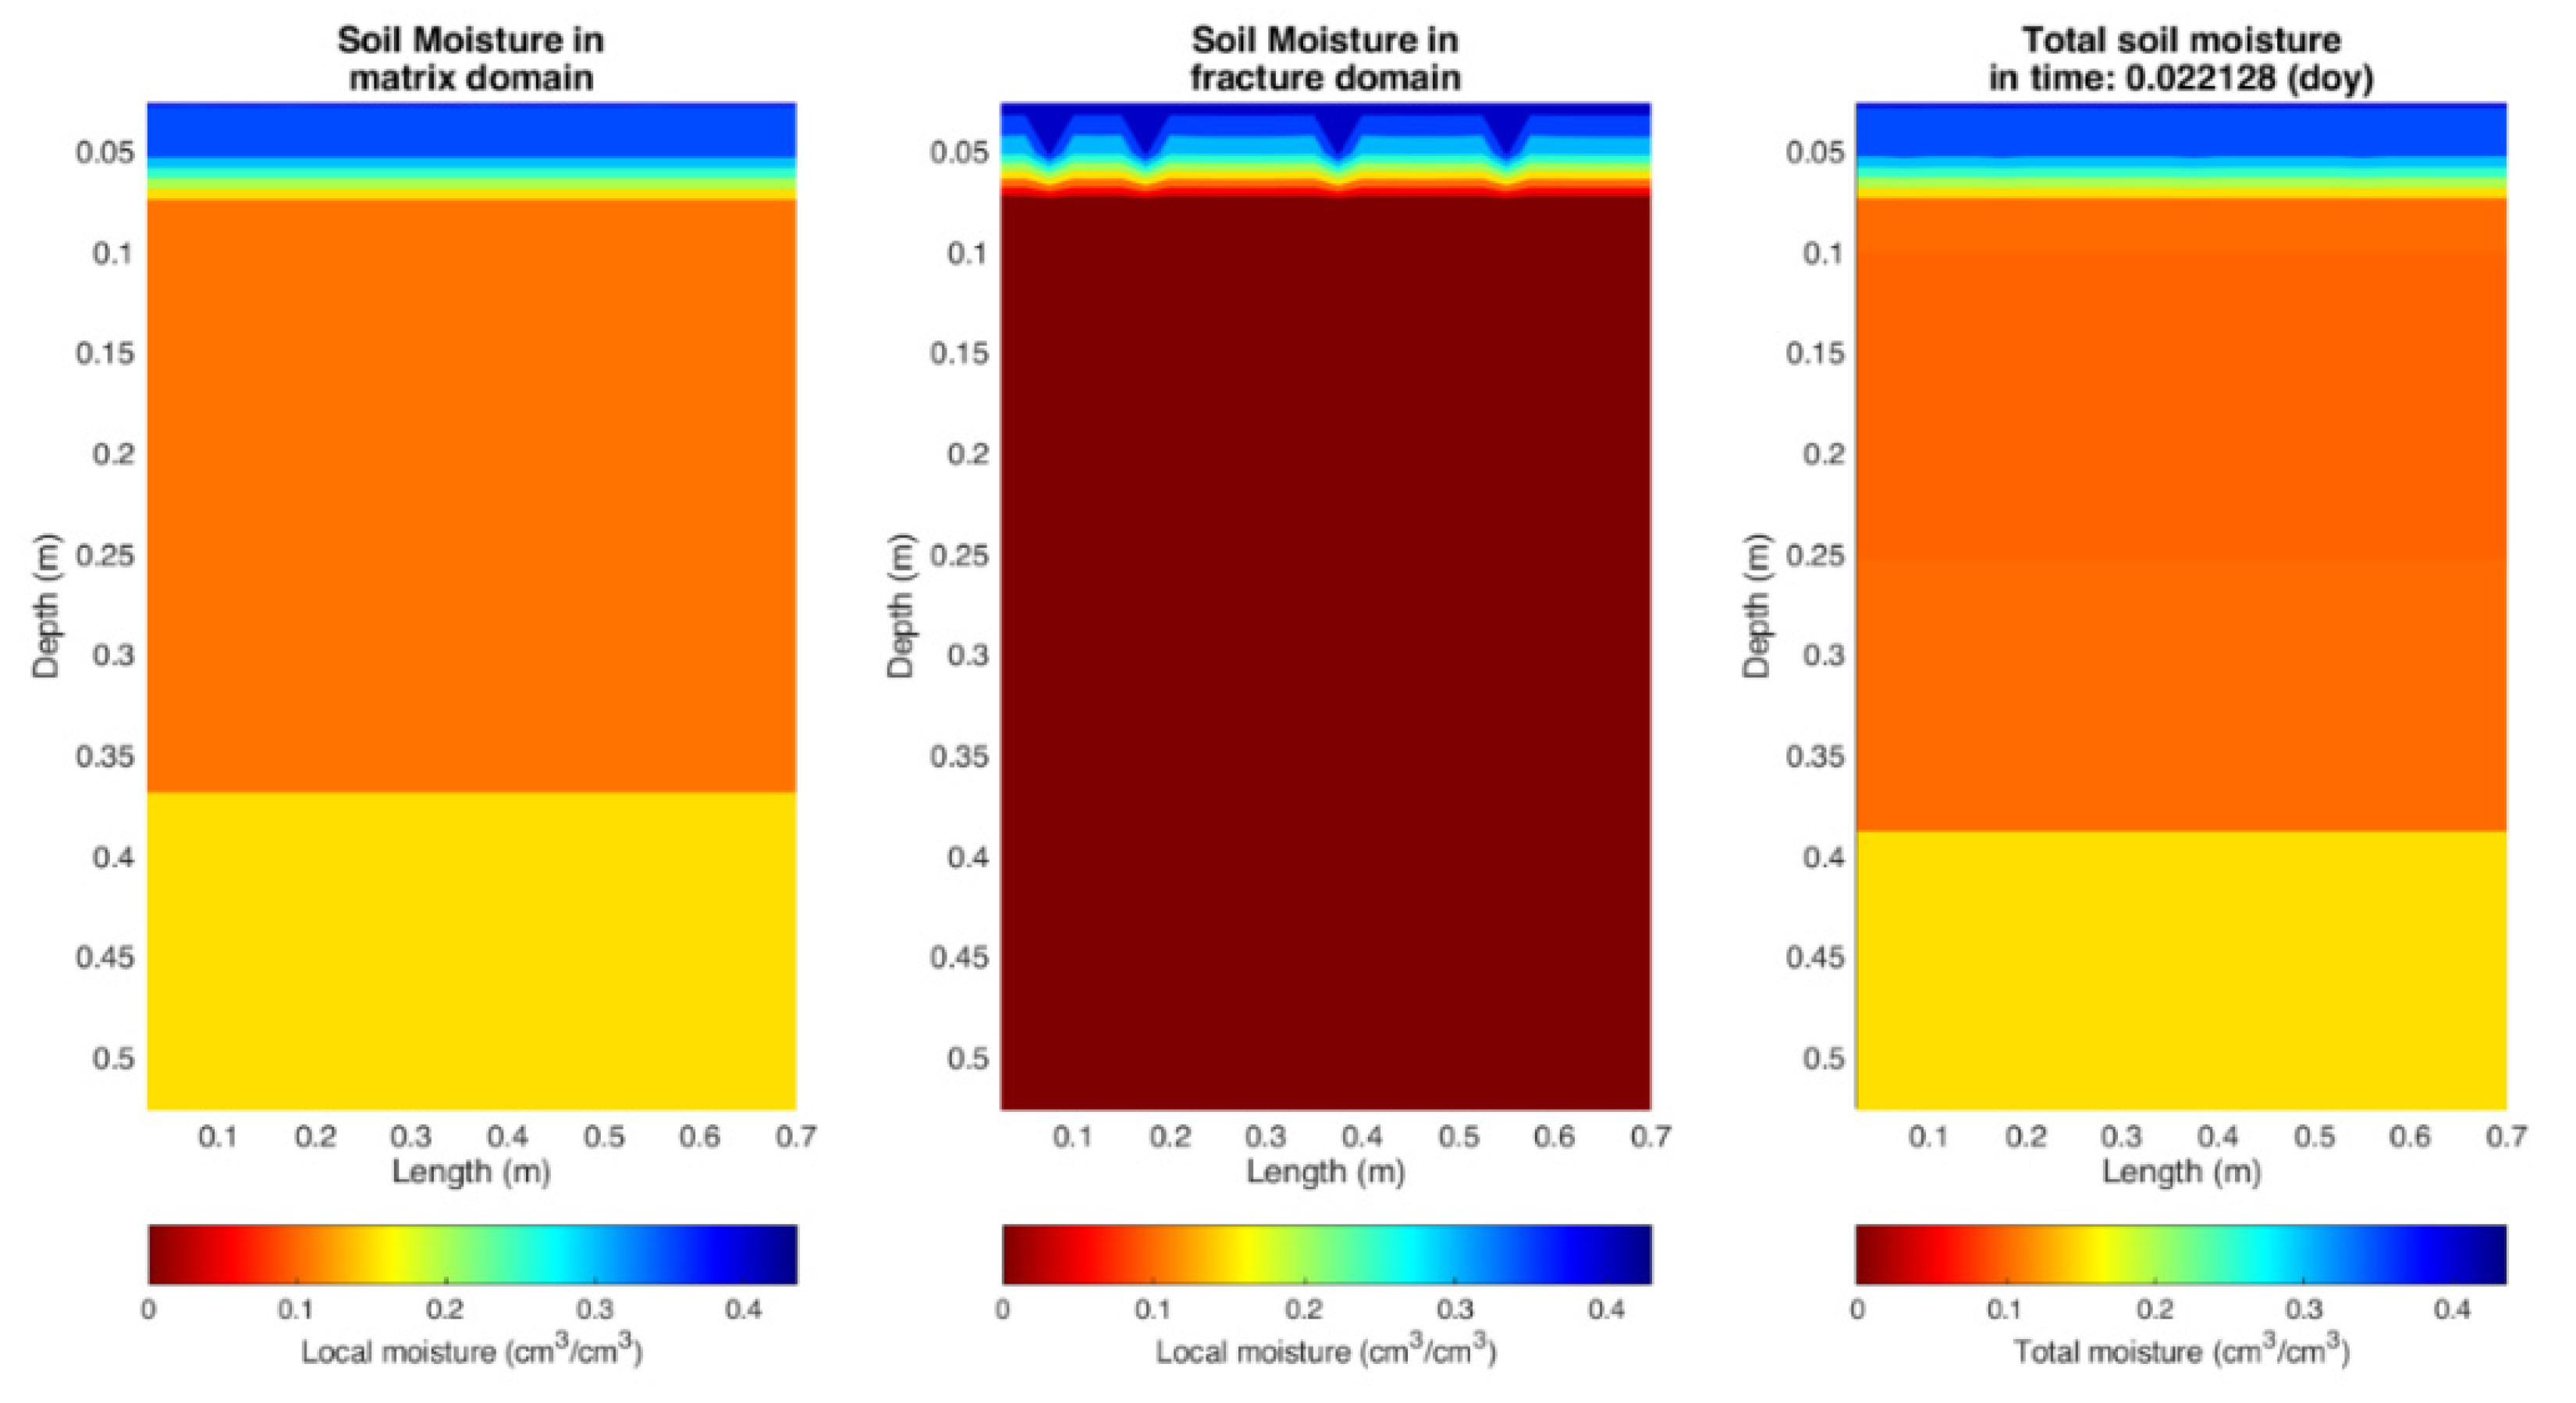
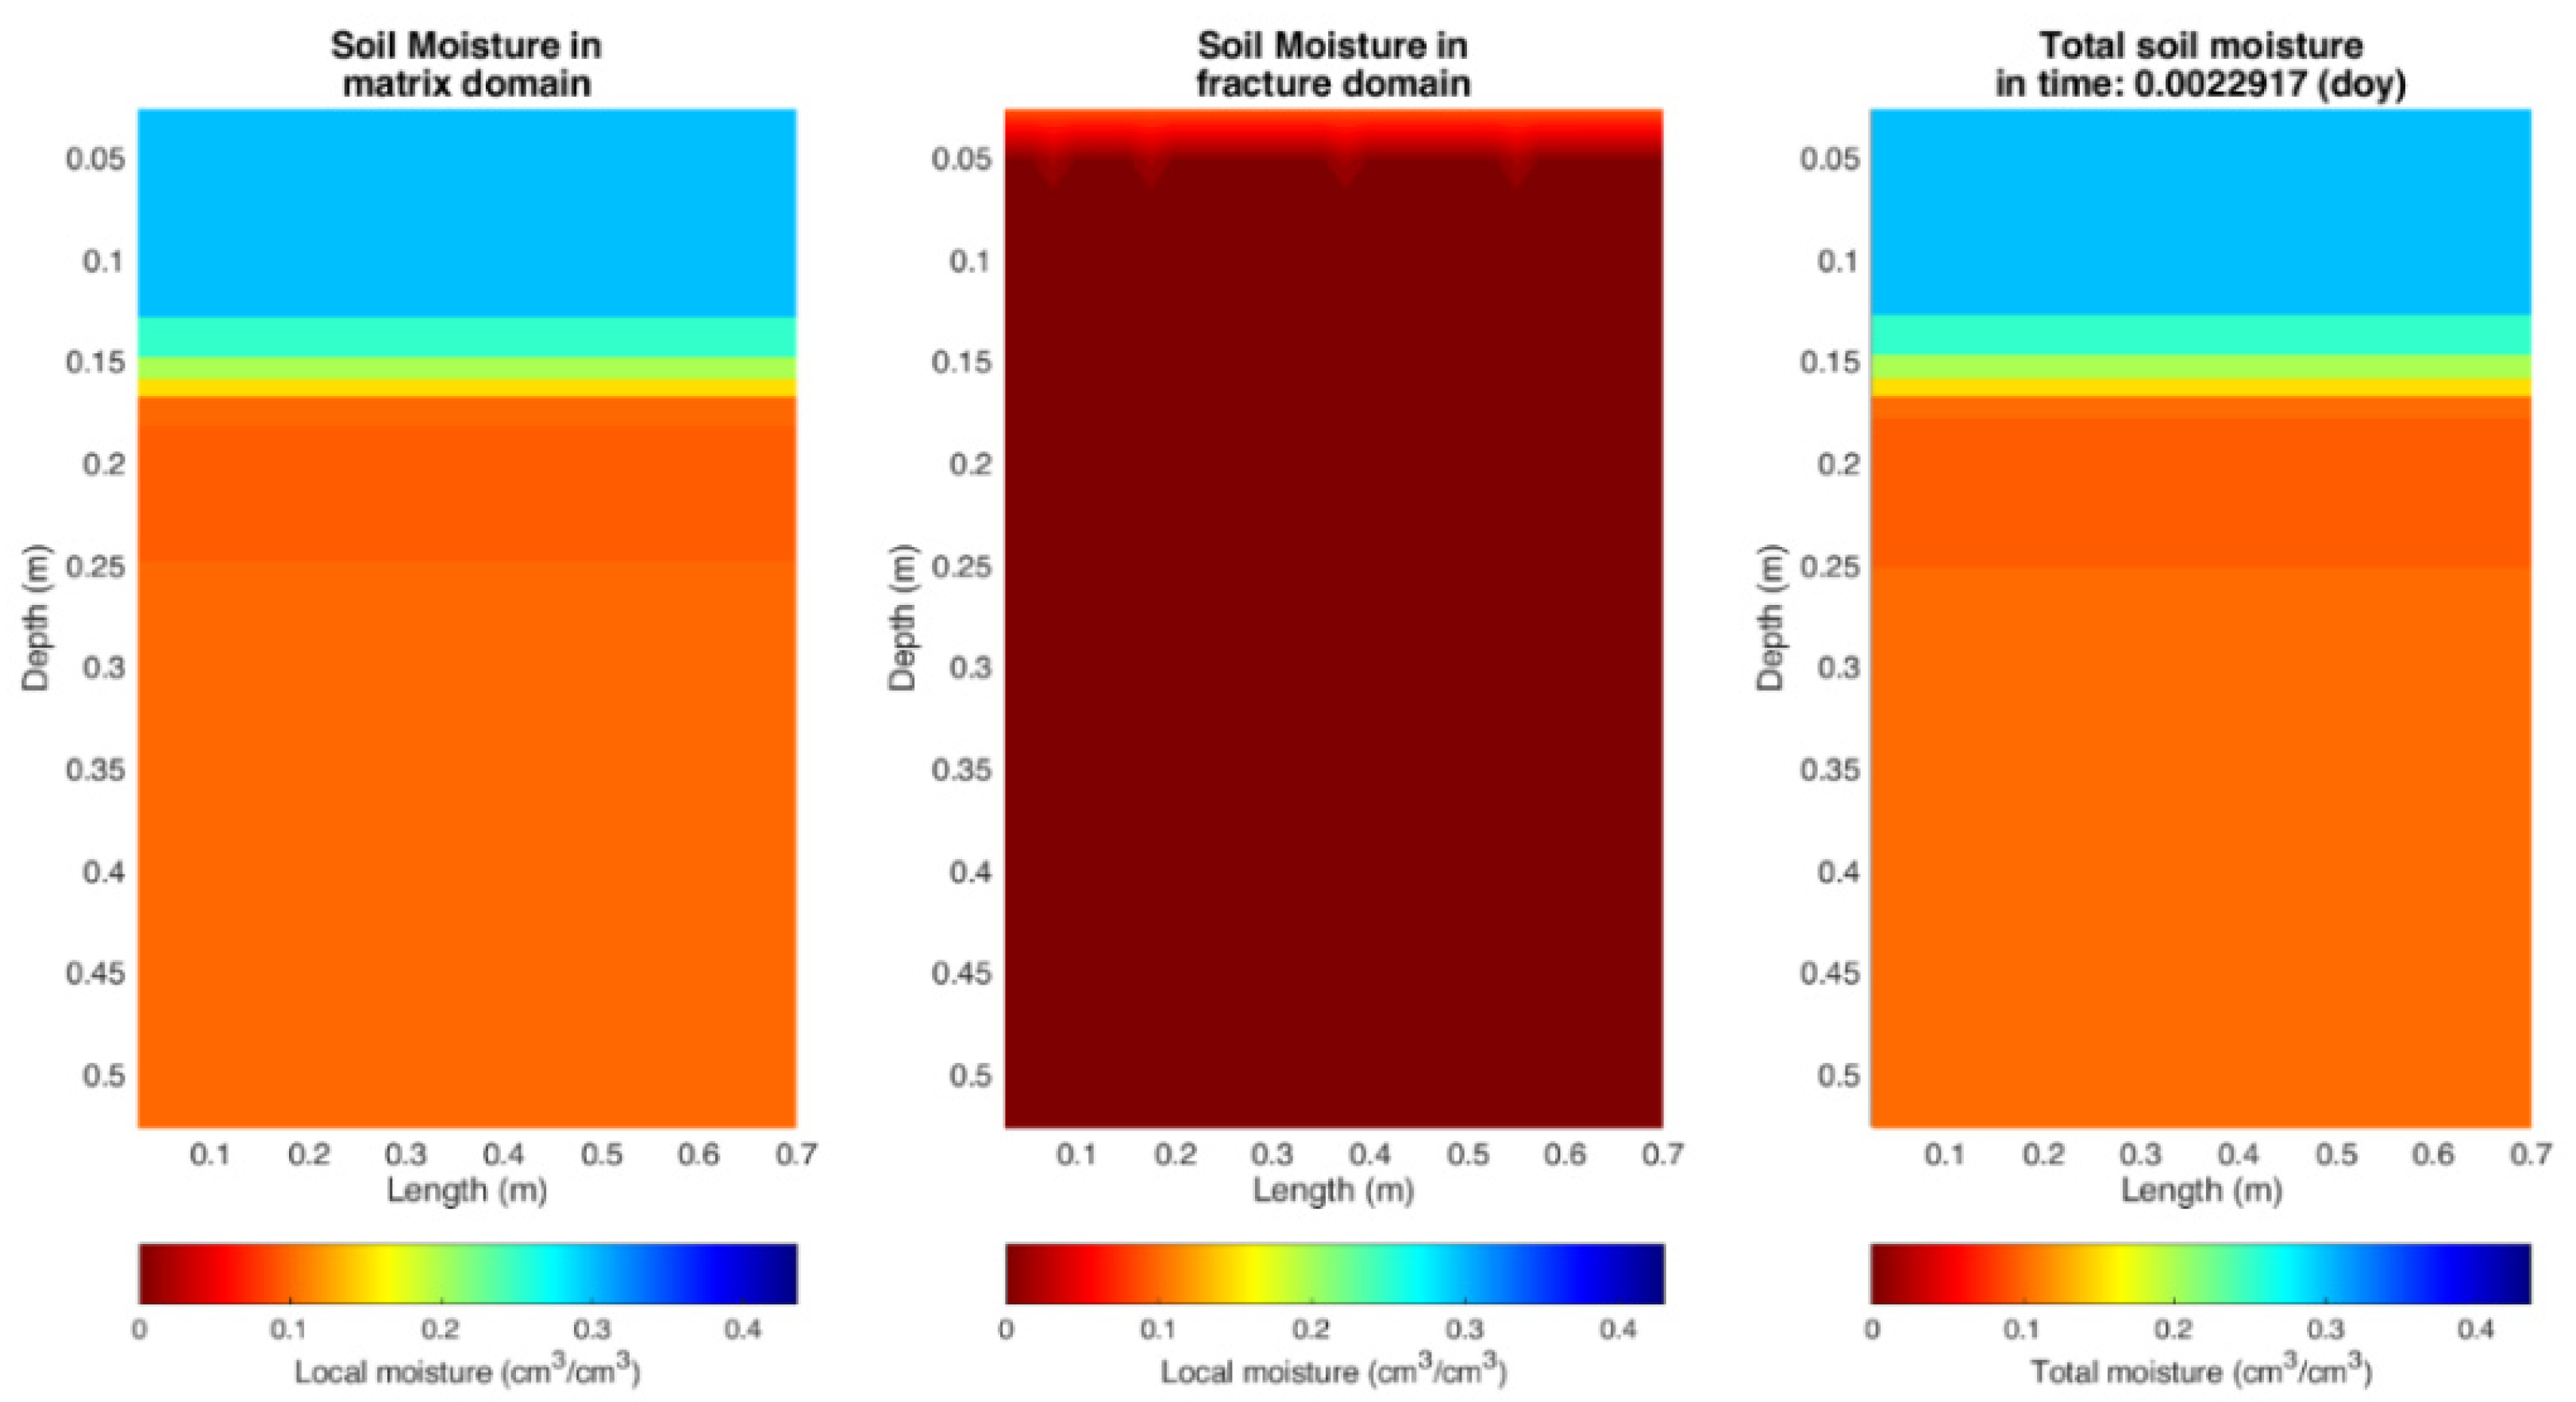
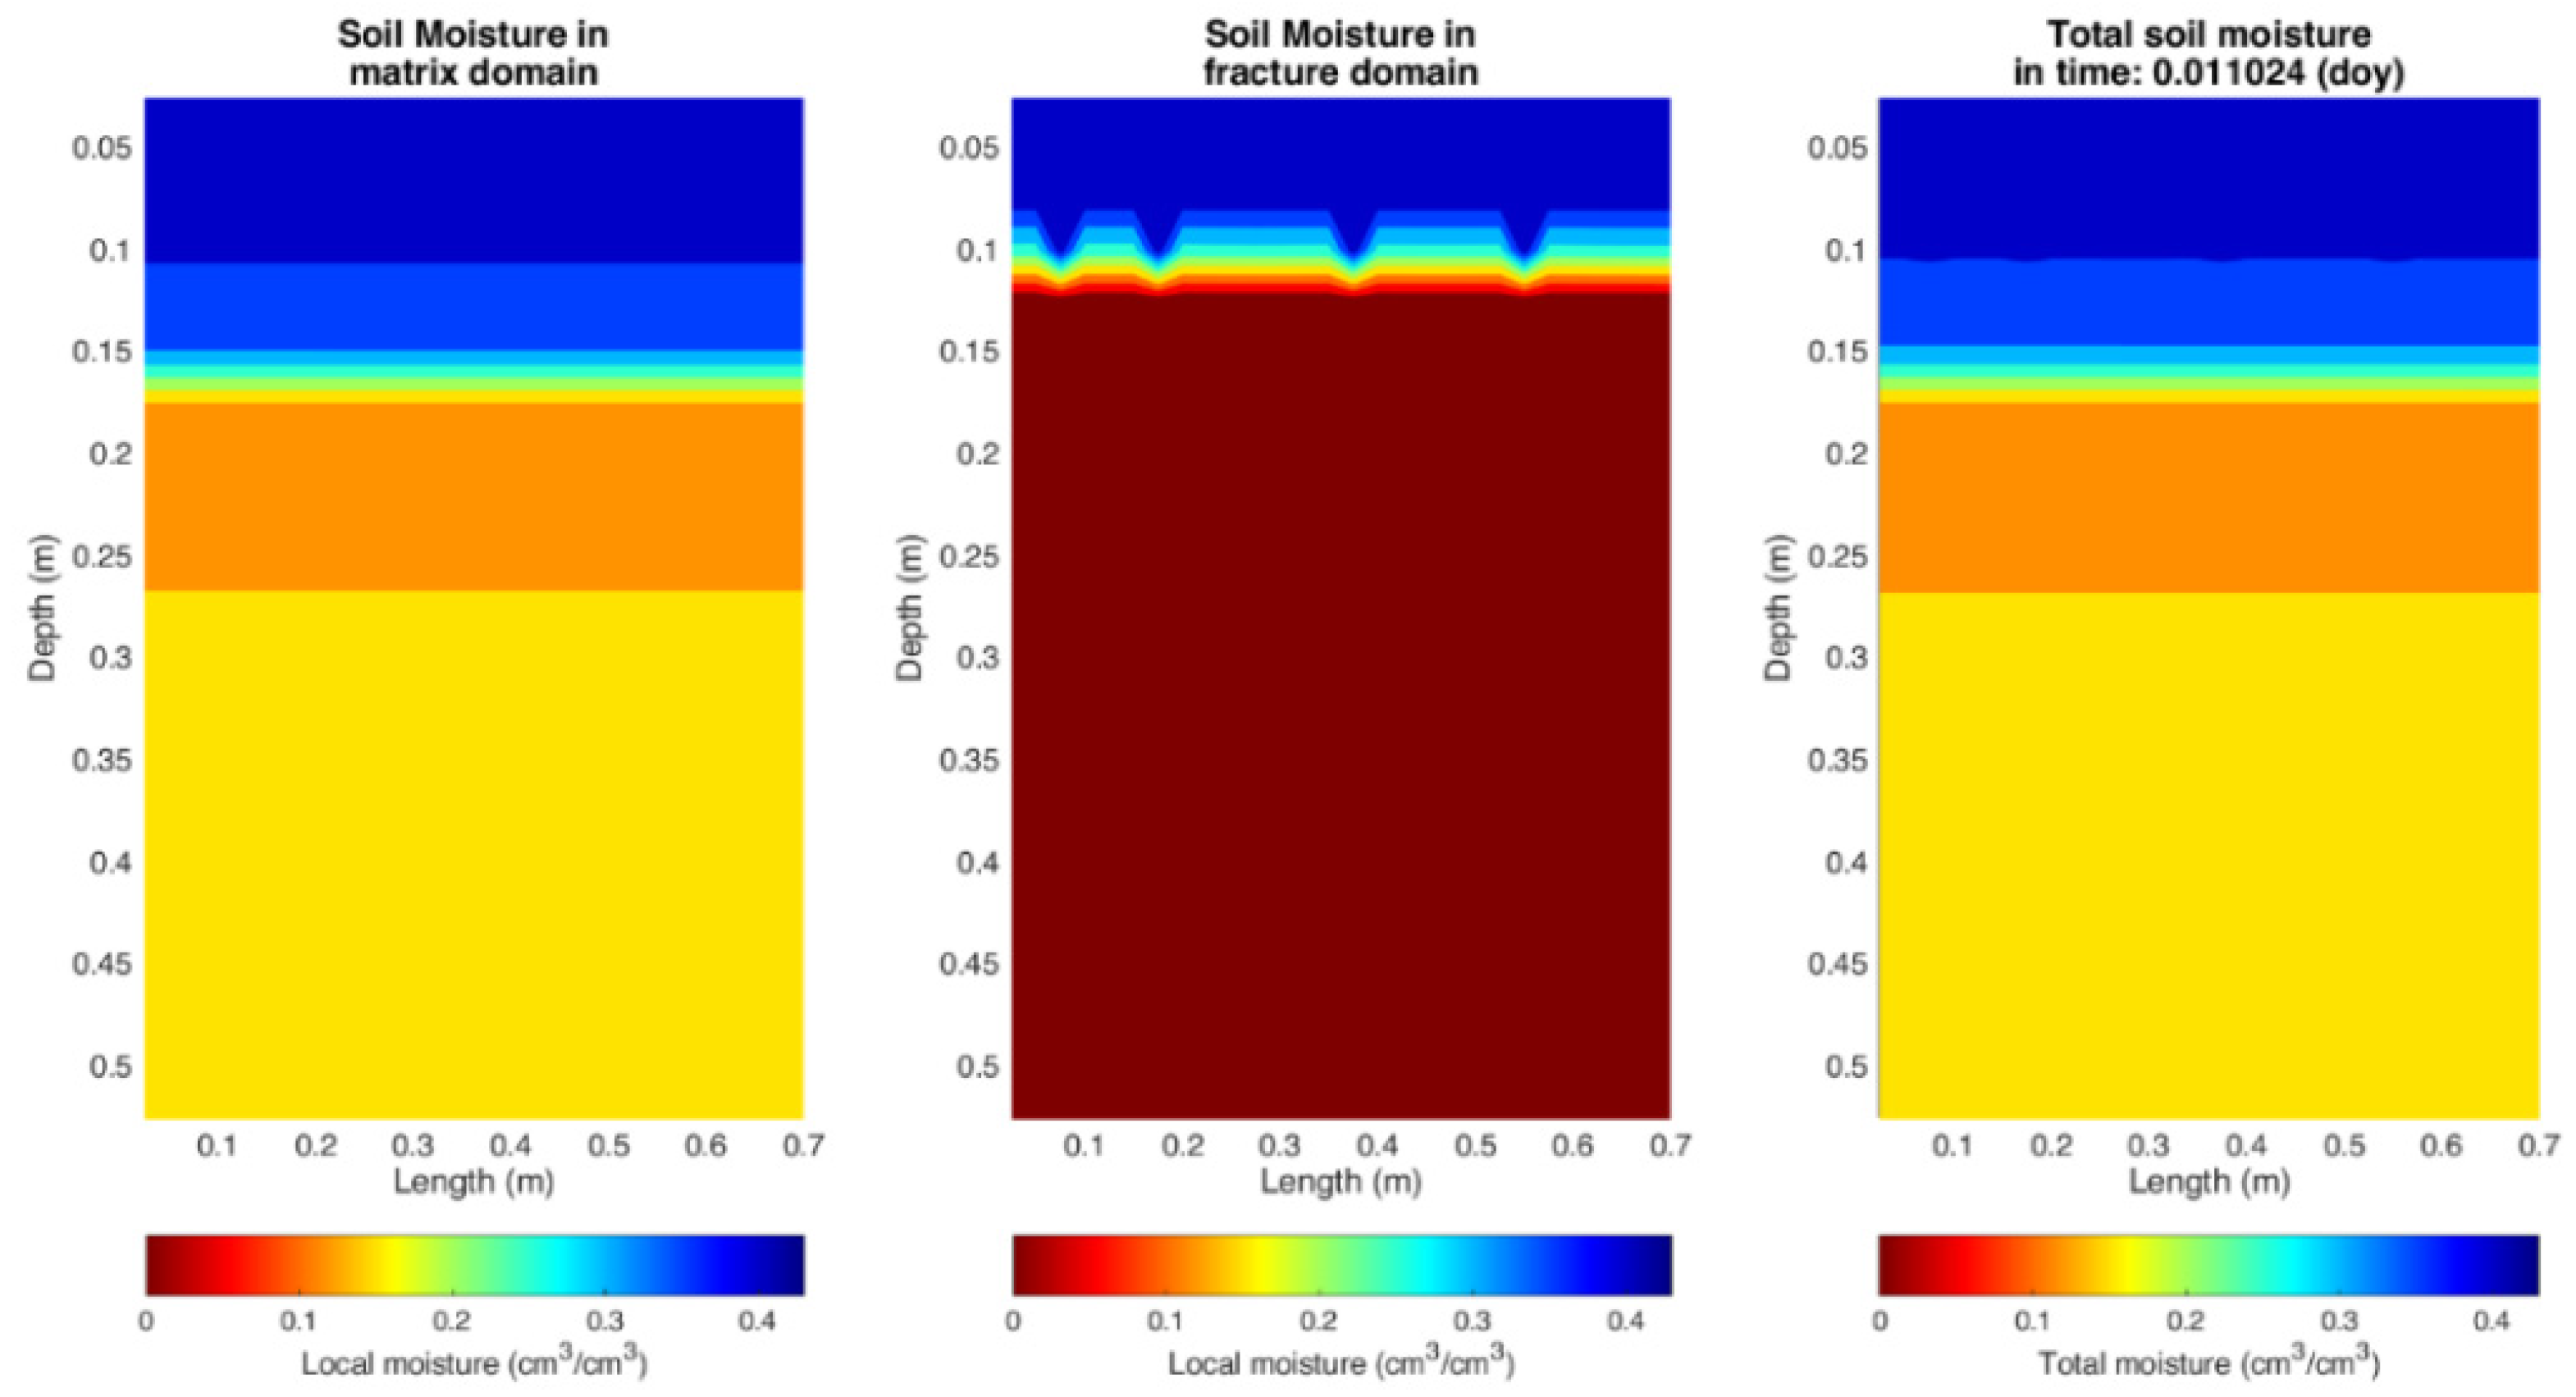
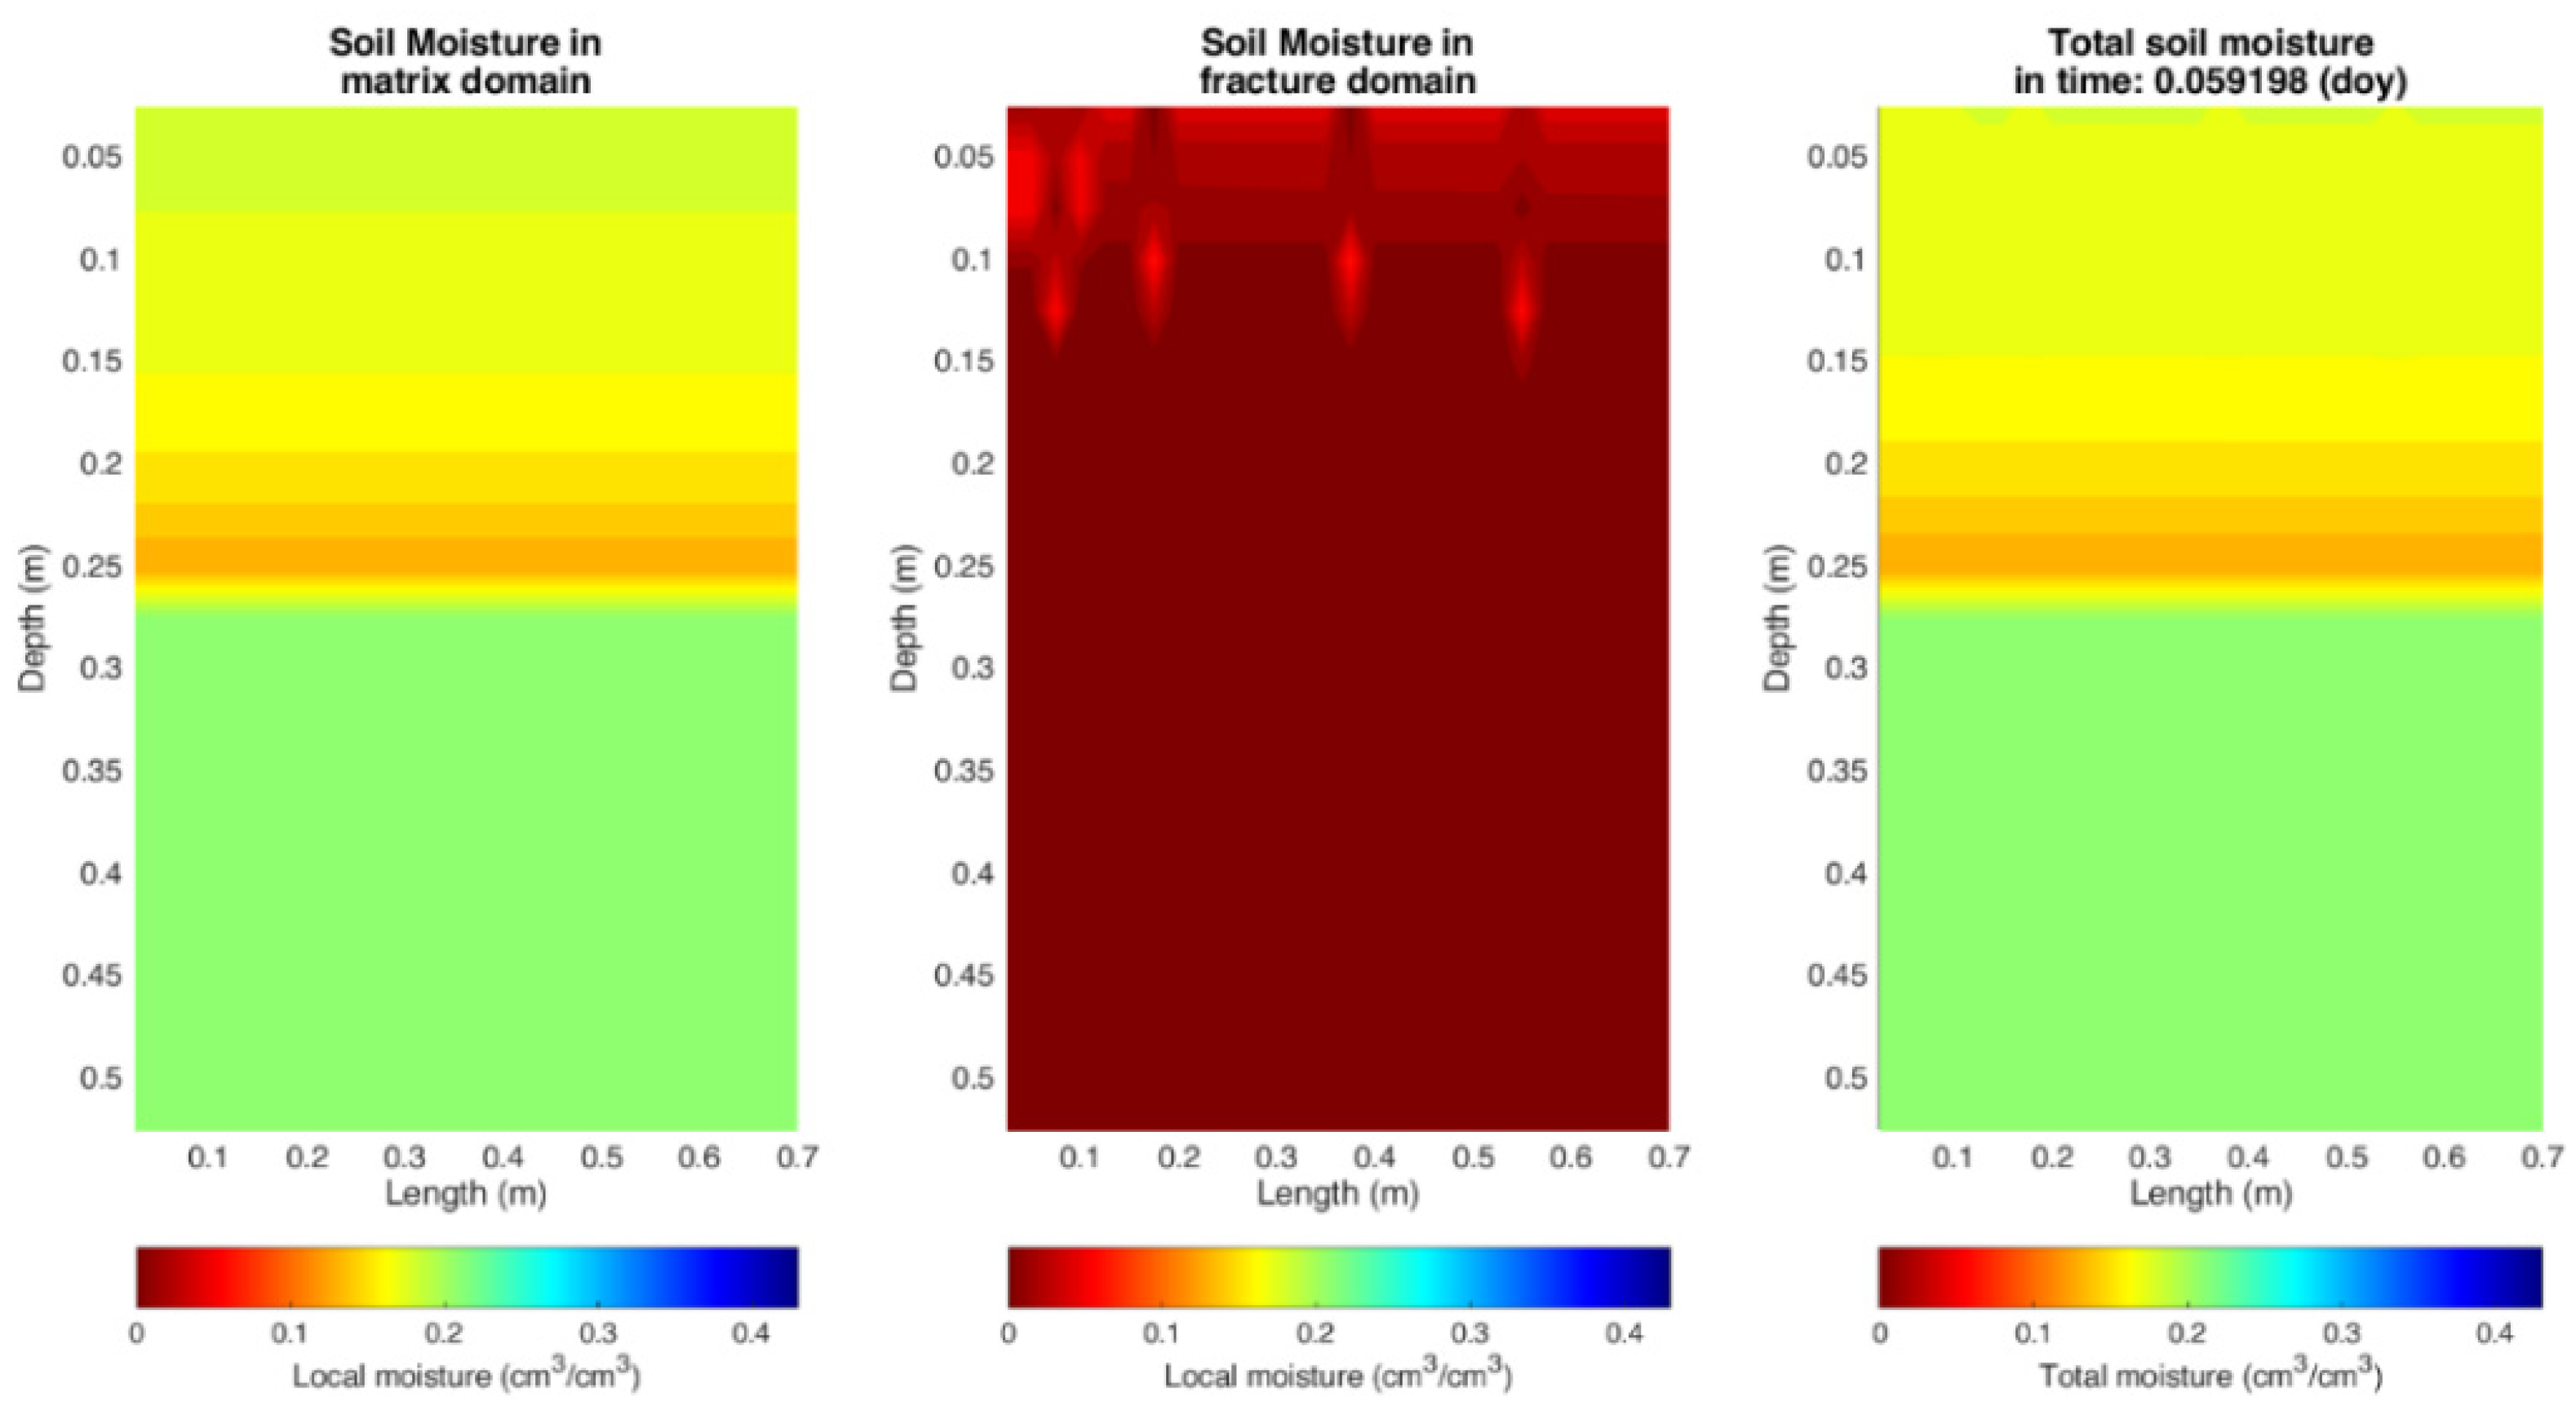
Figure 13, Figure 14, Figure 15 and Figure 16 show the simulated soil moisture profiles (matrix, fracture domain, and total) for the four irrigations used to validate the model. The moment that these profiles were recorded are indicative of the flow of the water to the fracture domain. The moisture content at the fracture domain was almost zero, except from the moments when the moisture content at the matrix domain was close to saturation.
This fact was in agreement with the fundamental assumption of the model that flow in the fracture domain was initiated only when the water content of the soil matrix exceeded a critical (near saturation) value and the water entry pressure value was exceeded [12]. Even though the irrigations were extreme, the excess water content of the soil matrix above this critical value occurred a few moments during the simulations.

4. Conclusions

Leak 2D [28] is a mathematical model that is very effective at simulating preferential flow in the vadose zone. The model was calibrated and validated in a Hele-Shaw apparatus, which was constructed for this reason and in which artificial macropores were inserted. The use of artificial macropores proved to be very important for the investigation of preferential flow in the vadose zone, especially in soils where fracture is difficult to be quantified.
The calibration of the mathematical model took place before inserting the artificial macropores into the device. The calibration was related to the refinement of the measured retention curve of the matrix domain of the soil. For this reason, two extreme irrigations of 125 mm and 80 mm in 5 and 3.25 min, respectively, were used.
The HYDRUS-1D inverse modeling capability was used to estimate the best values of the retention curve parameters for the matrix domain [6]. After the completion of the calibration process, four artificial macropores were inserted into the soil of the device. For the validation of the model, four irrigations of different water heights were used. Although these irrigations were of extreme size, Leak 2D satisfactorily predicted the preferential flow into the soil. This was depicted in the values of the statistical criteria that were used. In particular, the total RMS value ranged from 0.008 to 0.033. The total mean absolute error (MAE, cm3/cm3) varied between 0.006 and 0.029 cm3/cm3. The total efficiency of the model (MEF,-) ranged from 0.763 to 0.928. Finally, the total mass deficit coefficient (CRM,-) ranged from −0.088 to 0.02. It was slightly negative for the irrigations from 2013/12/13, 2014/05/11, and 2014/10/21, and slightly positive for the 2014/10/07 irrigation, showing that the model, in total, did not present a systematically biased estimation of the water content. For each irrigation event, the model’s accuracy was assessed based on these criteria. Overall, the Leak 2D model exhibited a satisfactory performance in simulating soil water distribution. The RMS and MAE values were generally low, indicating a good fit between the simulated and measured soil moisture profiles. The MEF values, which measure the efficiency of the model, approached the optimal value of 1 for most sensors, indicating a high degree of accuracy in the model’s predictions. However, some sensors showed deviations from the optimal MEF value, suggesting slight discrepancies between the simulated and measured values. In all of the simulations, the Leak 2D model, despite the height of the irrigation dose, simulated the soil water distribution satisfactorily (Table 3) and without any computational instabilities. This indicates that the Leak 2D model is capable of accurately representing the complex behavior of water movement in soil. The utilization of pedotransfer functions (PTF) in conjunction with the Leak 2D model allowed for the generalization of results beyond the specific experimental conditions. By estimating the soil hydraulic parameters based on easily measurable soil properties, the model can be applied to a wide range of soil types and can overcome data limitations. However, careful validation and calibration of the PTFs against local data are crucial to ensure the accuracy and reliability of the model’s predictions in different regions and environmental settings.
This work provides data and simulations that can be utilized for investigating water contamination in areas characterized by shallow groundwater tables. The findings from this research can contribute to the understanding of water movement patterns and the distribution of soil water in such regions. However, it is important to note a possible limitation of the Leak 2D model employed in this study as it simulates the flow in the fracture domain using a one-dimensional equation. Furthermore, the accuracy of validation of Leak 2D using data obtained by a Hele-Shaw cell with soil that contains artificial macropores demonstrates the model’s efficiency at simulating the complex phenomenon of preferential flow of water. By successfully replicating this preferential flow phenomenon, the Leak 2D model proves its capability to capture the intricate dynamics of water movement in realistic and extreme irrigation scenarios. This is crucial for various applications, such as agricultural irrigation management, groundwater contamination studies, and hydrological modeling, where understanding preferential flow patterns is essential. Finally, the efficiency and reliable performance of the proposed tool in modeling complex water flow phenomena is encouraging for its applicability in real-world scenarios and it contributes to enhancing our understanding of soil−water interactions.

Author Contributions

Conceptualization, C.P., C.B. and D.K.; methodology, C.P., C.B. and D.K.; software, C.P.; validation, C.P., C.B. and D.K.; data curation, C.P.; investigation, C.P.; writing—original draft preparation, C.P.; writing—review and editing, C.P., C.B. and D.K.; visualization, C.P.; supervision, C.B. and D.K.; funding acquisition, D.K. All authors have read and agreed to the published version of the manuscript.

Funding

Part of this study was financially supported by the project “Experimental evaluation of the preferential flow in various soil types using a Hele-Shaw device” (Action C: Enhancing Research Activities for Basic Research in Aristotle University of Thessaloniki through the Research Committee 2012), Research Program Reference Number 89326.

Data Availability Statement

Not applicable.

Conflicts of Interest

The authors declare no conflict of interest.

References

  1. Li, M.; Yao, J.; Yan, R.; Cheng, J. Effects of infiltration amounts on preferential flow characteristics and solute transport in the protection forest soil of southwestern china. Water 2021, 13, 1301. [Google Scholar] [CrossRef]
  2. Wang, K.; Zhang, R.; Sheng, F. Characterizing heterogeneous processes of water flow and solute transport in soils using multiple tracer experiments. Vadose Zone J. 2013, 12, vzj2012.0125. [Google Scholar] [CrossRef]
  3. Nimmo, J.R. The processes of preferential flow in the unsaturated zone. Soil Sci. Soc. Am. J. 2021, 85, 1–27. [Google Scholar] [CrossRef]
  4. Ahuja, L.R.; Johnsen, K.E.; Heathman, G.C. Macropore Transport of a Surface-Applied Bromide Tracer: Model Evaluation and Refinement. Soil Sci. Soc. Am. J. 1995, 59, 1234–1241. [Google Scholar] [CrossRef]
  5. Köhne, J.M.; Mohanty, B.P. Water flow processes in a soil column with a cylindrical macropore: Experiment and hierarchical modeling. Water Resour. Res. 2005, 41. [Google Scholar] [CrossRef] [Green Version]
  6. Šimůnek, J.; Šejna, M.; Saito, H.; Sakai, M.; van Genuchten, M. The HYDRUS-1D Software Package for Simulating the One-Dimensional Movement of Water, Heat, and Multiple Solutes in Variably-Saturated Media, Version 4.17; Department of Environmental Sciences, University of California: Riverside, CA, USA, 2013; p. 343. [Google Scholar]
  7. Šimůnek, J.; van Genuchten, M.; Šejna, M. The HYDRUS Software Package for Simulating Two- and Three-Dimensional Movement of Water, Heat, and Multiple Solutes in Variably-Saturated Media, Technical Manual, Version 2.0; Department of Environmental Sciences, University of California: Riverside, CA, USA, 2012; p. 260. [Google Scholar]
  8. Ross, P.J.; Smettem, K.R.J. A simple treatment of physical nonequilibrium water flow in soils. Soil Sci. Soc. Am. J. 2000, 64, 1926–1930. [Google Scholar] [CrossRef]
  9. Moradzadeh, M.; Boroomandnasab, S.; Moazed, H.; Alavi, J.; Jamalian, A.; Khaledian, M.; Ruy, S. A new kinematic–dispersive wave van Genuchten (KDW-VG) model for numerical simulation of preferential water flow in soil. J. Hydrol. 2020, 582, 124480. [Google Scholar] [CrossRef]
  10. Jabro, J.; Toth, J.; Fox, R. Evaluation and Comparison of Five Simulation Models for Estimating Water Drainage Fluxes under Corn. J. Environ. Qual. 1998, 27, 1376–1381. [Google Scholar] [CrossRef]
  11. Jarvis, N. Modeling the impact of preferential flow on nonpoint source pollution. In Physical nonequilibrium in soils: Modeling and application; Magdi Selim, H., Liwang, M., Eds.; Ann Arbor Press: Chelsea, Michigan, 1998; pp. 195–221. [Google Scholar]
  12. Larsbo, M.; Jarvis, N. MACRO 5.0. A Model of Water Flow and Solute Transport in Macroporous Soil. Technical Description; Department of Soil Sciences, Swedish University of Agricultural Sciences: Uppsala, Sweden, 2003; p. 52. [Google Scholar]
  13. Addiscott, T.M.; Bailey, N.J.; Bland, G.J.; Whitmore, A.P. Simulation of nitrogen in soil and winter wheat crops: A management model that makes the best use of limited information. Fertil. Res. 1991, 27, 305–312. [Google Scholar] [CrossRef]
  14. Jansson, P. Soil model user’s manual. In Avdelningsmeddelande-Sveriges Lantbruksuniversitet, Institutionen foer Markvetenskap, Avdelningen foer Lantbrukets Hydroteknik (Sweden); Department of Soil Sciences, Division of Agricultural Hydrotechnics, Swedish University of Agricultural Sciences: Uppsala, Sweden, 1991. [Google Scholar]
  15. Hutson, J.; Wagenet, R. Simulating nitrogen dynamics in soils using a deterministic model. Soil Use Manag. 1991, 7, 74–78. [Google Scholar] [CrossRef]
  16. Lengnick, L.L.; Fox, R.H. Simulation by NCSWAP of seasonal nitrogen dynamics in corn: I. soil nitrate. Agron. J. 1994, 86, 167–175. [Google Scholar] [CrossRef]
  17. Jiang, S.; Pang, L.; Buchan, G.D.; Simůnek, J.; Noonan, M.J.; Close, M.E. Modeling water flow and bacterial transport in undisturbed lysimeters under irrigations of dairy shed effluent and water using HYDRUS-1D. Water Res. 2010, 44, 1050–1061. [Google Scholar] [CrossRef] [PubMed]
  18. Shajari, F.; Einsiedl, F.; Rein, A. Characterizing Water Flow in Vegetated Lysimeters with Stable Water Isotopes and Modeling. Groundwater 2020, 58, 759–770. [Google Scholar] [CrossRef] [Green Version]
  19. Gerke, H.; Dusek, J.; Vogel, T. Solute Mass Transfer Effects in Two-Dimensional Dual-Permeability Modeling of Bromide Leaching from a Tile-Drained Field. Vadose Zone J. 2013, 12. [Google Scholar] [CrossRef]
  20. Antonopoulos, V.Z.; Georgiou, P.E.; Kolotouros, C.A. Soil water dynamics in cropped and uncropped fields in northern Greece using a dual-permeability model. Hydrol. Sci. J. 2013, 58, 1748–1759. [Google Scholar] [CrossRef] [Green Version]
  21. Richards, L.A. Capillary conduction of liquids through porous mediums. Physics 1931, 1, 318–333. [Google Scholar] [CrossRef]
  22. Šimůnek, J.; Jarvis, N.J.; van Genuchten, M.T.; Gärdenäs, A. Review and comparison of models for describing non-equilibrium and preferential flow and transport in the vadose zone. J. Hydrol. 2003, 272, 14–35. [Google Scholar] [CrossRef]
  23. Germann, P.; Beven, K. Kinematic wave approximation to infiltration into soils with sorbing macropores. Water Resour. Res. 1985, 21, 990–996. [Google Scholar] [CrossRef]
  24. An, H.; Ichikawa, Y.; Tachikawa, Y.; Shiiba, M. A new Iterative Alternating Direction Implicit (IADI) algorithm for multi-dimensional saturated–unsaturated flow. J. Hydrol. 2011, 408, 127–139. [Google Scholar] [CrossRef]
  25. Babajimopoulos, C. Revisiting the Douglas–Jones method for modelling unsaturated flow in a cultivated soil. Environ. Model. Softw. 2000, 15, 303–312. [Google Scholar] [CrossRef]
  26. Douglas, J.; Rachford, H.H. On the numerical solution of heat conduction problems in two and three space variables. Trans. Am. Math. Soc. 1956, 82, 421–439. [Google Scholar] [CrossRef]
  27. Gerke, H.H.; van Genuchten, M.T. A dual-porosity model for simulating the preferential movement of water and solutes in structured porous media. Water Resour. Res. 1993, 29, 305–319. [Google Scholar] [CrossRef]
  28. Paraskevas, C.; Babajimopoulos, C. A New Two-dimensional Dual-permeability Model of Preferential Water Flow in the Vadose Zone. J. Water Manag. Model. 2023, 31, C502. [Google Scholar]
  29. Larsbo, M.; Roulier, S.; Stenemo, F.; Kasteel, R.; Jarvis, N. An Improved Dual-Permeability Model of Water Flow and Solute Transport in the Vadose Zone. Vadose Zone J. 2005, 4, 398–406. [Google Scholar] [CrossRef] [Green Version]
  30. Gerke, H.; van Genuchten, M. Macroscopic representation of structural geometry for simulating water and solute movement in dual-porosity media. Adv. Water Resour. 1996, 19, 343–357. [Google Scholar] [CrossRef]
  31. Gerke, H.; van Genuchten, M. Evaluation of a first-order water transfer term for variably saturated dual-porosity flow models. Water Resour. Res. 1993, 29, 1225–1238. [Google Scholar] [CrossRef]
  32. Dusek, J.; Gerke, H.; Vogel, T. Surface boundary conditions in two-dimensional dual-permeability modeling of tile drain bromide leaching. Vadose Zone J. 2008, 7, 1287–1301. [Google Scholar] [CrossRef]
  33. Paraskevas, C.; Karpouzos, D.; Babajimopoulos, C. Estimation of soil waterfront velocity and saturated hydraulic conductivity in a Hele-Shaw apparatus with an optical flow method. Comput. Electron. Agric. 2021, 184, 106086. [Google Scholar] [CrossRef]
  34. Buttle, J.; Leigh, D. The influence of artificial macropores on water and solute transport in laboratory soil columns. J. Hydrol. 1997, 191, 290–313. [Google Scholar] [CrossRef]
  35. Castiglione, P.; Mohanty, B.P.; Shouse, P.J.; Simunek, J.; van Genuchten, M.T.; Santini, A. Lateral water diffusion in an artificial macroporous system. Vadose Zone J. 2003, 2, 212. [Google Scholar] [CrossRef]
  36. Czapar, G.; Horton, R.; Fawcett, R. Herbicide and Tracer Movement in Soil Columns Containing an Artificial Macropore. J. Environ. Qual. 1992, 21, 110–115. [Google Scholar] [CrossRef]
  37. Lamy, E.; Lassabatere, L.; Bechet, B.; Andrieu, H. Modeling the influence of an artificial macropore in sandy columns on flow and solute transfer. J. Hydrol. 2009, 376, 392–402. [Google Scholar] [CrossRef]
  38. Zhou, B.B.; Li, Y.; Wang, Q.J.; Jiang, Y.L.; Li, S. Preferential water and solute transport through sandy soil containing artificial macropores. Environ. Earth Sci. 2013, 70, 2371–2379. [Google Scholar] [CrossRef]
  39. Decagon Devices. EC-5 Soil Moisture Sensor User’s Manual (Version 2); Decagon Devices: Pullman, WA, USA, 2012; p. 24. [Google Scholar]
  40. Paraskevas, C.; Georgiou, P.; Ilias, A.; Panoras, A.; Babajimopoulos, C. Calibration equations for two capacitance water content probes. Int. Agrophysics 2012, 26, 285–293. [Google Scholar] [CrossRef]
  41. van Genuchten, M.T. A Closed-form Equation for Predicting the Hydraulic Conductivity of Unsaturated Soils. Soil Sci. Soc. Am. J. 1980, 44, 892–898. [Google Scholar] [CrossRef] [Green Version]
  42. Duan, Q.; Gupta, H.V.; Sorooshian, S.; Rousseau, A.N.; Turcotte, R. (Eds.) Calibration of Watershed Models; Water science and application; American Geophysical Union: Washington, DC, USA, 2003; Volume 6, ISBN 0-87590-355-X. [Google Scholar]
  43. Radcliffe, D.E.; Simunek, J. Soil Physics with HYDRUS: Modeling and Applications; CRC Press: Boca Raton, FL, USA, 2018; ISBN 9781315275666. [Google Scholar]
  44. Marquardt, D.W. An Algorithm for Least-Squares Estimation of Nonlinear Parameters. J. Soc. Ind. Appl. Math. 1963, 11, 431–441. [Google Scholar] [CrossRef]
  45. Loague, K.; Green, R.E. Statistical and graphical methods for evaluating solute transport models: Overview and application. J. Contam. Hydrol. 1991, 7, 51–73. [Google Scholar] [CrossRef]
  46. Gärdenäs, A.; Šimůnek, J.; Jarvis, N.; van Genuchten, M. Two-dimensional modelling of preferential water flow and pesticide transport from a tile-drained field. J. Hydrol. 2006, 329, 647–660. [Google Scholar] [CrossRef]
  47. Kalkwarf, D.; Henkens, R. Protolysis and hydrolysis reactions of erioglaucine in aqueous solutions. HW-SA US At. Energy Comm. 1960, HW-63824, 50–54. [Google Scholar]
  48. Flury, M.; Flühler, H. Brilliant Blue FCF as a Dye Tracer for Solute Transport Studies-A Toxicological Overview. J. Environ. Qual. 1994, 23, 1108–1112. [Google Scholar] [CrossRef]
  49. Ketelsen, H.; Meyer-Windel, S. Adsorption of brilliant blue FCF by soils. Geoderma 1999, 90, 131–145. [Google Scholar] [CrossRef]
  50. Vryzas, Z.; Papadakis, E.N.; Papadopoulou-Mourkidou, E. Leaching of Br-, metolachlor, alachlor, atrazine, deethylatrazine and deisopropylatrazine in clayey vadoze zone: A field scale experiment in north-east Greece. Water Res. 2012, 46, 1979–1989. [Google Scholar] [CrossRef] [PubMed]
  51. Wang, J.; Zhang, M.; Argiriou, A.A.; Wang, S.; Qu, D.; Zhang, Y.; Su, P. Recharge and Infiltration Mechanisms of Soil Water in the Floodplain Revealed by Water-Stable Isotopes in the Upper Yellow River. Sustainability 2021, 13, 9369. [Google Scholar] [CrossRef]
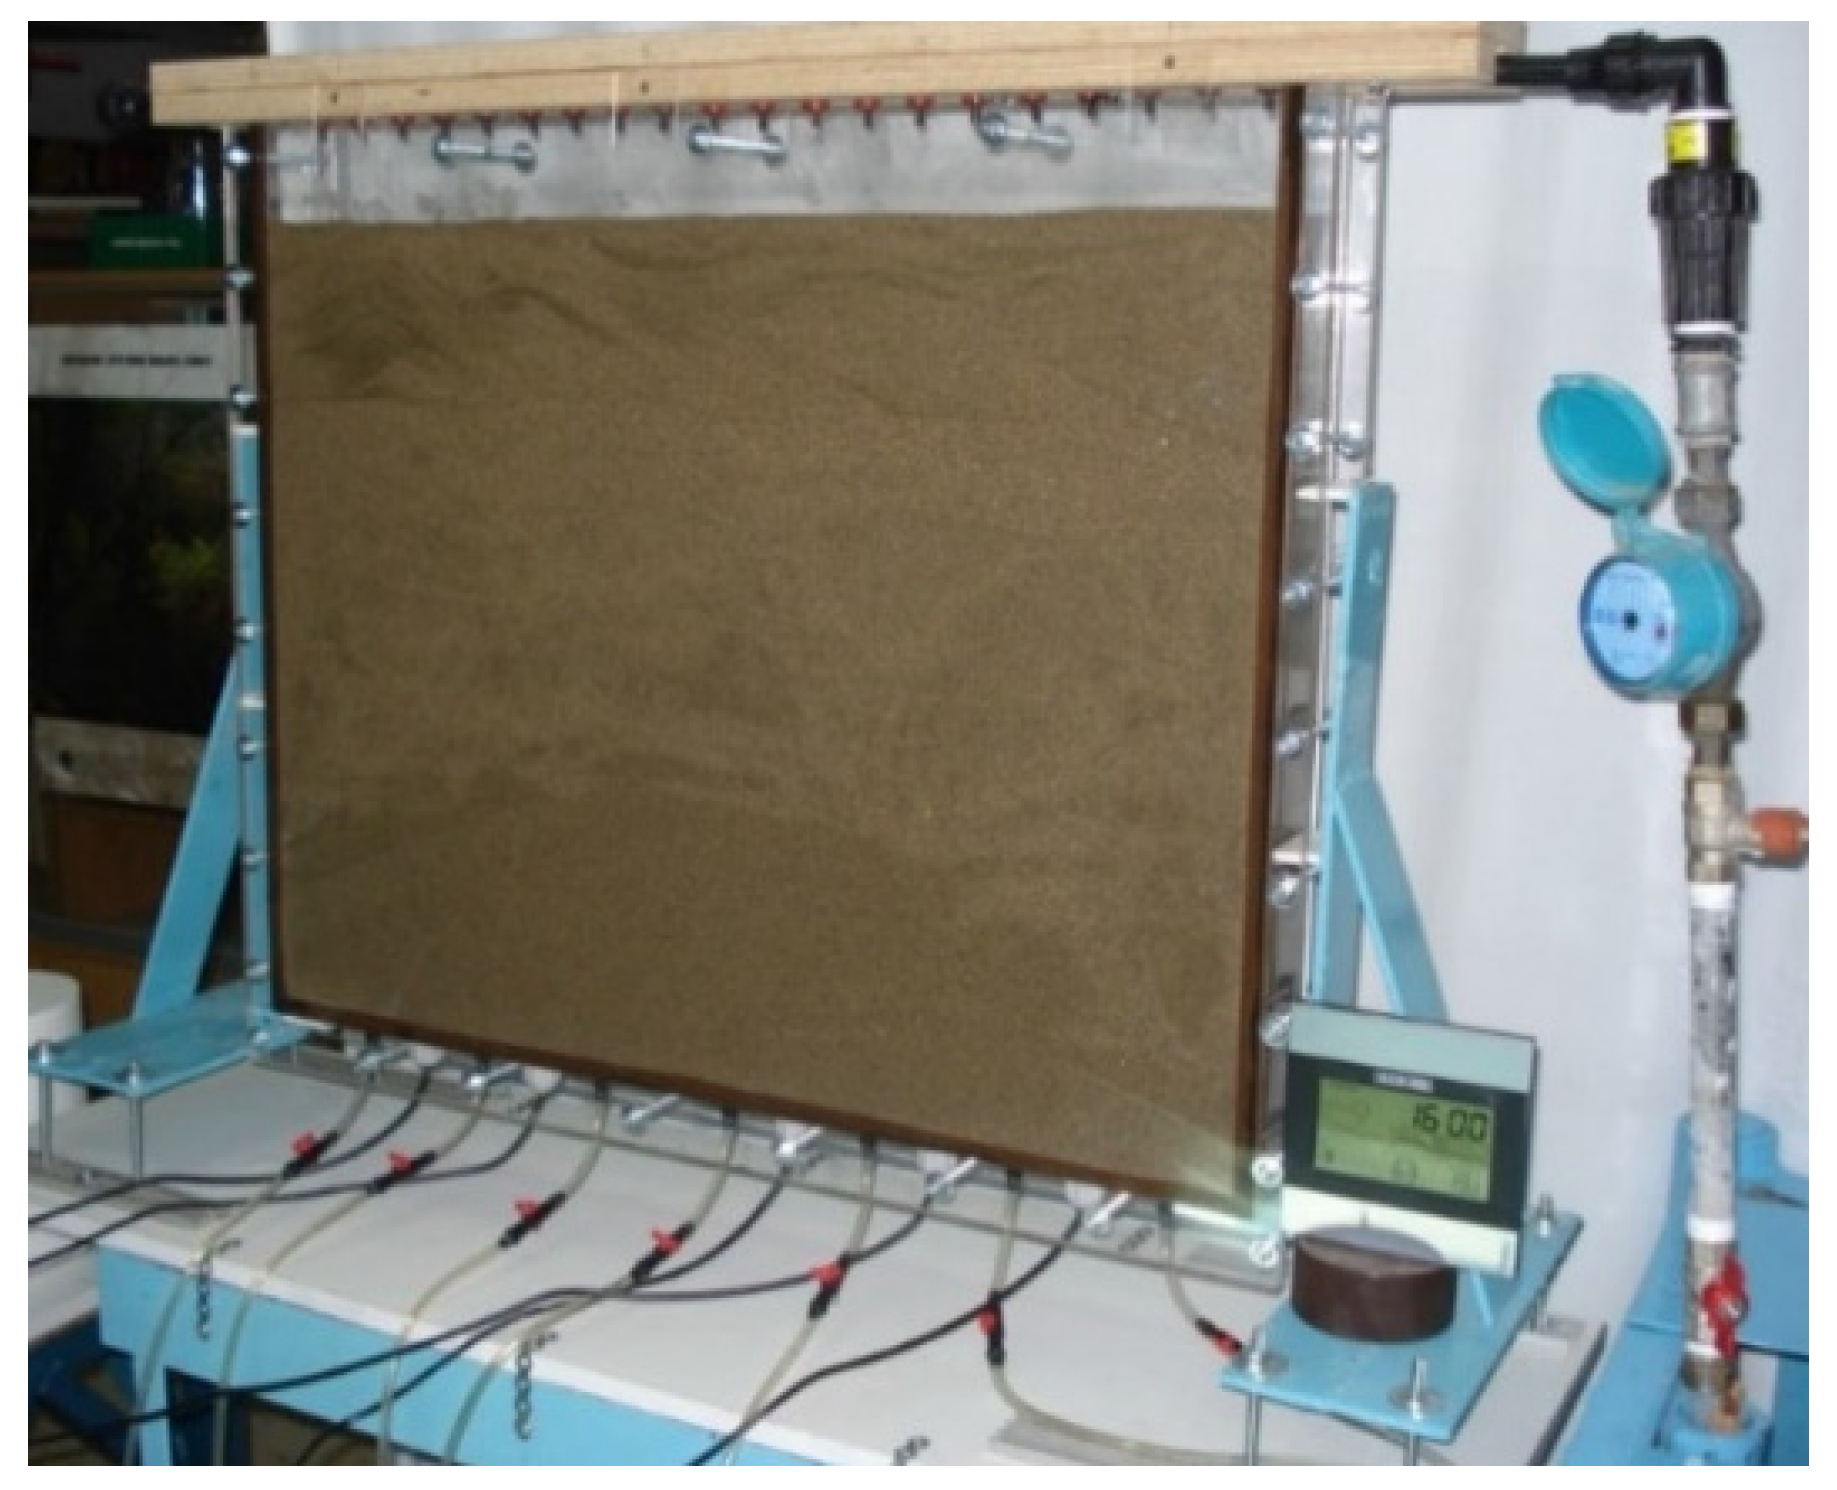
Figure 1. Hele-Shaw device.
Mathematics 11 02889 g001
Figure 2. Four artificial macropores.
Mathematics 11 02889 g002
Figure 3. Position of artificial macropores and soil moisture sensors in the Hele-Shaw device.
Mathematics 11 02889 g003
Figure 4. Calibration equation for the five sensors.
Mathematics 11 02889 g004
Figure 5. Calibration equation for the five sensors.
Mathematics 11 02889 g005
Figure 6. Measured and calibrated retention curve for Layer 1 (a) and Layer 2 (b) of the Hele-Shaw device.
Mathematics 11 02889 g006
Figure 7. Comparison of simulated and measured water content for the five sensors (2013-11-26 (A) left part (a,c,e,g,i) and 2013-11-26 (B) right part (b,d,f,h,j)).
Mathematics 11 02889 g007aMathematics 11 02889 g007b
Figure 8. Screen shot of the irrigation from 13/12/2013.
Mathematics 11 02889 g008
Figure 9. Irrigation screen shot from 11/5/2014 7 h and 25 min after the end of irrigation.
Mathematics 11 02889 g009
Figure 10. Irrigation screen shot from 7/10/2014 (greater water ponding appeared on the surface of the Hele-Shaw soil).
Mathematics 11 02889 g010
Figure 11. Screen shot of the irrigation from 13/12/2013. Irrigation screen shot from 21/10/2014 (larger water ponding appeared on the surface of the Hele-Shaw soil).
Mathematics 11 02889 g011
Figure 12. Comparison of simulated and measured soil moisture for the five sensors [1…5] for four irrigations used for the model validation.
Mathematics 11 02889 g012
Figure 13. Simulated soil moisture profiles (matrix, fracture domain, and total) of the irrigation from 2013/12/13.
Mathematics 11 02889 g013
Figure 14. Simulated soil moisture profiles (matrix, fracture domain, and total) of the irrigation from 2014/05/11.
Mathematics 11 02889 g014
Figure 15. Simulated soil moisture profiles (matrix, fracture domain, and total) of the irrigation from 2014/10/07.
Mathematics 11 02889 g015
Figure 16. Simulated soil moisture profiles (matrix, fracture domain, and total) of the irrigation from 2014/10/21.
Mathematics 11 02889 g016
Table 1. Hydraulic parameters of Hele-Shaw soil (0–25 and 25–50 cm layer).
Layer Numberθsθr *αvg *nvg *mvgR2ρb
(cm3/cm3)(cm3/cm3)(m)(−)(=1−1/nvg)(−)(gr/cm3)
1st (0–25 cm)0.4330.00.24871.55350.35630.99071.16
2nd (25–50 cm)0.4240.00.19951.56250.36000.99091.14
* fitting data, ρb bulk density, θs saturated soil water content, θr residual soil water content, αvg, nvg and mvg Van Genuchten constants, R2 coefficient of determination.
Table 2. Statistical criteria from the comparison of the simulated with the measured water content at the five sensors.
Dateh (mm)/
t (mins)
θ (°C)/RH (%)Sensor
#
RMSMAEMEFCRMn
(cm3/cm3)(-)
2013/11/26 (A)h = 125 mm/
t = 5 min
θ = 19.4–19.7 °C/
RH = 62–64%
SM10.0240.0180.862−0.051150
SM20.0270.0120.831−0.003150
SM30.0230.0160.910−0.049150
SM40.0280.0150.8030.032150
SM50.0290.0240.843−0.034150
Total0.0260.0170.854−0.022750
2013/11/26 (B)h = 80 mm/
t = 3.25 min
θ = 19.4–19.7 °C/
RH = 62–64%
SM10.0380.0290.777−0.044150
SM20.0390.0200.634−0.003150
SM30.0330.0240.892−0.061150
SM40.0310.0150.7510.003150
SM50.0410.0320.788−0.072150
Total0.0370.0240.793−0.039750
Table 3. Statistical criteria from the comparison of the simulated water content with the measured water content at the five sensors.
Dateh (mm)/
t (mins)
θ (°C)/RH (%)Sensor
#
RMSMAEMEFCRMn
(cm3/cm3)(-)
2013/12/13h = 60 mm/
t = 2 min
θ = 21–23 °C/
RH = 45–47%
SM10.0080.0070.9130.005150
SM20.0250.0100.733−0.026150
SM30.0180.0130.7600.018150
SM40.0240.0080.717−0.014150
SM50.0140.0120.818−0.057150
Total 0.0190.0100.763−0.013750
2014/05/11h = 35 mm/
t~1 min
θ = 22–23 °C/
RH = 63–65%
SM10.0110.0090.681−0.045150
SM20.0060.0050.978−0.026150
SM30.0070.0060.9250.017150
SM40.0040.0020.984−0.009150
SM50.0090.0070.820−0.006150
Total 0.0080.0060.928−0.014750
2014/10/07h = 110 mm/
t = 4 min
θ = 23–24 °C/
RH = 75–76%
SM10.0280.0210.808−0.062150
SM20.0230.0130.887−0.001150
SM30.0180.0150.8650.053150
SM40.0250.0160.8600.061150
SM50.0290.0220.858−0.066150
Total 0.0250.0170.8560.002750
2014/10/21h = 150 mm/
t = 6 min
θ = 22–23 °C/
RH = 64–66%
SM10.0320.0310.846−0.092150
SM20.0320.0290.845−0.121150
SM30.0350.0280.661−0.050150
SM40.0290.0250.874−0.096150
SM50.0350.0330.863−0.095150
Total 0.0330.0290.835−0.088750
Disclaimer/Publisher’s Note: The statements, opinions and data contained in all publications are solely those of the individual author(s) and contributor(s) and not of MDPI and/or the editor(s). MDPI and/or the editor(s) disclaim responsibility for any injury to people or property resulting from any ideas, methods, instructions or products referred to in the content.