Article

Object-Centric Process Mining: Unraveling the Fabric of Real Processes

by
Wil M. P. van der Aalst
1,2
1
Process and Data Science (PADS), RWTH Aachen University, 52074 Aachen, Germany
2
Celonis, 80333 München, Germany
Mathematics 2023, 11(12), 2691; https://doi.org/10.3390/math11122691
Submission received: 24 April 2023 / Revised: 10 June 2023 / Accepted: 12 June 2023 / Published: 13 June 2023
(This article belongs to the Special Issue Advances in Business Intelligence: Theoretical and Empirical Issues)

Abstract

:
Traditional approaches for process modeling and process analysis tend to focus on one type of object (also referred to as cases or instances), and each event refers to precisely one such object. This simplifies modeling and analysis, e.g., a process model merely describes the lifecycle of one object (e.g., a production order or an insurance claim) in terms of its activities (i.e., event types). However, in reality, there are often multiple objects of different types involved in an event. Think about filling out an electronic form referring to one order, one customer, ten items, three shipments, and one invoice. Object-centric process mining (OCPM) takes a more holistic and more comprehensive approach to process analysis and improvement by considering multiple object types and events that involve any number of objects. This paper introduces object-centric event data (OCED) and shows how these can be used to discover, analyze, and improve the fabric of real-life, highly intertwined processes. This tutorial-style paper presents the basic concepts, object-centric process-mining techniques, examples, and formalizes OCED. Fully embracing object centricity provides organizations with a “three-dimensional” view of their processes, showing how they interact with each other, and where the root causes of performance and compliance problems lie.

1. Introduction

As the field of process mining [1] is maturing and better software tools are becoming available, also more complex non-standard processes can be analyzed and improved in an evidence-based manner. Using process mining, we can (1) discover processes models based on event data, (2) check the conformance of processes by comparing a process model with event data, (3) analyze performance by replaying event data on models, (4) predict the evolution of the whole process or individual process instances, and (5) automatically perform actions to address performance and compliance problems. Process mining techniques and tools have proven to be valuable in a wide range of domains (finance, logistics, production, customer service, healthcare, energy, education, etc.). However, traditional process-mining approaches also tend to make a few simplifying assumptions:
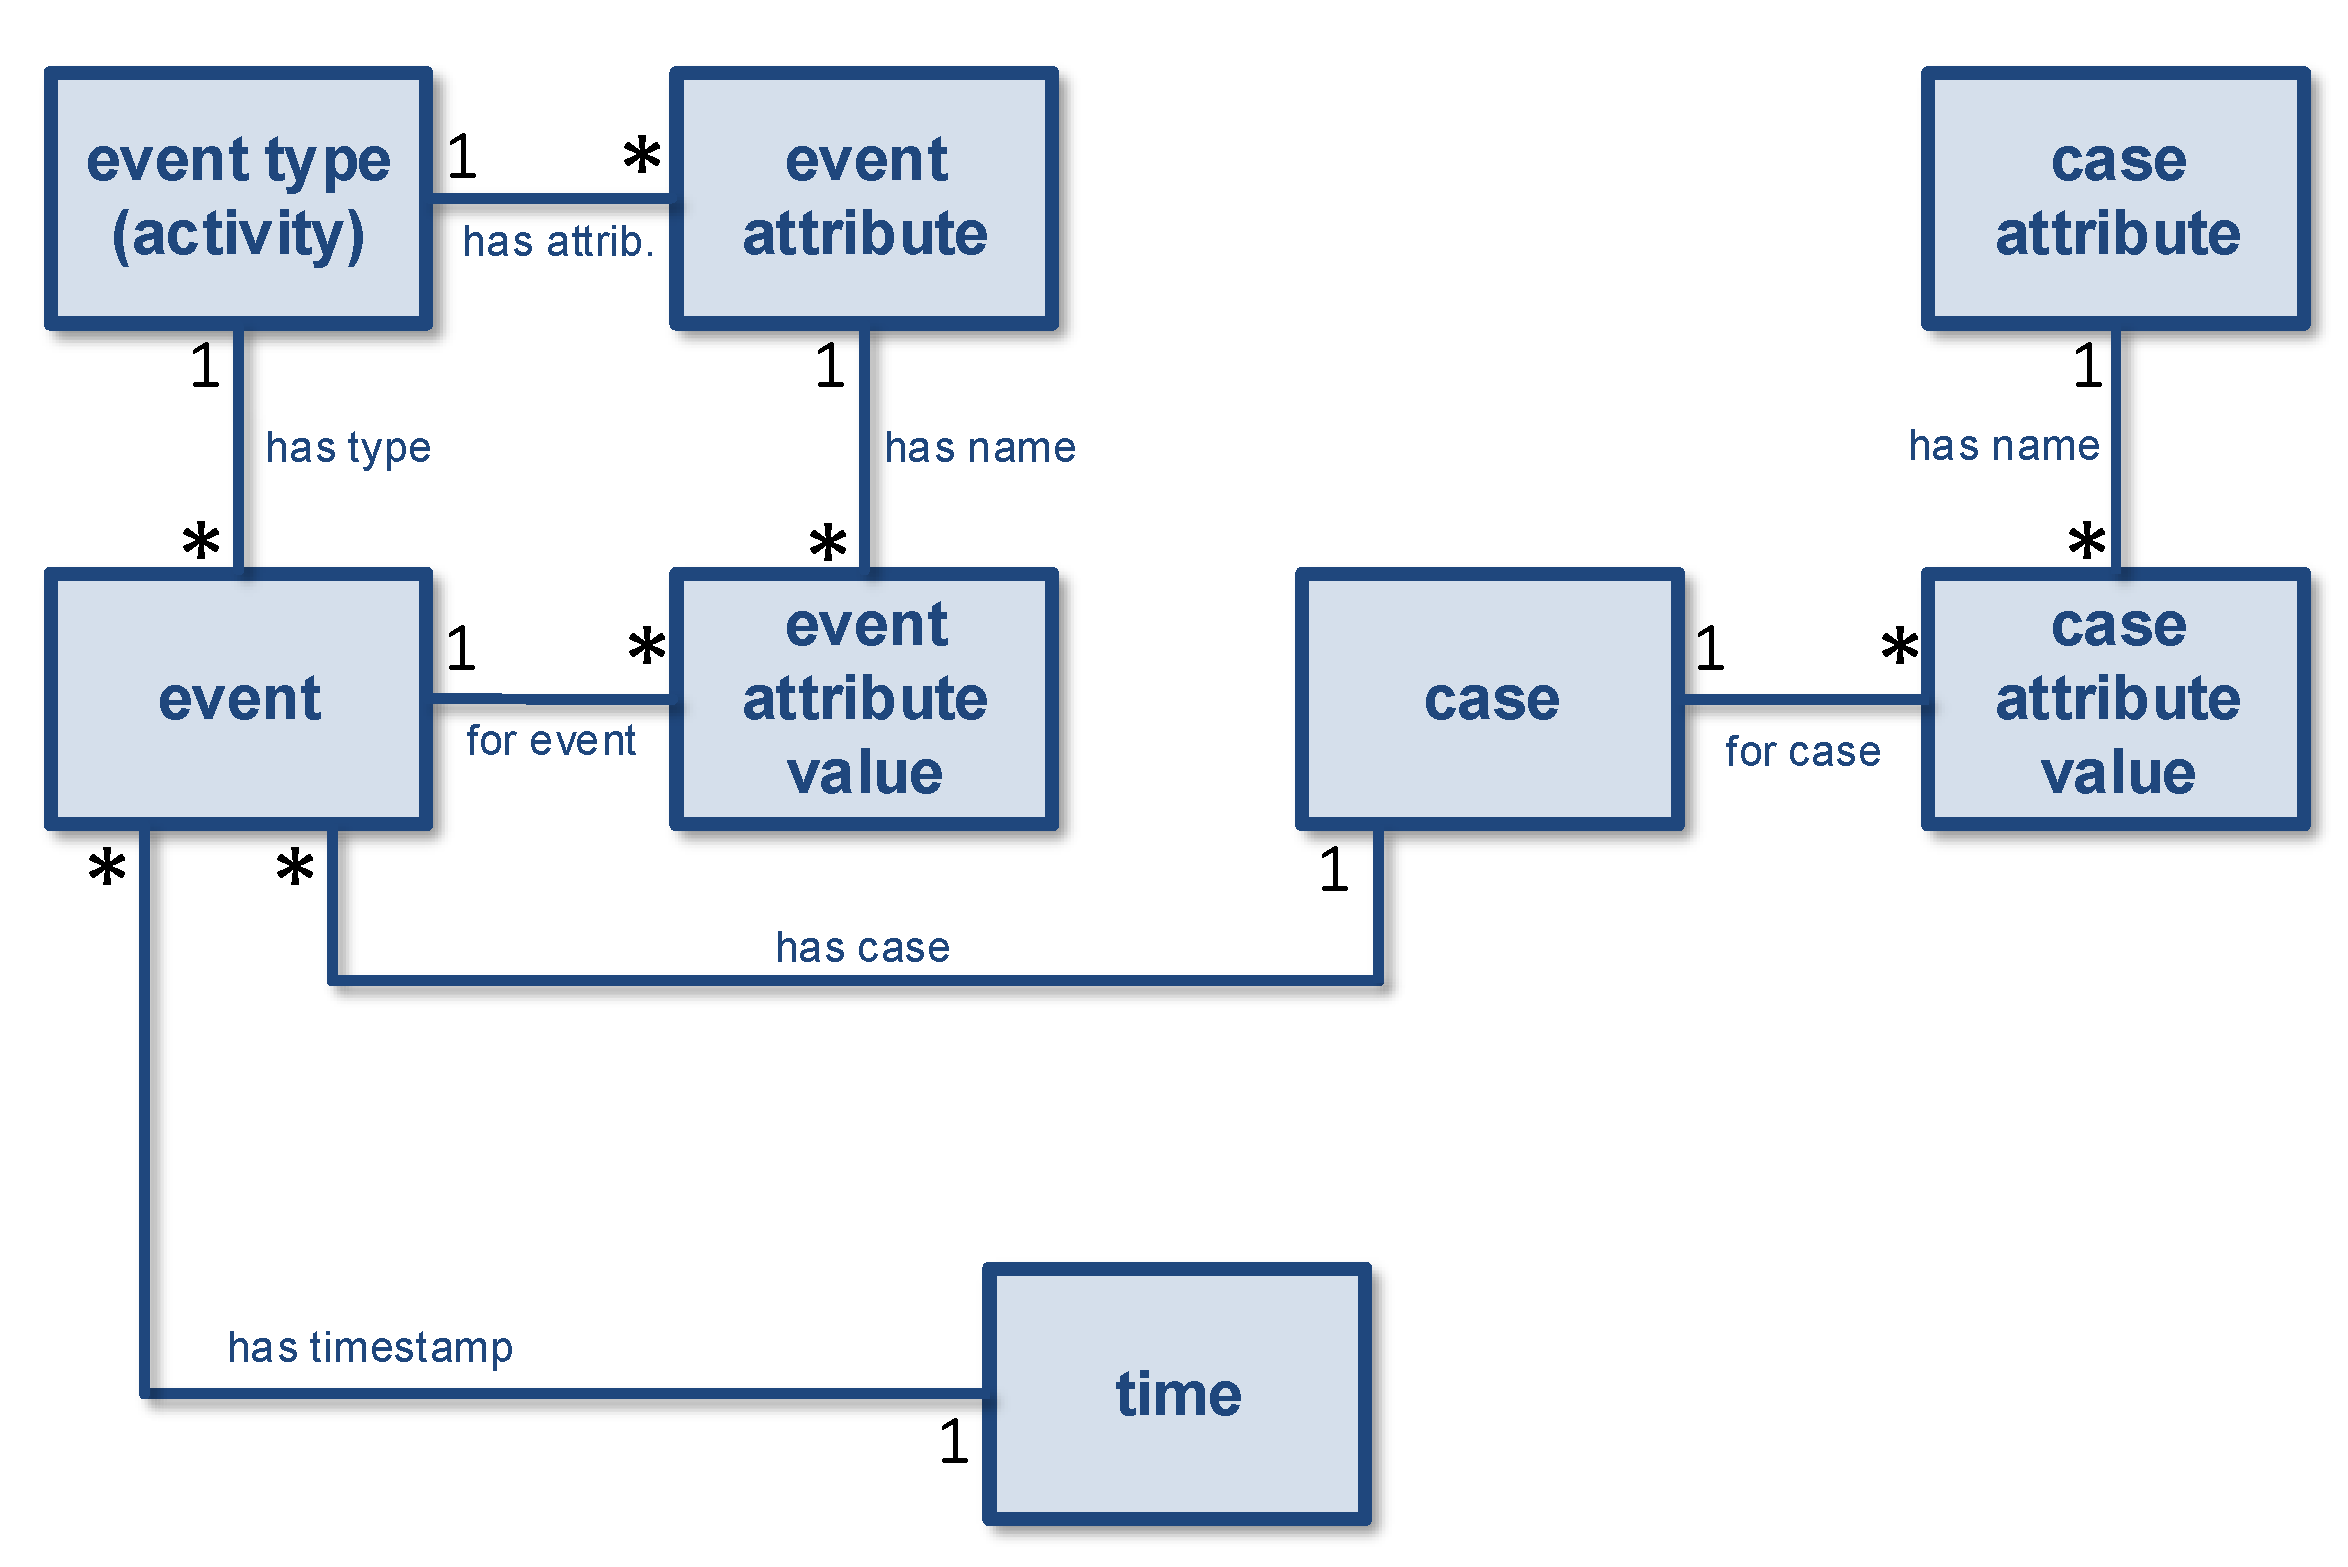
  • It is assumed that a process model describes the lifecycle of a single object.
  • It is assumed that each event refers to precisely one object (often called case) of a given type.
These assumptions are reasonable because most process-model notations do the same, and most end-users are familiar with these simplified notations. The widely used business process model and notation (BPMN) standard [2] uses models composed of activities, gateways, and sequence flows describing individual process instances. Consider, for example, Figure 1, showing a BPMN model describing the handling of job applications. Process instances (also called cases) flow through the model from the left (source node start) to the right (sink node end). Next to activities, there are six exclusive gateways (diamond shapes with a ×) and two parallel gateways (diamond shapes with a +). Applications may be rejected after the first screening, after checking references and consulting the responsible manager, and after the interview. Following a successful interview, the applicant may receive a job offer that can be accepted or declined. Note that the check references and consult manager activities can be performed in any order (i.e., these are concurrent).
In a BPMN model, activities are always executed for one process instance. It is impossible to describe that an activity refers to multiple process instances of different types. Figure 1 only shows the flow of applications. However, this is not the only object type involved in the process. Next to applications, there are applicants, vacancies, offers, recruiters, and managers. The same applicant may apply for different vacancies, and for one vacancy there may be many applications. For an interview, one applicant, a recruiter, and the responsible manager may be involved. Applications are also not mutually independent. Hiring one applicant for a vacant position may imply the rejection of all other applications for the same position. The example shows the following:
  • Real-life activities may involve multiple objects of different types.
  • Objects are not mutually independent and cannot be fully understood by looking at them in isolation.
  • Objects may be related, e.g., an order has items and refers to a customer.
These observations apply to most operational processes. Consider, for example, the handling of sales orders. One sales order may involve multiple items. Items belonging to one order may be split over multiple shipments, and shipments may contain items originating from different orders. In many processes, resources are shared, and batching is used to improve efficiency. In batched processes, the same operation is performed for many objects (e.g., products) in a single activity. These examples show that we need to consider multiple object types that are mutually dependent. Therefore, we need to drop the simplifying assumptions made by traditional process-mining approaches.
The goal of process mining is to analyze and improve processes using event data [1,3]. One can think of traditional event data as a table where each row corresponds to an event. (This is a simplification of actual event data stored, for example, in an XES file or a Celonis data model. Additionally, cases can have attributes, but this simplified view helps to understand the basic concepts). An event can have many different attributes. However, for traditional process mining, we need to have three mandatory attributes: case (refers to a process instance), activity (refers to the operation, action, or task), and timestamp (when did the event happen). These three attributes are enough to discover and check the control-flow perspective. An event may have many more attributes (e.g., costs, location, and resource), and also cases may have attributes that are invariant during the lifetime of a case. We refer to such data as traditional event data and these may be stored in classic event logs (e.g., in XES format [4]).
We use the term object-centric event data (OCED) for event data, where each event may refer to any number of objects, possibly of different types, instead of a single case identifier. Object-centric process mining (OCPM) techniques take such data as input and allow for multi-perspective process models [5]. This helps to address the following three limitations of traditional process mining:
  • Data extraction is time consuming and needs to be repeated when new questions emerge. This is inflexible and prevents reuse. Additionally, logging is not system agnostic, i.e., the same business process creates different event data depending on the system used (e.g., SAP versus Oracle).
  • Interactions between objects are not captured, and objects are analyzed in isolation.
  • A 3D reality needs to be squeezed into 2D event logs and models. It is impossible to create views “on demand” when data are stored in 2D rather than 3D format.
Fortunately, most of the existing process-mining techniques can be lifted to multiple object types, e.g., process discovery, conformance checking, performance analysis, process prediction, etc. However, this requires a different mindset and willingness to embrace object centricity.
According to Gartner, there are now over 40 process-mining vendors, e.g., Celonis, Signavio (now part of SAP), ProcessGold (now part of UiPath), Fluxicon, Minit, LanaLabs (now part of Appian), MyInvenio (now part of IBM), and Q [6]. The recently released “Gartner Magic Quadrant for Process Mining” [7] illustrates the significance of this new category of tools. For an up-to-date overview, see the website www.processmining.org (accessed on 1 April 2023). Additionally, see [8] for example applications. All tools support the discovery of directly follows graphs (DFGs) with frequencies and times, and most of them (but not all) support some form of conformance checking and BPMN visualization. However, very few support object-centric process mining. Celonis was the first commercial vendor fully supporting object-centric process mining with the release of Process Sphere in 2022 [9]. Before, there were several non-commercial open-source tools supporting object centricity, e.g., the “OCELStandard” package in ProM (promtools.org), the OC-PM tool (ocpm.info), and Object-Centric Process Insights (ocpi.ai) (all accessed on 1 April 2023).
Despite the limited number of tools supporting object-centric process mining, most large-scale process-mining users and researchers acknowledge that the “one case notion” limits the application of process mining [10]. Therefore, this tutorial-style paper can be seen as a call to action. It is expected that object-centric process mining will become the “new normal” in the next decade and widely adopted in industry. Moreover, object-centric process mining provides many exciting research challenges that are highly relevant for progressing process management and automation. Things such as filtering, clustering, prediction, etc., become more challenging when considering object-centric event data. Although we will not present specific algorithms, the general principles presented in this paper can be used for object-centric process discovery, conformance checking, and most other process-mining tasks.
The remainder is organized as follows. Section 2 discusses the limitations of process-mining techniques using events that need to refer to a single object (i.e., case) rather than a set of objects. Section 3 presents object-centric event data as a means to overcome these limitations. The object-centric event data meta-model (OCED-MM) is used to introduce the core concepts. Moreover, we explain the convergence and divergence problems in detail by relating OCED-MM to traditional event logs. Section 4 formalizes the core concepts introduced in Section 3. Section 5 introduces the basics of object-centric process mining and demonstrates that many of the existing techniques can be lifted from 2D to 3D. Finally, Section 6 concludes the paper.

2. The Need for Object Centricity

To explain the need for object centricity, we first introduce some of the process-mining basics. Figure 2 introduces the different process-mining tasks.
Task exact (0) transforms data in the source systems to event data ready for process mining. Often, multiple source systems are involved (e.g., software systems from SAP, Salesforce, Microsoft, and Oracle), and one system may store data scattered over thousands of database tables. This is a key step and, when organizations start with process mining, this may take up 80% of all efforts. Traditional event logs focus on a single process centering around one type of object (i.e., the so-called cases). Hence, next to finding and transforming raw input data, it is important to scope and correlate these input data such that meaningful process events are generated.
Task discover (1) turns event data into process models using process discovery techniques. These discovered models aim to describe the underlying process. The discovered process models may focus on the frequent mainstream behavior in the event data or also include infrequent behavior. A range of process discovery techniques is available [1,11,12,13,14]. The discovered process models show what is really going on, thus providing transparency. Moreover, discovered process models can be modified from “as is” models into “to be” models. It is also possible to model the expected or normative model from scratch.
Task check (2) takes as input event data and process models. The latter may be produced using process discovery or created manually (or a combination of both). Event data are replayed on these models. This reveals all discrepancies between the data and model [1,15]. Moreover, process models can be further annotated with frequency and time information. Doing this may reveal important “execution gaps”, i.e., differences between the reality and model. Note that deviations are not limited to control flow (i.e., the ordering of activities). These may also include deviations related to time, resources, or data. For example, parts of the process may take too long, resources may violate the four-eyes principle, or decisions may conflict with business rules (e.g., claims above EUR 10,000 need to be checked by the manager).
Task predict (3) is forward looking, aiming to make statements about the future based on event data and the models learned. This may involve modern machine learning (ML) techniques using neural networks or classical data mining (DM) and statistical methods, such as decision trees and regression. Task predict (3) builds on process-discovery and conformance-checking results. Based on a combination of event data and a process model connected through alignments, so-called situation tables are created [1,16,17]. Each situation table focuses on a specific problem often called an execution gap (i.e., a specific performance or compliance problem). This corresponds to a standard ML/DM problem, and existing techniques can be applied. Each row in the situation table is an instance (e.g., a case, a resource, a choice, or a time period). Predictions may refer to individual cases or the process as a whole. Typical examples include predicting the remaining processing times of running cases, predicting outcomes of cases, predicting workloads, and predicting compliance levels. In [16], we focus on extracting a wide range of process-related features from event data. These can be used to create causal models, create decision trees [1], or train a range of neural networks [17]. It should be noted that the core process-mining algorithms for the earlier tasks (e.g., process discovery and conformance checking) are very different from mainstream ML/DM techniques.
Task act (4) intervenes in the running process to improve it based on process-mining diagnostics. So-called action flows aim to influence the process by taking actions in the source systems or triggering stakeholders. Both automatic and human interventions are possible. Input may come from all previous tasks. It is not necessary to perform all tasks to improve processes (e.g., make predictions); also, process discovery results and conformance checking diagnostics provide valuable input for taking actions (automatic or not). For example, “execution gaps” detected using conformance checking may trigger automatic actions, such as blocking suppliers, adding resources, removing duplicate cases, and temporarily blocking requests.
As shown in Figure 2, the combination of all tasks mentioned helps to close the loop and continuously improve the process.
At the minimum, events should have a timestamp and an activity label. Moreover, process models should describe the ordering of these activities. In traditional event logs and process models, it is also assumed that each event refers to precisely one case. This assumption leads to the following problems:
  • Data extraction is time consuming and needs to be repeated when new questions emerge. Traditional event logs view event data from one particular angle, i.e., the case notion selected. However, different questions may require different viewpoints. Consider an order-handling process involving customers, suppliers, orders, items, shipments, payments, employees, etc. Each of these object types can be used as a case notion depending on the question. It is very inefficient to extract event data repeatedly using different case notions. Moreover, new questions may require new data extractions and the involvement of IT specialists.
  • Interactions between objects are not captured, and objects are analyzed in isolation. Real-life events tend to involve multiple objects. These objects may be of the same type, e.g., multiple items are ordered in one transaction. Moreover, also different types of objects may be involved, e.g., delivering a package to a customer involving items from different orders. When events are only related through a case identifier, interactions between objects get lost. Moreover, it leads to distortions, such as convergence and divergence problems (see Section 3.6).
  • A 3D reality needs to be squeezed into 2D event logs and models. Traditional approaches use two-dimensional (2D) event logs and models. The first two dimensions are the activity dimension and the time dimension. The third dimension is the object dimension covering multiple object types. In 2D event logs and models, one focuses on one object (type) at a time. However, to capture reality better, one needs three-dimensional (3D) event logs and models. One needs to add the third dimension considering multiple object types, where one event may refer to any number of objects.
Object-centric process mining (OCPM) aims to tackle these challenges. There have been several other proposals using artifact-centric models [18,19], object-centric behavioral constraint models [20,21], multi-perspective models [22], multi-event logs (Celonis), extensible object-centric (XOC) event logs [23], graph databases tailored toward event data [24], catalog and object-aware nets [25], etc. However, none of these approaches were adopted in industry due to complexity. Good analysis techniques were missing, there were scalability problems, and it was hard to extract such data. This is in stark contrast with the current uptake and attention for OCPM as presented in this paper. This is illustrated by the Celonis Process Sphere implementation [9] that is already used in a dozen larger organizations and will become the standard Celonis platform to be used in thousands of organizations. It is expected that many vendors will follow and adopt OCPM [7].
To appreciate the practical relevance of these problems, it is good to understand that most events involve multiple objects. Consider, for example, an assembly process, where intermediate products and final products are composed of different parts. Another example is a project meeting for a project involving multiple participants. Additionally, think of the shipping of a container containing different pallets stacked with products for different customers, or the hiring decision for a vacant position with dozens of applications. In summary, the above-mentioned challenges are omnipresent.

3. Object-Centric Event Data

Object-centric process mining starts from object-centric event data leveraging the insight that events may relate to any number of objects. The object-centric event data meta-model (OCED-MM) shown in Figure 3 introduces the main concepts detailed in the reminder. OCED-MM can be viewed as an extension of the meta-model used for the OCEL (object-centric event log) format (cf. www.ocel-standard.org, accessed 1 April 2023, and [26]) defined in 2020 and is also related to the standardization discussions in the context of the IEEE Task Force on Process Mining [10]. Here, we focus on the core concepts and considerations instead of technical details, such as the storage format.

3.1. Objects and Object Types

As Figure 3 shows, each object has precisely one object type, but many objects may have the same type. This is denoted by the 1 and ⁎ on the association has type connecting the classes object and object type. Note that we use a “UML-like notation” just using classes (the rectangles) and associations (the connections). The ⁎ denotes zero or more. Example object types are patient, customer, supplier, machine, order, treatment, product, container, claim, payment, complaint, request, etc. Objects are instances of these types, for example, a particular patient or a specific order.

3.2. Events and Event Types

Each event has an event type, also called activity. Many events can have the same type, but each event has precisely one type. We will use the terms event type and activity interchangeably. Example event types are approve request, cancel order, send payment, take blood test, skip container, activate account, etc. Events are instances of these types. We assume that events are atomic. Therefore, each event has one timestamp as indicated in Figure 3. Since time is an important notion in process mining, time is added as a separate class in the meta-model. To model activity instances that take time, one can use a start and complete event, or add duration as an attribute. However, for simplicity, it is best to view events as atomic and having just one timestamp.

3.3. Event-to-Object (E2O) Relations

In traditional process mining, each event needs to refer to precisely one case. Object-centric process mining generalizes this, allowing an event to refer to any number of objects. The association has object is a many-to-many relationship (see the two ⁎’s) and may have a qualifier. The qualifier class connected to the association has object is also called an association class as is used to label the relationship. Consider an event of the type meeting; there may be five participants, of which one is the chair or a product presentation with ten attendees and two presenters. In such situations, an event is connected to objects of the type person, but we would like to distinguish between a normal participant and the chair, or distinguish between an attendee and a presenter. Note that the same person may be a presenter for one presentation and an attendee for two other presentations. Therefore, it is possible to qualify the relation between an event and an object, i.e., add an additional label.
In traditional process mining, there would be just one object type case, and each event would refer to precisely one object of that type. Event-to-object (E2O) relations generalize the concept into a qualified many-to-many relationship.

3.4. Object-to-Object (O2O) Relations

Objects can be related using object-to-object (O2O) relationships. Figure 3 shows that the association related is also qualified using an association class. This qualified many-to-many relationship is static for reasons of simplicity. Just like an object does not change type over time, the O2O relationships do not change. An order object can be related to a customer object. A diagnosis object can be related to a patient object. A payment object can be related to a claim object. O2O relationships may also represent bill-of-materials (BOM) structures. A BOM typically has a hierarchical structure with the finished end product at the root. The qualified many-to-many relationship may represent a labeled directed hypergraph. Sometimes, such relationships are restricted to one-to-many relations or even the more restricted structures found in a snowflake or star database schema.
It is important to note that objects can be related directly via O2O relations or indirectly via two E2O relations. Objects o 1 and o 2 can be related via some O2O relation (e.g., a “part of” relation) or via an event e, where o 1 and o 2 are involved (i.e., two E2O relations). Note that the O2O relations are static and the E2O relations are dynamic. For example, there may be events where both o 1 and o 2 are involved, and other events where just o 1 or o 2 is involved. Moreover, these events are timestamped.
It is important to note the foundational differences between O2O and E2O relations. O2O relations are static. E2O relations are dynamic and may also indicate active participation in the event (e.g., a resource involved in the execution of an activity).

3.5. Event and Object Attributes

Both objects and events can have any number of attributes with corresponding values. An event attribute value refers to precisely one event and one event attribute. This is the assignment of a concrete value (e.g., €10) to an attribute (e.g., transaction costs) for a specific event (e.g., a bank transfer event). Similarly, an object attribute value refers to precisely one object and one object attribute. As Figure 3 shows, each event type may refer to any number of event attributes, and each object type may refer to any number of object attributes (see the two has attrib associations). These can be interpreted as the expected attributes for the events or objects of the corresponding type. For an event, one can navigate the has type and has attrib associations to find the set of expected event attributes. Moreover, for the same event, one can navigate the for event and has name associations to find the set of actual event attributes. One can impose consistency constraints to ensure that both are the same, or one is a subset of the other. Using OCL (object constraint language), it is possible to define such constraints [27]. We leave this open to ensure flexibility. For an object, one can navigate the has type and has attrib associations to find the set of expected object attributes, and one can navigate the for object and has name associations to find the set of actual object attributes. Additionally, here, one could impose consistency constraints to ensure that both sets of object attributes are the same, or one is a subset of the other.
Please note the deliberate asymmetry in the OCED-MM when it comes to timed attributes (cf. Figure 3). Object attribute values have a timestamp, and event attribute values do not have a timestamp. The reason is that event attribute values refer to events that already have a timestamp. Hence, event attribute values have an implicit timestamp. Although not explicitly visible in Figure 3, there is at most one event attribute value per event and event attribute combination. It would not make any sense to assign multiple values to the same attribute in one event. There may be multiple object attribute values per object and object attribute combinations because the value may change over time. For example, the price or weight of an object can change. Therefore, any object attribute value has a timestamp. There is, at most, one object attribute value per object, time and object attribute combination. By default, one can assign time “zero” to an object attribute value, i.e., the earliest point in time. The first object attribute value for an object and an object attribute combination can be seen as the initial setting and all later object attribute values as updates of this value. At time t, the value of an attribute for an object is the value of the latest object attribute value for the object and object attribute combination.

3.6. Convergence and Divergence

The object-centric event data meta-model (OCED-MM) in Figure 3 provides a clear conceptual basis for reasoning about object-centric process mining. Moreover, we can now better explain the limitations of traditional process mining. In traditional process mining, we only consider one object type called “case”, and events refer to just one object. Figure 4 shows a meta-model for such traditional event logs, e.g., event logs using the XES standard [4]. This is merely a representation of the main concepts and does not aim to be complete. For example, XES has extensions supporting classifiers, lifecycle information, activity instances, resources, and cost information [4]. Here, we abstract from these extensions and focus on the core concepts. Comparing Figure 3 and Figure 4 reveals the main differences. There is no object type class, because there is only one object type case. The association connecting events and objects is a many-to-one relation instead of a many-to-many relation. Therefore, a qualifier does not make sense. Since only one case is involved in an event, there is no need to distinguish objects having different roles. Figure 4 also does not show object-to-object (O2O) relations and case attribute values do not have a timestamp. These concepts are not supported by XES and other exchange formats. Meaningful O2O relations tend to relate objects of different types; therefore, this was not considered in XES. Additionally, case-level attributes cannot be changed in XES.
If we make the assumption that the actual reality is closer to the OCED-MM in Figure 3 but process-mining tools require traditional event logs described by Figure 4, then we need to map the data from the former to the latter representation. An obvious approach is the following:
  • Pick an object type to serve as the case notion.
  • Remove all objects of a different type. The remaining objects are called cases.
  • Only keep object attribute values corresponding to cases, and, if there are multiple case attribute values for a case and case attribute combination, keep only the last one. Remove the timestamps of the remaining case attribute values.
  • Remove all events that do not have an O2E relation to at least one case (i.e., object of the selected type). Therefore, the remaining events refer to one or more cases.
  • If an event refers to multiple cases, then replicate the event once for each case. By replicating events for each case, we can ensure that each resulting event refers to a single case.
The above approach turns OCED into classic event logs in a deterministic manner and only parameterized by the selected object type. Note that we are forced to replicate events because of the requirement that an event can refer to only one case in the traditional setting. The resulting event data are called flattened event data.
Obviously, events in the original event log that have no corresponding events in the flattened event log disappear from the input data. This is called deficiency. However, more interesting are the convergence and divergence problems:
  • The convergence problem: Events referring to multiple objects of the selected type are replicated, possibly leading to unintentional duplication. The replication of events can lead to misleading diagnostics.
  • The divergence problem: There are multiple events that refer to the same case and activity; however, they differ with respect to one of the not-selected object types. In other words, events referring to different objects of a type not selected as the case notion become indistinguishable, looking only at the case and activity (i.e., event type).
Consider an order o consisting of ten items i 1 , i 2 , , i 10 and the activities place _ order , pick _ item , and pack _ item . The corresponding event place _ order refers to objects o , i 1 , i 2 , , i 10 and can be denoted as place _ order ( o , i 1 , i 2 , , i 10 ) . There are ten pick _ item events each referring to o and one of the items. These can be denoted as pick _ item ( o , i k ) with 1 k 10 . Similarly, there are ten pack _ item events denoted as pack _ item ( o , i k ) with 1 k 10 .
If we choose item as a case notion, then event place _ order ( o , i 1 , i 2 , , i 10 ) needs to be replicated. The event place _ order ( o , i 1 , i 2 , , i 10 ) is converted into ten events: place _ order ( i 1 ) , place _ order ( i 2 ) , , place _ order ( i 10 ) . Although the place _ order happens only once, the flattened event log will show that it happened ten times. This is the convergence problem influencing statistics related to frequency, time, costs, etc.
If we choose order as a case notion, then the number of events does not change, i.e., there are no convergence problems. However, there is a divergence problem. There is one place _ order event, ten pick _ item events, and ten pack _ item events. Sorted by timestamp, we could see the following sequence of events for case o: place _ order ( o ) , pick _ item ( o ) , pick _ item ( o ) , pack _ item ( o ) , pick _ item ( o ) , pick _ item ( o ) , pack _ item ( o ) , pick _ item ( o ) , pick _ item ( o ) ,
pick _ item ( o ) , pack _ item ( o ) , pick _ item ( o ) , pick _ item ( o ) , pick _ item ( o ) , pack _ item ( o ) , pack _ item ( o ) ,
pack _ item ( o ) , pack _ item ( o ) , pack _ item ( o ) , pack _ item ( o ) , and pack _ item ( o ) . Note that for the same case o, pick _ item is followed by pick _ item , pick _ item is followed by pack _ item , pack _ item is followed by pick _ item , and pack _ item is followed by pack _ item . This suggests that there is not clear ordering among the activities pick _ item and pack _ item . However, for each item i k , pick _ item ( o , i k ) is always followed by pack _ item ( o , i k ) . The causal relation between pick _ item ( o , i k ) and pack _ item ( o , i k ) is lost when using o as the only identifier. Due to the divergence problem, the ten pick _ item ( o ) events and ten pack _ item ( o ) events become indistinguishable. As a result, the clear causal relation between pick _ item and pack _ item is lost.
The above convergence and divergence examples show the limitations of traditional two-dimensional (2D) event logs and models. By focusing on items only, one can no longer see the correct activity frequencies resulting in a distorted view. By focusing on orders only, one can no longer see the causal relations. One needs the third dimension showing all object types. This illustrates that, to capture reality better, one needs three-dimensional (3D) event logs and models.

3.7. Example Illustrating Convergence and Divergence

Let us now consider a larger, more realistic, example. Consider an order handling process involving orders, items, packages, and routes. An order may refer to multiple items, but each item refers to one order. A package may contain multiple items, but each item ends up in one package. A route may involve many packages to be delivered. If a package cannot be delivered on a route because the customer is not at home, then the package is added to a later route. The right-hand side of Figure 5 shows the relations between the four object types: order, item, package, and route. The left-hand side shows the event types (i.e., activities). Note that all elements of Figure 5 are at the type level and not the instance level, i.e., no events and objects are depicted (only event types and object types). As before, we use a UML-like notation using classes, associations, and cardinalities.
Figure 5 shows the cardinalities of object-to-object (O2O) relations (right-hand side) and event-to-object (E2O) relations (middle). To illustrate the E2O relations, consider activity place order which refers to one order and one or more items. Activity place order occurs once for each order and once for each item. Activity pack items refers to one package and one or more items, and pack items occurs once for each package and each item. The E2O relations in the middle of Figure 5 show the cardinality constraints between events of the given type on the left and objects of the given type on the right. The range on the left-hand side of the association closest to the event type shows how often the activity happens for objects of the type on the right-hand side. The range on the right-hand side of the association closest to the object type shows how many objects of the type are involved in events of the type on the left.
All E2O associations having a cardinality constraint different from 1 on the right-hand side lead to convergence problems when the corresponding object type is taken as the case notion. Based on Figure 5, there are convergence problems when picking item or package as a case notion (see the “1..⁎” entries on the right). For example, events of type place order are replicated for each item when item is the selected case notion, and events of type start route are replicated for each route when package is the selected case notion.
All E2O associations having a cardinality constraint different from 1 on the left-hand side may lead to divergence problems when the corresponding object type is taken as the case notion and there are other E2O associations starting from the same event type that may contain causal information. The “1..⁎” entries on the left that are combined with a “1” for the same event type, but another E2O association, entail possible divergence problems. For example, event type pick item has E2O relations to order and item with cardinalities “1..⁎” and “1”, respectively. Therefore, picking order as a case notion may lead to divergence problems because causalities between events involving specific items get lost. Event type start route has E2O relations to package and route with cardinalities “1..⁎” and “1”, respectively. Therefore, picking package as a case notion may lead to divergence problems because causalities between events involving specific routes get lost.
Figure 5 shows many E2O relations. The question is whether all of these are needed. Some E2O relations are derivable from O2O relations, e.g., given an item involved in an event, we can determine the corresponding order. Sometimes E2O relations can be derived from O2O relations and sometimes E2O relations can be derived from O2O relations. In principle, one can consider such derivable relations as redundant. However, the roles of O2O and E2O relations are different. An E2O relation may express the active participation in an event. Organizations need to establish conventions to determine how information is distributed over O2O and E2O relations.
To summarize, convergence and divergence problems are omnipresent. This also applies to the example introduced in the introduction (cf. Figure 1) involving applications, applicants, vacancies, offers, recruiters, and managers.

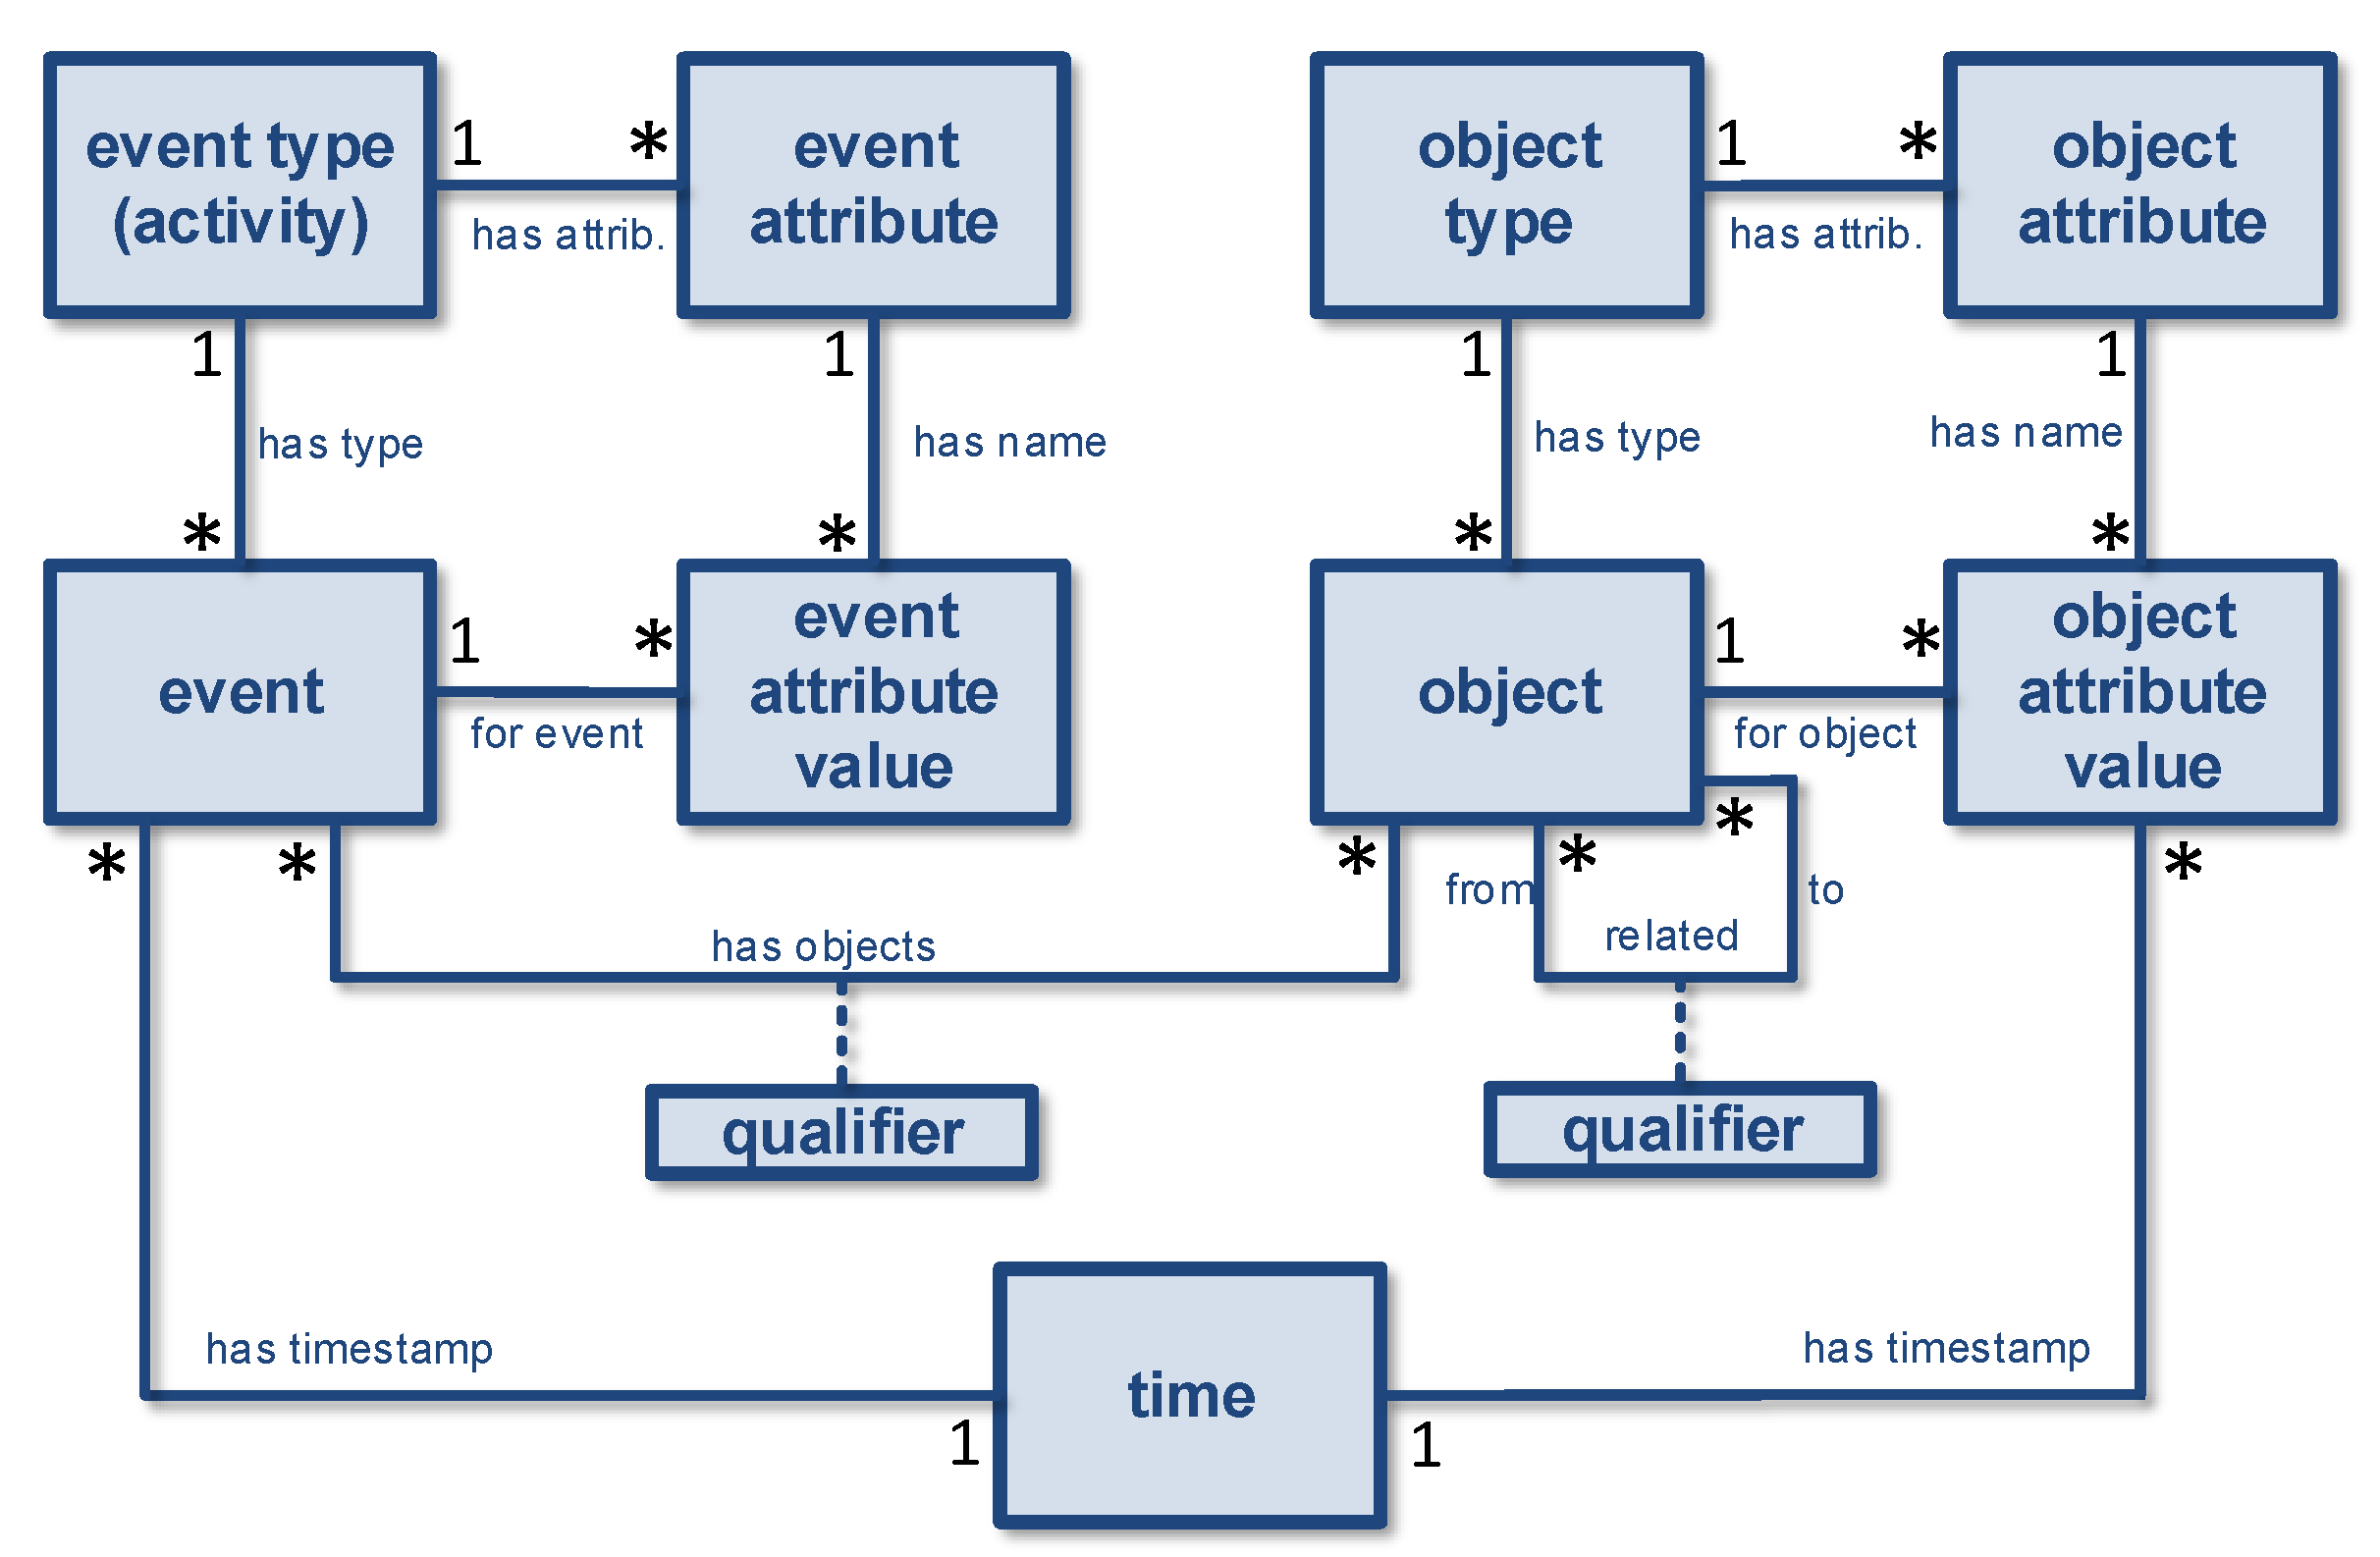
4. Formalizing Object-Centric Event Data

The object-centric event data meta-model (OCED-MM) shown in Figure 3 can be formalized in a fairly direct manner. Note that the formalization says nothing about the actual technical storage or exchange format (e.g., whether it is a relational database, a graph database, XML, or JSON). It also does not type attribute values (e.g., strings and timestamp formats). One can create a database schema based on OCED-MM and fill it with data using a view automatically generated by annotating a regular database schema. However, this is out of scope and under development as part of the revision of the OCEL standard. Here, we focus on the concepts to precisely define the core elements that need to be present. Instead of providing a syntax, we formalize object-centric event data (OCED). We start with defining a collection of universes.
Definition 1 (Universes).
We define the following pairwise disjoint universes:
  • U ev is the universe of events;
  • U etype is the universe of event types (i.e., activities);
  • U obj is the universe of objects;
  • U otype is the universe of object types;
  • U attr is the universe of attribute names;
  • U val is the universe of attribute values;
  • U time is the universe of timestamps (with 0 U time as the smallest element and U time as the largest element);
  • U qual is the universe of qualifiers.
Note that the universes are assumed to be pairwise disjoint, i.e., objects cannot be used as events, e U ev will be used to denote an event, et U etype will be used to denote an event type, o U obj will be used to denote an object, ot U otype will be used to denote an object type, ea U attr will be used to denote an event attribute, oa U attr will be used to denote an object attribute, v U val will be used to denote an attribute value, t U time will be used to denote a timestamp, and q U qual will be used to denote a qualifier. We assume a total ordering on timestamps, with 0 U time as the earliest timestamp and U time the latest timestamp (i.e., for any t U time : 0 t . These artificial timestamps are added for notational convenience, e.g., we can use 0 for missing timestamps and the start of the process, and as the end time.
Based on Figure 3 and the universes, object-centric event data (OCED) can be formalized in a fairly straightforward manner.
Definition 2 (OCED).
Object-centric event data (OCED) are described by a tuple L = ( E , O , EA , OA , evtype , time , objtype , eatype , oatype , eaval , oaval , E 2 O , O 2 O ) with the following:
  • E U ev is the set of events;
  • O U obj is the set of objects;
  • evtype E U etype assigns types to events;
  • time E U time assigns timestamps to events;
  • EA U attr is the set of event attributes;
  • eatype EA U etype assigns event attributes to event types;
  • eaval ( E × EA ) ¬ U val assigns event attributes to values at specific times;
  • objtype O U otype assigns types to objects;
  • OA U attr is the set of object attributes;
  • oatype OA U otype assigns object attributes to object types;
  • oaval ( O × OA × U time ) ¬ U val assigns object attributes to values;
  • E 2 O E × U qual × O are the qualified event-to-object relations;
  • O 2 O O × U qual × O are the qualified object-to-object relations.
As such,
  • dom ( eaval ) { ( e , ea ) E × EA evtype ( e ) = eatype ( ea ) } to ensure that only existing event attributes can have values;
  • dom ( oaval ) { ( o , oa , t ) O × OA × U time objtype ( o ) = oatype ( oa ) } to ensure that only existing object attributes can have values.
The last two requirements in the definition ensure that events and objects can only have attribute values for attributes belonging to the corresponding event or object type. Note that event attributes are assigned to event types and object attributes are assigned to object types, i.e., attributes are distinguishable between different types. This does not imply that they cannot have the same name. The formalization only says that the can be distinguished, even when names are shared.
We use the following notations given an OCED L: ET ( L ) = { evtype ( e ) e E } is the set of event types, and OT ( L ) = { objtype ( o ) o O } is the set of object types. ET 2 OT ( L ) = { ( evtype ( e ) , objtype ( o ) ) ( e , q , o ) E 2 O } describes E2O relations at the type level. If ( et , ot ) ET 2 OT ( L ) , then objects of type ot are involved in activity et . OT 2 OT ( L ) = { ( objtype ( o 1 ) , objtype ( o 2 ) ) ( o 1 , q , o 2 ) O 2 O } describes O2O relations at the type level. These notations will be used later and help to interpret Definition 2.
For clarification, we also provide some notations for attribute values. For any event e E and event attribute ea U attr : eaval ea ( e ) = eaval ( e , ea ) if ( e , ea ) dom ( eaval ) , and eaval ea ( e ) = if ( e , ea ) dom ( eaval ) . For any object o O , object attribute oa U attr , and time t U time , oaval oa t ( o ) = oaval ( o , oa , t ) if there exists a t U time such that t t and ( o , oa , t ) dom ( oaval ) such that there is no t U time such that t < t t and ( o , oa , t ) dom ( oaval ) . If no such t exists, then oaval oa t ( o ) = . Hence, oaval oa t ( o ) provides us with the latest object attribute value at time t. oaval oa ( o ) = oaval oa ( o ) is the final value for the object attribute in the event log. These notations show how to interpret event and object attributes. Note that there is a close correspondence between Definition 2 and Figure 3.
As mentioned, it is deliberate that object attribute values are not connected to events. The definition allows for events without objects or objects without events. Events should correspond to relevant activities, and therefore, there should not be the need to promote individual object attribute changes to events. Additionally, the object-to-object relations may exist independent of events. The only explicit connections between events and objects are the event-to-object relations (i.e., E 2 O ). However, for an event e happening at time t involving object o with attribute oa , we can look up the corresponding value at the time of the event via oaval oa t ( o ) .
Of course, these are, in essence, design choices, and it is possible to make other decisions. Things are kept simple deliberately, and there are many things that can be added, e.g., O2O relations that are created by events, object attribute values set by events, event-to-event (E2E) relations, etc. However, increasing complexity increases the barrier to start using it. Moreover, it does not make much sense to standardize things for which there are no analysis techniques.

5. Object-Centric Process Mining

Figure 2 already showed the main process-mining tasks: (0) extract, (1) discover, (2) check, (3) predict, and (4) act. These can all be extended to handle OCED, but it requires “reinventing” the tasks shown in Figure 2. One should realize that, unlike traditional event logs, the scope of OCED could be an entire organization and is not limited to a single process. In principle, all objects and events of an organization could be captured using the formalization in Definition 2 and the meta-model in Figure 3. It does not make sense to try to discover a model for the whole organization. This is technically possible, but the complexity would be overwhelming.
Given an OCED L = ( E , O , EA , OA , evtype , time , objtype , eatype , oatype , eaval , oaval , E 2 O , O 2 O ) , we introduced ET ( L ) as the set of event types, OT ( L ) as the set of object types, and ET 2 OT ( L ) as the relation between event types and object types. One can think of this as a contingency table where the rows correspond to the activities in ET ( L ) , the columns correspond to the object types in OT ( L ) , and the correspondence between rows and columns is described by ET 2 OT ( L ) . Table 1 shows the contingency table for the example involving orders, items, packages, and routes introduced using Figure 5.
There could be dozens, hundreds, or even thousands of object types and event types. This makes it pointless to look at the whole. One still needs to pick an angle to view processes. However, one can change the angle without extracting new data. All events and objects have been captured already, and one just needs to scope the event data. Scoping OCED requires selecting rows and columns. A profile  P sel = ( ET sel , OT sel ) (also called perspective) is a selection rows ET sel ET ( L ) and columns OT sel OT ( L ) . Such profiles can be reused to create useful views on the event data. It is also possible to use a more fine-grained profile notion that allows for selecting individual cells in the contingency table. In this case, P sel ET 2 OT ( L ) . For example, P sel = { ( place order , order ) ,   ( send invoice , order ) ,   ( receive payment , order ) ,   ( place order , item ) ,   ( pick item , item ) ,   ( pack items , item ) ,   ( pack items , package ) ,   ( deliver package , package ) } selectively picks combinations of event types and object types that should remain. After applying these more refined P sel six event types (i.e., six rows in the contingency table), three object types (i.e., three columns in the contingency table) remain. Moreover, also individual cells in the contingency table are suppressed, e.g., the send invoice and receive payment activities no longer refer to the items involved.
Note that after applying a profile to OCED L, we obtain another OCED L satisfying Definition 2. Hence, using a profile to view one OCED yields another OCED.
In the remainder of this section, we briefly discuss how we can leverage existing process-mining techniques for OCPM. We focus on the tasks discover and check in Figure 2 because these are the most essential for process mining. Of course, also the output of task extract and the input of the tasks predict and act changes. However, this is beyond the scope of this paper.

5.1. Object-Centric Process Discovery

There exists a plethora of process discovery techniques that can be applied to flattened event logs [1,11,12,13,14]. Here, we discuss how these can be used to discover object-centric process models.
It is possible to pick a profile P sel = ( ET sel , OT sel ) such that OT sel is a singleton, i.e., there is one ot sel such that OT sel = { ot sel } , and ET sel = { et ( et , ot sel ) ET 2 OT ( L ) } . This corresponds to the first four steps in the flattening of OCED described in Section 3.6. To apply existing process discovery techniques, we also need to apply the fifth step and replicate each event for all objects it refers to.
Now assume that we did this for every object type, i.e., we created one flattened event log for each object type. This means that we can obtain a process model for each object type. Now, we need to merge these. To do this, we face two problems. First of all, the frequencies are no longer correct due to the convergence problem explained in Section 3.6. Second, we need to merge the models in such a way that the semantics are preserved (the handling of different objects is synchronized properly). How this can be done is explained in [5] using Petri nets. The convergence problem leading to incorrect frequencies can be resolved using variable arcs, i.e., arcs that can be used to consume or produce multiple tokens in one step. This is a concept already present in colored Petri nets (CPNs) [28,29] and supported by, for example, CPN Tools (cf. cpntools.org, accessed on 1 April 2023). In CPNs, transitions can consume and produce multisets of tokens having arbitrary values (colors). The result is a Petri net per object type with variable arcs to indicate that multiple objects of the same type can be involved in the occurrence of an activity. This way, we can create one Petri net with variable arcs per object type. Next, these Petri nets need to be merged. This is straightforward if the discovery technique does not generate multiple transitions with the same activity label. Very few discovery techniques are able to discover such duplicate transitions. This is not limited to Petri nets and also applies to discovery techniques that produce DFGs or BPMN models. Therefore, this is not a practical limitation. While folding, all places belong to just one type and are not merged. Only transitions representing visible activities can be shared among different object types. Silent transitions, i.e., transition not describing visible activities, are never merged and correspond to one object type. Moreover, it is also possible to extend transitions with cardinality constraints, e.g., not more than 10 objects are involved of a given type. These constraints may also involve multiple object types, e.g., the number of resource objects is smaller than the number of operation objects. The resulting merged Petri net is an object-centric Petri net (OCPN) [5].
To illustrate the discovery of OCPNs, assume that we applied the profile P sel = { ( place order , order ) ,   ( send invoice , order ) ,   ( receive payment , order ) ,   ( place order , item ) ,   ( pick item , item ) ,   ( pack items , item ) ,   ( pack items , package ) ,   ( deliver package , package ) } to simplify the input. This is the view we pick, and after applying the profile, we obtain a much smaller OCED. Using this view, we discover the OCPN shown in Figure 6. Due to the selected profile, we have only three object types and six activities. The double-headed arcs indicate that a variable number of objects of the corresponding type are involved in the event. For example, each execution of activity placeorder involves one order object (normal arrow) and a variable number of item objects (double arrow). It is possible to add more precise cardinality constraints, e.g., placeorder involves at least 1 item object and at most 10 item objects (next to the order object). The two “1..*” annotations in Figure 6 show that at least one item is involved on both placeorder and packitems . The four red places contain order objects. The four green places contain item objects. The three purple places contain package objects. In this small example, only the activities placeorder and packitems have a variable number of objects involved. Events of type pack items have one package and one or more item objects.
To illustrate the semantics of OCPNs, we add some artificial frequency information in Figure 7. All arcs and transition now have a frequency. We also change the cardinalities of the variable arcs. place order now involves at most 10 item objects (“1..10”) and pack items involves at most 5 item objects (“1..5”). It is also possible to show a frequency distribution of the number of objects involved in activities. In this toy example, there are 100 orders, 500 items, and 250 packages. Events of type place order refer to one order and on average five items. Events of type pack items refer to one package and on average two items. Figure 7 shows the flow of objects and the correct frequencies. Note that if we used item as a case notion, place order would have happened 500 times and pack items would have happened 250 times (i.e., we would have the convergence problems mentioned before). Figure 7 only shows frequencies. However, it is also possible to show object-involvement distributions, routing probabilities, and time information (e.g., minimum, maximum, and average time between two activities). Using O2O relations, it is also possible to answer such questions as the following:
  • What is the average time between placing an order and delivering all the packages that contain items of the order?
  • Do people typically pay the order before or after they receive all the items?
  • Does the size of an order influence the time until delivery?
Note that all of these questions involve multiple object types.
In [5], the above approach is fully formalized. The approach was also implemented in the open-source tools mentioned before, i.e., the “OCELStandard” package in ProM (promtools.org), the OC-PM tool (ocpm.info), and Object-Centric Process Insights (ocpi.ai) (all accessed on 1 April 2023). The same general approach is used in Celonis Process Sphere [9].
For OCED, it is also possible to use mechanisms other than first creating a model for each object type and then merging and correcting the models. It is possible to reintroduce cases (also called process instances) on top of objects. One can pick a so-called leading object type as the case notion and flexibly decide which other objects belong to these so-called leading objects. It is also possible to create a so-called event-object graph and declare each connected component to be a process instance. The latter ensures that there are no convergence and divergence problems, but the process instances may be too coarse grained. A detailed discussion on these mechanisms is out of scope, but their existence allows for flexible applications of existing process-mining approaches.

5.2. Object-Centric Conformance Checking

For conformance checking, we follow the reverse approach. We start from an object-centric process model. This could be an object-centric directly follows graph (OC-DFG), an object-centric Petri net (OC-PN), or an object-centric BPMN (OC-BPMN). A precise definition of these notations is out of scope. To check conformance, cardinality constraints in the model can be directly checked on the event log. For example, if the model indicates that the activity place order relates to one order object and at least one item object, then this constraint can be checked directly on the event data. For the behavioral aspects, we can again flatten the event log and process model per object type and use standard conformance checking approaches, such as token-based replay and alignments [1,15].
Again, we refer to [5] for details. It is important to note that these principles do not depend on Petri nets and are quite general. When moving to more advanced process-mining tasks building on process discovery and conformance checking, things get more tricky, for example, when extracting features related to process instances, where process instances refer to a collection of related objects.

5.3. Example Using OC-PM and Process Sphere

To illustrate the techniques just described, we use a small example and show discovered process models in both OC-PM and Celonis Process Sphere. In this small data set, we have six object types having the following numbers of objects: 288 applicants, 916 applications, 135 offers, 140 vacancies, 20 recruiters, and 6 managers. There are 16 activities (i.e., event types): open vacancy, submit application, assign recruiter, first screening, check references, assign vacancy, send rejection, close vacancy for new applications, change manager, consult manager, invite for interview, conduct interview, make job offer, offer accepted and hired, job offer declined, and close vacancy (no hire). In total, there are 1505 objects and 6980 events.
If we flatten the OCED data set using applications as a case notion, we obtain a process model similar to Figure 1 using the BPMN notation.
Figure 8 shows a few screenshots using the OC-PM tool (ocpm.info, accessed on 1 April 2023). OC-PM supports Object-Centric Directly Follows Graphs (OC-DFGs), Object-Centric Petri Nets (OC-PNs), and Object-Centric BPMN models (OC-BPMNs). Figure 8a shows the OC-DFG based on the whole data set. Figure 8b shows the contingency table. The user can select the object types and events to be included. If we select vacancies, applications, and offers as object types (i.e., three of six) and all related activities, we obtain the OC-PN shown in Figure 8c. Places, arcs, and silent transitions related to vacancies are shown in red. Model elements related to applications are blue, and elements related to offers are green. It is also possible to show the OC-DFG and OC-BPMN based on this selection. The view selected shows frequencies, but it is also possible to show average durations. If we select applicants, applications, and offers as object types (applicants are shown in light blue) and a subset of activities, we obtain the OC-PN shown in Figure 8d.
Figure 9 shows a few screenshots of Celonis Process Sphere using the same data set [9]. Although the visualizations are very different, the underlying principles are the same. Figure 9a shows the OC-BPMN based on the whole data set. In the “view control” window on the left, one can see the list of object types and event types. Again, it is possible to select subsets. Figure 9b shows the OC-BPMN generated after selecting applicants, applications, and offers as object types. We pick the same subset of event types as in Figure 8d. Figure 9c shows a screenshot of Celonis Process Sphere while analyzing the time in between two selected activities. We selected the activities submit application and offer accepted and hired and the object type applicant. There are 84 applicants with activity submit application followed by offer accepted and hired, and the average time between the first application and actually being hired is 84 days. The window on the left shows the distribution of the throughput time.
Both the open-source OC-PM tool and Celonis Process Sphere provide many more capabilities that are beyond the scope of this paper. However, Figure 8 and Figure 9 provide some insights into possibilities and the value of showing multiple object types.

5.4. Other Considerations Related to Scalability, Adoption, and New Opportunities

In principle, an organization can store all events and objects in a single OCED L = ( E , O , EA , OA , evtype , time , objtype , eatype , oatype , eaval , oaval , E 2 O , O 2 O ) . This triggers questions related to scalability. Today’s leading process-mining engines can handle billions of events and cases, which is amazing. Summing up all the objects and events for all processes of larger organizations may lead to hundreds of billions of events and cases. However, it makes no sense to discover a process model for the whole organization involving all event and object types.
Note that state-of-the-art process-mining systems (e.g., Celonis) use a two-tier architecture. In the first tier, a cloud relational database is used (e.g., Vertica). Here, the focus is on scalability and not (process mining) speed. In the second tier, a selected part of the data is loaded into the process-mining engine (typically using an in-memory database) for analysis purposes. This allows us to leverage the so-called profiles (also called perspectives) introduced at the beginning of this section. These profiles correspond to typical views ideally having no more than five object types and twenty activities. Only the selected data are loaded into the process-mining engine. Process-mining computations are performed over these views and are therefore non-problematic for most applications. In general, one can even say that OCPM makes process mining more scalable. The events are typically captured at a higher level of abstraction and there is no duplication of data. Using non-object-centric process mining, event logs are often overlapping, e.g., multiple logs refer to the same products, customers, and suppliers. Therefore, scalability is no problem using a two-tier architecture, where only the events and objects related to a profile are loaded into the process-mining engine. Consequently, scalability is comparable to (and often even better than) traditional process mining.
Although OCED logs are more complex than traditional flat event logs, organizations are eager to adopt this new technology. Next to new capabilities, such as discovering object-centric process models and powerful insights spanning multiple departments and processes, it greatly simplifies data management. Operational processes tend to leave data in different systems. OCPM provides a layer on top of these systems unifying the data in a format much closer to the actual business operations. Instead of storing the data in a format close to the source system (e.g., SAP with its 800.000 tables), data should be stored in a well-defined unified format using names for object types and event types that end-users understand. Definitions of object types and event types and their attributes need to be standardized. It is possible to define taxonomies of object types and event types using inheritance notions.
This requires a mind shift. Instead of loading the data as they are stored in the different source systems, it is better to pull the data from these source systems using a specific target format (i.e., well-defined object types and event types). This provides unified semantics. Having semantically enriched OCED, new forms of querying and reasoning can be used. It is possible to train large language models (LLMs) that use publicly available data (Wikipedia, websites, etc.) and semantically enriched information about objects and events. It is already possible to generate process-mining queries using general-purpose LLMs, such as GPT-4. However, for more precise results, structure and semantics are key.
Next to these new opportunities provided by OCPM, also, existing process-mining techniques need to be reinvented to deal with multiple object types. Because the notion of an instance is more flexible, tasks such as filtering, clustering, and prediction are more challenging. Whereas traditional process-mining algorithms deal mostly with sequences, OCPM techniques often work on graphs.

6. Conclusions

Process-mining technology is used to drive efficiency, improve operational excellence, and address performance and compliance problems. Although more and more organizations are seeing the value of process mining and have started to use it, there are also some challenges. As explained in this paper, (1) extraction is often time consuming and needs to be repeated when new questions emerge, (2) interactions between objects are not captured and objects are analyzed in isolation, and (3) a three-dimensional reality with multiple object types needs to be squeezed into two-dimensional event logs and models focusing on individual cases.
This tutorial-style paper illustrated these problems by first presenting the normal process-mining tasks and the object-centric event data meta-model (OCED-MM), which introduces the core concepts. Using this, it was possible to precisely explain the convergence and divergence problems. We also provided a rigorous formalization of these concepts. Moreover, we could explain such concepts as the contingency table, profiles, and flattening events logs by picking one object type. We also explained the basic principles that can be used to lift process discovery and conformance checking from traditional event logs to object-centric process mining (OCPM). This was illustrated using the open-source OC-PM tool and Celonis Process Sphere. However, the goal was not to present specific tools and algorithms. This is outside the scope of this paper. Instead, we presented the “bigger picture” and “growing relevance” of OCPM.
By implementing OCPM, it is possible to view all operational activities from any perspective using a single source of truth. Organizations should steer away from system-specific event logs; ideally event data are system agnostic. A process supported by SAP should leave the same footprint as the same process supported by Oracle. This requires taking control of data management. There is no need to extract the data when changing the viewpoint. This allows for flexibility using “on demand” process-mining views. OCPM will reveal novel and valuable improvement opportunities for problems that live at the intersection points of processes and organizational units. This helps to transition from two-dimensional views of processes to a three-dimensional and dynamic view of the entire organization and its processes. Traditional process mining can be seen as taking two-dimensional X-rays of processes. These are static and limited to one particular viewpoint (i.e., the angle is fixed). OCPM is more like taking an MRI, thus creating a three-dimensional representation that can be viewed from any angle. Therefore, we expect that OCPM will become the “normal” way of performing process mining and that the ideas presented in this paper will be adopted by most tool vendors. Moreover, existing research approaches will need to be lifted to include this third dimension. This provides interesting new scientific challenges.

Funding

This research was funded by the Alexander von Humboldt (AvH) Stiftung and the Deutsche Forschungsgemeinschaft (DFG, German Research Foundation) under Germany’s Excellence Strategy, EXC Internet of Production, 390621612.

Data Availability Statement

The object-centric events logs used in this paper are available from ocel-standard.org (accessed on 1 April 2023).

Acknowledgments

Thanks to the teams at RWTH Aachen University and Celonis for implementing object-centric software (in particular, Alessandro Berti, for implementing OC-PM).

Conflicts of Interest

The funder had no role in the design of the study; in the collection, analyses, or interpretation of data; in the writing of the manuscript; or in the decision to publish the results.

References

  1. Van der Aalst, W. Process Mining: Data Science in Action; Springer: Berlin/Heidelberg, Germany, 2016. [Google Scholar]
  2. OMG. Business Process Model and Notation (BPMN); Formal/2011-01-03; Object Management Group: Needham, MA, USA, 2011. [Google Scholar]
  3. Van der Aalst, W.; Carmona, J. (Eds.) Process Mining Handbook; Lecture Notes in Business Information Processing; Springer: Berlin/Heidelberg, Germany, 2022; Volume 448. [Google Scholar]
  4. IEEE Task Force on Process Mining. XES Standard Definition. 2016. Available online: www.xes-standard.org (accessed on 1 April 2023).
  5. Van der Aalst, W.; Berti, A. Discovering Object-Centric Petri Nets. Fundam. Inform. 2020, 175, 1–40. [Google Scholar] [CrossRef]
  6. Kerremans, M.; Srivastava, T.; Choudhary, F. Gartner Market Guide for Process Mining, Research Note G00737056. 2021. Available online: www.gartner.com (accessed on 1 April 2023).
  7. Kerremans, M.; Iijima, K.; Sachelarescu, A.; Duffy, N.; Sugden, D. Magic Quadrant for Process Mining Tools, Gartner Research Note GG00774746. 2023. Available online: www.gartner.com (accessed on 1 April 2023).
  8. Reinkemeyer, L. Process Mining in Action: Principles, Use Cases and Outlook; Springer: Berlin/Heidelberg, Germany, 2020. [Google Scholar]
  9. Van der Aalst, W. Object-Centric Process Mining: The Next Frontier in Business Performance. 2023. Available online: celon.is/OCPM-Whitepaper (accessed on 1 April 2023).
  10. Wynn, M.T.; Lebherz, J.; van der Aalst, W.M.P.; Accorsi, R.; Ciccio, C.D.; Jayarathna, L.; Verbeek, H.M.W. Rethinking the Input for Process Mining: Insights from the XES Survey and Workshop. In Process Mining Workshops of the International Conference on Process Mining (Revised Selected Papers); Munoz-Gama, J., Lu, X., Eds.; Lecture Notes in Business Information Processing; Springer: Berlin/Heidelberg, Germany, 2021; Volume 433, pp. 3–16. [Google Scholar]
  11. Augusto, A.; Conforti, R.; Dumas, M.; Rosa, M.; Maggi, F.; Marrella, A.; Mecella, M.; Soo, A. Automated Discovery of Process Models from Event Logs: Review and Benchmark. IEEE Trans. Knowl. Data Eng. 2019, 31, 686–705. [Google Scholar] [CrossRef] [Green Version]
  12. Leemans, S.; Fahland, D.; Van der Aalst, W. Scalable Process Discovery and Conformance Checking. Softw. Syst. Model. 2018, 17, 599–631. [Google Scholar] [CrossRef] [PubMed] [Green Version]
  13. Werf, J.; Van Dongen, B.; Hurkens, C.; Serebrenik, A. Process Discovery using Integer Linear Programming. Fundam. Informaticae 2010, 94, 387–412. [Google Scholar]
  14. Augusto, A.; Conforti, R.; Marlon, M.; La Rosa, M.; Polyvyanyy, A. Split Miner: Automated Discovery of Accurate and Simple Business Process Models from Event Logs. Knowl. Inf. Syst. 2019, 59, 251–284. [Google Scholar] [CrossRef] [Green Version]
  15. Carmona, J.; Dongen, B.; Solti, A.; Weidlich, M. Conformance Checking: Relating Processes and Models; Springer: Berlin/Heidelberg, Germany, 2018. [Google Scholar]
  16. De Leoni, M.; Van der Aalst, W. A General Process Mining Framework For Correlating, Predicting and Clustering Dynamic Behavior Based on Event Logs. Inf. Syst. 2016, 56, 235–257. [Google Scholar] [CrossRef]
  17. Teinemaa, I.; Dumas, M.; La Rosa, M.; Maggi, F.M. Outcome-Oriented Predictive Process Monitoring: Review and Benchmark. ACM Trans. Knowl. Discov. Data 2019, 13, 17:1–17:57. [Google Scholar] [CrossRef]
  18. Fahland, D. Describing Behavior of Processes with Many-to-Many Interactions. In Applications and Theory of Petri Nets 2019; Donatelli, S., Haar, S., Eds.; Lecture Notes in Computer Science; Springer: Berlin/Heidelberg, Germany, 2019; Volume 11522, pp. 3–24. [Google Scholar]
  19. Lu, X.; Nagelkerke, M.; Wiel, D.; Fahland, D. Discovering Interacting Artifacts from ERP Systems. IEEE Trans. Serv. Comput. 2015, 8, 861–873. [Google Scholar] [CrossRef] [Green Version]
  20. Li, G.; Medeiros de Carvalho, R.; Van der Aalst, W. Automatic Discovery of Object-Centric Behavioral Constraint Models. In Proceedings of the Business Information Systems (BIS 2017), Hannover, Germany, 28–30 June 2017; Abramowicz, W., Ed.; Lecture Notes in Business Information Processing. Springer: Berlin/Heidelberg, Germany, 2017; Volume 288, pp. 43–58. [Google Scholar]
  21. Artale, A.; Kovtunova, A.; Montali, M.; Van der Aalst, W. Modeling and Reasoning over Declarative Data-Aware Processes with Object-Centric Behavioral Constraints. In Business Process Management: 17th International Conference (BPM 2019), Vienna, Austria, 1–6 September 2019; Hildebrandt, T., van Dongen, B., Röglinger, M., Mendling, J., Eds.; Lecture Notes in Computer Science; Springer: Berlin/Heidelberg, Germany, 2019; Volume 11675, pp. 139–156. [Google Scholar]
  22. Eck, M.L. Process Mining for Smart Product Design. Ph.D. Thesis, Eindhoven University of Technology, Mathematics and Computer Science, Eindhoven, The Netherlands, 2022. [Google Scholar]
  23. Li, G. Process Mining Based on Object-Centric Behavioral Constraint (OCBC) Models. Ph.D. Thesis, Eindhoven University of Technology, Mathematics and Computer Science, Eindhoven, The Netherlands, 2019. [Google Scholar]
  24. Esser, S.; Fahland, D. Multi-Dimensional Event Data in Graph Databases. J. Data Semant. 2021, 10, 109–141. [Google Scholar] [CrossRef]
  25. Ghilardi, S.; Gianola, A.; Montali, M.; Rivkin, A. Petri net-based object-centric processes with read-only data. Inf. Syst. 2022, 107, 102011. [Google Scholar] [CrossRef]
  26. Process and Data Science Group. OCEL Standard. 2021. Available online: www.ocel-standard.org (accessed on 1 April 2023).
  27. OMG Group. Object Constraint Language, Version 2.4. OMG. 2014. Available online: http://www.omg.org/spec/OCL/2.4/ (accessed on 1 April 2023).
  28. Jensen, K. Coloured Petri Nets. Basic Concepts, Analysis Methods and Practical Use; EATCS monographs on Theoretical Computer Science; Springer: Berlin/Heidelberg, Germany, 1992. [Google Scholar]
  29. Jensen, K.; Kristensen, L.M. Coloured Petri Nets—Modeling and Validation of Concurrent Systems; Springer: Berlin/Heidelberg, Germany, 2009. [Google Scholar]
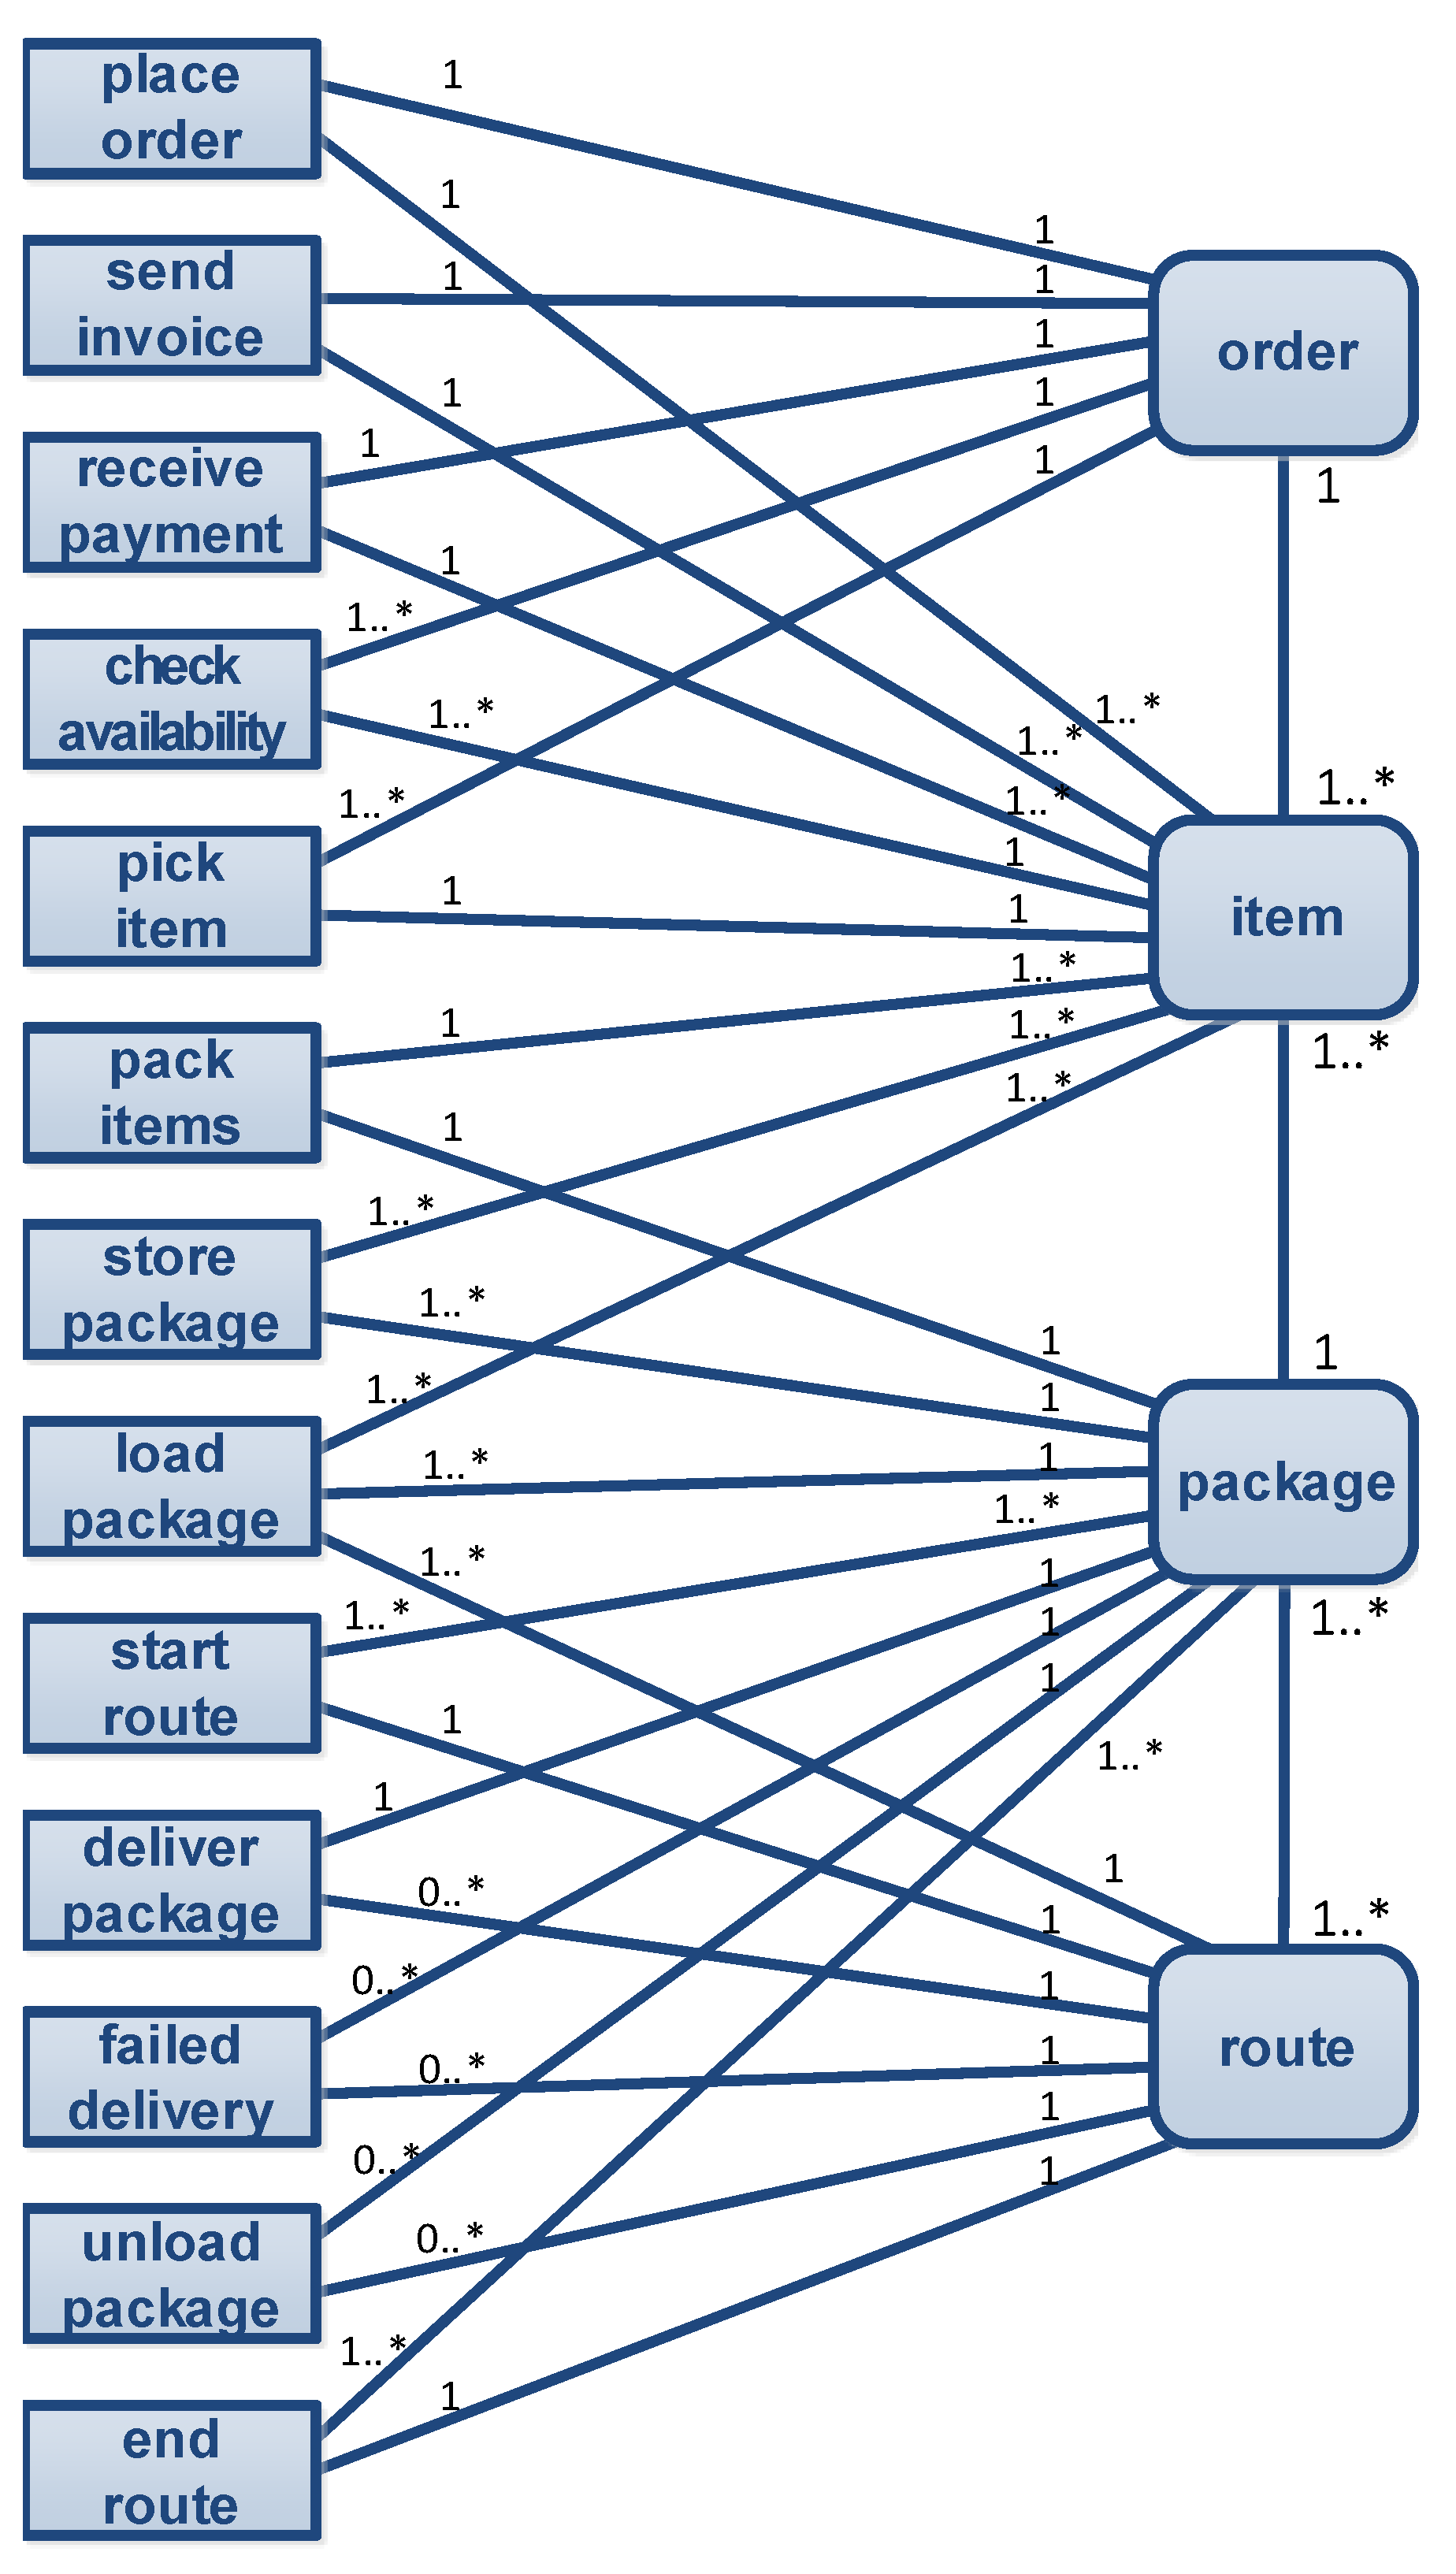
Figure 1. A BPMN model describing the lifecycle of an application. Each activity is executed for one application. The underlying assumption of such process models is that each event refers to precisely one object (often called case) of a given fixed type.
Mathematics 11 02691 g001
Figure 2. High-level overview of the different process-mining tasks: (0) exact, (1) discover, (2) check, (3) predict, and (4) act. Note that these tasks need to be “reinvented” for OCPM because, traditionally, they assume a single case notion and cases that are non-interacting (see Section 5).
Mathematics 11 02691 g002
Figure 3. The object-centric event data meta-model (OCED-MM). The classes (rectangles) introduce the main concepts (events, objects, attributes, etc.). The relationships are annotated with cardinalities (⁎ denotes zero or more), e.g., an event may refer to any number of objects, an object may be involved in any number of events, an event has precisely one timestamp, and an event has precisely one event type.
Mathematics 11 02691 g003
Figure 4. A meta-model describing traditional event logs. There are no object types, and each event can refer to only one object (called a “case”).
Mathematics 11 02691 g004
Figure 5. Larger example illustrating convergence and divergence problems. The left-hand side shows event types (i.e., activities) and the right-hand side shows object types.
Mathematics 11 02691 g005
Figure 6. An object-centric Petri net (OCPN) discovered after applying profile P sel . The places and arcs colored red refer to orders. The places and arcs colored green refer to items. The places and arcs colored purple refer to packages.
Mathematics 11 02691 g006
Figure 7. An OCPN showing the true frequencies of activities and object flows. Next to showing frequencies, it is also possible to show routing probabilities and time information (e.g., bottlenecks).
Mathematics 11 02691 g007
Figure 8. Example results produced using the OC-PM tool (ocpm.info, accessed on 1 April 2023). The screenshots are not intended to be readable but illustrate the capabilities of OC-PM. The different colors correspond to the six object types.
Mathematics 11 02691 g008
Figure 9. Example results produced using Celonis Process Sphere [9]. The screenshots are not intended to be readable but illustrate the capabilities of Process Sphere. The different colors correspond to the six object types.
Mathematics 11 02691 g009
Table 1. Contingency table relating activities ET ( L ) (rows) to object types OT ( L ) (columns) based on Figure 5. The checkmarks (✓) describe ET 2 OT ( L ) . Instead of checkmarks, one can also show the cardinalities. To scope OCED for analysis, one needs to select the relevant rows and columns.
OrderItemPackageRoute
place order
send invoice
receive payment
check availability
pick item
pack items
store package
load package
start route
deliver package
failed delivery
unload package
end route
Disclaimer/Publisher’s Note: The statements, opinions and data contained in all publications are solely those of the individual author(s) and contributor(s) and not of MDPI and/or the editor(s). MDPI and/or the editor(s) disclaim responsibility for any injury to people or property resulting from any ideas, methods, instructions or products referred to in the content.

