Article

Mathematical Modelling of Physiological Effects Caused by a Glycine Receptors Post-Synaptic Density Spatial Polymorphism

by
Yaroslav R. Nartsissov
1,2,* and
Leonid A. Ivontsin
1
1
Department of Mathematical Modeling and Statistical Analysis, Institute Cytochemistry and Molecular Pharmacology, Moscow 115404, Russia
2
Biomedical Research Group, BiDiPharma GmbH, Bültbek 5, 22962 Siek, Germany
*
Author to whom correspondence should be addressed.
Mathematics 2023, 11(11), 2499; https://doi.org/10.3390/math11112499
Submission received: 11 April 2023 / Revised: 26 May 2023 / Accepted: 26 May 2023 / Published: 29 May 2023

Abstract

:
Synaptic transmission is the main process providing cross-connecting activity among neurons in the central nervous system (CNS). In the present study, the 3D mathematical model of a neuronal bouton with a cluster localization of glycine receptors (GlyRs) on the post-synaptic membrane was developed. The number and eventual position of the receptors are defined by the structural data of the GlyR-gephyrin complex. Furthermore, the forming of inhibitory post-synaptic potential (IPSP) and an electro-diffusion of chloride ions were evaluated by applying the boundary problems for a Poisson’s equation and a non-steady-state diffusion equation, respectively. It was shown that local changes in the chloride ion concentration near the post-synaptic membrane, mediated by GlyRs activation, can raise up to 80–110% from the initial level. The average value of the concentration increase was as high as 10% in a pike of activity under the full activation of GlyRs. The central spatial localization of GlyRs in the cluster had a considerable difference both in the chloride ion concentration changes (6%) and IPSP (17%) compared to the divided or rear localization. Thus, a spatial polymorphism of the post-synaptic density of GlyRs is important to form a physiological response to a neuromediator release.

1. Introduction

The main aspect of CNS functioning is a mutual balance between excitation and inhibition, which is realized through the system of well-organized transmembrane ion fluxes. In fact, the final value of the membrane potential is the combination of cations/anions side-by-side distributions where sodium, potassium and chloride ions are the most influential. Indeed, two-valent cations such as calcium, magnesium and zinc are also involved, but their function is tightly connected with a signaling regulation. For each neuron, the excitation provides a time-dependent opening of sodium/potassium passive transport channels, forming an action potential. A crosstalk between the neurons is fulfilled by a synaptic transmission. This phenomenon includes the release of special chemical compounds (neuromediators) from the pre-synaptic membrane, with their diffusion in a synaptic area with the activation of specific receptors on a post-synaptic membrane. A part of such receptors depolarizes the membrane by the activation of cation trans-membrane currents, and the appropriate mediators are named as excitatory neurotransmitters (e.g., serotonin, dopamine, glutamate, etc.). Another type of ligand gates the channels and mediates an anion current, which yields a hyperpolarization of the neuron membrane. The mediators are considered as inhibitory neurotransmitters (e.g., gamma aminobutyric acid (GABA) and glycine). The main processes of a synaptic neurotransmission are represented in Figure 1.
Although GABA and glycine receptors compose separate nervous terminals and synapses [1], it is experimentally proved that both inhibitory neurotransmitters have been shown to be co-released at central synapses in different brain areas [2,3,4], forming mixed synapses.
The most extensive part of GABAergic inhibition and all of glycinergic inhibition are mediated by the fast hyperpolarizing currents of chloride ions classically observed in mature neurons [1]. However, it is remarkable that the Cl permeability of GABA and glycine receptors yields an opposite direction of a membrane polarization depending on the tissue development stage. Indeed, peripheral neurons and immature CNS neurons accumulate Cl well above the thermodynamic equilibrium potential, while mature CNS neurons have Cl concentrations lower than expected based on the thermodynamic equilibrium potential [5]. As a result, under a relatively high intracellular chloride ion concentration (at nearly 25 mM instead of 7 mM), the opening of the inhibitory receptors cause a depolarization and an excitation [6]. This reverse function is considered as a feature of immature neurons. The physical reason for such a phenomenon is supposed to be a down-regulation of the solute carrier 12 (SLC12) family of electroneutral cation-chloride co-transporters (CCCs), and neuron-specific K+Cl co-transporters (KCC2) during the early stage of brain development [7].
As it was already mentioned above, the concentration of Cl is a very flexible parameter in the nervous cells. It seems to be essentially age- and health-dependent. During brain maturation, the cytoplasmic chloride ion levels are intrinsically higher than in adult neurons with a developmental shift of the actions of GABA [6]. The rate of Cl transmembrane transport is essential for neuron functions, and a variation of the basal chloride permeability could be an important mechanism of neuronal cells to adapt their responsiveness to external stimuli during learning and memory processes [8]. The balance of the inside Cl level is supported by the combined activity of GABAA, GlyR and CCC. It has been experimentally shown that CCC dysfunctions are likely to be associated with a wide range of neurological and psychiatric disorders [7] including epilepsy [9], motor spasticity, stress, anxiety, schizophrenia, morphine-induced hyperalgesia [10] and chronic pain [11]. Additionally, different studies of CCCs during the chronic and recovery phases post-stroke reveal the importance of timing when considering CCCs as potential neuroprotective and/or neuromodulator targets [12]. Activity-dependent Cl accumulation subverts the actions of parvalbumin-expressing interneurons to perpetuate rather than terminate pathological network hyperexcitability during the clonic phase of seizures [13]. Thus, a chloride ion balance is an active participant in the formation of health and disease conditions in patients of different ages.
However, the small volume of the synapse and limited diffusion capacity cause rapid Cl accumulation (i.e., Cl concentration increases in the order of 20 mM in a neuron cytoplasm can occur within hundreds of milliseconds), and it will transiently occur even with a strong KCC2 expression [14]. Thus, the ability to alter the membrane hyperpolarization to depolarization may be hypothetically kept in a mature state of neurons. The reason for such an effect consists in the maintenance of local chloride gradients inside the synapses. Due to a very stable set of glycinergic synapse physico-chemical parameters, the only ability to modify the composition of trans-membrane ion currents is the architecture of glycine receptors (GlyRs) binding to gephyrin, highlighting the importance of this structural protein as a central controller of the glycinergic synapse structure and function [15].
Geometrical features of a nervous parenchyma structure were already reported to be the reason for peculiar physiological regulation. For instance, the geometry of astrocyte end-feet mutual contacts has an essential effect on the glucose level forming in changes of capillary blood flow [16,17].
The diffusion of different metabolites is considered as the main biophysical process defining the regulation and the function of CNS and the peripheric parts of axons. In the classical work by C. Nicholson and J. M. Phillips, it was defined that the concepts of volume averaging, volume fraction (α) and tortuosity (λ) were theoretically appropriate for quantifying diffusion in a complex medium such as the brain [18]. Since the beginning of the century, it has been proved that diffusion in the interstitial space can be accurately modelled with the appropriate modifications of classical equations and quantified from measurements based on novel micro-techniques [19]. Theoretical models and simulations of the extracellular space (ECS) have explored the influence of its geometry, effects of dead-space microdomains, extracellular matrix, and interaction of macromolecules with ECS channels [20]. Moreover, it was shown that terminal ischemia modifies the ECS width which falls below 10 nm, and this observation is essential for the modeling of neurotransmitter spread after spillover and ectopic release and to establish size limits for the diffusion of drug delivery vectors such as viruses, liposomes, and nanoparticles in brain ECS [21]. Thus, it is generally accepted that for a description of the diffusion processes in the brain parenchyma, the methods of porous media can be applied [22,23,24]. Nevertheless, due to the complexity of the object structure and the limitation of a solving procedure, different simplifications are usually used. In particular, a diffusion term can be approximated by the diffusion flow of metabolites between neighboring grid pixels [25], or a multi-domain formulation of reaction–diffusion equations [26] applies as a spatially-lumped model, which is shown to be a consistent, spatially-averaged approximation of the distributed model [27].
In the present study, we tested the hypothesis of the GlyRs post-synaptic density spatial polymorphism influence on IPSP and the increase in the local chloride ion gradient in a post-synaptic compartment of a neuron.
It was shown that, despite a medium shift of the gradient in an average value, a local fluctuation of the Cl concentration can be essential. The spatial polymorphism of the receptor localization has an influence not only on the shape of the concentration and the potential distribution, but it also defines the physiological response of the system to the external stimulus. In particular, only the central type of GlyRs membrane localization yields an increase in both the IPSP amplitude and chloride ion concentration inside the neurons, so that a glycine bouton can restore the rest potential on the membrane even under a full capacity of receptor-activation and 20% depolarization. The enlargement of both the IPSP and a chloride concentration are always the attributes of central GlyR localization compared to rear and divided types of clusters. This local effect may be the background for a precise regulation of the CNS functioning.
The scientific novelty of the represented approach is an application of a multiphysical modelling to a local post-synaptic neuron’s area mimicking a complex 3D structure of receptors and the synapse localization based on the experimental data. The purpose of the represented model is to prepare the algorithm of an appropriate local 3D neuron phantom creation and the estimation of the biological spatial polymorphism influence on ion gradients and the IPSP.

2. Materials and Methods

According to the step-by-step modeling process, the analysis of chloride ion gradients should be evaluated in a digital glycinergic synapse phantom. The creation of such a phantom is a set of procedures applying to the basic objects constituting the final structure of the analyzed area. Despite a simplicity in the Boolean operations used for such a purpose, the phantom of a glycinergic synapse is always formed by the determined sequence of actions performed for the fixed amount of 3D objects. The list of the geometric solids is represented in Table 1.
Furthermore, a mesh should be generated and applied to the final form of the considered medium. Finally, the governing equation is solved to obtain the electric potentials and the chloride ion gradients under different geometric forms of a post-synaptic density (PSD) for GlyRs. All steps are the components of the modelling process, and they will be considered below.

2.1. Generation of a Virtual Digital Phantom of a Glycinergic Synapse

To create a digital phantom of any kind of synapse, one needs to set up the bodies for the pre-synaptic/post-synaptic part of the synapse, the area of synaptic cleft and the surrounding astrocyte bodies. All these objects may be selected from 3D Voronoi diagrams according to the algorithm described elsewhere [28]. The parts of contacting neurons are combined with the simulation of a synapse cleft space (Figure 2). The result is achieved by Boolean operations:
Ω f i n a l = ( Ω 1 Ω 2 ) \ ( Ω u p p e r Ω l o w e r Ω c y l i n d e r )
where Ω 1 ,   Ω 2 are two objects of 3D Voronoi diagrams and Ω u p p e r ,   Ω l o w e r ,   Ω c y l i n d e r represent two ellipsoids and one cylinder forming a cleft space, respectively. The astrocyte’s surrounding body is organized by a loft procedure which connects the boundaries belonging to separate neurons. Furthermore, the interlink to the other part of an astrocyte is also organized by a loft operation.
An interstitial fluid (ISF) is mimicked by a combination of the ellipsoid and the synaptic cleft area:
Ω I S F = Ω e l l i p s o i d \ ( Ω f i n a l Ω a s t r o c y t e )
The result of the operations can be prepared for a further grid application for numerical calculations using the finite element method (FEM); however, for the present study, just a one object needed to be considered. The chosen separate area of a neuron was validated according to experimental data. In the present study, the ratio between the total synaptic membrane ( Ω s y n a p s e t o t ) and post-synaptic volume ( Ω p o s t s y n a p s e ) was equal to 0.0722 μm2/μm3, whereas the same value for the spine synapses lay in the range of 0.07059 ± 0.0066 μm2/μm3 [29].
The electro-diffusion of chloride ions occurs in a post-synaptic compartment of the neuron with output transport through KCC2. The incoming chloride currents are mediated through GlyR, which are distributed on the membrane. As mentioned above, the view of distribution is determined by the contacts with gephyrin. This protein composes a spread grid, which has a well-organized structure.

2.2. A Grid of Gephyrins and Its Schematic Presentation for GlyR Distribution

In the inhibitory post-synaptic terminal, high local concentrations of glycine receptors (GlyR) are achieved due to their binding to the scaffold protein, gephyrin [30]. Gephyrin is a protein of the post-synaptic density at inhibitory synapses where it serves as a GlyR-anchoring protein, and, moreover, it influences the size and density of post-synaptic receptor clusters and differentially modulates the receptor recruitment and stability of not only GlyRs but also GABAA receptors [15]. Gephyrin consists of an N-terminal G-domain involved in the formation of gephyrin trimers (Figure 3a), a central C-domain, and a C-terminal E-domain that dimerizes in vitro and regulates clustering in vivo [31]. The interaction between gephyrin and the GlyR involves the E-domain of gephyrin, and a cytoplasmic loop located between the transmembrane segments three and four of the GlyR β subunit, while the GlyR β-loop is bound in a symmetric ‘key and lock’ fashion to each E-domain monomer in a pocket adjacent to the dimer interface [32]. In a post-synaptic compartment, gephyrin trimers form a hexagonal lattice (Figure 3b) [33].
This structure is used as a matrix for adjusting the position of GlyRs on a synaptic membrane. The re-created lattice has the points which indicate the contact of gephyrin molecules and the mid-point of an assumed receptor binding. Furthermore, the mentioned structure is placed under the area of the post-synaptic membrane in the phantom. Then, the set of cylinders with the radii corresponding to the inner GlyR vestibule is adjusted to each point of GlyR–gephyrin contact. The set of Boolean operations yields the division of the post-synaptic boundary on the areas coinciding to outlet receptor channels. As remarked above, the value and the geometric form of PSD can be different. A spatial distribution of these states of mutual positions composes the type of clusters in a glycine synaptic membrane.

2.3. Estimation of GlyR Clustering in a Synaptic Membrane

A hexagonal gephyrin lattice considered in Section 2.2 is the background for a GlyR-placing on the surface of a post-synaptic membrane; however, not all slots of the grid are occupied by GlyRs. The area corresponding to a possible GlyR location has to be either occupied ( Ω G l y R ) or empty ( Ω G l y R _ e m p t y ). It was experimentally shown that GlyRs are packed at a constant density of about 2000 receptor complexes per μm2 at mature synapses, suggesting that they are assembled in a stereotypic fashion [37]. The area of the considered post-synapse in the present study was equal to 0.055 μm2; therefore, the maximum number of GlyR which could be placed on the location was 110, but the maximal capacity corresponding to the considered size was 189. This means that at least 79 slots were free; however, the location of such a set may be different. As it was described in Figure 3, the shape of the cluster can be either central or divided, or rear. Moreover, there are many conditions when not all GlyRs are activated by the mediator’s release. This means that a part of the cluster will be silent. To account for this characteristic, the varied capability of the receptors must be taken into account. Thus, the size of the clusters is determined by the number of occupied GlyRs locations which are assumed to be 110 (100%), 80 (73%), 65 (59%), 50 (46%), and 40 (36%), respectively. Interestingly, the alternate interpretation of this percentage is the number of GlyRs activated in response to the release of neuromediators. In other words, the number of occupied locations may be always 110, but not all of them will be opening the channels; therefore, the percents of occupied GlyRs locations can also be called the cluster capacity (CC).

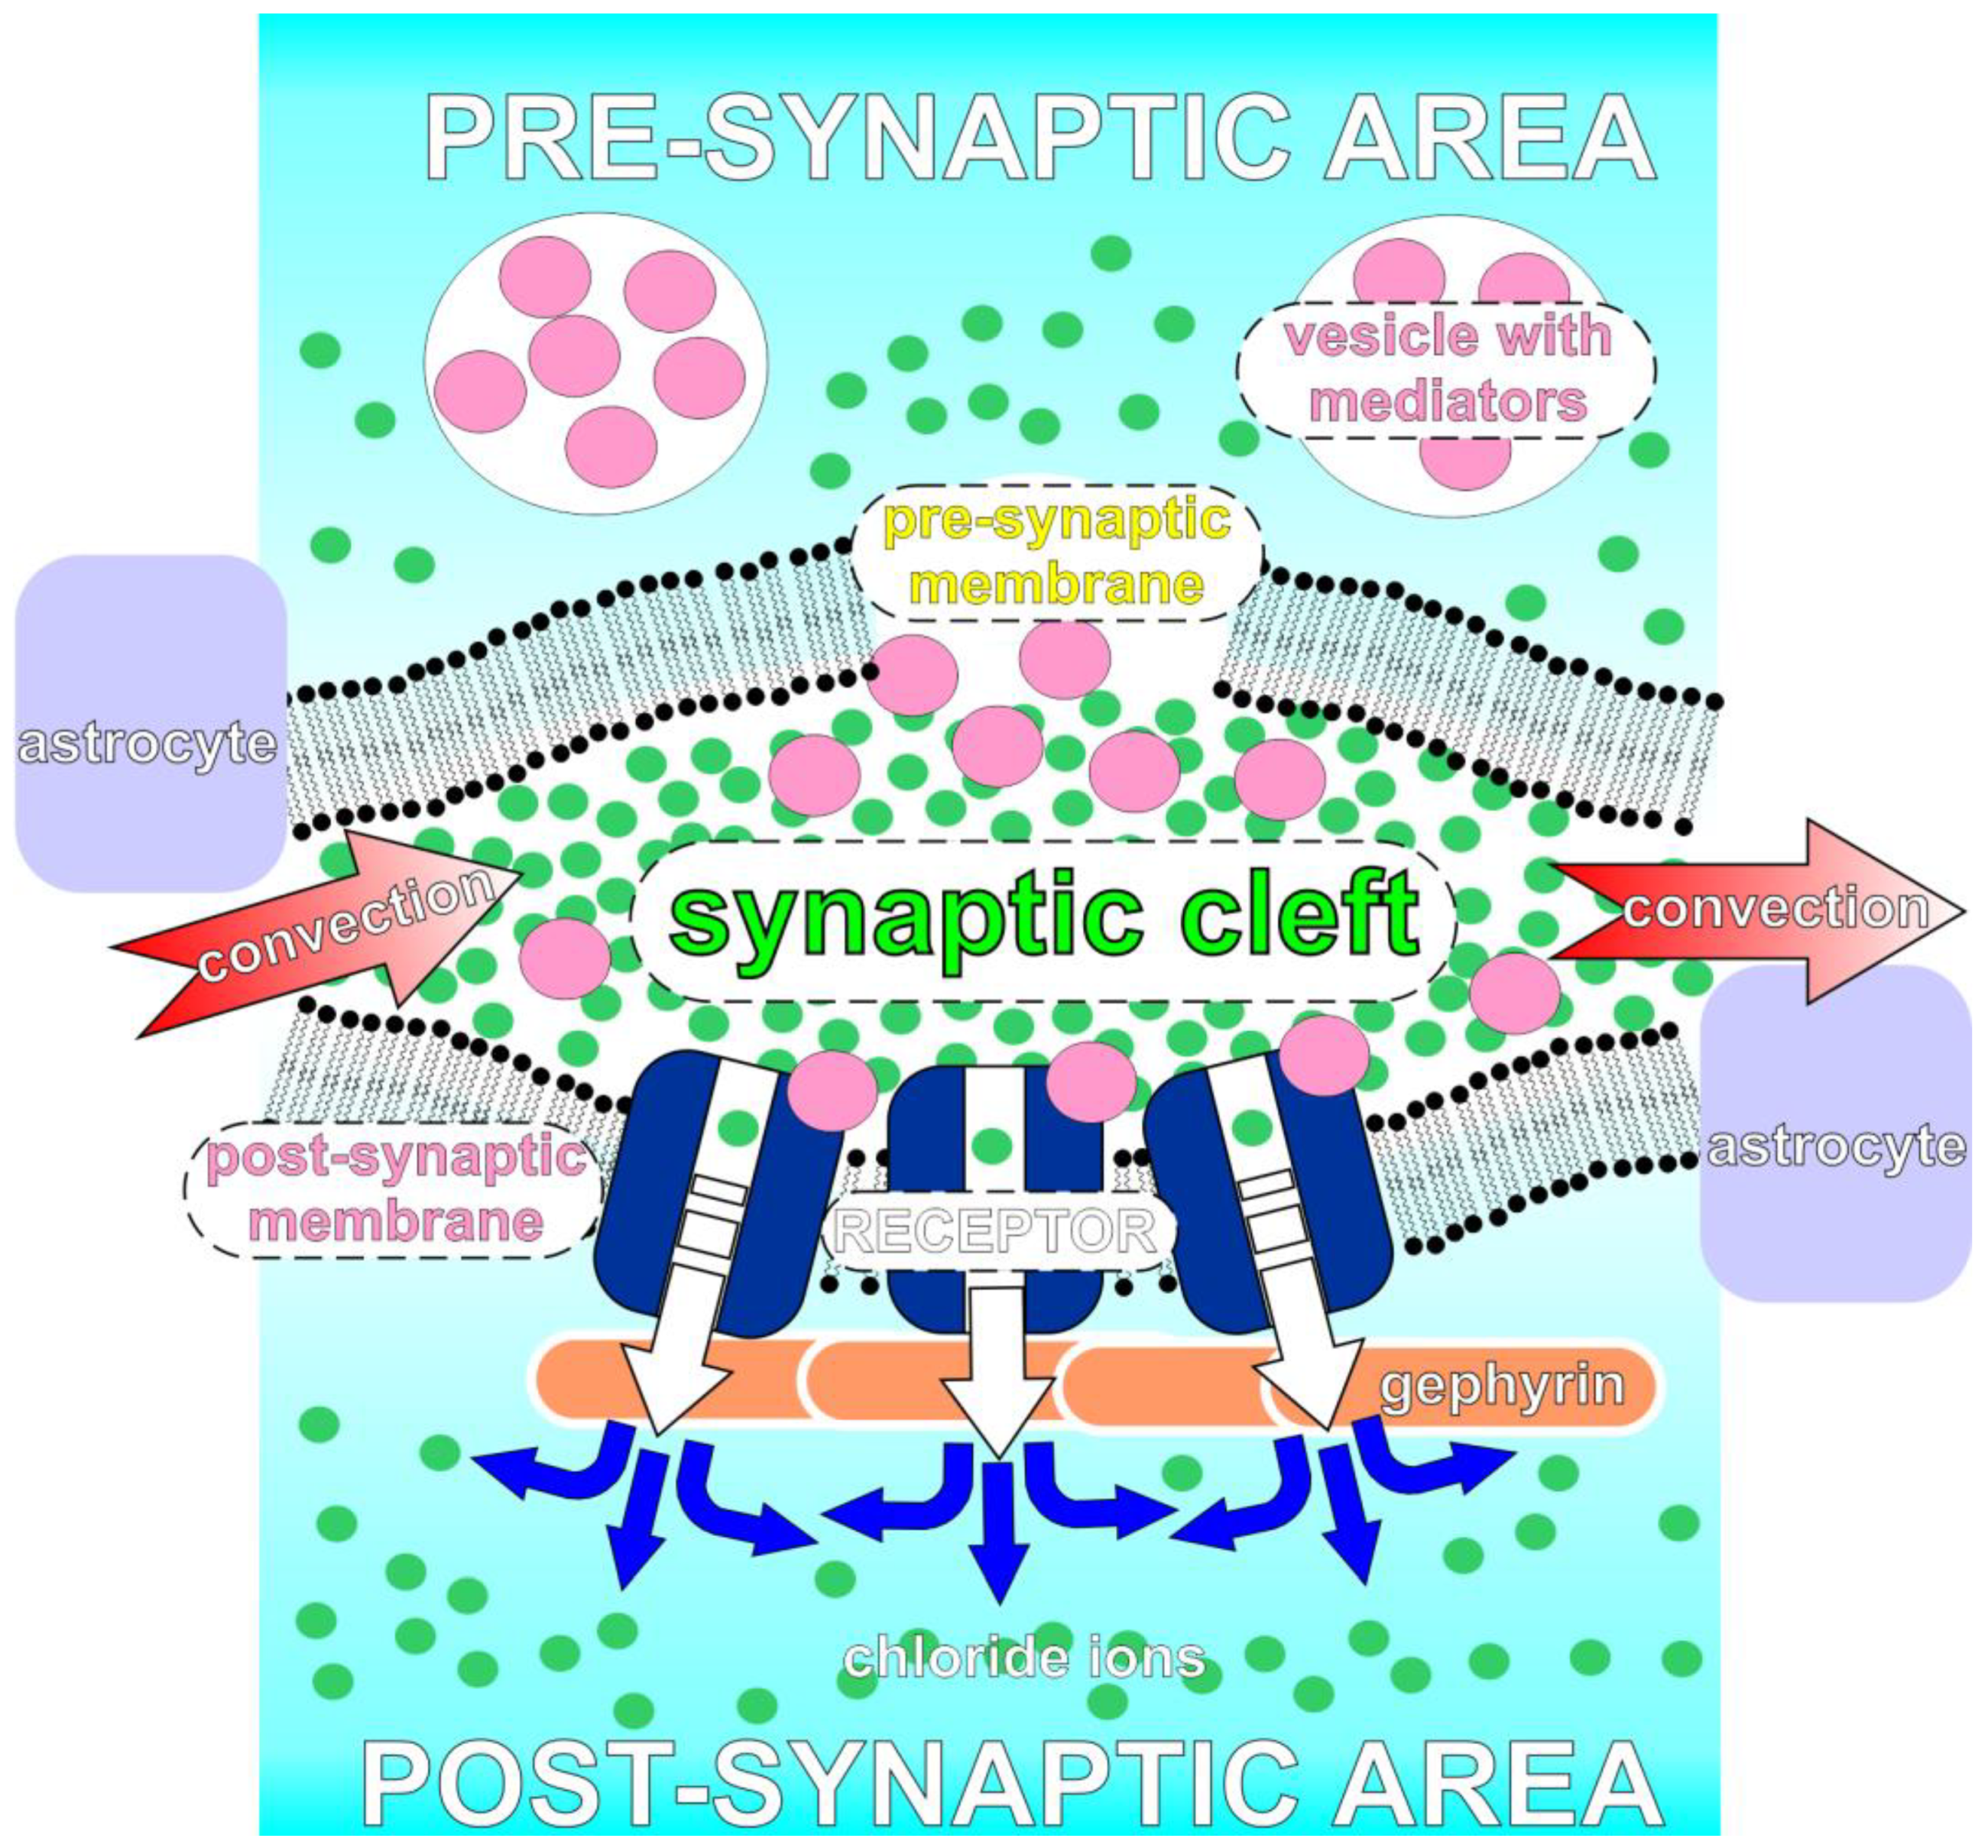
2.4. The Description of Chloride Ions Electro-Diffusion near a Post-Synaptic Membrane after GlyRs Channel Openings

The process of chloride ions diffusion away from a post-synaptic membrane is described in terms of a boundary problem for a partial differential equation including both a simple diffusion and the migration in an electric field:
c C l ( r , t ) t = J ( r , t ) J ( r , t ) = ( D C l ( , c C l ( r , t ) ) ) + z C l F u m , C l c C l ( r , t ) ( , φ ( r , t ) )
where D C l is a diffusion coefficient, F —is a Faraday constant, and z C l , u m , C l , and c C l are the charge number, mobility and concentration of chloride ions, respectively. The mobility of Cl is determined by the Nernst–Einstein relation:
u m , C l = D C l R T
where R and T are the universal gas constant and temperature, respectively. To form the model, Equation (3) is supplemented with the initial and the boundary conditions:
c C l ( r , t ) | t = t 0 = c 0 ;   c C l ( r , t ) | r Ω i n = c i n ;   ( n , J ( r , t ) ) = { J G l y R f ( t ) ,   r Ω G l y R ; J K C C 2 ( c C l ( r , t ) ) , r Ω m e m b r a n e ; 0 ,   r Ω \ ( Ω m e m b r a n e Ω G l y R Ω i n ) ;
where J G l y R ,   J K C C 2 are the fluxes mediated by the activities of GlyR and KCC2, respectively. For KCC2, the rate of chloride ion consumption can be estimated according to the Michaelis–Menten equation, and the incoming Cl gradient mediated by a single GlyR is evaluated on the base of a single channel current:
J K C C 2 = V max K C C 2 c K C C 2 c C l ( r , t ) ( K max K C C 2 + c C l ( r , t ) ) ;   J G l y R = I G l y R q C l N A π r v e s t i b u l e 2 ;
The initial concentration of chloride ions is referred to by the concentration c0. Because only a part of the neuron is the subject for consideration, it supposed that some of the inner surfaces will keep the concentration of Cl in the level of common neuron concentrations.
The values of the potential φ ( r ) is determined as the solution of the boundary problem for Poisson’s equation:
( ε 0 ε m φ ( r , t ) ) = ρ ( r ) ; φ ( r , t ) = { φ 0 + ( φ G l y R φ 0 ) f ( t ) ,   r Ω G l y R ; φ 0 ,   r ( ( Ω m e m b r a n e \ Ω s y n a p s e ) Ω i n Ω G l y R _ e m p t y ) ; n D = 0 ,   r Ω s y n a p s e ;   φ ( r , t ) | t = 0 = φ 0 ;
where φ 0 is the membrane potential on the synaptic membrane, φ G l y R is the potential on GlyR in the open state, and D is an electric displacement field. It was supposed that the largest part of the neuron membrane will have kept the potential at the level of φ 0 , and in the synaptic cleft this potential is fixed in Ω G l y R _ e m p t y , but the other places (i.e., Ω G l y R ) may change the potential according to f ( t ) . It is assumed that there is no charge directly on the surface of the synaptic membrane. Thus, the electric heterogeneity is localized in the area of the GlyRs’ possible distribution. The solution of Equation (7) will obtain the values of the inhibitory post-synaptic potentials (IPSP), which are the characteristics of a single glycinergic synapse.

2.5. Numerical Evaluation of the Model

The model described above was created using COMSOL Multiphysics ver. 5.5. The calculations have been evaluated using an Intel® Core ™ i9-7960X CPU 4.40 GHz and AMD Ryzen Threadripper 3990 × 64-Core Processor 4.3 GHz. The electric potential fields and concentration gradients were obtained using the finite element method (FEM) by applying physics-controlled fine meshes with a minimum angle between the boundaries in 240° and an elemental-size scaling factor of 0.35. Maximum and minimum element sizes were 0.13 μm and 0.00948 μm, respectively. Equation (7) was solved to generate an electric potential field, and the calculated potential was implemented into the electro-diffusion equation and initial/boundary conditions for transient simulations of the chloride ion gradients in the neuron phantom (Equations (3)–(6)). The mean calculation time was approximately 6 min for both the potential and chloride ion estimations. The spike of a glycine release in the synaptic cleft was simulated by an application of a smoothed rectangle function to the potential on GlyR (Equation (7)) and the chloride ions flux (Equation (5)). The calculations were fulfilled for 494,623 of degrees of freedom (DOF). The considered problem was approximated by the solver with a linearized problem with the Jacobian matrix, which was recalculated in each step of the numerical solution. The convergence of the FEM was checked by a variation of the mesh parameters. The results were shown to be quite stable. For instance, when the number of degrees of freedom was altered from 448,738 to 895,302 (99.5%), the observed difference was 0.15% (for a local metric) and 0.06% (for a global metric), respectively. The largest excess of a local metric was not exceeded by 0.87% for any chosen mesh and the time scale of the modelling. The time-dependence of the potential and the concentration of chloride ions was obtained in the fixed interval with a step size of 10 ms. The beginning point was 10 ms and the final one was 70 ms. The maximal amplitude of the effect was considered at 40 ms. The set of physical parameters used in the model is represented in Table 2.

3. Results

The time dynamics of the electric potential and chloride ion changes are shown in Figure 4. If the central type of cluster was considered, the spike hyperpolarized a neuron membrane in a synaptic area accompanying an essential Cl concentration increase in the cytoplasm of a neuron under the normal value of neuron polarization (i.e., φ 0 = 70   m V ). The pike concentration changes could, therefore, reach 50%. Moreover, for a hyperpolarized neuron ( φ 0 = 89   m V ) and a CC = 100% when the flux was initiated by the difference in the concentration, the amplitude may have been as high as 110% of the initial value. The response with an increasing chloride concentration near the synaptic membrane occurred at up to about half of the capacity of the cluster (CC = 59%). Nevertheless, the most changes in the chloride concentration were local. If the average concentration is analyzed, then the effect is not so pronounced (Figure 5).
The amplitude of the shift for the average concentration of chloride ions in the pike did not exceed 10% under a CC = 100%. It is remarkable that there was no difference in the response for an average neuron Cl concentration either in the type of the clusters or the value of φ 0 . This result reflects the basic property of a neuron where 100,000 to 50 million impulses could be transmitted by large nerve fibers before the concentration differences reached the point that the action potential conduction ceased [44]. Thus, it is obvious that a single spike in a single synapse does not have an influence on the global ions’ gradients on the neuron membrane.
Nevertheless, the activity of GlyRs caused a remarkable hyperpolarization of the synaptic membrane. As in the case of the Cl concentration, the amplitude of the effect depended on the capacity of the cluster. Under the depolarized state of neurons, the activation of all GlyRs in a central cluster led to a restoring of the membrane potential up to the normal value (−70 mV) (Figure 6). It is important to note that the type of cluster has an impact on the potential restoration. For example, the divided or rear GlyRs locations gave no chance of repolarizing the membrane, even under a full activation capacity. The difference in the pike potential changes under a CC = 100% was equal to 13% and 17% for the central/divided and central/rear pairs, respectively.
Due to a direct dependence between the hyperpolarization amplitude and the incoming Cl flux, the local changes in the chloride concentration were determined by the state of the neuron. Under a high φ 0 , the second summand in Equation (3) contributed essentially to decreasing the level of anions in the active area of GlyRs near the synaptic membrane (Figure 7). Under the normal condition, the Cl level was curtailed in the active zone, but it was enhanced in comparison to the background amount of chloride ions. Finally, the opening of GlyRs under the hyperpolarized state yielded a total incoming Cl flux for all types of synaptic clusters.
The most significant difference of the gradient distribution was observed between the central localization and other types of the clusters. Potential changes varied the form of the ionic gradient, and the localization of the maximum Cl concentration near the synaptic membrane depended on the value of the sectional repolarization (Figure 8).
It should be noted that the amplitude of changes in the chloride ion concentrations may have reached 80% of the initial value. Furthermore, as mentioned above under certain limited conditions, this range exceeded 100%. Nevertheless, in most cases it ranged from 40% to 55%. The dependence among the CC, membrane potential changes and the pike concentration of Cl on the synaptic membrane is represented in Figure 9.
It is easy to see that the central cluster had a more evident alteration in both the potential and the concentration than the others. Moreover, the discrepancy between the values for the different types of clusters was found to be essential. For membrane potential changes, it reached 16.7% (CC = 59%, φ 0 = 89   m V ) when the central and divided types were compared, and this contrast was as high as 31.3% (CC = 36%, φ 0 = 55   m V ) for the pair of central and rear clusters. At the same time, the largest difference in Δ φ between the divided and rear localizations of GlyRs could reach 18.8% (CC = 36%, φ 0 = 55   m V ).
The changes in the chloride ion concentrations were less pronounced. The mean differences corresponded to 2.4% and 3.1%, and the biggest differences were 4.5% and 6.1% (under a CC = 59%, φ 0 = 89   m V ) for the central/divided and central/rear pairs, respectively. Moreover, for the divided/rear pair, this parameter was less than 2% for any kind of φ 0 and CC.

4. Discussion

The gradients of chloride ions in neurons are the most intriguing aspect of the possible physiological regulation of the membrane potential. Indeed, depolarization of an excitable membrane and action potential are provided by the balance of sodium and potassium ion gradients [45], and the potential changes associated with the action potential can be directly attributed to the ion channel mechanisms, with the activity of the sodium channels defining its progression [46]. However, the anion permeability of the neural membrane helps as a key corrector of the potential value. As mentioned above, the main player in the field is considered to be a GABAA receptor [47]. The general concept that a GABA-induced chloride flux can significantly change the internal concentration of chloride ions has been proposed and supported by a number of studies. [48,49]. Currin C.B. et al. found that a continuous excitatory or inhibitory synaptic input mediated by GABAA receptors may cause sub-cellular spatial differences in the chloride ion concentration, and according to these results, shifts in the Cl intra-neuron content during a synaptic transmission can affect the input–output properties of neurons [42]. Moreover, Jedlicka et al. have shown that Cl changes can propagate beyond the site of a synaptic Cl influx and that activity at a single synapse can affect the potential mediated by GABA of adjacent synapses located within tens of μm away from the active synapse [50]. Fluctuating chloride ion levels are also expected to occur in different regions of a neuron due to differences in the proximal and distal synapses properties [51]. The basal level of chloride ions is supposed to be generally determined by CCC activity [52,53,54]. A long-time shift in the chloride ion content mediates the alteration of the GABA receptor function under a homeostatic level [55]. In many neurological disorders, such as neuropathic pain, spasticity, autism, schizophrenia and epilepsy, changes in the expression or function of Cl transporters lead to inappropriately-raised inner chloride ion concentrations with consequent disruptions of inhibitory signaling [56]. Nevertheless, even a local time-activation of GABAA receptors leads to a progressive decline in the postsynaptic response independently of the ion flux direction or KCC2 function, suggesting intraneuronal chloride build-up may not predominantly contribute to activity-dependent plasticity of GABAergic synapses under certain conditions [57]. The up–down regulation of Cl concentration is apparently a multicomponent process where different physical phenomena participate. In particular, cytoplasmic impermeant anions and polyanionic extracellular matrix glycoproteins constrain the local chloride ion concentration [58].
The obtained results yield a possibility to analyze the detailed chloride ion gradient near a synaptic membrane considering a time-dependent hyperpolarization spike provided by a GlyRs opening. The amplitude of the modelled hyperpolarization corresponds to experimentally measured values (at nearly −10 mV under GABA application [59]). Furthermore, the GlyR channels’ opening under depolarized conditions restores the membrane potential to the physiological values (nearly −70 mV) similar to what the addition of GABA induces in a multicompartment electro-diffusion model [55]. Moreover, there is one characteristic which increases the importance of the introduced approach. For the first time, explicit experimentally-defined locations of post-synaptic receptors were applied to a direct modeling of diffusion coupled with a membrane outflux mediated by transporters. The essential advantage of the introduced approach is an ability for it to be applied to different types of synapses and to be multiplied in the case of several synapses considered in 3D volume.
The most considered observations highlight the role of GABA in chloride level regulation. Our results indicated that glycine is also a participant of such a process. The GlyR-mediated changes in Cl content caused the essential fluctuation of c C l ( r , t ) during the open state of the channels even though the duration of the spike was nearly 20 ms; although, for such a short period of synaptic drive, the Cl dynamics do not typically affect the input–output function of neurons [42]. In the present study, we considered the different shape of PSD for GlyRs according to their binding to the gephyrin trimer complexes. Lying under the surface of the synaptic membrane, the lattice of gephyrins determines a possibility for GlyR to be placed on the membrane. It is remarkable that the results showed the most difference in both the potential and concentration changes between the central cluster type and the other ones. The forming IPSP could restore the membrane potential to a normal value (−70 mV) for a depolarized state of the neuron (−55 mV) under a CC = 100% and the central cluster type only. The full capacity, but a divided or rear localization of GlyRs, does not obtain an ability to reach such a value of the potential. Under the resting membrane potential of a neuron (−70 mV), the IPSP generated by the GlyRs takes about 6–7 mV, but even then, the central location produces a larger amplitude signal. One should remark that even assuming an excess of neurotransmitter release to obtain a 100% GlyR occupancy, the low probability of channel gating predicted that only 80% of glycine-bound GlyRs would open simultaneously [15]. As a result, the ISPS activation was mediated by a various number of activated receptors which could, moreover, be placed in different positions on the post-synaptic membrane. The experimentally-observed variation of the active GlyRs was quite high. In particular, the electrophysiological recordings in newborn, juvenile, and adult rat spinal cord neurons suggest the activation of as few as 7 and up to about 110 GlyRs during an average miniature inhibitory post-synaptic current (mIPSC) [37]. This means that the reply of a post-synaptic membrane crucially depends on the activation capacity of a GlyR cluster. These observations clearly indicate that the number of GlyRs in an open state will define the physiological functions of an inhibitory synapse.

5. Conclusions

In the present study, the 3D mathematical model of a neuronal bouton with a cluster localization of glycine receptors (GlyRs) on a post-synaptic membrane was established. The positions of GlyRs localization on the post-synaptic membrane were adjusted according to the structural data of multi-protein complexes of gephyrin. The binding sites and mutual distance were recognized using the protein data base outcomes. The main advantage of the created model is a combination of 3D structural data with a direct modeling of electro-diffusion near the post-synaptic membrane. The possible localization of GlyRs represented according to known spatial structures of sub-cellular protein clusters, and the transport properties of an outer neuron membrane were also taken into account. The gradients of chloride ions in a post-synaptic neuronal bouton were obtained using a diffusion equation with migration in an electric field. As well as for GABA as for the glycine activation of the receptors, it was shown that a local fluctuation of the Cl content is essential and that it can raise up to 110% of the initial level. It is essential to highlight that a spatial PSD polymorphism for GlyRs gained crucial significance to form the IPSP and chloride gradients. The central localization of GlyRs always yielded an enhanced amplitude both in the potential and the concentration.
Further development of the presented model will include considering more ions in the neuron cytoplasm to reach a more native combination and a balance of charged molecules inside. Additionally, several neighbor synapses can be considered, and the application of the frequency stimulation may be studied. The represented approach is universal, and it can be used as an algorithm for the further creation of a functional model of a post-synaptic bouton of other neuro-mediators. Moreover, the basic model of a single synaptic bouton can be multiplied and included to extend 3D models of membrane electric currents in a nervous parenchyma.

Author Contributions

Conceptualization, Y.R.N.; methodology, Y.R.N. and L.A.I.; software and numeric simulation, Y.R.N. (COMSOL) and L.A.I. (VMD); validation, Y.R.N. and L.A.I.; formal analysis, Y.R.N.; investigation, Y.R.N.; resources, Y.R.N. and L.A.I.; data curation, Y.R.N.; writing—original draft preparation, Y.R.N.; writing—review and editing, Y.R.N.; visualization, Y.R.N. and L.A.I.; supervision, Y.R.N.; project administration, Y.R.N.; funding acquisition, Y.R.N. All authors have read and agreed to the published version of the manuscript.

Funding

This research received no external funding.

Data Availability Statement

All material that could be shared is in this paper.

Acknowledgments

The authors acknowledge Elena V. Mashkovtseva for productive discussion of the neurophysiology of inhibition and a fruitful support in the searching of experimental published data. Moreover, we would like to thank Dmitry Lazarev for his assistance with technical questions in a COMSOL modelling.

Conflicts of Interest

The authors declare no conflict of interest.

Abbreviations

The following abbreviations are used in the text:
CNScentral nervous system
GlyRglycine receptor
IPSPinhibitory post-synaptic potential
GABAgamma aminobutyric acid
CCCcation-chloride co-transporter
KCC2K+Cl co-transporter type 2
PSDpostsynaptic density
ISFinterstitial fluid
ECS extracellular space
FEMfinite element method
CCcluster capacity

References

  1. Burgos, C.F.; Yevenes, G.E.; Aguayo, L.G. Structure and pharmacologic modulation of inhibitory glycine receptors. Mol. Pharmacol. 2016, 90, 318–325. [Google Scholar] [CrossRef]
  2. Dufour, A.; Tell, F.; Kessler, J.; Baude, A. Mixed GABA-glycine synapses delineate a specific topography in the nucleus tractus solitarii of adult rat. J. Physiol. 2010, 588, 1097–1115. [Google Scholar] [CrossRef] [PubMed]
  3. Ishibashi, H.; Yamaguchi, J.; Nakahata, Y.; Nabekura, J. Dynamic regulation of glycine-GABA co-transmission at spinal inhibitory synapses by neuronal glutamate transporter. J. Physiol. 2013, 591, 3821–3832. [Google Scholar] [CrossRef]
  4. Moore, L.A.; Trussell, L.O. Corelease of inhibitory neurotransmitters in the mouse auditory midbrain. J. Neurosci. 2017, 37, 9453–9464. [Google Scholar] [CrossRef] [PubMed]
  5. Delpire, E.; Staley, K.J. Novel determinants of the neuronal Cl- concentration. J. Physiol. 2014, 592, 4099–4114. [Google Scholar] [CrossRef] [PubMed]
  6. Ben-Ari, Y.; Khalilov, I.; Kahle, K.T.; Cherubini, E. The GABA excitatory/inhibitory shift in brain maturation and neurological disorders. Neuroscientist 2012, 18, 467–486. [Google Scholar] [CrossRef] [PubMed]
  7. Kaila, K.; Price, T.J.; Payne, J.A.; Puskarjov, M.; Voipio, J. Cation-chloride cotransporters in neuronal development, plasticity and disease. Nat. Rev. Neurosci. 2014, 15, 637–654. [Google Scholar] [CrossRef] [PubMed]
  8. Berndt, N.; Hoffmann, S.; Benda, J.; Holzhutter, H.-G. The influence of the chloride currents on action potential firing and volume regulation of excitable cells studied by a kinetic model. J. Theor. Biol. 2011, 276, 42–49. [Google Scholar] [CrossRef]
  9. Moore, Y.E.; Kelley, M.R.; Brandon, N.J.; Deeb, T.Z.; Moss, S.J. Seizing Control of KCC2: A New Therapeutic Target for Epilepsy. Trends Neurosci. 2017, 40, 555–571. [Google Scholar] [CrossRef]
  10. Price, T.J.; Cervero, F.; Gold, M.S.; Hammond, D.L.; Prescott, S.A. Chloride regulation in the pain pathway. Brain Res. Rev. 2009, 60, 149–170. [Google Scholar] [CrossRef]
  11. Gagnon, M.; Bergeron, M.J.; Lavertu, G.; Castonguay, A.; Tripathy, S.; Bonin, R.P.; Perez-Sanchez, J.; Boudreau, D.; Wang, B.; Dumas, L.; et al. Chloride extrusion enhancers as novel therapeutics for neurological diseases. Nat. Med. 2013, 19, 1524–1528. [Google Scholar] [CrossRef]
  12. Martin-Aragon Baudel, M.A.S.; Poole, A.V.; Darlison, M.G. Chloride co-transporters as possible therapeutic targets for stroke. J. Neurochem. 2017, 140, 195–209. [Google Scholar] [CrossRef] [PubMed]
  13. Ellender, T.J.; Raimondo, J.V.; Irkle, A.; Lamsa, K.P.; Akerman, C.J. Excitatory effects of parvalbumin-expressing interneurons maintain hippocampal epileptiform activity via synchronous afterdischarges. J. Neurosci. 2014, 34, 15208–15222. [Google Scholar] [CrossRef]
  14. Doyon, N.; Prescott, S.A.; Castonguay, A.; Godin, A.G.; Kroger, H.; de Koninck, Y. Efficacy of synaptic inhibition depends on multiple, dynamically interacting mechanisms implicated in chloride homeostasis. PLoS Comput. Biol. 2011, 7, e1002149. [Google Scholar] [CrossRef]
  15. Alvarez, F.J. Gephyrin and the regulation of synaptic strength and dynamics at glycinergic inhibitory synapses. Brain Res. Bull. 2017, 129, 55–65. [Google Scholar] [CrossRef] [PubMed]
  16. Nartsissov, Y.R. The Effect of Flux Dysconnectivity Functions on Concentration Gradients Changes in a Multicomponent Model of Convectional Reaction-Diffusion by the Example of a Neurovascular Unit. Defect Diffus. Forum 2021, 413, 19–28. [Google Scholar] [CrossRef]
  17. Nartsissov, Y.R. Application of a multicomponent model of convectional reaction-diffusion to description of glucose gradients in a neurovascular unit. Front. Physiol. 2022, 13, 1624. [Google Scholar] [CrossRef]
  18. Nicholson, C.; Phillips, J.M. Ion diffusion modified by tortuosity and volume fraction in the extracellular microenvironment of the rat cerebellum. J. Physiol. 1981, 321, 225–257. [Google Scholar] [CrossRef]
  19. Nicholson, C. Diffusion and related transport mechanisms in brain tissue. Rep. Prog. Phys. 2001, 64, 815–884. [Google Scholar] [CrossRef]
  20. Syková, E.; Nicholson, C. Diffusion in brain extracellular space. Physiol. Rev. 2008, 88, 1277–1340. [Google Scholar] [CrossRef]
  21. Thorne, R.G.; Nicholson, C. In vivo diffusion analysis with quantum dots and dextrans predicts the width of brain extracellular space. Proc. Natl. Acad. Sci. USA 2006, 103, 5567–5572. [Google Scholar] [CrossRef]
  22. Nicholson, C. Anomalous diffusion inspires anatomical insights. Biophys. J. 2015, 108, 2091–2093. [Google Scholar] [CrossRef]
  23. Nicholson, C.; Hrabětová, S. Brain Extracellular Space: The Final Frontier of Neuroscience. Biophys. J. 2017, 113, 2133–2142. [Google Scholar] [CrossRef] [PubMed]
  24. Faraji, A.H.; Rajendran, S.; Jaquins-Gerstl, A.S.; Hayes, H.J.; Richardson, R.M. Convection-Enhanced Delivery and Principles of Extracellular Transport in the Brain. World Neurosurg. 2021, 151, 163–171. [Google Scholar] [CrossRef] [PubMed]
  25. Verisokin, A.; Verveyko, D.; Kirsanov, A.; Brazhe, A.; Postnov, D. Computational Model of Noradrenaline Modulation of Astrocyte Responses to Synaptic Activity. Mathematics 2023, 11, 628. [Google Scholar] [CrossRef]
  26. Kashaju, N.; Kimathi, M.; Masanja, V.G. Modeling the Effect of Binding Kinetics in Spatial Drug Distribution in the Brain. Comput. Math. Methods Med. 2021, 2021, 5533886. [Google Scholar] [CrossRef] [PubMed]
  27. Calvetti, D.; Cheng, Y.; Somersalo, E. A spatially distributed computational model of brain cellular metabolism. J. Theor. Biol. 2015, 376, 48–65. [Google Scholar] [CrossRef]
  28. Nartsissov, Y.R. A novel algorithm of the digital nervous tissue phantom creation based on 3D Voronoi diagram application. J. Phys. Conf. Ser. 2021, 2090, 012009. [Google Scholar] [CrossRef]
  29. Rusakov, D.A.; Harrison, E.; Stewart, M.G. Synapses in hippocampus occupy only 1–2% of cell membranes and are spaced less than half-micron apart: A quantitative ultrastructural analysis with discussion of physiological implications. Neuropharmacology 1998, 37, 513–521. [Google Scholar] [CrossRef]
  30. Calamai, M.; Specht, C.G.; Heller, J.; Alcor, D.; Machado, P.; Vannier, C.; Triller, A. Gephyrin oligomerization controls GlyR mobility and synaptic clustering. J. Neurosci. 2009, 29, 7639–7648. [Google Scholar] [CrossRef]
  31. Luscher, B.; Fuchs, T.; Kilpatrick, C. GABAA Receptor Trafficking-Mediated Plasticity of Inhibitory Synapses. Neuron 2011, 70, 385–409. [Google Scholar] [CrossRef] [PubMed]
  32. Eun, Y.K.; Schrader, N.; Smolinsky, B.; Bedet, C.; Vannier, C.; Schwarz, G.; Schindelin, H. Deciphering the structural framework of glycine receptor anchoring by gephyrin. EMBO J. 2006, 25, 1385–1395. [Google Scholar] [CrossRef]
  33. Tretter, V.; Mukherjee, J.; Maric, H.-M.; Schindelin, H.; Sieghart, W.; Moss, S.J. Gephyrin, the enigmatic organizer at GABAergic synapses. Front. Cell. Neurosci. 2012, 6, 23. [Google Scholar] [CrossRef]
  34. Humphrey, W.; Dalke, A.; Schulten, K. VMD: Visual molecular dynamics. J. Mol. Graph. 1996, 14, 33–38. [Google Scholar] [CrossRef] [PubMed]
  35. Sola, M.; Kneussel, M.; Heck, I.S.; Betz, H.; Weissenhorn, W. X-ray Crystal Structure of the Trimeric N-terminal Domain of Gephyrin. J. Biol. Chem. 2001, 276, 25294–25301. [Google Scholar] [CrossRef] [PubMed]
  36. Kumar, A.; Basak, S.; Rao, S.; Gicheru, Y.; Mayer, M.L.; Sansom, M.S.P.; Chakrapani, S. Mechanisms of activation and desensitization of full-length glycine receptor in lipid nanodiscs. Nat. Commun. 2020, 11, 3752. [Google Scholar] [CrossRef]
  37. Maynard, S.A.; Rostaing, P.; Schaefer, N.; Gemin, O.; Candat, A.; Dumoulin, A.; Villmann, C.; Triller, A.; Specht, C.G. Identification of a stereotypic molecular arrangement of endogenous glycine receptors at spinal cord synapses. eLife 2021, 10, e74441. [Google Scholar] [CrossRef]
  38. Turchenkov, D.A.; Boronovsky, S.E.; Nartsissov, Y.R. Model of ion diffusion in synaptic cleft based on stochastical integration of langevin equation at dielectric friction approximation. Biophysics (Russ. Fed.) 2013, 58, 796–803. [Google Scholar] [CrossRef]
  39. Boronovsky, S.E.; Nartsissov, Y.R. Computer Simulator of Glycine Receptor Activity: A New Window into a Virtual World. Bull. Math. Biol. 2016, 78, 1380–1393. [Google Scholar] [CrossRef]
  40. Moroni, M.; Biro, I.; Giugliano, M.; Vijayan, R.; Biggin, P.C.; Beato, M.; Sivilotti, L.G. Chloride ions in the pore of glycine and GABA channels shape the time course and voltage dependence of agonist currents. J. Neurosci. 2011, 31, 14095–14106. [Google Scholar] [CrossRef]
  41. Williams, J.R.; Payne, J.A. Cation transport by the neuronal K+-Cl- cotransporter KCC2: Thermodynamics and kinetics of alternate transport modes. Am. J. Physiol.-Cell Physiol. 2004, 287, C919–C931. [Google Scholar] [CrossRef] [PubMed]
  42. Currin, C.B.; Trevelyan, A.J.; Akerman, C.J.; Raimondo, J.V. Chloride dynamics alter the input-output properties of neurons. PLoS Comput. Biol. 2020, 16, e1007932. [Google Scholar] [CrossRef]
  43. Mercado, A.; Gamba, G.; Mount, D.B. Molecular physiology of mammalian K+-CL- cotransporters. Adv. Exp. Med. Biol. 2005, 559, 29–41. [Google Scholar] [CrossRef]
  44. Hall, J.E.; Hall, M.E. Guyton and Hall Textbook of Medical Physiology, 11th ed.; Elsevier: Amsterdam, The Netherlands, 2012; p. 1112. [Google Scholar]
  45. Kress, G.J.; Mennerick, S. Action potential initiation and propagation: Upstream influences on neurotransmission. Neuroscience 2009, 158, 211–222. [Google Scholar] [CrossRef]
  46. Johnson, A.S.; Winlow, W. The soliton and the action potential—Primary elements underlying sentience. Front. Physiol. 2018, 9, 779. [Google Scholar] [CrossRef]
  47. Avoli, M.; Krnjević, K. The Long and Winding Road to Gamma-Amino-Butyric Acid as Neurotransmitter. Can. J. Neurol. Sci. 2015, 43, 219–226. [Google Scholar] [CrossRef] [PubMed]
  48. Isomura, Y.; Sugimoto, M.; Fujiwara-Tsukamoto, Y.; Yamamoto-Muraki, S.; Yamada, J.; Fukuda, A. Synaptically activated Cl- accumulation responsible for depolarizing GABAergic responses in mature hippocampal neurons. J. Neurophysiol. 2003, 90, 2752–2756. [Google Scholar] [CrossRef]
  49. Berglund, K.; Schleich, W.; Wang, H.; Feng, G.; Hall, W.C.; Kuner, T.; Augustine, G.J. Imaging synaptic inhibition throughout the brain via genetically targeted Clomeleon. Brain Cell Biol. 2008, 36, 101–118. [Google Scholar] [CrossRef]
  50. Jedlicka, P.; Deller, T.; Gutkin, B.S.; Backus, K.H. Activity-dependent intracellular chloride accumulation and diffusion controls GABA A receptor-mediated synaptic transmission. Hippocampus 2011, 21, 885–898. [Google Scholar] [CrossRef]
  51. Williams, S.R.; Stuart, G.J. Role of dendritic synapse location in the control of action potential output. Trends Neurosci. 2003, 26, 147–154. [Google Scholar] [CrossRef]
  52. Deisz, R.A.; Lehmann, T.N.; Horn, P.; Dehnicke, C.; Nitsch, R. Components of neuronal chloride transport in rat and human neocortex. J. Physiol. 2011, 589, 1317–1347. [Google Scholar] [CrossRef] [PubMed]
  53. Chamma, I.; Chevy, Q.; Poncer, J.C.; Levi, S. Role of the neuronal K-Cl co-transporter KCC2 in inhibitory and excitatory neurotransmission. Front. Cell. Neurosci. 2012, 6, 5. [Google Scholar] [CrossRef] [PubMed]
  54. Hartmann, A.M.; Nothwang, H.G. NKCC1 and KCC2: Structural insights into phospho-regulation. Front. Mol. Neurosci. 2022, 15, 964488. [Google Scholar] [CrossRef]
  55. Doyon, N.; Vinay, L.; Prescott, S.A.; De Koninck, Y. Chloride Regulation: A Dynamic Equilibrium Crucial for Synaptic Inhibition. Neuron 2016, 89, 1157–1172. [Google Scholar] [CrossRef]
  56. Raimondo, J.V.; Richards, B.A.; Woodin, M.A. Neuronal chloride and excitability—The big impact of small changes. Curr. Opin. Neurobiol. 2017, 43, 35–42. [Google Scholar] [CrossRef]
  57. Otsu, Y.; Donneger, F.; Schwartz, E.J.; Poncer, J.C. Cation–chloride cotransporters and the polarity of GABA signalling in mouse hippocampal parvalbumin interneurons. J. Physiol. 2020, 598, 1865–1880. [Google Scholar] [CrossRef] [PubMed]
  58. Glykys, J.; Dzhala, V.; Egawa, K.; Balena, T.; Saponjian, Y.; Kuchibhotla, K.V.; Bacskai, B.J.; Kahle, K.T.; Zeuthen, T.; Staley, K.J. Local impermeant anions establish the neuronal chloride concentration. Science 2014, 343, 670–675. [Google Scholar] [CrossRef]
  59. Staley, K.J.; Proctor, W.R. Modulation of mammalian dendritic GABA(A) receptor function by the kinetics of Cl- and HCO3- transport. J. Physiol. 1999, 519, 693–712. [Google Scholar] [CrossRef]
Figure 1. A scheme of an inhibitory neurotransmission in a neuronal synapse. A pre-synaptic area is filled up with vesicles containing neuromediators (e.g., GABA or glycine). The release of the mediators (light magenta circles) into a synaptic cleft causes further diffusion to the post-synaptic membrane. The synaptic cleft is surrounded by astrocyte processes which prevent free diffusion and convection (red arrows). After the mediator binds to the specific receptors (GABAA or GlyR), the selective anion channels turn to be in an open state initiating chloride ion (green circles) conductivity. The chloride ions pass through the membrane and form the gradient in a post-synaptic neuronal bouton.
Mathematics 11 02499 g001
Figure 2. The scheme of a virtual phantom for the glycinergic synaptic cleft. (a) Indication of pre- and post-synaptic neurons area ( Ω f i n a l ) and surrounding area linked to the part of the main astrocyte (indicated in blue, Ω a s t r o c y t e ); (b) the phantom of ISF ( Ω I S F ). This area is connected to other space in the brain parenchyma by processes of convectional diffusion. It should be combined with the phantom of the cleft; (c) the post-synaptic area of the neuron. This space will be used for further modeling of electrical diffusion of chloride ions; (d) the indication of different boundaries on the phantom where the conditions for electro-diffusion and electric potential can be specified. The area placed to the outer space is indicated as Ω m e m b r a n e . The surfaces faced to the cytoplasm of neurons are noted as Ω i n . Finally, the area where the permeability for chloride ions is assumed to be negligible despite a direct conductivity through GlyRs is marked as Ω f l u x = 0 .
Mathematics 11 02499 g002
Figure 3. The lattice formed by the gephyrin trimers. (a) A single complex of six trimers connected in a hexagonal cage. A hexagonal cell was constructed using the VMD program [34]. The X-ray crystallography structure of the G-domain (PDB ID: 1IHC) [35] and E-domain (PDB ID: 2FTS) [32] were taken as a basis. The size of the cell’s lateral edge was 17.62 Å, and the site of interaction with GlyR was located approximately in the middle of the edge. To assess the mutual arrangement of glycine receptors on the faces of the gephyrin cell, the Cryo-EM structure of GlyR (PDB ID: 6UBS) was used [36]; (b) an extended, formalized lattice mimicking the spatial geometry of gephyrin positions and GlyR contacts. Each vertex corresponds to the trimer contact of G-domains. The vertexes in the middle-edge positions indicate the possible center for GlyRs binding. This lattice has been placed under the surface of a post-synaptic membrane to be used for the background of the GlyR cluster forming; (c) the types of the considered GlyR clusters. According to experimental data, the maximal number of positions where GlyRs are able to be placed in the used phantom is equal to 189; however, the shape of PSD may be different. Here, there are three types to be specified. When all GlyRs occupy the central area, the cluster is named “central”. If the PSD is shared on several groups not far from the center, the cluster is specified as “divided”. Finally, under the condition when the receptors are placed nearly at the border of the synaptic membrane, this cluster will be considered as “rear”. The number of GlyRs inside any cluster can be varied. Thus, the characteristics of the cluster are both the spatial position and the number of receptors in the location.
Mathematics 11 02499 g003
Figure 4. The time dynamic of the electric potential and chloride ion concentration near the synaptic membrane. The temporal scale comprises three points where the changes are the most significant. The images are represented on the surface created at the base of the body points and are shifted collinearly to the synapse.
Mathematics 11 02499 g004
Figure 5. The time dependence of an average concentration of Cl in the neuron. The represented result was obtained under φ 0 = 70   m V and the central cluster. The curves correspond to the different CC. Another value of φ 0 or the form of clusters yield the same time-dependences both in the shape and amplitude.
Mathematics 11 02499 g005
Figure 6. The time-dependence of the synaptic membrane hyperpolarization IPSP by activation of GlyRs. The data are represented for three types of clusters for a depolarized neuron ( φ 0 = 55   m V ).
Mathematics 11 02499 g006
Figure 7. The changes of local chloride ion concentrations for different types of clusters. The changes under consideration are represented at t = 40 ms, and CC is 59%.
Mathematics 11 02499 g007
Figure 8. The influence of the cluster types on the repolarization potential and a chloride gradient forming. The potential changes of IPSP are represented as Δ φ = φ ( r , t ) φ 0 .
Mathematics 11 02499 g008
Figure 9. The diagrams for potential and concentration changes for different types of clusters. The concentration is represented as an average value for the synaptic surface ( Ω s y n a p s e ) at the fixed moment of time. The results are represented in t = 40 ms.
Mathematics 11 02499 g009
Table 1. The set of 3D objects used for the phantom creation. The considered solid geometrical shapes are suitable to be used for the modelling of other synaptic types. The main differences will be observed in the metric parameters of bodies, but the general set of objects remains the same.
The ObjectDescriptionComments
Ω 1 The first 3D body chosen from the Voronoi diagram. This object can be chosen fluently.
Ω 2 The second 3D body chosen from the Voronoi diagram.This object is selected as a close neighbor of Ω 1 .
Ω u p p e r The first ellipsoid included in the synapse phantom.The shape of the object is determined by the experimental data 1.
Ω l o w e r The second ellipsoid included in the synapse phantom.(see above).
Ω c y l i n d e r The central part of the synaptic phantom.(see above).
Ω f i n a l The final form of pre- and post-synaptic boutons with embedded track of the synaptic phantom.The object consists of two bodies which can be used separately in the modelling.
Ω a s t r o c y t e The phantom of an astrocyte part lies near to the synaptic area. The object includes the part of an astrocyte and a small geometrical shape (“claws”) surrounding the synaptic area.
Ω e l l i p s o i d An ellipsoid used for indication of the considering borders of ISF.The object has a free type of the geometrical parameters with a common restriction 2.
Ω I S F The final complex shape of the area contains the space between Ω f i n a l and Ω a s t r o c y t e .The object includes the properties of the interstitial fluid, and it determines the ranges of membrane surfaces.
Ω p o s t s y n a p s e A part of Ω f i n a l corresponds to a post-synaptic neuronal bouton. This object is obtained by omitting all surrounding and connecting bodies.
Ω m e m b r a n e The surface corresponds to the plasmatic membrane of a neuron.This complex surface has the properties of the outer neuron membrane. In the considered model it is defined for a post-synaptic bouton.
Ω i n The surface separates the parts of a neuron. In the model there is a border which confines the inner space of consideration. One surface is related with the outer neuronal membrane (see above) and another one divides the neuron localizing the post-synaptic bouton.
Ω G l y R The area on the post-synaptic membrane where GlyRs are supposed to be placed. The place for possible GlyR localizations is indicated in Figure 3. Somewhere in the set of total locations the receptors can really exist. These locations are united by the indicated term.
Ω G l y R _ e m p t y The area on the post-synaptic membrane, which is suitable for GlyRs placing, but this location contains no receptors. As it was described above, there is an area where GlyRs may be localized but this location is not occupied by the receptors.
1 A union of the three primitives forms the shape of a synaptic cleft which will be embedded into the Ω 1 and Ω 2 forming the spaces of pre-synaptic and post-synaptic membranes. It is very essential that the synapse is not considered as a simple plane surface, but it has a lacune where the mediators can diffuse. 2 The size of the object is adjusted according to the principle: Ω e l l i p s o i d \ ( Ω f i n a l Ω a s t r o c y t e ) .
Table 2. The physical parameters which were used during the modelling.
The ParameterDescriptionValueSource
D C l Diffusion coefficient of Cl2.03 × 10−9 m2/s[38]
I G l y R Current of a single GlyR channel4.5 pA[39]
σ G l y R Conductivity of a single GlyR47.3 pS[40]
q C l Elementary charge of Cl−1.6 × 10⁻¹⁹ CTabulated value
N A Avogadro constant6.022 × 1023 mol−1Tabulated value
ε 0 Vacuum permittivity8.854 × 10−12 F⋅m−1Tabulated value
z C l Cl charge number−1Tabulated value
F Faraday constant9.649 × 104 C⋅mol−1Tabulated value
R Universal gas constant8.31 J⋅K−1⋅mol−1Tabulated value
T Temperature37 °CThe temperature of a living tissue
φ G l y R The potential generated by a GlyR single channel−95.1 mVCalculated value
φ 0 The membrane potential on the synaptic membrane−55 mV
−70 mV
−89 mV
A variated parameter corresponding to the inside neuron conditions
ε m Relative permittivity of the medium at 37 °C72.91Tabulated value
V max K C C 2 Maximal rate of KCC2 transport17.5 nmol/mg/min[41]
c K C C 2 The level of KCC23.78 g/m2Calculated on the base of [42]
K max K C C 2 Affinity of KCC2 to chloride6.8 mM[43]
r v e s t i b u l e Radius of the GlyR inside vestibule1.25 nmCalculated on the base of pdb structures
r s y n a p s e Radius of the GlyR synapse130 nm[37]
Disclaimer/Publisher’s Note: The statements, opinions and data contained in all publications are solely those of the individual author(s) and contributor(s) and not of MDPI and/or the editor(s). MDPI and/or the editor(s) disclaim responsibility for any injury to people or property resulting from any ideas, methods, instructions or products referred to in the content.

