Article

Robust Evaluation and Comparison of EEG Source Localization Algorithms for Accurate Reconstruction of Deep Cortical Activity

1
Research Institute of Intelligent and Complex Systems, Fudan University, Shanghai 200433, China
2
State Key Laboratory of Medical Neurobiology, Fudan University, Shanghai 200433, China
3
MOE Frontiers Center for Brain Science, Fudan University, Shanghai 200433, China
4
Institutes of Brain Science, Fudan University, Shanghai 200433, China
5
Institute of Science and Technology for Brain-Inspired Intelligence, Fudan University, Shanghai 200433, China
6
Shanghai Artificial Intelligence Laboratory, Shanghai 200232, China
*
Author to whom correspondence should be addressed.
Mathematics 2023, 11(11), 2450; https://doi.org/10.3390/math11112450
Submission received: 20 April 2023 / Revised: 19 May 2023 / Accepted: 22 May 2023 / Published: 25 May 2023
(This article belongs to the Special Issue Mathematical and Computational Neuroscience)

Abstract

:
Accurately reconstructing deep cortical source activity from EEG recordings is essential for understanding cognitive processes. However, currently, there is a lack of reliable methods for assessing the performance of EEG source localization algorithms. This study establishes an algorithm evaluation framework, utilizing realistic human head models and simulated EEG source signals with spatial propagations. We compare the performance of several newly proposed Bayesian algorithms, including full Dugh, thin Dugh, and Mackay, against classical methods such as MN and eLORETA. Our results, which are based on 630 Monte Carlo simulations, demonstrate that thin Dugh and Mackay are mathematically sound and perform significantly better in spatial and temporal source reconstruction than classical algorithms. Mackay is less robust spatially, while thin Dugh performs best overall. Conversely, we show that full Dugh has significant theoretical flaws that negatively impact localization accuracy. This research highlights the advantages and limitations of various source localization algorithms, providing valuable insights for future development and refinement in EEG source localization methods.
MSC:
92-04; 92-10; 92C05; 92C55; 94A12

1. Introduction

The electroencephalogram (EEG) is a non-invasive neuroimaging technique used to measure electric potential fluctuations in the human brain by strategically placing recording electrodes on the scalp. This method is highly regarded for its precise temporal resolution, as modern recording systems can achieve sampling rates greater than 1000 Hz [1]. Additionally, EEG is cost-effective and requires a relatively minimal measurement environment. By analyzing EEG signals, researchers can explore electrical activity patterns in the brain, including information transmission and synchronization among neuron populations. This investigation of EEG signals also provides valuable insights into the manifestation of specific brain disorders in different regions of the brain [1,2,3,4,5,6].
However, EEG has a drawback in terms of its spatial resolution, mainly due to current technological limitations. The most spatially resolved EEG datasets that are currently available consist of only 256 electrodes placed across the entire scalp [7]. Furthermore, research indicates that the main physiological generators of EEG are the postsynaptic potentials (PSPs) produced by macrocolumns, which are composed of tens of thousands of pyramidal cortical neurons that activate synchronously [8]. As a result, the signals captured by EEG electrodes often represent obscured projections of neural activities originating from deep sources within the cerebral cortex [7].
To enhance the spatial resolution of EEG while preserving its high temporal resolution, researchers have developed a technique called EEG source localization, also known as electrical source imaging (ESI). This method focuses on identifying the electrical sources responsible for specific EEG waves and estimating their temporal activities [7]. Accurately determining the sources of functional brain activity is crucial for understanding the underlying mechanisms of cognitive processes and identifying the origins of cognitive impairments related to different brain disorders [9,10].
EEG source localization is the process of estimating the electrical activity based on EEG signals recorded from the scalp. Typically, this is accomplished by using a linear regression model, which is commonly represented as [11,12]:
Y = L X + E ,  
where L M × N is the lead field matrix mapping a set of EEG source components X N × T to the recorded EEG Y M × T . The term E M × T represents noise, while M , N and T denote the number of electrodes, sources and time samples, respectively. It is important to note that for the frequency range of signals measured in EEG, no charge accumulation occurs in the conducting extracellular volume, hence time delay effects are not necessary to consider. This assumption is known as the quasi-static approximation [13]. Typically, EEG noise is assumed to be additive; however, there are also studies that address the presence of possible multiplicative noises in EEG signals [14].
The EEG source localization’s linear regression model has many similarities with the EEG compressed sensing (CS) approaches [15]. EEG CS aims to preserve the important information contained in the EEG data while sub-sampling and compressing them. To accomplish this goal, it is necessary to employ reliable techniques for compressing high-dimensional input data (corresponding to X ) into low-dimensional data (corresponding to Y ) and restoring the low-dimensional data back to high-dimensional data. However, CS assumes that the high dimensional input data are sparse, with only a few non-zero entries at each time sample. Unfortunately, this is typically not the case for EEG sources, so the methodologies used by compressed sensing and source localization techniques share very little common ground.
EEG source localization consists of two main steps. In the first step, known as the “forward problem”, the electrical and geometrical relationships between the brain activity sources and EEG signals are established using the lead field matrix L . This step involves determining the scalp potentials generated by any given source [13]. To accurately model head tissues, subject-specific structural magnetic resonance imaging (MRI) data are commonly utilized. The lead field matrix L is computed based on the electrode positions on the scalp and the conductivities of different tissues, including the scalp, skull, grey matter, and cerebrospinal fluid (CSF), and others.
The second step of the EEG source localization is referred to as the “inverse problem”. It involves applying an EEG source localization algorithm to estimate the brain source activities (represented as X or X ^ ) that correspond as accurately as possible to the measured EEG data. The estimation of brain source activities takes into consideration the lead field matrix L , and the properties of electrode noise are expressed in E . However, the inverse problem is considered ill-posed due to a substantial disparity between the number of electrodes (typically, 64 to 256) and the number of source components (104 to 105 minimally) [16,17]. Consequently, additional prior knowledge about the sources is necessary to obtain a solution [18]. Various algorithms for EEG source localization have been developed, incorporating different priors and solution constraints. However, it remains challenging to determine the most effective or necessary set of priors, and many algorithms involve hyperparameters that cannot be updated, making them susceptible to subjective settings [16,18]. Furthermore, a reliable method to evaluate the performance of source recovery does not exist, leading to the limited interpretability of the solutions generated by different algorithms.
Recently, there have been advancements in learning algorithms for EEG source localization, including full Dugh, thin Dugh, and Mackay. These state-of-the-art algorithms utilize empirical Bayesian frameworks with fully updatable parameters, which give them an advantage over the theoretical designs of classical algorithms [10,11].
Both the full Dugh and thin Dugh algorithms integrate spatiotemporal dynamics by incorporating temporal covariance in their Type-II Maximum Likelihood (ML) estimation Bayesian learning processes [11]. These algorithms separate the spatial and temporal covariance of the EEG source and noise by assuming that neuronal sources from different brain regions exhibit similar autocorrelation spectra. The main distinction between the two algorithms lies in the treatment of temporal dynamics. Thin Dugh imposes a first-order auto-regressive (AR(1)) restriction on the temporal dynamics, while full Dugh does not, making it more suitable for a range of EEG measuring environments. On the other hand, Mackay utilizes a similar empirical Bayesian framework to the Dugh algorithms but does not incorporate temporal covariance [10]. Instead, it introduces new updated rules for parameter learning within the empirical Bayesian framework, resulting in a significantly faster convergence rate compared to classical expectation maximization (EM) update approaches.
Although full Dugh, thin Dugh, and Mackay assert their superiority over classical source localization algorithms [11], their capability to accurately estimate source activity has not been thoroughly validated. This study addresses this gap by conducting a comprehensive mathematical analysis of the methodologies employed by these algorithms. Additionally, a new simulation framework is developed to generate EEG source activity with varying locations and frequencies. The performance of these algorithms is thoroughly evaluated in terms of their ability to reconstruct EEG sources with spatiotemporal accuracy. Based on substantial evidence, the study identifies the best algorithm among them. The findings of this research offer valuable insights for researchers and practitioners in EEG source localization.
The remaining sections of the paper are structured as follows. Section 2 provides an overview of our simulation and evaluation framework, including the choice of classical benchmark algorithms for comparison, the utilization of a realistic human head model used in the simulations, and the evaluation metrics employed to assess the performance of the algorithms. In Section 3, we conduct a mathematical analysis to validate the Bayesian algorithms and present the results of our simulations. Lastly, Section 4 offers a comprehensive analysis of our findings and draws conclusions based on the outcomes of our study.

2. Materials and Methods

2.1. Algorithms for Evaluation

To evaluate the performance of the newly proposed Bayesian algorithms in EEG source localization and reconstruction, we conduct a comparison with two well-established classical benchmark algorithms: BST-MN [19] and eLORETA [20].
The BST-MN or minimum norm imaging algorithm is implemented in the Brainstorm (BST) software (Version 3.230210) [17,19]. The minimum norm solution to the ill-posed EEG inverse problem is the one that best fits the EEG data with a minimum overall amplitude of brain activity. It utilizes a depth weighting of 0.5 with a maximum amount of 10, as set by default in the software. It also assumes diagonal noise covariance, treating each EEG noise component as spatially independent.
On the other hand, eLORETA (exact low-resolution brain electromagnetic tomography) further applies weighting for different sources and adopts regularization in its search for the most appropriate weighted minimum norm solution [20]. For eLORETA, we employ a weighted L2-norm minimization with 5% regularization [11].
These benchmark algorithms are chosen for their widespread acceptance and usage in the field.
Additionally, for the three Bayesian algorithms, we establish a stringent criterion for convergence, requiring that the relative change in the estimated source time series matrix X ^ (measured using the Frobenius norm) between subsequent iterations be less than 10−10. The Frobenius norm of a matrix is computed as the square root of the sum of the absolute squares of all its elements. It is particularly helpful in comparing the element-wise differences of two same-size matrices quantitively. This convergence criterion is more stringent than the one used in the original algorithm design and corresponds to a change of approximately 0.1% of the X ^ Frobenius norm in practice [11]. If convergence is not achieved within a maximum of 1000 iterations, the algorithm stops. Our objective is to conduct a thorough comparison of the strengths and weaknesses of these algorithms in EEG source localization, with the ultimate goal of identifying the most promising method for future research endeavors.

2.2. Simulation Model for Algorithm Evaluation

In our simulation framework, we employ a realistic human head model derived from the processed T1-weighted structural MRI of a healthy human subject [21]. To model the tissue meshes within the head volume and solve the “forward problem”, we adopt the partial integration approach of the continuous Galerkin finite element method (CG-FEM). This process is performed using the Brainstorm software (Version 3.230210) [19] using DUNEuro-SimNIBS functions [22,23,24]. The choice of the DUNEuro function is based on its high efficiency and the specific definition it provides for the reference electrode, addressing the common challenges associated with different EEG re-referencing settings [25]. For generating the highest-quality FEM mesh available within the Brainstorm software (Version 3.230210), we select the SimNIBS function. The resulting biological tissue model within the head volume comprises a mesh consisting of 4,005,524 tetrahedral 3D elements. The tissue conductivities of gray matter, white matter, CSF, scalp, and skull are set to 0.53 S/m, 0.31 S/m, 2.14 S/m, 288 mS/m, and 5.5 mS/m, respectively. These conductivity values are based on the most recent in vivo experimental recordings [26,27,28].
In the absence of correspondent diffusion tensor imaging (DTI) or diffusion-weighted imaging (DWI) data, we estimate white matter anisotropy based on its structure. We assume a longitudinal/transversal anisotropy ratio of 10:1, with volume constraint [29]. Additionally, we exclude skull tissue anisotropy in the model due to its negative influence on EEG source localization accuracy [29].
In the absence of correspondent diffusion tensor imaging (DTI) or diffusion-weighted imaging (DWI) data, we incorporate white matter anisotropy estimation within the head volume model. We assume a longitudinal/transversal anisotropy ratio of 10:1, with a volume constraint [28]. However, we exclude skull tissue anisotropy from the model due to its detrimental impact on EEG source localization accuracy [28].
During the CG-FEM process, we also extract the cortical surface and define the cortex surface mesh at a resolution of 0.5 vertices/mm2. The EEG source space is defined as the cortical surface and is represented by a mesh consisting of 30,003 surface triangular elements. The average spacing between these elements is 1.8 mm. In our modeling, we assume that the orientations of EEG sources are normal (perpendicular) to the cortical surface. This is supported by evidence indicating that the primary generators of EEG signals are macrocolumns of neuronal populations, with their dendritic trunks pointing in a perpendicular direction to the cortical surface [17].
In our simulations, we utilize a total of 321 electrodes placed on the scalp according to the 10-5 EEG scalp electrode system, all of which are positioned above the plane formed by the “Nasion−Left Ear−Right Ear” fiducials. The electrode positions are projected onto the scalp and validated through MRI registration, as shown in Figure 1b. The reference electrode is designated as electrode Cz.
The generated lead field matrix L is a matrix of size 321 × 30 , 003 (unit: V/(A·m)). It is computed with DUNEuro by solving the scalp potential at every sensor location from any given source. This lead field matrix serves as a representation of the universal realistic human head model that we employ throughout our simulations.

2.3. Generation of Simulated Source and EEG Signals

To investigate the relationship between the components received by scalp electrodes and the EEG source activities, we conducted simulations involving the activation of a single source with sinewave fluctuations at a randomly chosen cortical position. We analyzed the amplitudes recorded at different scalp electrode positions. The sinewave fluctuation of the single source has a randomly set initial phase and an amplitude of 10 nA·m, which corresponds to physiological conditions [17]. We control the frequency of the sinewave fluctuation while placing the single source at different cortical positions. We then compare the recorded scalp potential amplitudes against the Euclidean distance between the source and electrodes. This approach enables us to illustrate how EEG source activities of different brain locations and frequencies propagate and manifest in the scalp EEG recordings.
Next, to evaluate different EEG source localization algorithms, we simulate bi-hemisphere cortical activations with strong sinusoidal oscillations. We first set two sinusoidal waves with frequencies of 20 Hz and 45 Hz, respectively, at two randomly selected “seed” positions in the source space. The sinusoidal waves have random initial phases and an amplitude of 10 nAm, consistent with physiological conditions [17]. The sampling frequency is set to 200 Hz, and the number of time samples set to 400 (2 s). Then, all sources in the source space receive a superposition of the two spatially propagated components:
i = 1 2 10 × exp ( d i λ ) × sin ( 2 π × f i × t 200 + φ i ) ( nA × m ) ,  
where d i denotes the spatial distance between source position and seed position, the spatial propagation constant λ = 3   mm , our chosen seed frequencies f i = { 20 ,   45 }   ( Hz ) , the random initial phase φ i ( 0 ,   2 π ) , and time sampling t = [ 1 ,   ,   400 ] .
By following this “dual-seed” approach, we were able to simulate non-periodic temporal fluctuations for all 30,003 sources, which accurately reflects the physiological reality of EEG signals. To further align with physiological constraints, we set any instantaneous source component with an absolute value of less than 200 fA·m as zero [30]. We aim to stand out from peer researchers who only employ a single-frequency EEG source activity throughout the entire source space [31,32] and achieve a methodological breakthrough in incorporating non-periodic EEG source temporal fluctuations.
Moreover, we believe that generally high-frequency EEG signals have low-amplitudes, while low-frequency EEG signals have high amplitudes. Additionally, physiological EEG signals mainly fall within the frequency range of 0.1 Hz to 100 Hz [33,34]. Therefore, in order to simulate human cortical activity more closely in line with electrophysiological reality, we lastly employ more complex cortical activations. We designate three random “seed” positions superimposed with multiple frequencies, as specified in Table 1. Afterwards, all 30,003 sources are subjected to spatial propagation by the seeds with exponential decay, similar to the process described in Equation (2). To align with physiological constraints, we continue to set any instantaneous source component with an absolute value of less than 200 fA·m as zero [30].The sampling rate was set to 140 Hz, and the signal duration was uniformly set to 6 s (i.e., 840 time samples). We then place the three seeds in deep brain regions (with a minimum distance of d > 70 mm from the EEG cortical source to the scalp electrodes), middle-depth brain regions (35 mm < d < 55 mm), and superficial brain regions (d < 20 mm). Under this more complex and realistic EEG simulation framework, we could investigate the spatiotemporal accuracy of algorithms upon EEG sources with varying depths.
In every case described above, we generate a simulated source time series matrix X of size 30 , 003 × 400 (unit: A·m). This matrix X represents the temporal activities of the simulated brain sources. To simulate the corresponding EEG signal, we project X through lead field matrix L . The uncorrupted simulated EEG signal can be expressed as
Y signal = L X .  
The unit of Y signal 321 × 400 is V.
In our algorithmic evaluations, we take into consideration the realistic nature of EEG sensor noise by corrupting the generated EEG signals with independent 1/f pink noise. This is done to avoid the “inverse crime” problem and to provide a more accurate assessment of the algorithms’ performances. The choice of 1/f pink noise is based on the understanding that EEG sensor noise exhibits a 1/f characteristic [35,36,37,38,39,40]. While the three newly proposed Bayesian algorithms assume Gaussian noise, incorporating 1/f pink noise in the evaluation allows us to assess the algorithms’ adaptability and potential limitations in a more physiologically realistic scenario.
The simulated pseudo-EEG signal we eventually input into the source localization algorithms is
Y pseudo = Y signal + 0.1 SNR simu 20 × Y signal F E F E ,  
where we control the EEG signal-to-noise ratio SNR simu in our simulations, and each row of the matrix E 321 × 400 is a randomly generated independent 1/f noise component. F denotes the Frobenius norm of a matrix.

2.4. Evaluation Metrics for Algorithm Performance

We input the simulated EEG matrix Y pseudo and the lead field matrix L into our algorithms for evaluation, resulting in five different estimates of source activities X ^ . We then assess their source reconstruction performance with the following metrics.
  • Normalized mean square error (MSE) [41]:
MSE is a well-established classical metric that measures the accuracy of the algorithms in recovering the amplitude of the source activities. It calculates the overall mean square error between the original and recovered source activity matrices; then, it is normalized by the overall mean-squared amplitudes of the original source activities
MSE = X ^ X F 2 X F 2 ,
where X is the original source activity matrix in simulations and X ^ is the recovered source activity matrix generated by source localization algorithms.
Naturally, metric MSE is a direct reflection on the difference between original and recovered source activities in our simulations.
  • Distribution discrepancy (DD):
We propose the metric DD to evaluate the similarity between the distributions of the normalized source energies of the original and recovered source space.
We first define the energies of simulated and estimated sources as:
q = diag ( X X ) ,
q ^ = diag ( X ^ X ^ ) ,
where X is the original source activity matrix in simulations and X ^ is the recovered source activity matrix by an algorithm, hence the n th elements of q and q ^ , q n and q n ^ , denote the simulated and estimated energies of the n th source, respectively.
For a reliable source localization algorithm, the distribution of the estimated and simulated source energies after [0, 1] normalization should be as close as possible. Such a distribution can be easily represented by its cumulative distribution function (cdf). Therefore, we define the metric DD as the absolute difference between the cdf AUCs (area under curve) of normalized simulated and estimated source energies.
Compared to metric MSE, metric DD is spatiotemporally a more comprehensive reflection of the difference between original and recovered source activities.
  • Relative mean square error (RMSE) [32]:
RMSE is a well-established classical metric that assesses algorithms’ accuracy in reconstructing the shape of the source time series. It is defined as
RMSE = X ^ X ^ F X X F F 2 ,
where X is the original source activity matrix in simulations and X ^ is the recovered source activity matrix. Localization error (LE) [12].
LE is a well-established classical metric that directly reflects the spatial localization accuracy of algorithms. It calculates the Euclidean distance between the original and the estimated source locations. In our simulations, we utilize LE to assess how close the prediction of an algorithm be to the original location of the seed position.
To compute LE in “dual-seed” simulations, we first define the estimated source location where the energy of source time series X ^ reaches global maximum after ±1 Hz bandpass filtering (e.g., we employ 19 Hz to 21 Hz bandpass filtering when computing LE for the 20 Hz seed). Denote the ±1 Hz bandpass filtered source time series matrix as X f ^ . Then, the estimated seed corresponds to the maximal element of vector q f ^ = diag ( X f ^ X f ^ ) .
To compute LE in “triple-seed” simulations, we define the estimated source location where the energy of source time series X ^ reaches global maximum after ±0.1 Hz bandpass filtering (e.g., we employ 0.6 Hz to 0.8 Hz bandpass filtering when computing LE for the 0.7 Hz seed). Considering some frequencies may correspond to two simulated seed positions across the entire cortex, we define LE in this case as the smaller value between the Euclidean distances of the estimated seed to the two original seeds.
  • Spatial dispersion (SD) [32,42,43]:
An SD metric is developed to evaluate an algorithm’s accuracy in recovering the activated zone within the source space.
To compute SD in “dual-seed” simulations, we first denote the ±1 Hz bandpass filtered source time series matrix as X f ^ . We define the metric SD as
SD = n = 1 P d n 2 × q f , n ^ n = 1 P q f , n ^ ,  
where q f ^ = diag ( X f ^ X f ^ ) and d n represents the shortest possible distance between a source located in the simulated original active zone and the specific n -th source located in the estimated active zone.
In short, metric SD compares the cortical elements within the algorithm’s recovered active zone to the elements within the simulated active zone. An SD value close to zero indicates that there are no estimated recovered activated sources outside the original active zone. Conversely, a high SD value could indicate either a spatial spread of the estimated recovered active zone beyond the original active zone or an estimation of the activated zone that is located too far away from the original active zone.
However, in order to compute SD, the “active zone” needs to be defined beforehand. We hereby propose two distinct definitions for the active zone, each focusing on a different aspect of source localization accuracy.
Take the 20 Hz active zone as an example. Under our first definition, we designated all cortical elements (total number denoted as P ) whose Euclidean distance to the seed was less than a given “radius r ” as the “original active zone”. The “recovered active zone” was then defined as the P cortical elements with the highest energy after ±1 Hz (19 Hz to 21 Hz) bandpass filtering.
Our second definition of the active zone is based on the distribution of normalized source energies. This involves identifying all cortical elements whose energy exceeds a given “percentage c % ” of the global maximum energy as the original active zone after ±1 Hz (19 Hz to 21 Hz) bandpass filtering. We then utilized the same approach to define the recovered active zone.
To compute SD in “triple-seed” simulations, we only employed our second SD definition. This decision was made with the awareness that certain frequencies may correspond to two distinct seed positions in the source space.
Take the 0.7 Hz active zone as an example. We designated all cortical elements whose energy exceeds a given “percentage c % ” of the global maximum energy as the original active zone after ±0.1 Hz (0.6 Hz to 0.8 Hz) bandpass filtering. We then utilized the same approach to define the recovered active zone.
The active zones for other frequencies can be defined in a similar manner.
For all the above metrics, a lower value indicates that the algorithm is capable of accurately reconstructing the time courses of sources in corresponding aspects, and vice versa.

3. Results

3.1. Mathematical Verification on Algorithm Methodologies

Through mathematical analysis, we first confirmed the methodological validity of thin Dugh [11] and Mackay [10] by verifying their algorithmic design step by step. We proved that they are indeed rigorous, reliable and effective in generating an only solution to the temporal activities of the entire source space.
However, as we try to impose the same verifying approach on the full Dugh algorithm, we discovered a significant theoretical flaw in its practical application. To provide an intuitive illustration of this flaw, we first summarize a few key parameters within the algorithmic design of full Dugh [10].
Denote M , N and T as the number of scalp EEG electrodes, the number of electric sources and the number of time samples, respectively.
To generate an estimation on the temporal activities of the entire source space X N × T given the lead field matrix L M × N and an EEG recording Y M × T   , full Dugh firstly assumes that both EEG noises and EEG sources share the same positive definite temporal covariance matrix, denoted as B S + + T × T .
Also, it assumes that the spatial covariance matrix of both EEG noise components (with a number of M ) and EEG sources (with a number of N ) are diagonal, so the positive spatial variances of source and noise can be uniformly represented as h ( N + M ) × 1 . In this way, both B and h contains all the parameters needed to determine for full Dugh to give a cortical activity estimation. Through optimization of the proper loss function, those parameters can easily be learned by iterative updates.
The flaw we have identified in the full Dugh algorithm lies in the step of updating the temporal covariance matrix from B k to B k + 1 ( k denotes the iteration count for parameter learning) [11]. Full Dugh designates B k + 1 as the geometric mean between matrices B k and a matrix M time k (which is defined as M time k = 1 M Y ( Σ y k ) 1 Y , where Σ y k = Φ diag ( h k ) Φ , Φ = [ L , I M ] M × ( N + M ) ). This update rule assumes that both matrices are consistently positive, definite and have a size of T × T throughout the iteration process [11]. However, in realistic settings, it is not feasible to satisfy this prerequisite.
To provide a mathematical proof of this theoretical flaw, we propose Proposition 1:
Proposition 1. 
The full Dugh algorithm requires an unrealistic prerequisite that the number of EEG time samples can be no larger than the number of EEG electrodes.
Proof. 
Let T be the number of time samples and M be the number of electrodes. We start with the definition of M time k in full Dugh:
M time k = 1 M Y ( Σ y k ) 1 Y T × T ,  
where M time k must be a T × T sized positive definite matrix consistently throughout the iteration. This implies that all eigenvalues of M time k are consistently positive, and therefore, to assure no zero eigenvalues, we must have
r a n k ( M time k ) = T .
On the other hand, every EEG electrode has a unique location on the scalp and no two measuring electrodes record the same potential signal consistently. Therefore, the rows of matrix L are linearly independent and r a n k ( L ) = r a n k ( Φ ) = M . By extension, the rank of matrix Σ y k M × M is also M . In this way, we prove that Σ y k is a nonsingular covariance matrix, so we have
r a n k ( Σ y k ) = r a n k ( ( Σ y k ) 1 ) = M .
Using the matrix property that
r a n k ( U V ) min ( r a n k ( U ) , r a n k ( V ) ) ,
where U and V could be any matrix, we have
r a n k ( M time k ) = T = r a n k ( Y ( Σ y k ) 1 Y ) min ( r a n k ( Y ) , r a n k ( ( Σ y k ) 1 ) ) min ( M , T ) .
Thus, T min ( M , T ) , which is equivalent to T M . □
This proposition has significant implications for algorithm applications, as M T for most realistic EEG recordings. Modern EEG recordings typically have a high sampling frequency and duration, but the number of scalp electrodes is limited (from 8 to 256, given available techniques [7,44]).
As a consequence, this full Dugh flaw becomes particularly problematic. The high temporal resolution is one of EEG’s primary advantages over other brain imaging modalities. If we comply with this restriction, we would significantly diminish the temporal resolution of EEG data and discard a significant amount of valuable information. Additionally, the development of EEG source localization techniques is motivated by preserving the high temporal resolution of EEG in the first place [16,18]. Therefore, the existence of such a flaw undermines the fundamental objective of the EEG source localization.
However, despite our theoretical elaboration on the full Dugh flaw, it is still necessary to assess its impact on the algorithm’s source recovery performance. Further evaluations and comparative studies are needed to determine the extent to which this flaw affects the accuracy and reliability of source reconstruction.

3.2. Electrical Propagation from EEG Sources to Scalp Electrodes

In order to demonstrate the propagation of EEG sources of varying frequencies and locations in generating scalp potentials, we position a single EEG source at a fixed cortical site within the lateral occipital brain region, which is in close proximity to the scalp. Figure 2a illustrates the range of frequencies we manipulated, from 0.1 Hz to 70 Hz. The results reveal significant variation in scalp potentials across different locations, primarily influenced by their distance from the source. Importantly, the source frequency remains constant throughout the entire duration of the experiment. We further confirm that the potentials at any given scalp location fluctuate at the same frequency as the single EEG source within our chosen frequency band. This observation implies that as local electrical fields generated by EEG sources propagate, their frequencies remain consistent while their amplitudes diminish to varying extents.
Subsequently, we investigated the correlation between the components received by the scalp electrodes and their proximity to the single EEG source. Our analysis reveals an overall inverse relationship between the potential amplitude at the electrodes and their distance from the source. However, we observe that the variance in received potential amplitude remains substantial across the majority of scalp electrodes, particularly when the distance between the source and the electrode is relatively long.
Furthermore, we investigate the impact of different source locations on scalp potential amplitude by randomly relocating the single EEG source to two additional brain regions: the isthmus cingulate and the temporal pole region (Figure 2b). These cortical regions are located deep within the brain and are relatively distant from any of the 321 electrodes, in comparison to the lateral occipital region. The findings indicate that the scalp potential amplitude, which consistently exhibits high variance in relation to source-electrode distances, is significantly influenced by the locations of the EEG sources. Notably, it becomes increasingly challenging to maintain the previously observed inverse relationship between scalp potential amplitudes and source-electrode distances, seen in sources closer to the scalp, as we position the single source in deeper brain regions. These results collectively underscore the intricate nature of electrical propagation through the realistic human head volume, from EEG sources to recorded scalp potentials. They highlight the inherent difficulty in accurately recovering EEG source activity.

3.3. Comparison and Evaluation of Seed Activity Recovery

To evaluate the accuracy of algorithms in recovering source time series with correct amplitude and shape, we first compare the reconstructed source signals at seed positions utilizing the “two seeds” simulation framework. Figure 1a–d presents the simulation results, demonstrating a localization error (LE) of 0 between the original and recovered seed for eLORETA, thin Dugh, and Mackay, indicating optimal performance.
It is important to note that full Dugh failed to accurately estimate both the amplitude and shape of the simulated seed source signals. The other four algorithms all manage to recover the correct shape of seed temporal fluctuations. While thin Dugh and Mackay slightly amplified the seed amplitude, BST-MN and eLORETA significantly diminished it, resulting in a less effective estimation of seed amplitudes for these two algorithms.

3.4. Fixed Dual-Seed Simulations for Algorithm Evaluations

To conduct a comprehensive assessment of the source recovery performance, we further performed 30 Monte Carlo dual-seed simulations with randomly selected, yet fixed, seed positions. The results of these simulations, evaluated with three spatiotemporal metrics, are presented in Figure 3. All three metrics were evaluated across the entire cortex surface, encompassing a total of 30,003 sources.
Most notably, Figure 3c clearly demonstrates that full Dugh fails to accurately reconstruct the shape of source time series. However, the remaining four algorithms exhibit relatively better and comparable performance levels.
Additionally, Figure 3a and Figure 4 highlight an important observation regarding classical benchmarks, such as BST-MN and eLORETA. These algorithms produce estimates where the distribution of source energies appears less sparse than the simulation settings. This suggests that they tend to consider numerous non-contributing sources as contributing, and assign them large amplitudes.
In contrast, both thin Dugh and Mackay exhibit an even sparser distribution than the original simulation. This indicates their ability to identify the most contributing sources accurately and reduce the amplitudes of non-contributing sources effectively.
The results based on the metric DD may appear to contradict the results obtained using the metric MSE (Figure 3b), where newly proposed algorithms, such as thin Dugh and Mackay, exhibit lower performance compared to classical benchmark algorithms. However, it is important to note that both metrics aim to capture the discrepancy between the original and recovered source activities. We will delve into this discrepancy further in subsequent sections. Overall, our evaluation demonstrates that thin Dugh and Mackay surpass BST-MN and eLORETA in accurately estimating seed amplitudes and identifying the most contributing sources. These findings offer valuable insights into the limitations of classical algorithms and the potential benefits of Bayesian approaches.
Next, we evaluate the spatial localization performance of algorithms by comparing their seed localization error (LE) and the spatial dispersion (SD) of active zones. Figure 5a illustrates that eLORETA consistently achieves the lowest LE, followed by BST-MN, thin Dugh and Mackay. Conversely, full Dugh exhibits poor performance in localizing the most influential source.
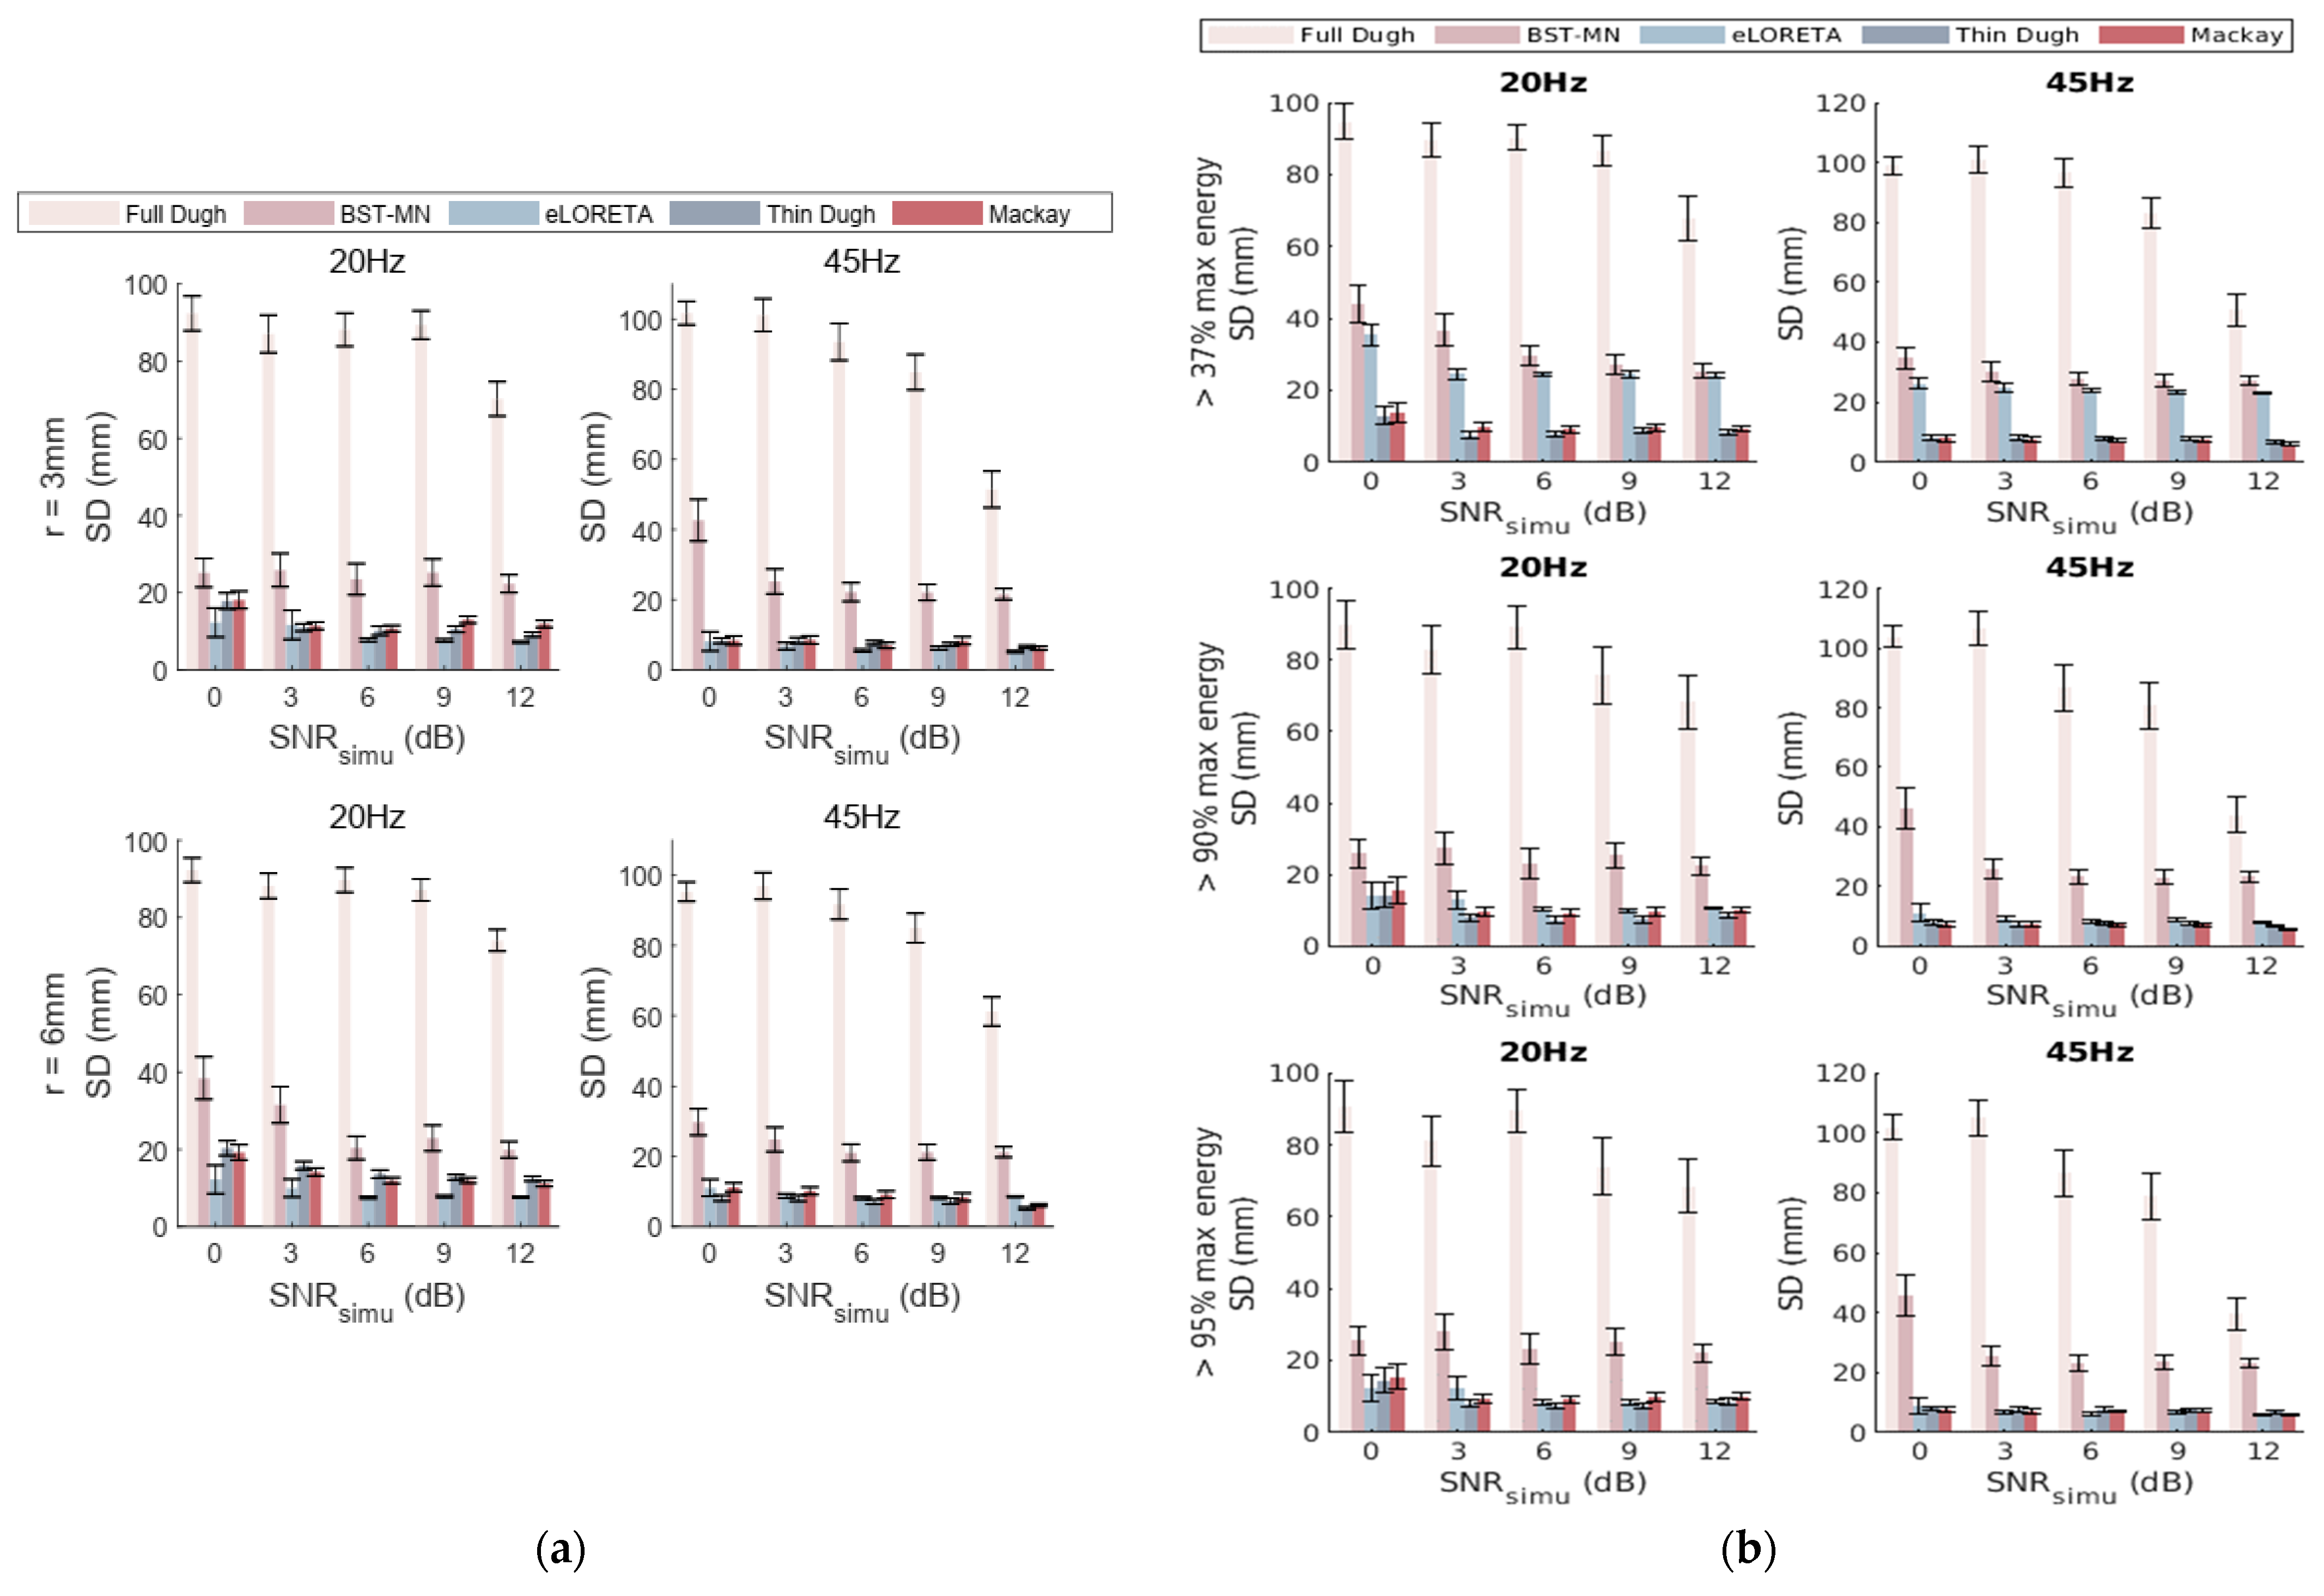
To compute the spatial dispersion (SD), we employ two methods, as described in the Materials and Methods section. The results presented in Figure 5b,c indicate that when utilizing the first SD definition, full Dugh and BST-MN exhibit the poorest performance in localizing the spatial extent and position of the active zone, followed by eLORETA. Conversely, thin Dugh and Mackay demonstrate superior performance, with thin Dugh consistently outperforming Mackay. When applying the second SD definition, thin Dugh and Mackay maintain their superior performance, while eLORETA, full Dugh and BST-MN continue to fare poorly. Furthermore, Figure 5 highlights that the performances of thin Dugh and Mackay are more susceptible to lower-frequency noises. This can be attributed to our additive 1/f pink noise, which exerts a more substantial impact on low-frequency components compared to higher frequencies.
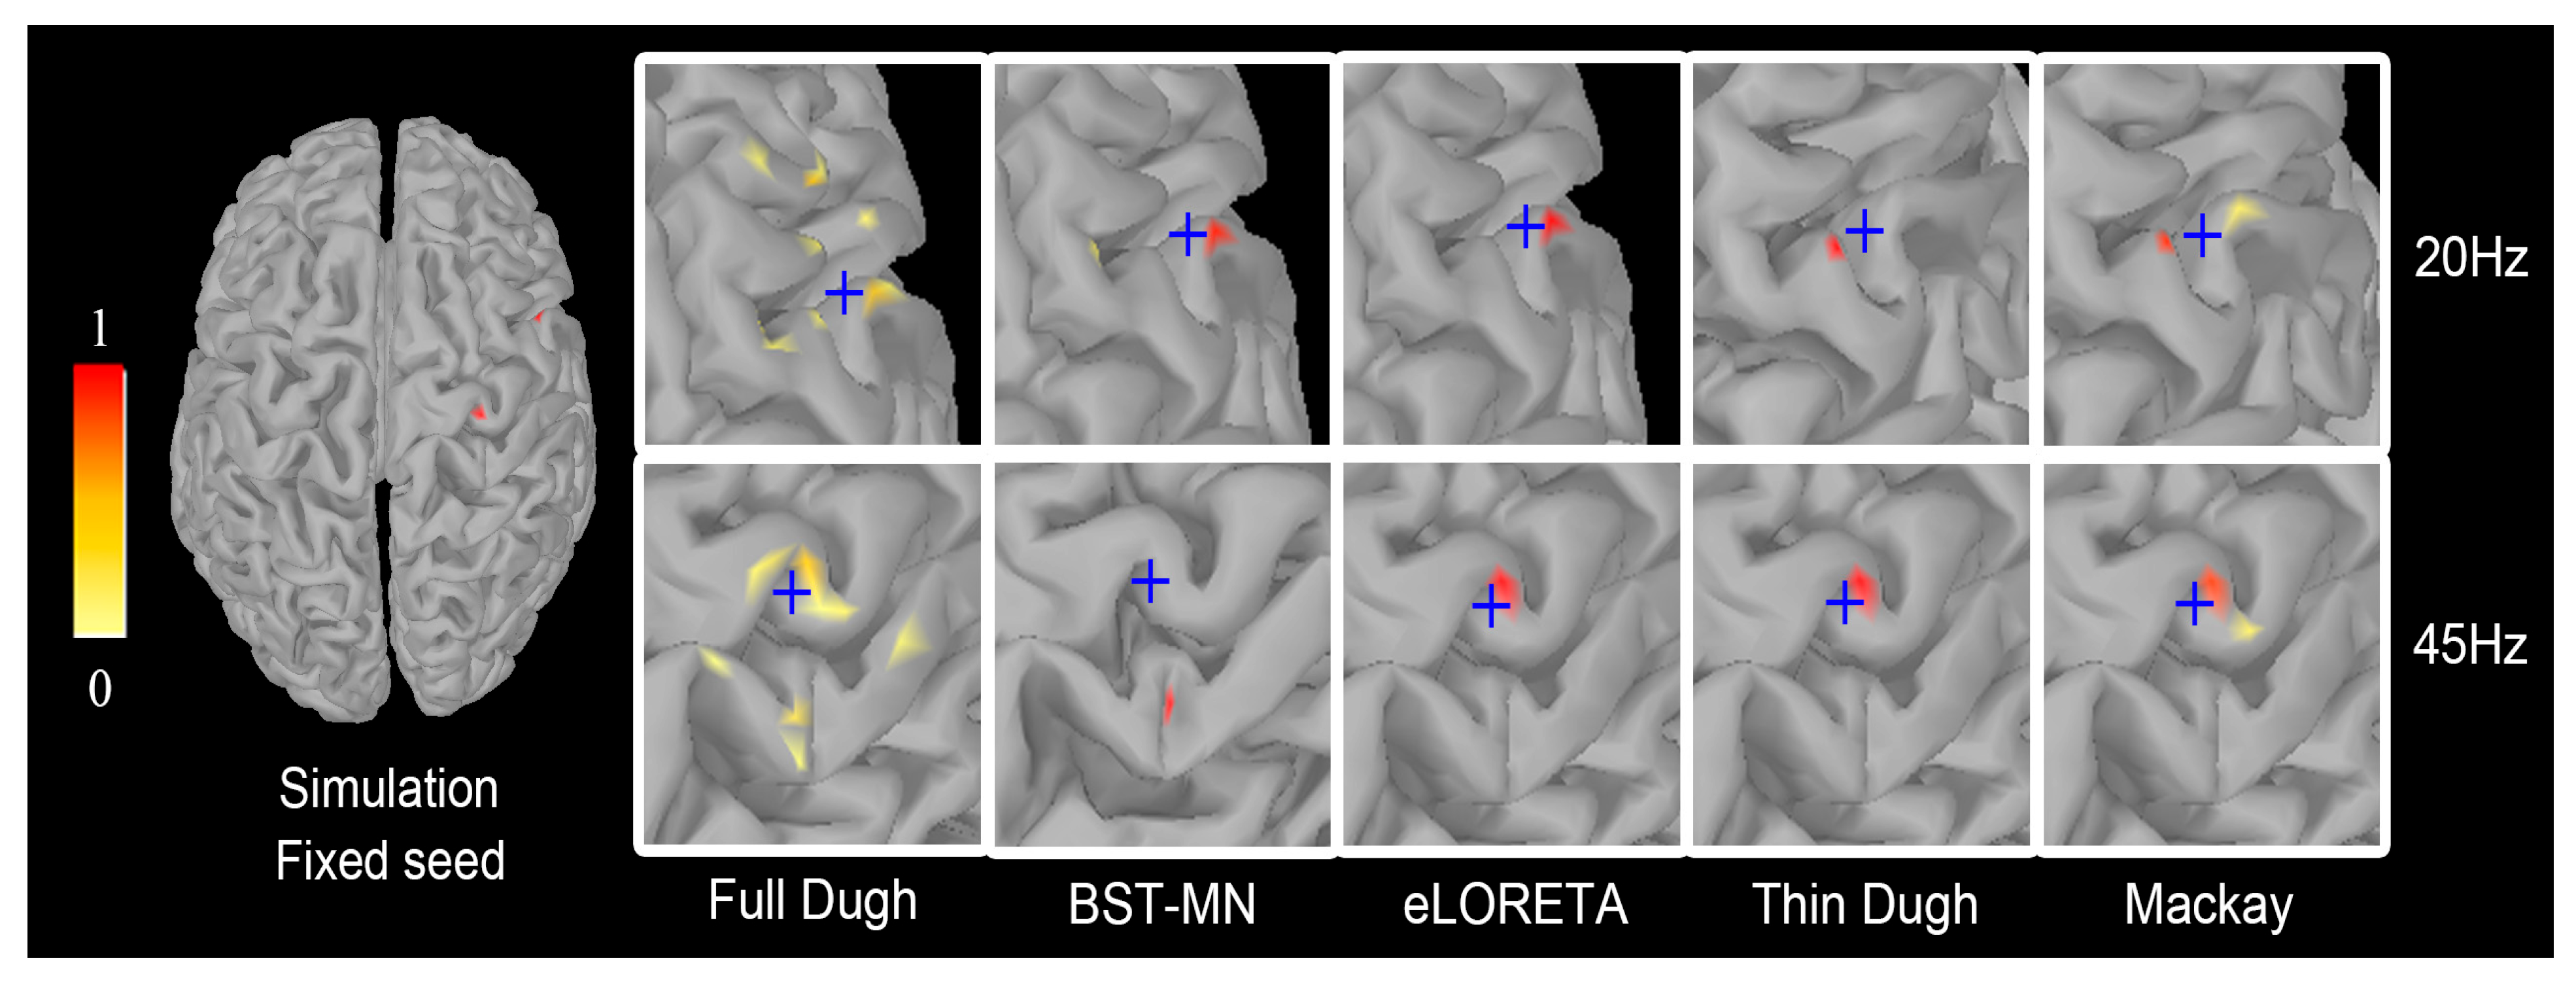
Lastly, we compare the spatial localization results of the five algorithms by generating a probability map based on the recovered seed locations, where the source energy reaches global maximum (Figure 6). Full Dugh exhibits the poorest performance, providing an unreliable and inconsistent estimation of the seeds. Mackay and BST-MN follow with relatively weak spatial robustness. Additionally, BST-MN consistently recovers the seed location far from the simulated position. Both eLORETA and thin Dugh yield fixed seed estimates. Taking into account these observations along with the previous findings in Figure 5, we demonstrate that thin Dugh achieves the most accurate recovery of the active zone in terms of both spatial extent and location.

3.5. Unfixed Dual-Seed Simulations for Algorithm Evaluations

In our previous simulations, we evaluated the performance of five EEG source localization algorithms by fixing the positions of two seeds. However, this approach has limitations as it does not fully assess the reliability and robustness of the algorithms since the most contributing EEG sources can be located anywhere in the cortical source space. To address this limitation, we conducted unfixed seed simulations with SNR simu set at 0 dB, 3 dB, 6 dB, 9 dB, and 12 dB. We performed 30 repeated Monte Carlo simulations for each SNR simu , randomly repositioning the two seeds in each simulation, resulting in a total of 150 Monte Carlo simulations.
The evaluation of the spatiotemporal reconstruction accuracy for the 30,003 source activities under unfixed seed settings is presented in Figure 7. Notably, the results in Figure 7a,b highlight that the full Dugh algorithm consistently fails to accurately reconstruct the amplitude and temporal shape of EEG source activity due to its inherent theoretical flaw. Comparing the unfixed seed results in Figure 7b to the fixed seed results in Figure 3c, we further observe that Mackay demonstrates the best spatiotemporal performance, followed by thin Dugh, eLORETA, and finally, BST-MN.
Furthermore, Figure 7c corroborates the findings of Figure 3a and Figure 4, indicating that classical algorithms, such as BST-MN and eLORETA, tend to misidentify numerous non-contributing EEG sources as the main contributors and assign them high activity amplitudes, regardless of seed locations. However, the results based on the DD metric continue to contradict the results based on the MSE metric (Figure 7a), as thin Dugh and Mackay still exhibit lower performance compared to classical benchmark algorithms. We will delve further into this result in the discussion section.
We also discovered that full Dugh’s methodological flaw reveals a discrepancy between the simulated and estimated EEG source energy distribution, which was not evident in our previous fixed seed simulations. In contrast, thin Dugh and Mackay consistently display the best performance in this aspect, with their estimated EEG source energy distributions remaining closest to the simulation.
To further assess the spatial localization performance of the algorithms, we evaluated the seed localization error (LE) and the recovered spatial dispersion (SD) of active zones, as seen in Figure 8. The results indicate that full Dugh consistently exhibits the highest LE, followed by BST-MN, rendering them the least reliable algorithms. On the other hand, eLORETA, thin Dugh, and Mackay perform exceptionally well at a similar level.
Additionally, the results of the SD metric highlight that thin Dugh and Mackay demonstrate the best performance, followed by eLORETA and then BST-MN, the two classical benchmarks (Figure 9). The results in Figure 8 and Figure 9 also illustrate that the theoretical flaw in full Dugh leads to its worst spatial localization accuracy, providing further support for our previous argument presented in the mathematical proposition.
Lastly, we conducted additional assessments of our unfixed dual-seed simulations based on the brain regions where the seeds were located (frontal lobe, parietal lobe, temporal lobe, or occipital lobe). We aim to determine whether the spatial localization performance of those algorithms depended on various source locations. The results, presented in Figure 10, further support our previous observations. They indicate that the unsatisfactory spatial localization performances of full Dugh, BST-MN, and eLORETA are, to a large extent, inherent to the algorithms themselves, rather than being influenced by their potential preference for EEG sources in specific brain regions. In contrast, the spatial localization performances of thin Dugh and Mackay remain consistently greatest and is not susceptible to variations in seed positions, thereby confirming their general applicability and robustness in comparison.

3.6. Triple-Seed Simulations for Algorithm Evaluations

Previously, through extensive dual-seed simulations, we provided sufficient evidence that the full Dugh and BST-MN algorithms are more unreliable compared to the eLORETA, thin Dugh, and Mackay algorithms. We have also demonstrated that the metric DD shows more potential than the metric MSE in comparing how different algorithms deal with most contributing sources.
In order to investigate the impact of EEG sources of varying depths on the spatiotemporal localization performance, we performed further simulations under our proposed triple-seed framework.
We place all three seeds in deep brain regions, middle-depth brain regions, and superficial brain regions, respectively. For each scenario, the EEG signal-to-noise ratio SNR simu was controlled at 0 dB, 3 dB, 6 dB, 9 dB, and 12 dB. A total of 30 repetitions of Monte Carlo simulations were performed for each SNR simu value. In each simulation, the three seeds were randomly moved to three new locations in the cortical source space, resulting in a total of 450 simulations.
Figure 11 illustrates the results of two spatiotemporal metrics, RMSE and DD. As the cortical source activity distribution approaches physiological reality, eLORETA performs consistently and its performance is significantly inferior to the thin Dugh and Mackay algorithms on both metrics. This eLORETA deficiency persists as the seeds are positioned at different depths of the cortex.
Moreover, RMSE highlights that both thin Dugh and Mackay achieve slightly better spatiotemporal performance as the EEG signal-to-noise ratio becomes higher and the seeds becomes more superficial. However, compared to thin Dugh, Mackay displays more susceptibility to EEG SNR, especially for superficial sources.
Next, we investigated whether the depth and frequencies of the seeds impact the spatial localization accuracy of different algorithms.
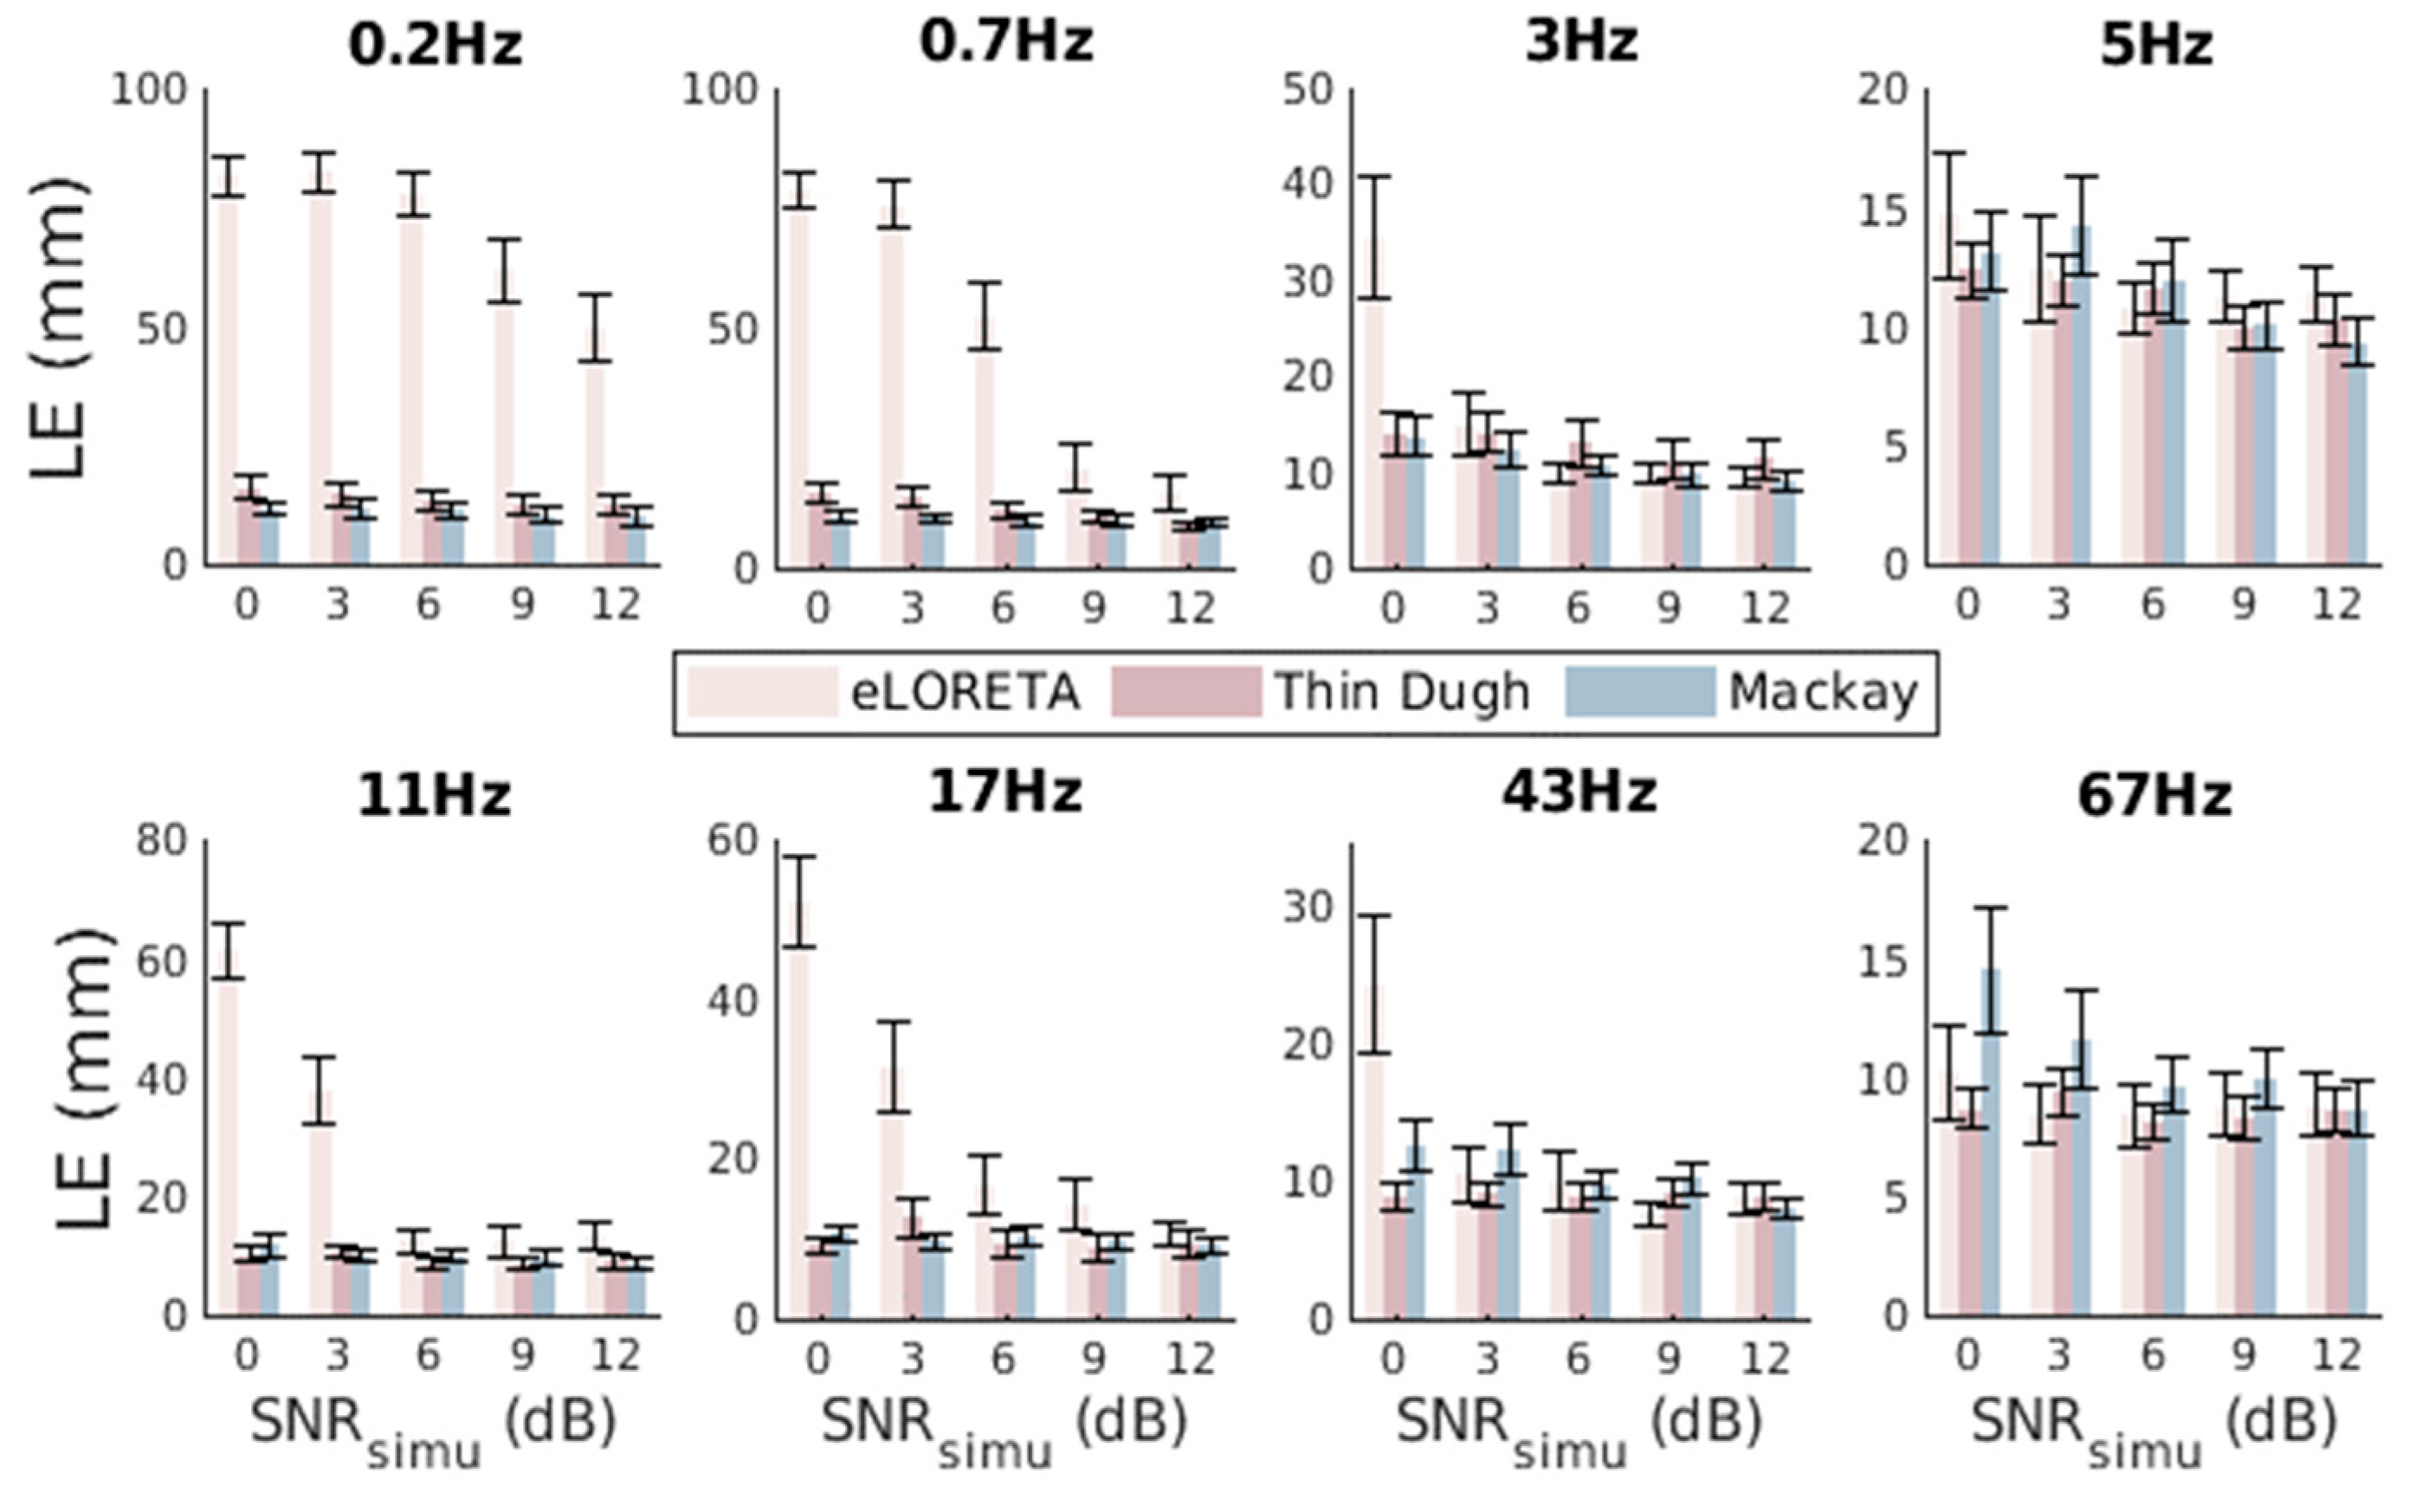
We first examined the seed localization error (LE) as we placed the seeds at different depths, as shown in Figure 12, Figure 13 and Figure 14.
Our results indicate that the spatial localization accuracy of eLORETA is most affected by the frequency of the EEG source and the SNR. Generally, it has a harder time localizing low-frequency EEG sources than high-frequency ones when the simulated signals have the same amplitudes, but this issue becomes less of a problem with higher EEG SNRs and more superficial EEG sources.
In contrast, the Mackay algorithm is impacted less by EEG source frequency and SNR than eLORETA. However, the results also highlight its deficiency in spatial localization under low EEG SNRs when the EEG sources are deep. This implicit deficiency provides evidence that the Mackay algorithm may not be as highly robust or reliable as its developers claim.
Conversely, thin Dugh keeps performing the best as its spatial localization accuracy is unaffected by different source frequencies. It is a more reliable choice than the other two algorithms, which are susceptible to source frequency, depth and EEG SNR.
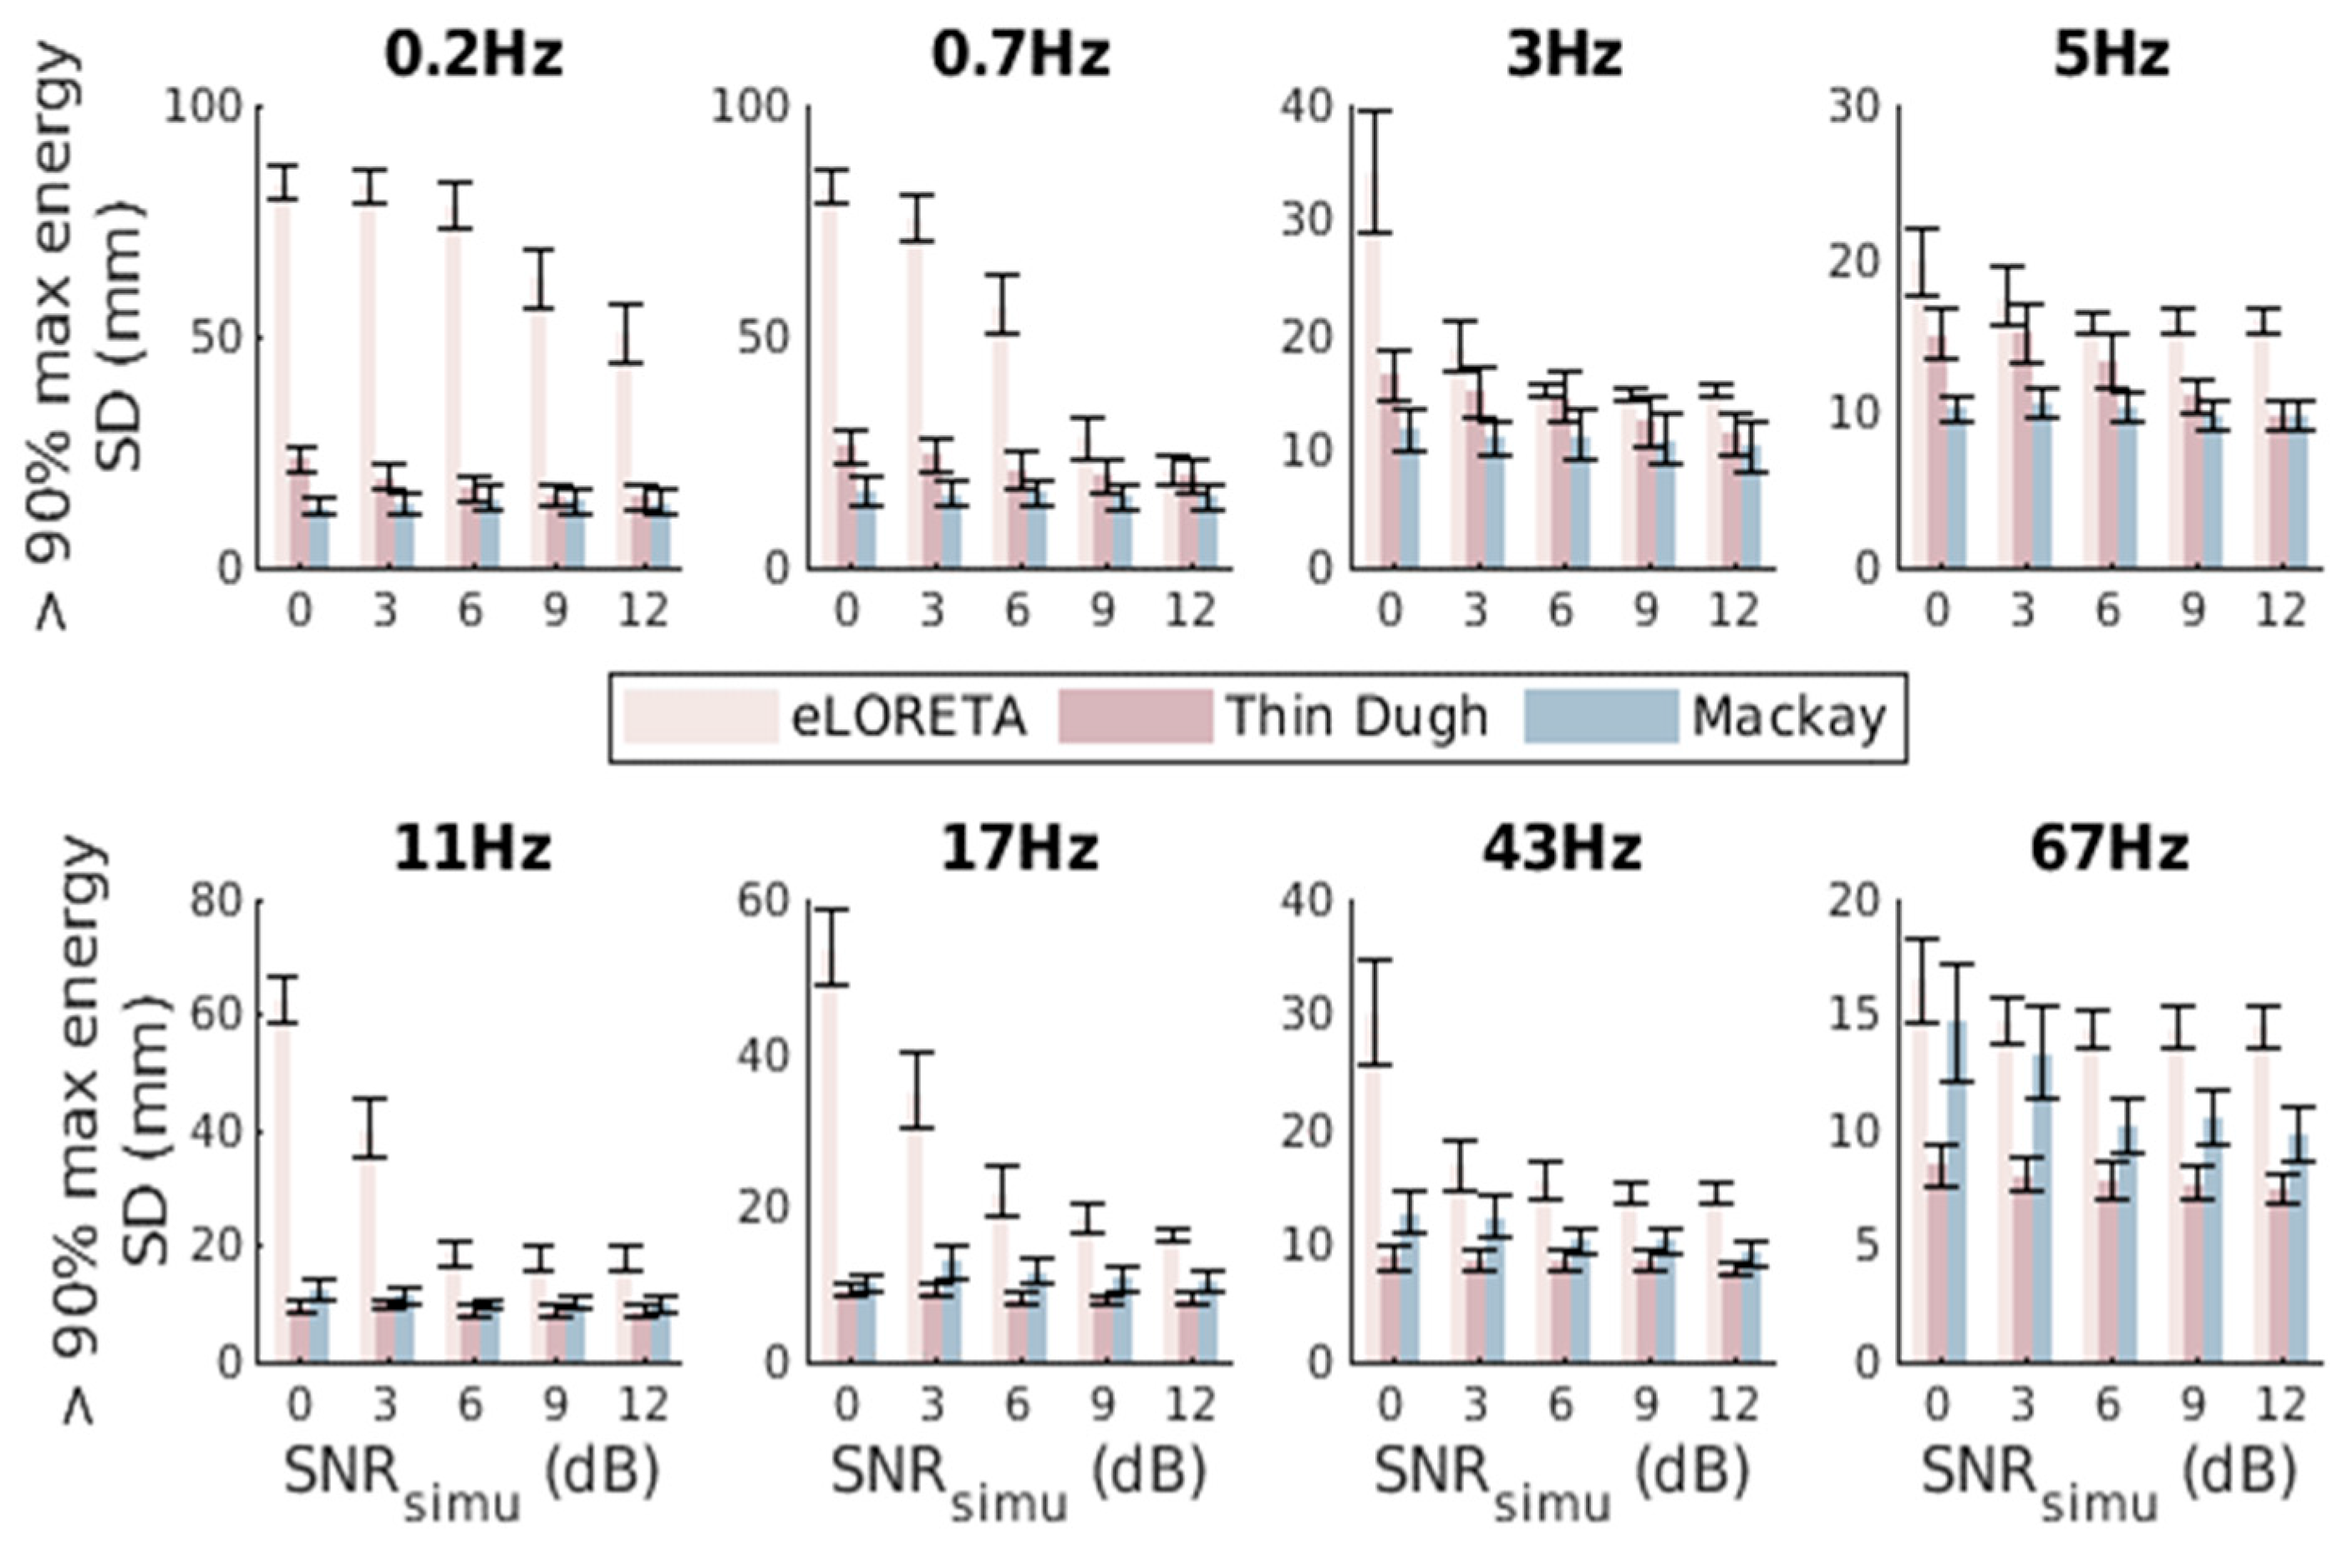
Finally, we examined the spatial dispersion metric SD of active zones of different frequencies. We designated all cortical elements whose energy exceeds 90% of the global maximum energy as the active zone. We performed analysis on varying depths of seeds, as demonstrated in Figure 15, Figure 16 and Figure 17.
With our proposed triple-seed framework, SD further discriminates the performance of eLORETA, thin Dugh and Maskay. Notably, eLORETA’s ability to recover the active zone deteriorates significantly with the increase in source frequency, as well as source depth, and the decrease in the EEG SNR.
Meanwhile, the results also reveal that Mackay fails to accurately recover the active zone of high frequencies for deep EEG sources, indicating the low reliability of the algorithm.
In contrast, the spatial recovery performance of thin Dugh is still unaffected by the varying EEG source frequency. This further supports our previous finding in that its reliability and versatility are far more superior to those of the eLORETA and Mackay algorithms, as eLORETA and Mackay are still susceptible to EEG source frequency, source depth, and SNR in terms of metric SD.

4. Discussion

In our study, we conducted a comprehensive mathematical analysis of three newly proposed EEG source localization algorithms and confirmed the validity of the thin Dugh and Mackay algorithms. We also identified a theoretical flaw in the methodological design of the full Dugh algorithm.
To evaluate the algorithms’ performances in realistic scenarios and assess their ability to reconstruct EEG sources with spatiotemporal accuracy, we compared them with two classical benchmark algorithms, BST-MN and eLORETA, using a newly proposed simulation framework.
Our simulation framework incorporated advanced forward modeling techniques, such as CG-FEM, and took into account latest in vivo measurements of tissue conductivities and tissue anisotropy to closely resemble a realistic human head. We also included a large number of scalp EEG electrodes to ensure high data quality and represent the best possible performance achievable by any EEG source localization algorithm.
We simulated non-periodic temporal fluctuations for the entire cortical source space and generated corresponding EEG signals. We strived to reflect the physiological reality in the generation of source activities and scalp EEG data.
Utilizing this framework, we first studied the electrical propagation from EEG sources to scalp potentials and observed that the frequencies of EEG sources remained intact while their amplitudes diminished during propagation, in line with the quasi-static approximation used in solving the “forward problem” [13]. Additionally, the variance of scalp potential amplitude is consistently high with respect to source-electrode distances, and the scalp potentials are significantly affected by the different positions of the EEG sources. These results highlight the challenges involved in accurately recovering EEG source activity and emphasize the need for evaluating different source localization algorithms.
To evaluate the algorithms, we compared the estimated source space activities given by different EEG source localization algorithms with the original simulations. We introduced new metrics, such as distribution discrepancy (DD) and spatial dispersion (SD), alongside classical metrics, such as mean-squared error (MSE), root mean-squared error (RMSE), and localization error (LE). The results show that our simulation framework, along with the proposed metrics, effectively highlighted the strengths and limitations of the algorithms in various aspects.
We observed a discrepancy between the results based on metric DD (favoring thin Dugh and Mackay) and metric MSE (favoring classical algorithms). This discrepancy can be explained by our simulation settings, in which the majority of the cortical sources are non-contributing. Classical algorithms, such as BST-MN and eLORETA, falsely regard a majority of the 30,003 sources as contributing, and assign them with relatively large amplitudes, thus yielding lower MSE results. Conversely, thin Dugh and Mackay are able to accurately identify contributing sources while reducing the amplitudes of non-contributing sources, which was advantageous for source localization purposes.
In this way, we also emphasized the importance of using multiple evaluation metrics to assess algorithms in multiple aspects and caution against relying solely on metric MSE, which may not expose performance weaknesses and could be misleading when used in isolation. In conclusion, our findings suggest that thin Dugh currently stands as the most promising source localization algorithm, incorporating state-of-the-art methodologies and demonstrating high performance in spatiotemporal source recovery.
Meanwhile, the theoretical flaw of full Dugh has a significantly negative impact on its source localization accuracy, both spatially and temporally.
Although both thin Dugh and Mackay are able to single out most contributing sources, evidence in multiple aspects suggests that the Mackay algorithm has a low robustness and reliability.
The relatively inferior performance of classical algorithms such as BST-MN and eLORETA can be mainly attributed to their additional optimization goal in searching for the most appropriate solution for source activities. All five EEG source localization algorithms we have evaluated search for solutions that best fit the EEG data. The three newly proposed algorithms incorporate only the relative difference between the recovered and input EEG scalp potentials in their loss function with no further optimization goals. However, BST-MN further seeks the solution with minimum overall amplitude of brain activity, while eLORETA further imposes regularization in its loss function.
On the other hand, the superiority of thin Dugh compared to Mackay in terms of robustness and reliability highlights the necessity of incorporating temporal parameters with the well-established spatial assumptions in EEG source localization methodology.
Our work provides valuable insights for future researchers and practitioners in the field of EEG source localization. However, we acknowledge the limitations of our simulations and call for future work to incorporate fine structurally co-registered human DTI data to better suit physiological reality.

Author Contributions

Conceptualization, H.S. and Y.Y.; methodology, H.S. and Y.Y.; software, H.S.; validation, H.S. and Y.Y.; formal analysis, H.S.; investigation, H.S.; resources, Y.Y.; data curation, H.S.; writing—original draft preparation, H.S.; writing—review and editing, H.S. and Y.Y.; visualization, H.S.; supervision, Y.Y.; project administration, Y.Y.; funding acquisition, Y.Y. All authors have read and agreed to the published version of the manuscript.

Funding

This work was supported by the Science and Technology Innovation 2030—Brain Science and Brain-Inspired Intelligence Project (2021ZD0201301), the National Natural Science Foundation of China (U20A20221), the Shanghai Municipal Science and Technology Major Project (2018SHZDZX01) and ZJLab, Shanghai Municipal Science and Technology Committee of Shanghai outstanding academic leaders plan (21XD1400400).

Data Availability Statement

All simulated data and analysis codes were generated and developed based on MATLAB, which is stored online in a Github repository. The Brainstorm software we used is Version 3.230210 (10 February 2023). The simulated data and codes corresponding to this study are available on request from the corresponding author.

Conflicts of Interest

The authors declare no conflict of interest.

References

  1. Cohen, M.X. Where Does EEG Come From and What Does It Mean? Trends Neurosci. 2017, 40, 208–218. [Google Scholar] [CrossRef] [PubMed]
  2. Niedermeyer, E. The clinical relevance of EEG interpretation. Clin. Electroencephalogr. 2003, 34, 93–98. [Google Scholar] [CrossRef] [PubMed]
  3. Zheng, G.; Lei, Y.; Li, Y.; Zhang, W.; Su, J.; Qi, X.; Chen, L.; Zhang, X.; Gu, Y.; Yu, Y.; et al. Changes in Brain Functional Network Connectivity in Adult Moyamoya Diseases. Cogn. Neurodyn. 2021, 15, 861–872. [Google Scholar] [CrossRef] [PubMed]
  4. Zheng, G.; Li, Y.; Qi, X.; Zhang, W.; Yu, Y. Mental Calculation Drives Reliable and Weak Distant Connectivity While Music Listening Induces Dense Local Connectivity. Phenomics 2021, 1, 285–298. [Google Scholar] [CrossRef]
  5. Qi, X.; Wang, Y.; Lu, Y.; Zhao, Q.; Chen, Y.; Zhou, C.; Yu, Y. Enhanced brain network flexibility by physical exercise in female methamphetamine users. Cogn. Neurodyn. 2022, 26, 1–7. [Google Scholar] [CrossRef]
  6. Lei, Y.; Li, Y.; Yu, L.; Xu, L.; Zhang, X.; Zheng, G.; Chen, L.; Zhang, W.; Qi, X.; Gu, Y.; et al. Faded Critical Dynamics in Adult Moyamoya Disease Revealed by EEG and fMRI. Oxid. Med. Cell. Longev. 2021, 2021, 6640108. [Google Scholar] [CrossRef]
  7. Michel, C.M.; Murray, M.M.; Lantz, G.; Gonzalez, S.; Spinelli, L.; Grave de Peralta, R. EEG source imaging. Clin. Neurophysiol. 2004, 115, 2195–2222. [Google Scholar] [CrossRef]
  8. Berger, H. Electroencephalogram in humans. Arch. Psychiatr. Nervenkrankh. 1929, 87, 527–570. [Google Scholar] [CrossRef]
  9. He, B.; Sohrabpour, A.; Brown, E.; Liu, Z. Electrophysiological Source Imaging: A Noninvasive Window to Brain Dynamics. Annu. Rev. Biomed. Eng. 2018, 20, 171–196. [Google Scholar] [CrossRef]
  10. Cai, C.; Kang, H.; Hashemi, A.; Chen, D.; Diwakar, M.; Haufe, S.; Sekihara, K.; Wu, W.; Nagarajan, S.S. Bayesian algorithms for joint estimation of brain activity and noise in electromagnetic imaging. IEEE Trans. Med. Imaging 2022, 42, 762–773. [Google Scholar] [CrossRef]
  11. Hashemi, A.; Gao, Y.; Cai, C.; Ghosh, S.; Müller, K.-R.; Nagarajan, S.; Haufe, S. Efficient hierarchical Bayesian inference for spatio-temporal regression models in neuroimaging. In Proceedings of the Advances in Neural Information Processing Systems, Virtual, 6–14 December 2021; pp. 24855–24870. [Google Scholar]
  12. Sohrabpour, A.; Lu, Y.; Worrell, G.; He, B. Imaging brain source extent from EEG/MEG by means of an iteratively reweighted edge sparsity minimization (IRES) strategy. NeuroImage 2016, 142, 27–42. [Google Scholar] [CrossRef]
  13. Hallez, H.; Vanrumste, B.; Grech, R.; Muscat, J.; De Clercq, W.; Vergult, A.; D’Asseler, Y.; Camilleri, K.P.; Fabri, S.G.; Van Huffel, S.; et al. Review on solving the forward problem in EEG source analysis. J. Neuroeng. Rehabil. 2007, 4, 46. [Google Scholar] [CrossRef]
  14. Chen, Y.; Akutagawa, M.; Emoto, T.; Kinouchi, Y. The removal of EMG in EEG by neural networks. Physiol. Meas. 2010, 31, 1567–1584. [Google Scholar] [CrossRef]
  15. Gurve, D.; Delisle-Rodriguez, D.; Bastos-Filho, T.; Krishnan, S. Trends in Compressive Sensing for EEG Signal Processing Applications. Sensors 2020, 20, 3703. [Google Scholar] [CrossRef]
  16. Zorzos, I.; Kakkos, I.; Ventouras, E.M.; Matsopoulos, G.K. Advances in Electrical Source Imaging: A Review of the Current Approaches, Applications and Challenges. Signals 2021, 2, 378–391. [Google Scholar] [CrossRef]
  17. Baillet, S.; Mosher, J.C.; Leahy, R.M. Electromagnetic brain mapping. IEEE Signal Process. Mag. 2001, 18, 14–30. [Google Scholar] [CrossRef]
  18. Asadzadeh, S.; Yousefi Rezaii, T.; Beheshti, S.; Delpak, A.; Meshgini, S. A systematic review of EEG source localization techniques and their applications on diagnosis of brain abnormalities. J. Neurosci. Methods 2020, 339, 108740. [Google Scholar] [CrossRef]
  19. Tadel, F.; Baillet, S.; Mosher, J.C.; Pantazis, D.; Leahy, R.M. Brainstorm: A user-friendly application for MEG/EEG analysis. Comput. Intell. Neurosci. 2011, 2011, 879716. [Google Scholar] [CrossRef]
  20. Pascual-Marqui, R.D. Discrete, 3D distributed, linear imaging methods of electric neuronal activity. Part 1: Exact, zero error localization. arXiv 2007, arXiv:0710.3341. [Google Scholar]
  21. Hyder, F.; Herman, P.; Bailey, C.J.; Møller, A.; Globinsky, R.; Fulbright, R.K.; Rothman, D.L.; Gjedde, A. Uniform distributions of glucose oxidation and oxygen extraction in gray matter of normal human brain: No evidence of regional differences of aerobic glycolysis. J. Cereb. Blood Flow Metab. 2016, 36, 903–916. [Google Scholar] [CrossRef]
  22. Schrader, S.; Westhoff, A.; Piastra, M.C.; Miinalainen, T.; Pursiainen, S.; Vorwerk, J.; Brinck, H.; Wolters, C.H.; Engwer, C. DUNEuro-A software toolbox for forward modeling in bioelectromagnetism. PLoS ONE 2021, 16, e0252431. [Google Scholar] [CrossRef] [PubMed]
  23. Medani, T.; Garcia-Prieto, J.; Tadel, F.; Schrader, S.; Antonakakis, M.; Joshi, A.; Engwer, C.; Wolters, C.; Mosher, J.; Leahy, R. Realistic head modeling of electromagnetic brain activity: An integrated Brainstorm-DUNEuro pipeline from MRI data to the FEM solutions. In Proceedings of the SPIE Medical Imaging, San Diego, CA, USA, 14–18 February 2021. [Google Scholar]
  24. Thielscher, A.; Antunes, A.; Saturnino, G.B. Field modeling for transcranial magnetic stimulation: A useful tool to understand the physiological effects of TMS? In Proceedings of the 2015 37th Annual International Conference of the IEEE Engineering in Medicine and Biology Society (EMBC), Milan, Italy, 25–29 August 2015; pp. 222–225. [Google Scholar]
  25. Yao, D. A method to standardize a reference of scalp EEG recordings to a point at infinity. Physiol. Meas. 2001, 22, 693–711. [Google Scholar] [CrossRef] [PubMed]
  26. Mandija, S.; Petrov, P.I.; Vink, J.J.T.; Neggers, S.F.W.; van den Berg, C.A.T. Brain Tissue Conductivity Measurements with MR-Electrical Properties Tomography: An In Vivo Study. Brain Topogr. 2021, 34, 56–63. [Google Scholar] [CrossRef] [PubMed]
  27. Marino, M.; Cordero-Grande, L.; Mantini, D.; Ferrazzi, G. Conductivity Tensor Imaging of the Human Brain Using Water Mapping Techniques. Front. Neurosci. 2021, 15, 694645. [Google Scholar] [CrossRef] [PubMed]
  28. Fernandez-Corazza, M.; Turovets, S.; Luu, P.; Price, N.; Muravchik, C.H.; Tucker, D. Skull Modeling Effects in Conductivity Estimates Using Parametric Electrical Impedance Tomography. IEEE Trans. Bio-Med. Eng. 2018, 65, 1785–1797. [Google Scholar] [CrossRef]
  29. Wolters, C.H.; Anwander, A.; Tricoche, X.; Weinstein, D.; Koch, M.A.; MacLeod, R.S. Influence of tissue conductivity anisotropy on EEG/MEG field and return current computation in a realistic head model: A simulation and visualization study using high-resolution finite element modeling. NeuroImage 2006, 30, 813–826. [Google Scholar] [CrossRef]
  30. Murakami, S.; Okada, Y. Contributions of principal neocortical neurons to magnetoencephalography and electroencephalography signals. J. Physiol. 2006, 575, 925–936. [Google Scholar] [CrossRef]
  31. Lamus, C.; Hämäläinen, M.S.; Temereanca, S.; Brown, E.N.; Purdon, P.L. A spatiotemporal dynamic distributed solution to the MEG inverse problem. NeuroImage 2012, 63, 894–909. [Google Scholar] [CrossRef]
  32. Huang, G.; Liu, K.; Liang, J.; Cai, C.; Gu, Z.H.; Qi, F.; Li, Y.; Yu, Z.L.; Wu, W. Electromagnetic Source Imaging via a Data-Synthesis-Based Convolutional Encoder–Decoder Network. IEEE Trans. Neural Netw. Learn. Syst. 2022, 2022, 1–15. [Google Scholar] [CrossRef]
  33. Teplan, M. Fundamentals of EEG measurement. Meas. Sci. Rev. 2002, 2, 1–11. [Google Scholar]
  34. Kumar, J.S.; Bhuvaneswari, P. Analysis of Electroencephalography (EEG) signals and its categorization—A study. Procedia Eng. 2012, 38, 2525–2536. [Google Scholar] [CrossRef]
  35. Chávez, C.E.; Alonzo-Atienza, F.; Álvarez, D. Avoiding the inverse crime in the Inverse Problem of electrocardiography: Estimating the shape and location of cardiac ischemia. In Proceedings of the Computing in Cardiology 2013, Zaragoza, Spain, 22–25 September 2013; pp. 687–690. [Google Scholar]
  36. Munck, J.C.D.; Huizenga, H.M.; Waldorp, L.J.; Heethaar, R.A. Estimating stationary dipoles from MEG/EEG data contaminated with spatially and temporally correlated background noise. IEEE Trans. Signal Process. 2002, 50, 1565–1572. [Google Scholar] [CrossRef]
  37. Voytek, B.; Kramer, M.A.; Case, J.; Lepage, K.Q.; Tempesta, Z.R.; Knight, R.T.; Gazzaley, A. Age-Related Changes in 1/f Neural Electrophysiological Noise. J. Neurosci. 2015, 35, 13257–13265. [Google Scholar] [CrossRef]
  38. Dave, S.; Brothers, T.A.; Swaab, T.Y. 1/f neural noise and electrophysiological indices of contextual prediction in aging. Brain. Res. 2018, 1691, 34–43. [Google Scholar] [CrossRef]
  39. Yu, Y.; Romero, R.; Lee, T.S. Preference of sensory neural coding for 1/f signals. Phys. Rev. Lett. 2005, 94, 108103. [Google Scholar] [CrossRef]
  40. Qu, G.; Fan, B.; Fu, X.; Yu, Y. The Impact of Frequency Scale on the Response Sensitivity and Reliability of Cortical Neurons to 1/fβ Input Signals. Front. Cell. Neurosci. 2019, 13, 311. [Google Scholar] [CrossRef]
  41. Grova, C.; Daunizeau, J.; Lina, J.M.; Bénar, C.G.; Benali, H.; Gotman, J. Evaluation of EEG localization methods using realistic simulations of interictal spikes. NeuroImage 2006, 29, 734–753. [Google Scholar] [CrossRef]
  42. Molins, A.; Stufflebeam, S.M.; Brown, E.N.; Hämäläinen, M.S. Quantification of the benefit from integrating MEG and EEG data in minimum ℓ2-norm estimation. NeuroImage 2008, 42, 1069–1077. [Google Scholar] [CrossRef]
  43. Chang, W.-T.; Nummenmaa, A.; Hsieh, J.-C.; Lin, F.-H. Spatially sparse source cluster modeling by compressive neuromagnetic tomography. NeuroImage 2010, 53, 146–160. [Google Scholar] [CrossRef]
  44. Gaubert, S.; Raimondo, F.; Houot, M.; Corsi, M.C.; Naccache, L.; Diego Sitt, J.; Hermann, B.; Oudiette, D.; Gagliardi, G.; Habert, M.O.; et al. EEG evidence of compensatory mechanisms in preclinical Alzheimer’s disease. Brain A J. Neurol. 2019, 142, 2096–2112. [Google Scholar] [CrossRef]
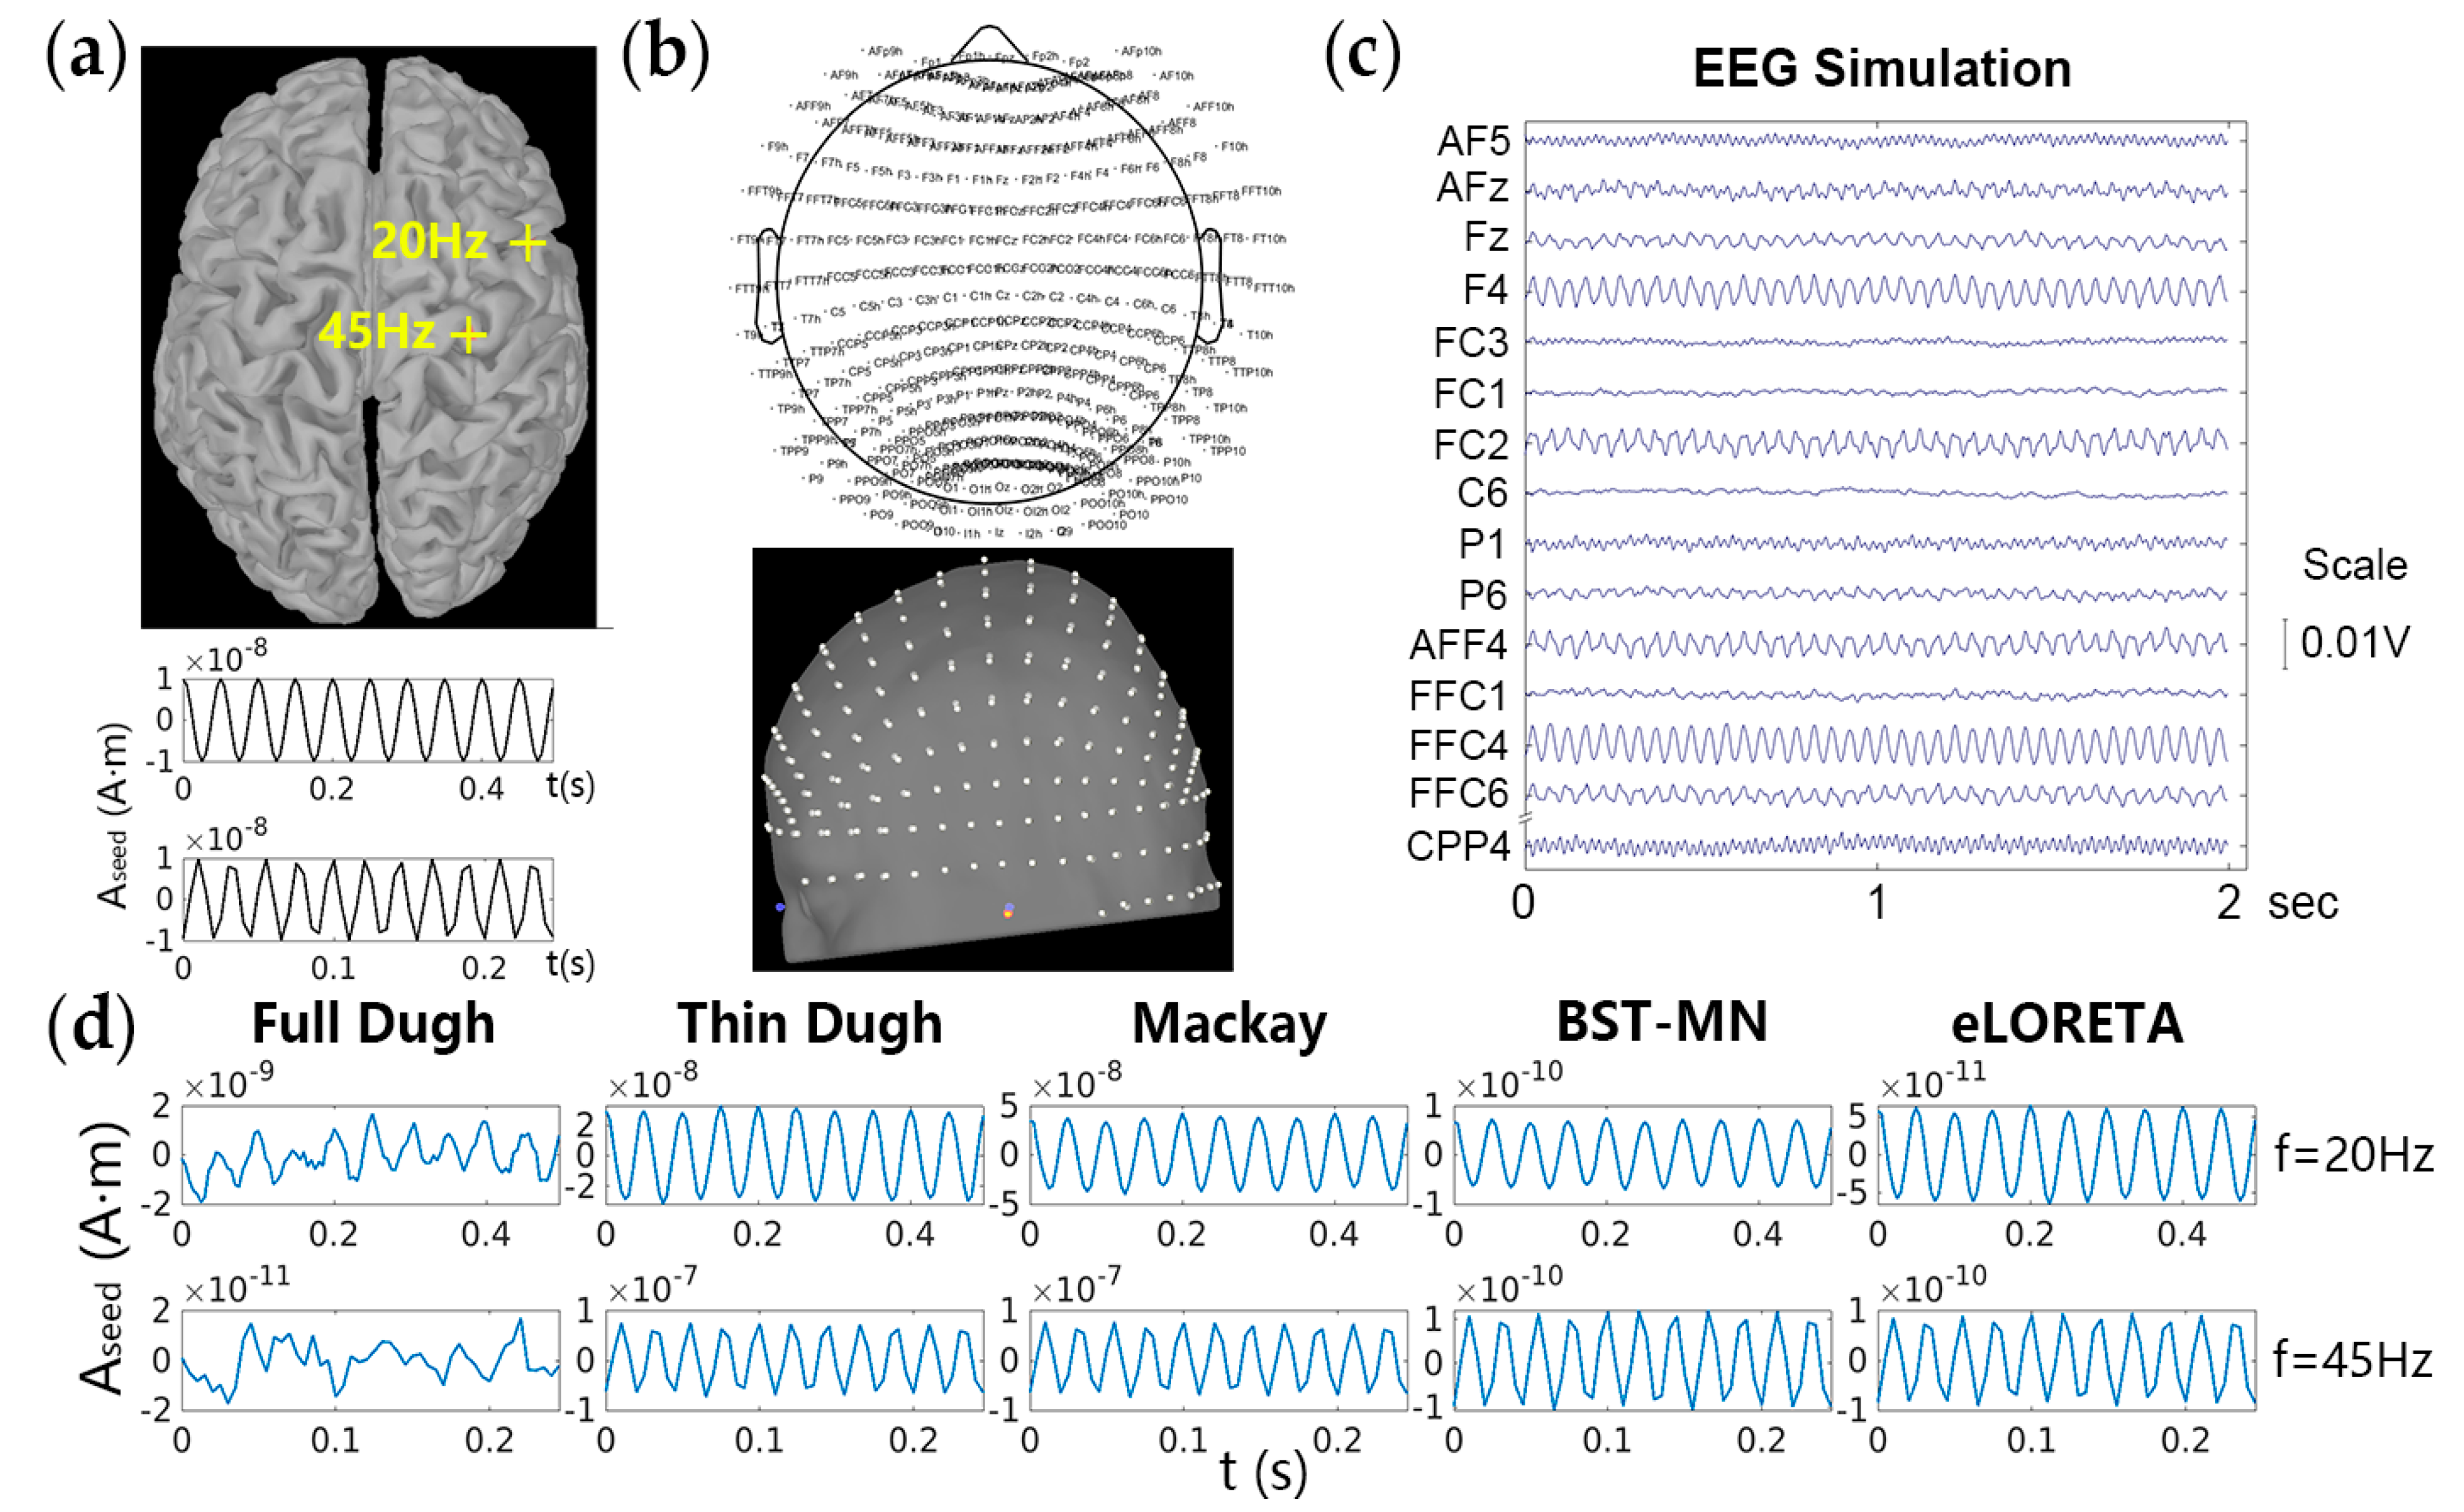
Figure 1. (a) The cortical location and temporal activities of two simulated cortical seeds (20 Hz and 45 Hz sinewave); (b) Two-dimensional plot and head MRI registration on the positions of 321 simulated EEG scalp electrodes, displayed as white globules (3 colored globules represent the location of nasion, left ear and right ear, respectively); (c) Simulated input EEG signal for EEG source localization algorithms; (d) Recovered seed temporal activities of five source localization algorithms to be evaluated.
Mathematics 11 02450 g001
Figure 2. (a) Potential amplitudes at scalp electrode positions ( A s i g n a l ) with respect to the Euclidean distance between the EEG source within the lateral occipital region (of left hemisphere) and 321 scalp electrodes ( D S o u r c e E l e c t r o d e ) and the frequency of the EEG source ( F S o u r c e ). Different colors represent different frequencies; (b) Potential amplitudes at scalp electrode positions ( A s i g n a l ) with respect to the Euclidean distance between specific EEG sources and 321 scalp electrodes ( D S o u r c e E l e c t r o d e ). The single source is located within the lateral occipital region, the isthmus cingulate region (both belong to the left hemisphere) and the temporal pole region (of the right hemisphere), respectively.
Mathematics 11 02450 g002
Figure 3. Assessment on source space spatiotemporal reconstruction across 30 Monte Carlo simulations, shown as mean ± SEM (standard error of the mean): (a) Distribution discrepancy (DD) between the normalized source energies of original and recovered source space; (b) Normalized mean square error (MSE) between original and recovered source activities; (c) Relative mean square error (RMSE) between original and recovered source activities.
Mathematics 11 02450 g003
Figure 4. Cumulative distribution function (cdf) of normalized source energies (dashed line represents the simulated original cdf of normalized source energies) in one Monte Carlo simulation. Inset presents zoom-in on the top left corner.
Mathematics 11 02450 g004
Figure 5. Assessment on source spatial localization across 30 Monte Carlo simulations, shown as mean ± SEM: (a) Localization error (LE) between the original seed and the recovered seed; (b) Spatial dispersion (SD) of the recovered 20 Hz active zone upon the original 20 Hz active zone in the source space; (c) SD of the recovered 45 Hz active zone upon the original 45 Hz active zone in the source space.
Mathematics 11 02450 g005
Figure 6. Estimated source seed positions across 30 Monte Carlo simulations, illustrated as probability maps. Blue cross indicates the positions of the simulated original seeds.
Mathematics 11 02450 g006
Figure 7. Assessment on source space spatiotemporal reconstruction upon five SNR settings, shown as mean ± SEM: (a) Normalized mean square error (MSE); (b) Relative mean square error (RMSE) between original and recovered source activities; (c) Distribution discrepancy (DD) between the normalized source energies of original and recovered source space.
Mathematics 11 02450 g007
Figure 8. Localization error (LE) between the original seed and the recovered seed upon five SNR settings, shown as mean ± SEM: (a) 20 Hz seed; (b) 45 Hz seed.
Mathematics 11 02450 g008
Figure 9. Spatial dispersion (SD) of the recovered active zone upon the original active zone in the source space upon five SNR settings, shown as mean ± SEM: (a) Original active zone definition is based on Euclidean distance; (b) Original active zone definition is based on distribution of source energies.
Mathematics 11 02450 g009
Figure 10. Assessment across 150 Monte Carlo simulations on source spatial localization when the seeds are located in different brain regions (lobes), shown as mean ± SEM.
Mathematics 11 02450 g010
Figure 11. Assessment across 450 Monte Carlo three-seed simulations on the source spatiotemporal recovery of eLORETA, thin Dugh and Maskay, shown as mean ± SEM. The three seeds are located in brain regions of varying depth.
Mathematics 11 02450 g011
Figure 12. Seed localization error (LE) of eLORETA, thin Dugh and Maskay, shown as mean ± SEM. The three seeds are all located in deep brain regions (with a minimum distance of d > 70 mm from the EEG cortical source to the scalp electrodes).
Mathematics 11 02450 g012
Figure 13. Seed localization error (LE) of eLORETA, thin Dugh and Maskay, shown as mean ± SEM. The three seeds are all located in middle-depth brain regions (with a minimum distance of 35 mm < d < 55 mm from the EEG cortical source to the scalp electrodes).
Mathematics 11 02450 g013
Figure 14. Seed localization error (LE) of eLORETA, thin Dugh and Maskay, shown as mean ± SEM. The three seeds are all located in superficial brain regions (with a minimum distance of d < 20 mm from the EEG cortical source to the scalp electrodes).
Mathematics 11 02450 g014
Figure 15. Spatial dispersion (SD) of active zones of different frequencies, compared among eLORETA, thin Dugh and Maskay, shown as mean ± SEM. The three seeds are all located in deep brain regions (with a minimum distance of d > 70 mm from the EEG cortical source to the scalp electrodes).
Mathematics 11 02450 g015
Figure 16. Spatial dispersion (SD) of active zones of different frequencies, compared among eLORETA, thin Dugh and Maskay, shown as mean ± SEM. The three seeds are all located in middle-depth brain regions (with a minimum distance of 35 mm < d < 55 mm from the EEG cortical source to the scalp electrodes).
Mathematics 11 02450 g016
Figure 17. Spatial dispersion (SD) of active zones of different frequencies, compared among eLORETA, thin Dugh and Maskay, shown as mean ± SEM. The three seeds are all located in superficial brain regions (with a minimum distance of d < 20 mm from the EEG cortical source to the scalp electrodes).
Mathematics 11 02450 g017
Table 1. Configurations of the “triple-seed” signals superimposed with multiple frequencies.
SeedsSeed PositionsSeed Frequencies and Amplitudes
1Random point on the cortex from either the left or the right hemisphere.Low-frequency bands (0.2 Hz, 0.7 Hz, 3 Hz, and 5 Hz) with amplitudes of 20 nA·m and random initial phases for each frequency.
2Random point on the cortex from the opposite hemisphere of Seed 1.High-frequency bands (11 Hz, 17 Hz, 43 Hz, and 67 Hz) with amplitudes of 10 nA·m and random initial phases for each frequency.
3Random point on the cortex from either the left or the right hemisphere.Randomly choose two frequencies from the low-frequency bands with amplitude of 20 nA·m.
Randomly choose two frequencies from the high-frequency bands with amplitude of 10 nA·m.
Set random initial phases for each frequency.
Disclaimer/Publisher’s Note: The statements, opinions and data contained in all publications are solely those of the individual author(s) and contributor(s) and not of MDPI and/or the editor(s). MDPI and/or the editor(s) disclaim responsibility for any injury to people or property resulting from any ideas, methods, instructions or products referred to in the content.