Article

The Evolution of Cooperation in Multigames with Uniform Random Hypergraphs

1
School of Cyberspace, Hangzhou Dianzi University, Hangzhou 310018, China
2
Experimental Center of Data Science and Intelligent Decision-Making, Hangzhou Dianzi University, Hangzhou 310018, China
3
School of Network Security, Changchun University, Changchun 130022, China
4
Zhuoyue Honors College, Hangzhou Dianzi University, Hangzhou 310018, China
*
Authors to whom correspondence should be addressed.
Mathematics 2023, 11(11), 2409; https://doi.org/10.3390/math11112409
Submission received: 2 May 2023 / Revised: 18 May 2023 / Accepted: 19 May 2023 / Published: 23 May 2023
(This article belongs to the Special Issue Game Theory and Complex Networks)

Abstract

:
How to explain the emergence of cooperative behavior remains a significant problem. As players may hold diverse perceptions on a particular dilemma, the concept of multigames has been introduced. Therefore, a multigame is studied within various binary networks. Since group structures are common in human society and a person can participate in multiple groups, this paper studies an evolutionary multigame with high-order interaction properties. For this purpose, a uniform random hypergraph is adopted as the network structure, allowing players to interact with all nodes in the same hyperedge. First, we investigate the effect of the multigame payoff matrix differences on the evolution of cooperation and find that increasing the differences in the payoff matrix promotes cooperation on the hypergraph network. Second, we discover that an increase in the average hyperdegree of the hypergraph network promotes network reciprocity, wherein high-hyperdegree nodes influence surrounding nodes to form a cooperator cluster. Conversely, groups with a low hyperdegree are more susceptible to betrayal, leading to a decline in cooperation.

1. Introduction

According to the theory of evolution, living organisms evolve through the process of natural selection, which is based on the concept of “survival of the fittest” [1]. This struggle for survival can lead to personal selfishness, or egoism. However, cooperative behavior has been widely observed in both animal and human societies. Therefore, understanding the origin of cooperative behavior in these societies has been a challenge in the fields of biology and sociology. Exploring the mechanisms that foster the development and diffusion of cooperative behavior is a long-standing and stimulating topic in the natural and social sciences [2,3,4,5,6].
Maynard Smith and Price proposed the concepts of evolutionary games and evolutionary stable strategies, known as evolutionary game theory, inspired by biological evolution [7]. Evolutionary game theory, based on the concept of limited rationality, provides a powerful framework for exploring cooperative behavior, and it has been widely considered as a theory for solving puzzles, especially social dilemmas [8,9]. In social dilemmas, such as the prisoner’s dilemma and the snowdrift game, defection is the best strategy for the individual, while cooperation is the best strategy for achieving the highest social welfare [1]. Consequently, the social dilemma captures the essence of the problem. This theory has spurred a large body of research on the mechanisms that shape cooperative behavior, including teaching activity [10,11], memory [12,13,14], reputation [15,16], reward [17,18], and punishment [19,20].
Influenced by various environments and cultures, different participants may perceive a particular dilemma differently. As a response, scholars have explored the use of multigame environments to represent these scenarios more accurately. These environments allow for the use of different payoff matrices by different players. Wang et al. [21] were among the first researchers to investigate evolutionary multigames within structured populations. They observed that participants on a square lattice network could utilize different payoff matrices, such as the prisoner’s dilemma and the snowdrift game, and discovered that heterogeneity in the payoff enhances the network’s reciprocation, leading to the development of cooperation. Since then, several studies based on multigames have been proposed. For example, Chowdhury et al. [22] introduced the punishment mechanism in a multigame and found that cooperative behavior can be promoted by reducing the payoff of the defector. Deng et al. [23] studied multigames over interdependent networks and found that diversity in sucker payoffs and biases in the utility function can promote cooperation on each network to some extent. Additionally, many other mechanisms in the domain of multigames have been proposed, such as learning costs [24], memory [25], mutation [26], desire-driven behavior [27], perturbations payoff [28], and others [29,30,31].
Many studies on multigames rely on classical networks with binary interactions between players. However, in reality, groups are prevalent structures, as individuals frequently interact in groups and can participate in multiple groups. These characteristics enable higher-order interactions between multiple individuals beyond traditional binary interactions. Hypergraphs with higher-order interactions are better suited for modeling such interactions, however, until now, to the best of our knowledge, there has been no research to study the evolution of cooperation in the domain of multigames based on hypergraph networks, which makes this a meaningful study. In fact, some scholars have already conducted research on evolutionary games based on higher-order interaction networks [32,33,34,35,36]. For instance, Alvarez et al. [37] demonstrated that the public goods game on hypergraphs is entirely consistent with the replication dynamics in the mixed limit. They also explored the synergy factors in collective risk games over higher-order interaction networks [38]. In this paper, we investigate the impact of higher-order interaction networks on cooperative behavior in multigames by using a uniform random hypergraph as the network structure. To accommodate group interactions in the game mode, we extend the interaction mode of multigames, enabling players to interact with all group members and calculate their payoffs. Our study employs different payoff matrices, namely, the widely studied prisoner’s dilemma and snowdrift game, to represent players with different perception mechanisms. To model the strategy update mechanism, we utilize the Fermi function [39].
The paper is organized into several sections. Section 2 outlines our model, which considers the hypergraph’s network structure and evolutionary multigame. In Section 3, we present a comprehensive analysis of our simulation results, including differences in multigame matrices and changes in network structure. Finally, Section 4 provides a conclusion to the article.

2. Model

This section provides a detailed introduction of our model, comprising two main parts: the hypergraph structure and the evolutionary multigame model. We explain the key features of the evolutionary multigame model, including the payoff matrix, payoff function, and strategy update mechanism.

2.1. Hypergraph Structure

Hypergraphs are a type of graph that goes beyond typical binary interactions, as they permit the representation of intricate structures and relationships. Unlike traditional graphs, which exclusively connect two nodes with an edge, hypergraphs link several vertices with a hyperedge. Consequently, hypergraphs employ hyperlinks to join multiple nodes, allowing for more adaptable and nuanced connections between them. In other words, hypergraphs offer a more versatile approach to portraying relationships and interactions in complex systems.
Hypergraphs were first introduced by Berge [40] as a means of representing complex structures and relationships. They are defined as a set of nodes and hyperedges denoted as H = ( V , L ) . Nodes in the hypergraph are represented as V = { v 1 , v 2 , , v N } , while hyperedges, which represent connections between nodes, are represented as L = { l 1 , l 2 , , l L } . A hyperedge, also called a hyperlink, contains g nodes in V, forming a g o r d e r group. g represents the number of nodes in the specific hyperedge. Nodes that are connected by the same hyperedge are considered adjacent. Moreover, if two hyperedges share at least one node, they are considered adjacent as well. k i g indicates the number of hyperlinks that contain g nodes among the hyperlinks in which node i participates. Thus, the hyperdegree of node i is k i = g m i n g m a x k i g , where g m i n and g m a x represent the hyperedges with the minimum and maximum order of node i, respectively. In our study, we utilized the uniform random hypergraph (URH) as the network structure. The URH structure preserves the high-order interaction properties of hypergraphs while simplifying our modeling and network description process. The subsequent sections will clarify the definition of the URH and its generation.
Uniform random hypergraph: G-order uniform random hypergraphs differ from general hypergraphs in that each hyperedge contains a fixed number of G nodes, G is the order of the URH, and the generation of hyperedges is random, with each hyperedge having an equal probability of being selected. To generate the URH, we utilized Wang’s proposed method [41], which involves constructing a tree structure for selecting nodes and generating a random number to determine a hyperedge. This method is flexible as it considers all node combinations and has high computational efficiency. Figure 1 shows a schematic diagram of a G = 3 URH, indicating that each hyperlink in the hypergraph contains 3 nodes.

2.2. Evolutionary Multigames

Payoff matrix: In a network, players are provided with a set of strategies, denoted by s, that includes two options: cooperation (C) and defection (D). At the start of the evolution, players are equally likely to select any of the options. As the evolution proceeds, these players participate in games based on their chosen strategies. If both players opt for cooperation, they both receive a reward, denoted by R. Conversely, if both players choose to defect, they both receive punishment, represented as P. In the case where a cooperator interacts with a defector, the defector gets a temptation payoff of T, while the cooperator receives a sucker’s payoff of S.
The perspectives of individual players can vary significantly when faced with a dilemma. Therefore, we offer two distinct game mechanisms to players: the prisoner’s dilemma (PD) and the snowdrift dilemma (SD). These two game paradigms are well-established and have been extensively researched by experts in the field. We assigned different S values to each mechanism to reflect players’ distinct perceptions, allowing us to study the effects of these differences on strategic decision making and cooperation within the network.
The prisoner’s dilemma is a well-known model that illustrates the challenges of cooperative behavior. It shows that cooperative individuals may face the risk of exploitation, while defectors may have a selective advantage. The game involves two players who must make simultaneous decisions about whether to cooperate or defect. If one player cooperates while the other defects, the defector receives the highest payoff of T while the cooperator experiences a negative payoff of S . The payoffs follow the ranking of T > R > P > S . The game’s consequences suggest that defection is an evolutionarily stable strategy, which often leads to a severe social dilemma. The snowdrift game is a biologically intriguing alternative to the conventional prisoner’s dilemma. The critical distinguishing factor between these games lies in the sequence of payoffs, with the snowdrift game featuring a hierarchy of T > R > S > P . This reversal of payoffs has substantial implications for determining the best strategy, which should differ from the opponent’s strategy. Consequently, it may allow for prolonged cooperation. Therefore, the snowdrift game is a valuable instrument for investigating moderate social dilemmas.
This paper defines the parameters for the prisoner’s dilemma game (PDG) and snowdrift dilemma game (SDG) as follows: R = 1 , T = b > 1 , and  P = 0 . The value of S is determined by the specific game, with  S = θ in the PDG and S = θ in the SDG. The range of θ is set as [ 0 , 1 ] , with R and P being fixed parameters, and b and θ being free parameters. Thus, the payoff matrix for players in the SDG and PDG can be expressed as follows:
P D = 1 θ b 0 S D = 1 θ b 0 .
Payoff function: To simulate evolutionary dynamics in our model, we use Monte Carlo simulations. During a paired game interaction, each player plays a game with every player in each hyperlink where they exist, based on their perception mechanism. Afterward, the resulting payoffs are aggregated and averaged to obtain the normalized payoff P i for each player.
P i = j = 1 ( g 1 ) k i s i 1 s i × M i × s j 1 s j k i .
P i denotes the payoff of player i, and  M i represents their payoff matrix. j refers to player i’s neighboring player, with  s i and s j representing their respective strategies. Additionally, k i refers to the hyperdegree of player i, which indicates the number of hyperlinks.
Strategy update mechanism: During the evolution process, rational players often adopt the strategy of their higher-earning neighbors, with a certain probability, to increase their own payoffs. If neighbor j has a different strategy from player i, the probability of player i adopting the strategy of neighbor j can be determined using the Fermi function [39]:
W ( s i s j ) = 1 1 + exp ( P i P j K ) .
In this context, P i and P j denote the current payoff of players i and j, respectively, while K represents the noise factor that reflects the level of irrationality exhibited by individuals when updating their information. As K approaches zero, individuals become more rational and tend to learn from high-earning groups. Typically, a K value of 0.1 is used in research [24,39,41,42], allowing for meaningful comparisons and contributing to a better understanding of the phenomenon.
Algorithm 1 summarizes the Monte Carlo process used to model the interactions of the entire evolutionary multigame system.
Algorithm 1 Monte Carlo simulation
Mathematics 11 02409 i001

3. Results and Discussion

This study reports the outcomes of 200,000 Monte Carlo simulations on a hypergraph comprising 5000 nodes. In the game’s initial stage, players are divided equally between two perception types, PD and SD. They randomly choose to cooperate or defect with equal probabilities. The settings of these nodes and the number of iterations guarantee the convergence and stability of the final outcome. Our analysis of the empirical findings has two objectives. Firstly, we investigate the influence of multigame matrix differences on the evolution of cooperation. Secondly, we examine the effect of variations in the hypergraph structure on the evolution of cooperation. We provide relevant illustrations to support our findings at the microscopic level.

3.1. The Impact of Multigame Matrix Differences on the Evolution of Cooperation in Hypergraphs

The players are divided into two groups, with half playing PD games and the other half playing SD games. The strength of each game is determined by the difference in the multigame payoff matrix. More specifically, the parameter θ in the multigame model distinguishes between PD and SD players. When θ equals zero, the game is weak and the players are homogeneous. However, as θ increases, the population structure tends towards heterogeneity. As a result, this study aims to analyze the impact of θ on the evolution of cooperation in hypergraph networks. To illustrate this impact, we create a plot presenting the relationship between θ and the proportion of cooperators in Figure 2. In Figure 2a,b, we demonstrate multigames played on G = 3 and G = 7 hypergraph networks, respectively, with b = 1.2 (defector’s temptation payoff). Our analysis of Figure 2 yields the following results.
Figure 2 illustrates the outcomes of an evolutionary multigame played on a hypergraph. The results show that a higher value of θ leads to an increase in cooperative behavior among both SD and PD players, resulting in a higher fraction of cooperators. Notably, although increasing θ decreases the payoff for the PD sucker, it also leads to an increase in the fraction of cooperators among all PD players. The results indicate that increasing the heterogeneity of the multigame environment is associated with greater effectiveness in fostering cooperation.
Figure 2a,b demonstrate that the observed phenomena hold true for hypergraph network structures with G = 3 and G = 7 . These findings suggest that the impact of the parameter θ on the evolutionary multigame is consistent across various hypergraph networks, with our experiments on multiple hypergraphs demonstrating the robustness of our results. Furthermore, our study indicates that the effects of θ on square lattice networks, as documented in Wang’s paper [21], hold true for hypergraph networks as well.

3.2. The Impact of Network Structure on the Evolution of Cooperation in Hypergraphs

3.2.1. The Influence of G and L on the Fraction of Cooperators

In the previous section, it was established that a heterogeneous multigame environment on a hypergraph can encourage cooperation. This section focuses on investigating the impact of the hypergraph network structure on cooperation evolution. Specifically, in the URH, the parameters G and L define the hypergraph network structure. G denotes the number of nodes in each hyperlink, and L represents the total number of hyperlinks in the hypergraph. Our study explores the effects of various hypergraphs with different G and L values on the fraction of cooperators. The experimental outcomes are illustrated in Figure 3.
Figure 3 illustrates the impact of G and L on the fraction of cooperators in an evolutionary multigame. Varying combinations of G-L parameters result in hypergraphs with diverse structures when the number of nodes remains constant. By increasing either G or L in a monotonic manner, the hyperedge can accommodate more nodes or generate additional hyperedges, thereby increasing the average hyperdegree of hypergraph. The colors in the heatmap correspond to the fraction of cooperators in the steady state. It can be observed that increasing either G or L of the hypergraph also increases the fraction of cooperators ( f c ). The upper right corner of the figure, represented by the dark red area, signifies the highest values of G and L, which correspond to the highest fraction of cooperators. Conversely, the lower left corner, represented by the dark blue area, indicates the lowest values of G and L, associated with the lowest fraction of cooperators. These findings indicate that modifying the hypergraph structure can significantly influence the outcome of an evolutionary multigame. Consequently, this motivates us to delve deeper into the correlation between the hyperdegree and the fraction of cooperators. The subsequent section will elaborate on the relationship between the hyperdegree and cooperation, as well as investigating the impact of the hyperdegree on cooperation.

3.2.2. Exploring the Impact of Hyperdegree on the Evolution of Cooperation

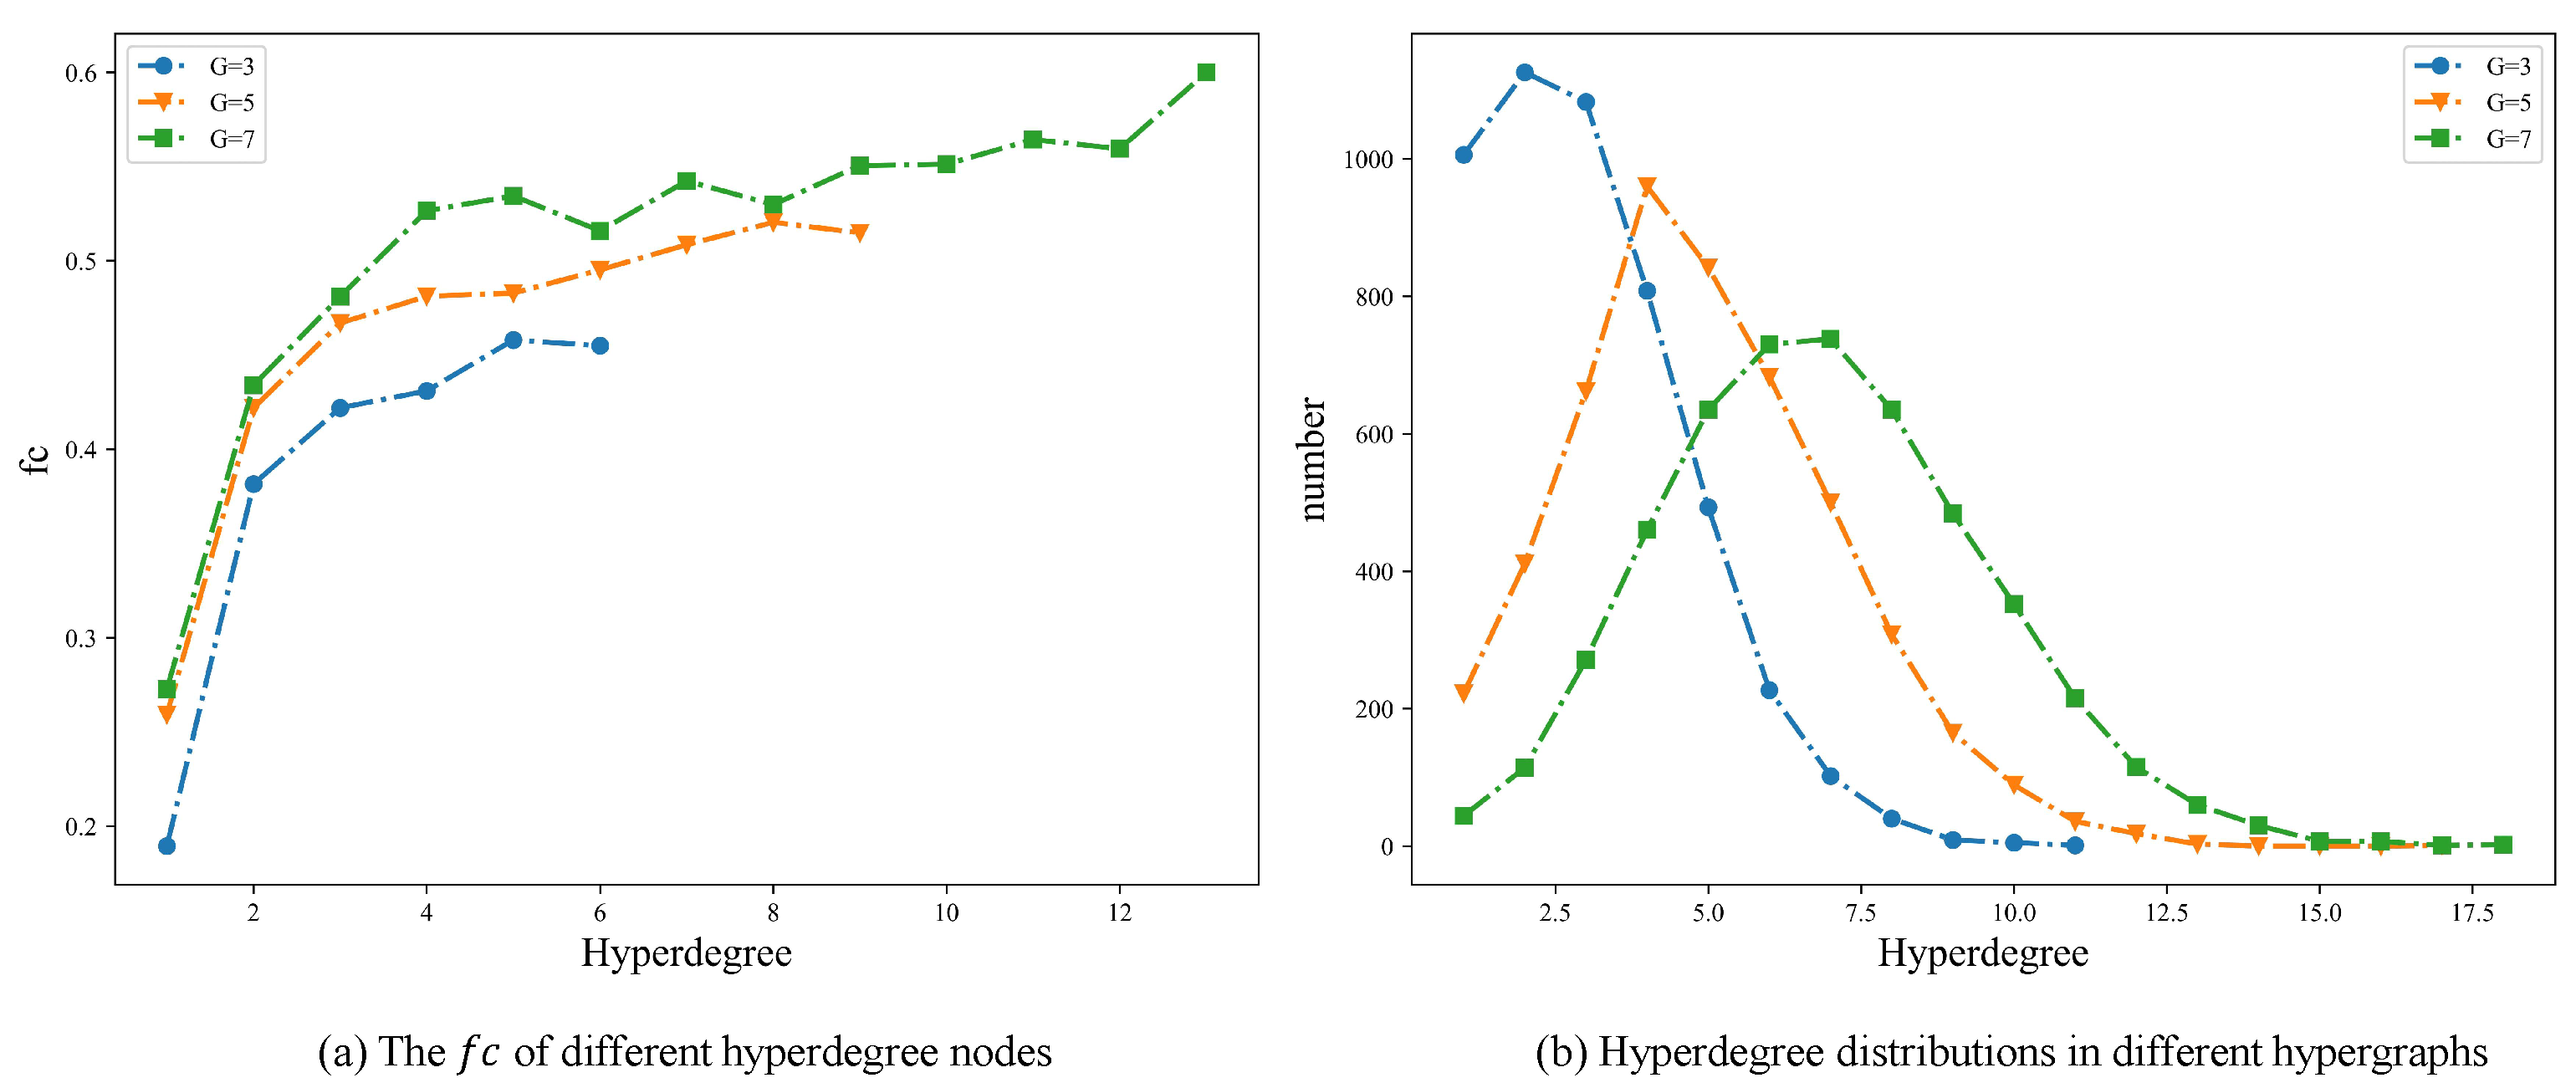
In the previous section, it was observed that when modifying the network structure of the hypergraph by increasing the average hyperdegree, the final proportion of cooperators increased. To gain further insight into how changes in the hyperdegree influence the collective behavior of nodes, we calculated the cooperator ratios of nodes with varying hyperdegrees, as depicted in Figure 4a. The hyperedges in the hypergraph were randomly selected, and the hyperdegree distribution of the nodes is illustrated in Figure 4b, showing a Poisson-like distribution.
Figure 4a illustrates that in the evolution of cooperation, nodes with high hyperdegree exhibit a greater propensity for cooperation compared to those with low hyperdegree. Since high-hyperdegree nodes can connect multiple hyperedges, their behaviors can significantly affect the selection of neighboring nodes. Hence, our next objective is to measure and evaluate the influence of these nodes on their surrounding nodes.
The influence is defined as the probability of the node’s neighbors imitating its strategy within a specific time frame, calculated as the ratio of successful imitation counts to the total number of imitations attempted. The nodes are then ranked based on their hyperdegree, and two categories are created: high-hyperdegree groups and low-hyperdegree groups, each comprising 20 % of the nodes with the highest and lowest hyperdegrees, respectively. The influence of these two groups is quantified and illustrated in Figure 5.
Based on the results depicted in Figure 5, we calculated the average influence of node groups that employed diverse strategies. Specifically, in the low-hyperdegree-node group (a), cooperators exhibit an influence of 34 % , whereas defectors exhibit an influence of 82 % . In contrast, in the high-hyperdegree-node group (b), cooperators demonstrate an influence of 45 % , while defectors show an influence of 43 % . These findings indicate that defectors exert significantly stronger influence than cooperators in low-hyperdegree nodes, whereas cooperators have a slightly greater impact than defectors in high-hyperdegree nodes. High-hyperdegree nodes, which serve as hub nodes connecting multiple hyperedges, exert a greater influence on their neighboring nodes. As a result, cooperative behavior in these high-hyperdegree nodes is more likely to be emulated by their neighbors, leading to the formation of a cooperator cluster centered on the hub nodes. These results highlight the crucial role that high-hyperdegree nodes play in promoting the development of cooperation.
Overall, the aforementioned studies exhibit the variation in the evolution of cooperation depending on the node’s hyperdegree. During the evolution process on hypergraphs, nodes with a higher hyperdegree exhibit a greater tendency to cooperate and subsequently influence neighboring nodes to adopt cooperative actions, leading to the creation of cooperative clusters with these high-hyperdegree nodes at the center. Conversely, low-hyperdegree nodes are more prone to imitating defection behavior, thereby causing the group to succumb to the pitfall of defection.

3.2.3. Microcosmic Analysis of Node Evolution with Varied Hyperdegrees

In the preceding section, it was discovered that nodes with high hyperdegree demonstrate a greater inclination towards cooperation, and their cooperative behavior is more readily emulated by adjacent nodes. To clarify this pattern, we gathered evolutionary data from node clusters exhibiting various hyperdegrees. Through this process, we derived general evolutionary principles and expounded on the underlying mechanisms from a microscopic perspective.
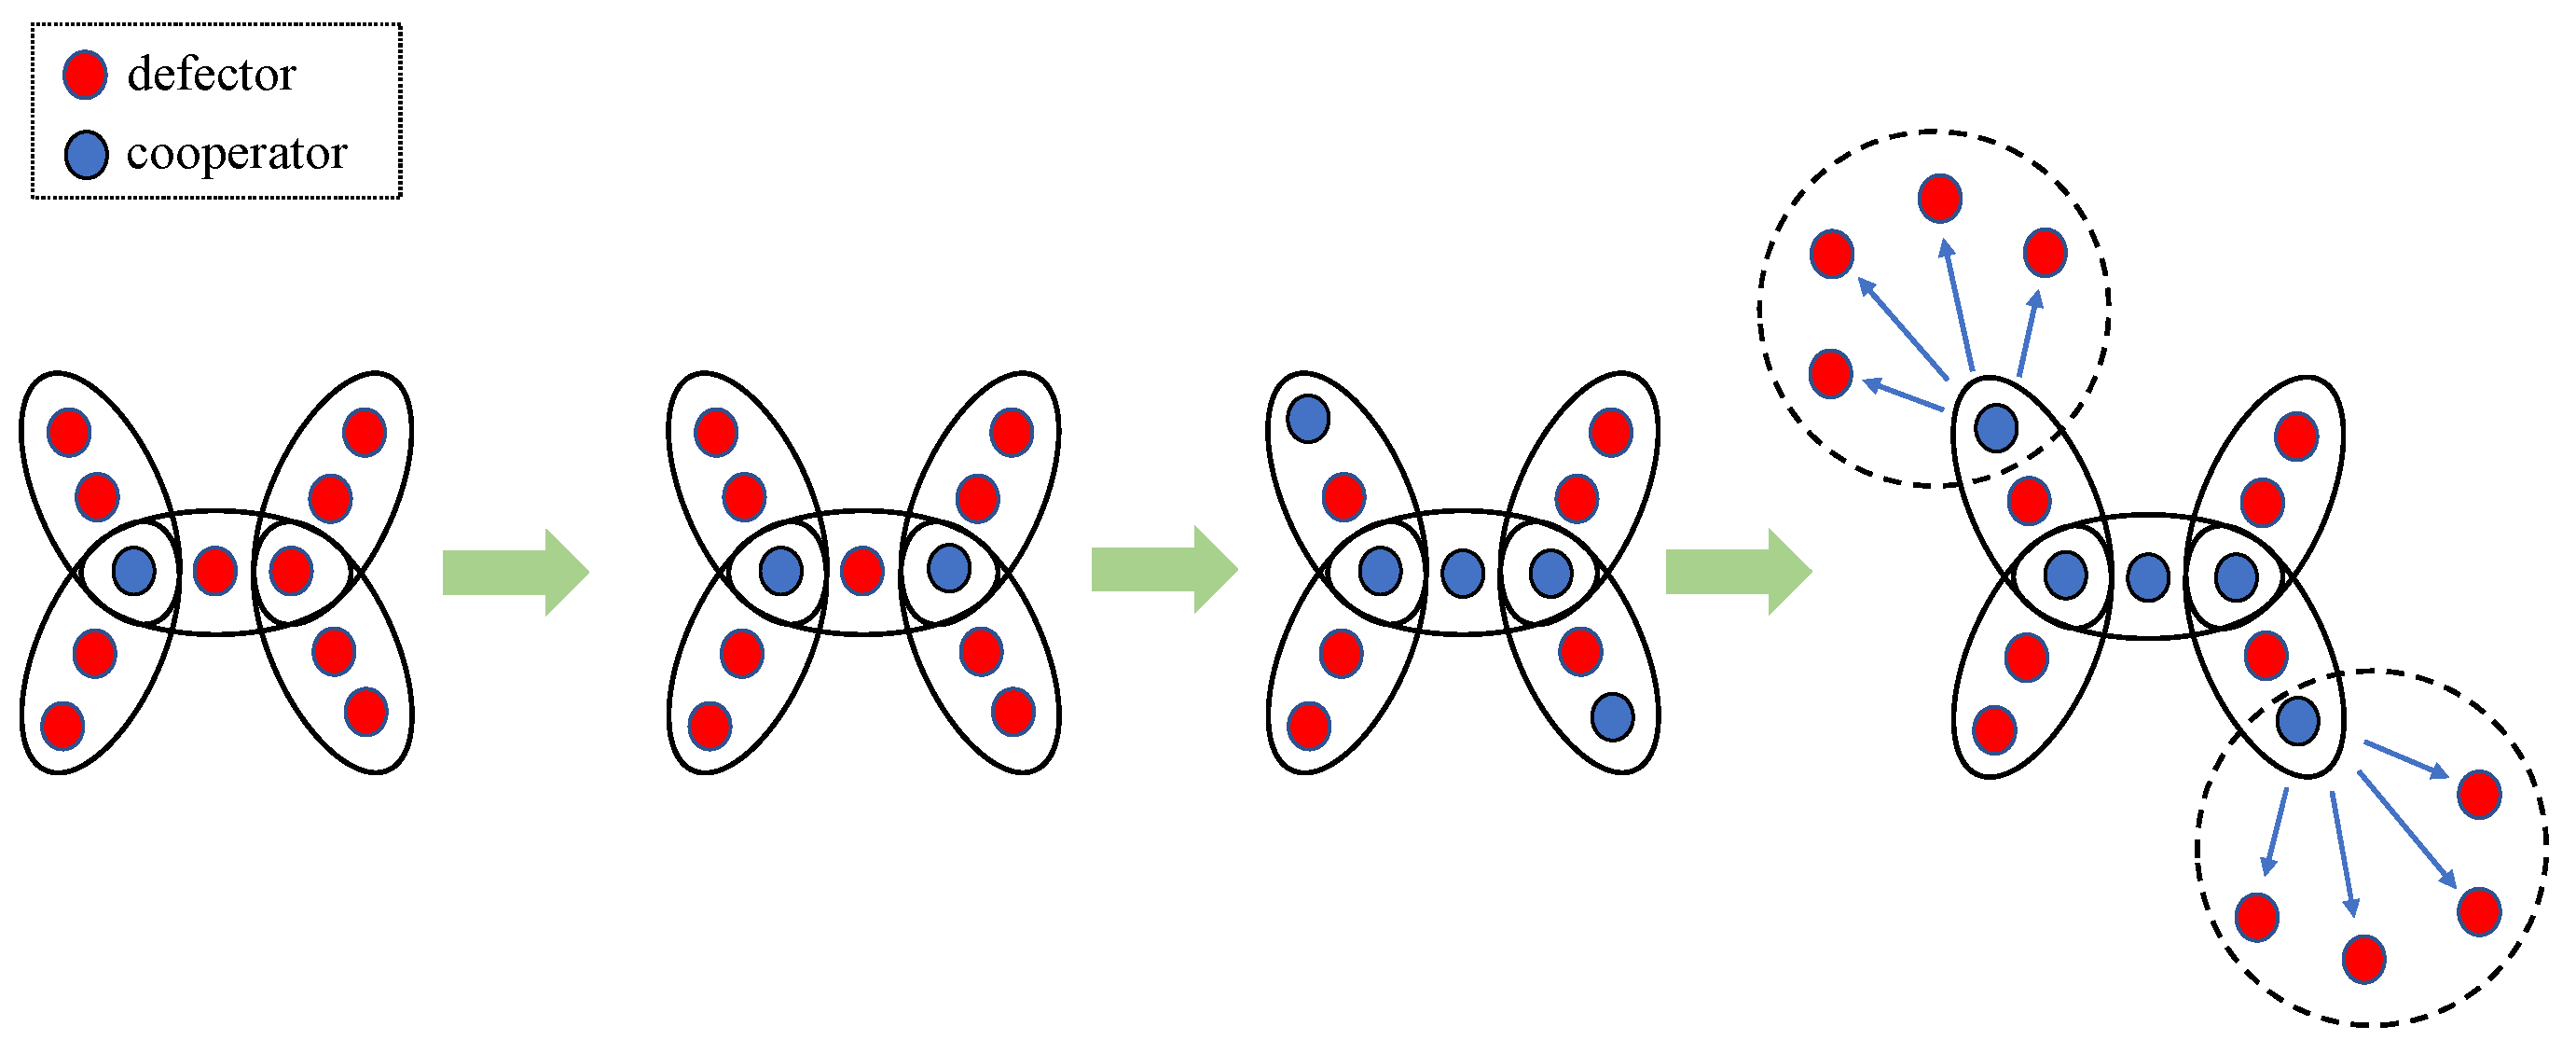
Firstly, this paragraph presents how cooperation among nodes with high hyperdegree evolves over time, as shown in Figure 6. The diagram illustrates how high hyperdegree facilitates cooperation. Initially, when defectors increase, the payoff of most nodes decreases. However, a small group of cooperators within the same group, particularly those using SD perception, can still earn a high payoff and influence their neighboring nodes. This results in a trustworthy cluster of cooperators that prevents the spread of betrayal. This cluster is then linked to other clusters through hyperedges to disseminate information about cooperative behavior.
Secondly, we will demonstrate the evolution of a low-hyperdegree group falling into the defection pitfall through a schematic diagram, as shown in Figure 7. In groups with low-hyperdegree nodes, defect behaviors tend to be prevalent, making the formation of cooperative clusters challenging. Low-hyperdegree nodes can maintain a high income as long as a small number of cooperators are present in the hyperedges, which explains this evolutionary difference. In contrast, high-hyperdegree nodes require a significant number of cooperators in all hyperedges to maintain the same normalized payoff. Therefore, defectors face greater difficulty in surviving in high-hyperdegree nodes. Additionally, the absence of connections to outgroups in low-hyperdegree nodes makes obtaining information on cooperative behavior challenging, leading to an evolutionary trap if there is a completed defection.

4. Conclusions

This study investigates an evolutionary multigame over networks with higher-order interactions from two perspectives: multigame payoff matrix difference and network structure. Firstly, we modify the parameter θ to affect the difference of the multigame payoff matrix. Specifically, when θ is set to 0, the population structure is homogeneous. As θ increases, the population structure tends to become more heterogeneous, with two types of people in society becoming more extreme: those who tend to cooperate more (SD players) and those who are more selfish (PD players). An increase in θ boosts the SD cooperators, leading to an asymmetric imitation level [21]. By improving the cooperative behavior of SD players, PD players imitate and learn their behavior, ultimately improving the overall level of network reciprocity. Secondly, we investigate the impact of modifying the network structure of the hypergraph on cooperation evolution. Our findings demonstrate that raising the average hyperdegree of hypergraph networks can boost cooperation among participants in a network, fostering cooperative behavior. Furthermore, our studies reveal that nodes with high hyperdegree are more likely to choose cooperation during the evolution of cooperation, leading to the creation of cooperative clusters for greater rewards. These high-hyperdegree nodes serve as network hubs, with the ability to organize multiple groups. High-hyperdegree nodes correspond to large companies that have significant enterprise scale and industry influence with high anti-risk capability. These top companies are more inclined to increase their overall revenue by enhancing their innovation capabilities and engaging in multi-party convergent cooperation. Conversely, low-hyperdegree nodes correspond to small-scale companies and organizations with weak risk management ability, and their choices are predominantly cautious and imitative.
Our study emphasizes the significance of enhancing group connectivity to address social dilemmas and create cooperative clusters in high-order interaction populations. This paper aims to stimulate further investigations into multigames on hypergraphs and examine approaches that promote cooperative behavior under emerging interaction types. In the future, more complex hypergraph network structures can be employed to delve deeper into the game theory of higher-order interactions.

Author Contributions

Conceptualization, H.X., X.J. and Z.W.; Methodology, X.J. and J.W.; Software, H.X. and Y.Z.; Formal analysis, H.X., Y.Z., J.W. and Z.W.; Writing—original draft, H.X. and Y.Z.; Writing—review & editing, H.X. and J.W.; Funding acquisition, X.J. and Z.W. All authors have read and agreed to the published version of the manuscript.

Funding

This research received funding from the National Natural Science Foundation of China under Grant Nos. 62002092 and 62176080, as well as from the Zhejiang Provincial Natural Science Foundation of China under Grant No. LTGG23F030004.

Data Availability Statement

The data used to support the findings of this study are available from the corresponding author upon request.

Conflicts of Interest

The authors declare that there are no conflict of interest regarding the publication of this paper.

References

  1. Axelrod, R.; Hamilton, W.D. The evolution of cooperation. Science 1981, 211, 1390–1396. [Google Scholar] [CrossRef] [PubMed]
  2. Perc, M.; Jordan, J.J.; Rand, D.G.; Wang, Z.; Boccaletti, S.; Szolnoki, A. Statistical physics of human cooperation. Phys. Rep. 2017, 687, 1–51. [Google Scholar] [CrossRef]
  3. Roca, C.P.; Cuesta, J.A.; Sánchez, A. Evolutionary game theory: Temporal and spatial effects beyond replicator dynamics. Phys. Life Rev. 2009, 6, 208–249. [Google Scholar] [CrossRef]
  4. Santos, F.C.; Santos, M.D.; Pacheco, J.M. Social diversity promotes the emergence of cooperation in public goods games. Nature 2008, 454, 213–216. [Google Scholar] [CrossRef] [PubMed]
  5. Traulsen, A.; Reed, F.A. From genes to games: Cooperation and cyclic dominance in meiotic drive. J. Theor. Biol. 2012, 299, 120–125. [Google Scholar] [CrossRef] [PubMed]
  6. Henrich, J.; Boyd, R.; Bowles, S.; Camerer, C.; Fehr, E.; Gintis, H.; McElreath, R. In search of homo economicus: Behavioral experiments in 15 small-scale societies. Am. Econ. Rev. 2001, 91, 73–78. [Google Scholar] [CrossRef]
  7. Smith, J.M.; Price, G.R. The logic of animal conflict. Nature 1973, 246, 15–18. [Google Scholar] [CrossRef]
  8. Weibull, J.W. Evolutionary Game Theory; MIT Press: Cambridge, MA, USA, 1997. [Google Scholar]
  9. Hofbauer, J.; Sigmund, K. Evolutionary Games and Population Dynamics; Cambridge University Press: Cambridge, UK, 1998. [Google Scholar]
  10. Liu, D.; Huang, C.; Dai, Q.; Li, H. Positive correlation between strategy persistence and teaching ability promotes cooperation in evolutionary prisoner’s dilemma games. Phys. A Stat. Mech. Appl. 2019, 520, 267–274. [Google Scholar] [CrossRef]
  11. Szolnoki, A.; Perc, M. Coevolution of teaching activity promotes cooperation. New J. Phys. 2008, 10, 043036. [Google Scholar] [CrossRef]
  12. Shu, F.; Liu, X.; Fang, K.; Chen, H. Memory-based snowdrift game on a square lattice. Phys. A Stat. Mech. Appl. 2018, 496, 15–26. [Google Scholar] [CrossRef]
  13. Shu, F.; Liu, Y.; Liu, X.; Zhou, X. Memory-based conformity enhances cooperation in social dilemmas. Appl. Math. Comput. 2019, 346, 480–490. [Google Scholar] [CrossRef]
  14. Shu, F.; Liu, X.; Li, M. Impacts of memory on a regular lattice for different population sizes with asynchronous update in spatial snowdrift game. Phys. Lett. A 2018, 382, 1317–1323. [Google Scholar] [CrossRef]
  15. Yang, H.X.; Yang, J. Reputation-based investment strategy promotes cooperation in public goods games. Phys. A Stat. Mech. Appl. 2019, 523, 886–893. [Google Scholar] [CrossRef]
  16. Wang, L.; Chen, T.; Wu, Z. Promoting cooperation by reputation scoring mechanism based on historical donations in public goods game. Appl. Math. Comput. 2021, 390, 125605. [Google Scholar] [CrossRef]
  17. Fu, M.; Guo, W.; Cheng, L.; Huang, S.; Chen, D. History loyalty-based reward promotes cooperation in the spatial public goods game. Phys. A Stat. Mech. Appl. 2019, 525, 1323–1329. [Google Scholar] [CrossRef]
  18. Fu, M.; Wang, J.; Cheng, L.; Chen, L. Promotion of cooperation with loyalty-based reward in the spatial prisoner’s dilemma game. Phys. A Stat. Mech. Appl. 2021, 580, 125672. [Google Scholar] [CrossRef]
  19. Quan, J.; Pu, Z.; Wang, X. Comparison of social exclusion and punishment in promoting cooperation: Who should play the leading role? Chaos Solit. Fractals 2021, 151, 111229. [Google Scholar] [CrossRef]
  20. Wang, Q.; Meng, H.; Gao, B. Spontaneous punishment promotes cooperation in public good game. Chaos Solit. Fractals 2019, 120, 183–187. [Google Scholar] [CrossRef]
  21. Wang, Z.; Szolnoki, A.; Perc, M. Different perceptions of social dilemmas: Evolutionary multigames in structured populations. Phys. Rev. E 2014, 90, 032813. [Google Scholar] [CrossRef]
  22. Chowdhury, S.N.; Kundu, S.; Perc, M.; Ghosh, D. Complex evolutionary dynamics due to punishment and free space in ecological multigames. Proc. R. Soc. A 2021, 477, 20210397. [Google Scholar] [CrossRef]
  23. Deng, Z.H.; Huang, Y.J.; Gu, Z.Y.; Liu, D.; Gao, L. Multi-games on interdependent networks and the evolution of cooperation. Phys. A Stat. Mech. Appl. 2018, 510, 83–90. [Google Scholar] [CrossRef]
  24. Liu, Y.; Li, Z.; Jin, X.; Tao, Y.; Ding, H.; Wang, Z. The effect of perceptions competition and learning costs on cooperation in spatial evolutionary multigames. Chaos Solit. Fractals 2022, 157, 111883. [Google Scholar] [CrossRef]
  25. Liu, C.; Guo, H.; Li, Z.; Gao, X.; Li, S. Coevolution of multi-game resolves social dilemma in network population. Appl. Math. Comput. 2019, 341, 402–407. [Google Scholar] [CrossRef]
  26. Roy, S.; Nag Chowdhury, S.; Mali, P.C.; Perc, M.; Ghosh, D. Eco-evolutionary dynamics of multigames with mutations. PLoS ONE 2022, 17, e0272719. [Google Scholar] [CrossRef]
  27. Huang, Y.J.; Deng, Z.H.; Song, Q.; Wu, T.; Deng, Z.L.; Gao, M.y. The evolution of cooperation in multi-games with aspiration-driven updating rule. Chaos Solit. Fractals 2019, 128, 313–317. [Google Scholar] [CrossRef]
  28. Amaral, M.A.; Javarone, M.A. Heterogeneity in evolutionary games: An analysis of the risk perception. Proc. R. Soc. A 2020, 476, 20200116. [Google Scholar] [CrossRef]
  29. Amaral, M.A.; Wardil, L.; Perc, M.; da Silva, J.K. Evolutionary mixed games in structured populations: Cooperation and the benefits of heterogeneity. Phys. Rev. E 2016, 93, 042304. [Google Scholar] [CrossRef]
  30. Wu, Y.; Zhang, Z.; Wang, X.; Yan, M.; Zhang, Q.; Zhang, S. Evolution of cooperation in the multigame on a two-layer square network. Appl. Math. Comput. 2021, 400, 126088. [Google Scholar] [CrossRef]
  31. Lin, Z.; Xu, H.; Fan, S. Evolutionary accumulated temptation game on small world networks. Phys. A Stat. Mech. Appl. 2020, 553, 124665. [Google Scholar] [CrossRef]
  32. Wang, C. Opinion Dynamics with Higher-Order Bounded Confidence. Entropy 2022, 24, 1300. [Google Scholar] [CrossRef]
  33. Gibbs, T.; Levin, S.A.; Levine, J.M. Coexistence in diverse communities with higher-order interactions. Proc. Natl. Acad. Sci. USA 2022, 119, e2205063119. [Google Scholar] [CrossRef] [PubMed]
  34. Li, Y.; Cheng, M.; Fujii, K.; Hsieh, F.; Hsieh, C.J. Learning from group comparisons: Exploiting higher order interactions. Adv. Neural Inf. Process. Syst. 2018, 31, 4981–4990. [Google Scholar]
  35. Battiston, F.; Cencetti, G.; Iacopini, I.; Latora, V.; Lucas, M.; Patania, A.; Young, J.G.; Petri, G. Networks beyond pairwise interactions: Structure and dynamics. Phys. Rep. 2020, 874, 1–92. [Google Scholar] [CrossRef]
  36. Gao, Z.; Ghosh, D.; Harrington, H.; Restrepo, J.; Taylor, D. Dynamics on networks with higher-order interactions. Chaos Interdiscip. J. Nonlinear Sci. 2023, 33, 040401. [Google Scholar] [CrossRef] [PubMed]
  37. Alvarez-Rodriguez, U.; Battiston, F.; de Arruda, G.F.; Moreno, Y.; Perc, M.; Latora, V. Evolutionary dynamics of higher-order interactions in social networks. Nat. Hum. Behav. 2021, 5, 586–595. [Google Scholar] [CrossRef] [PubMed]
  38. Alvarez-Rodriguez, U.; Battiston, F.; Ferraz de Arruda, G.; Moreno, Y.; Perc, M.; Latora, V. Collective Games on Hypergraphs. In Higher-Order Systems; Springer: Cham, Switzerland, 2022; pp. 377–388. [Google Scholar]
  39. Szabó, G.; Toke, C. Evolutionary prisoner’s dilemma game on a square lattice. Phys. Rev. E 1998, 58, 69. [Google Scholar] [CrossRef]
  40. Berge, C. Hypergraphs: Combinatorics of Finite Sets; Elsevier: Amsterdam, The Netherlands, 1984; pp. 1–39. [Google Scholar]
  41. Wang, Z.; Li, R.; Jin, X.; Ding, H. Emergence of Social Norms in Metanorms Game with High-Order Interaction Topology. IEEE Trans. Comput. Soc. Syst. 2022; in press. [Google Scholar] [CrossRef]
  42. Szabó, G.; Szolnoki, A. Cooperation in spatial prisoner’s dilemma with two types of players for increasing number of neighbors. Phys. Rev. E 2009, 79, 016106. [Google Scholar] [CrossRef]
Figure 1. A uniform random hypergraph for G = 3 . In this graph, the colored circles denote hyperedges in the hypergraph, while the dots and numbers represent nodes and their assigned numbers, respectively.
Mathematics 11 02409 g001
Figure 2. How the parameter θ affects the fraction of cooperators ( f c ). The parameter θ represents the difference in the payoff matrix of two players with different perceptions. The horizontal axis represents θ , while the vertical axis displays the fraction of cooperators. Three curves are plotted, corresponding to PD players, SD players, and all players. The data is presented for two hypergraphs: G = 3 and G = 7 , which are shown in (a,b). The parameter G represents the order of the hypergraph.
Mathematics 11 02409 g002
Figure 3. The heatmap illustrates the observed fraction of cooperation in the G-L parameter space of the hypergraph. The color intensity in the graph corresponds to the fraction of cooperators, with darker shades indicating higher values of f c . These results are obtained under the conditions of b = 1.2 and θ = 0.4 . The parameter b represents the temptation payoff of the defector, and θ represents the difference in the payoff matrix of two players with different perceptions.
Mathematics 11 02409 g003
Figure 4. The depicted figure illustrates the fraction of cooperators among nodes with distinct hyperdegrees. The x-axis denotes the hyperdegree, while the y-axis indicates the f c for nodes with that hyperdegree. The results of the three hypergraphs ( G = 3 , 5 , 7 ) are illustrated by three distinct curves, which uncover the correlation between node hyperdegree and cooperative behavior. Different values of G represent hypergraphs with different orders.
Mathematics 11 02409 g004
Figure 5. How node influence changes over time for both low-hyperdegree and high-hyperdegree groups, represented by (a,b), respectively. Two curves, each with a different color, show the influence of defectors and cooperators within the group. The horizontal axis represents time t, while the vertical axis represents influence, which indicates the probability of neighboring nodes adopting the group’s strategy.
Mathematics 11 02409 g005
Figure 6. An abstract evolution process, highlighting the co-evolutionary relationship among high-hyperdegree nodes. The colored dots represent nodes within the network, while the black circles signify hyperedges.
Mathematics 11 02409 g006
Figure 7. The abstract evolution of low-hyperdegree nodes in a network, with colored dots representing the nodes and black circles representing hyperedges. The arrows indicate possible pathways of evolution. Fork generation groups face an evolutionary pitfall, as they are all defectors and cannot access cooperative information.
Mathematics 11 02409 g007
Disclaimer/Publisher’s Note: The statements, opinions and data contained in all publications are solely those of the individual author(s) and contributor(s) and not of MDPI and/or the editor(s). MDPI and/or the editor(s) disclaim responsibility for any injury to people or property resulting from any ideas, methods, instructions or products referred to in the content.