Article

Stability Analysis and the Random Response of Anti-Sliding Pile for Erdaogou Landslide Considering Spatial Variability

1
College of Environment and Ecology, Chongqing University, Chongqing 400045, China
2
School of Civil Engineering, Chongqing University, Chongqing 400045, China
3
National Joint Engineering Research Center of Geohazards Prevention in the Reservoir Areas, Chongqing University, Chongqing 400045, China
4
Hebei Key Laboratory of Earthquake Disaster Prevention and Risk Assessment, Sanhe 065201, China
5
Chinese Academy of Geological Sciences, Beijing 100037, China
*
Author to whom correspondence should be addressed.
Mathematics 2023, 11(10), 2318; https://doi.org/10.3390/math11102318
Submission received: 4 May 2023 / Revised: 11 May 2023 / Accepted: 12 May 2023 / Published: 16 May 2023

Abstract

:
Anti-sliding piles are commonly implemented to reinforce landslides. Considering the complex nature of this medium, there is substantial spatial variability in the mechanical parameters of rock and soil masses. However, the influence of spatial variability on the anti-sliding pile remains unclear. In this study, the Erdaogou landslide is taken as a case study in terms of the random response of anti-sliding piles considering spatial variability. Based on comprehensive on-site investigations, various numerical calculations were conducted for the comparative analysis, involving stability analysis and the reliability evaluation of the Erdaogou landslide. The results show that treating mechanical parameters of sliding masses as random variables could result in the probability of overestimating landslide failure, leading to the squandering of supporting materials. Specifically, the coefficient of variation has the greatest influence on failure probability, and the vertical scale of fluctuation showed a larger impact on reliability than that of the horizontal scale of fluctuation. As for the rotation anisotropy, the failure probability fluctuated with the increase in the rotation angle. Taking spatial variability into account, pile top displacements and maximum bending moments tower above those obtained via stability analysis. The related studying methods could provide guidance for the optimal design of anti-sliding piles and the threat control of landslides.

1. Introduction

As a common geological hazard, landslides pose a significant threat to human life [1,2,3]. Considering the complex nature of this medium, previous studies have revealed that the spatial variability of rock and soil mass has an impact on the evolution of landslides [4]. Affected by sedimentation and post-deposition processes, load and stress history, and other geological conditions, the parameters of rock and soil mass generally exhibit a certain degree of spatial correlation [5,6,7], which varies across different regions [8,9,10].
The mechanical parameters of rock and soil mass have a correlation in different spatial locations. This correlation decreases with an increase in the spatial distance, causing the complexity of landslides [11,12,13,14]. Griffiths et al. [15] demonstrated that ignoring the spatial variability of soil parameters could lead to underestimating slope stability. Generally, natural spatial variability can be described by random fields and probabilistic methods are often used to evaluate landslide reliability [16,17,18]. Li et al. [19] generated a random field by combining the random finite element method with the Monte Carlo Simulation (MCS), thereby improving computational efficiency.
In practice, anti-sliding piles have often been used to improve the stability of the landslide. Under the action of landslide thrust, anti-sliding piles can make full use of the resistance of the consolidated stratum. The influence of uncertainty on anti-sliding piles can be studied by the failure probability of landslides [20]. Huang et al. [21] proposed an evaluation method for the stability of landslides reinforced by anti-sliding piles based on the reliability theory, combining the strength reduction method (SRM) and response surface method. Li and Liang [22] adapted the calculation algorithm to study the failure probability of slopes reinforced by the anti-sliding pile, considering a given slip surface. Chen et al. [4] discussed the influence of pile position and length on the failure modes of slopes using the limit equilibrium method, while Gong et al. [23] presented an optimal design framework that considered the uncertainties of spatial variability, model, and structural parameters. Lü et al. [24] combined Support Vector Machine (SVM) with Uniform Design (UD) to study the stability of landslides when reinforced by anti-sliding piles and verified the feasibility of the method.
At present, there are still a few studies regarding the combining of the spatial variability of landslides with anti-sliding piles, causing the unclear influence of spatial variability on anti-sliding piles. This paper uses the example of a typical section of the Erdaogou landslide to investigate safety factors using the Morgenstern–Price method and strength reduction method (SRM). Moreover, the random limit equilibrium method (RLEM) and random finite difference method (RFDM) are used to estimate the failure probability of landslides reinforced by anti-sliding piles. The methods proposed in this paper can provide significant guidance for optimizing the design of anti-sliding piles (Figure 1).

2. Reliability Calculation Based on RLEM and RFDM

2.1. Random Field Theory

The spatial autocorrelation of geotechnical parameters can be described using the mean value, coefficient of variation (COV), correlation coefficient, and scale of fluctuation, as outlined in the random field theory [25]. The traditional methods for slope stability evaluation can be applied to calculate the failure probability while considering spatial variability [26], such as RLEM, RFDM, etc. Parameters that follow a lognormal distribution can effectively avoid generating negative values and provide a good representation of the spatial variability of rock and soil mass, as demonstrated by numerous geological surveys and applications [27]. If a parameter obeys a lognormal distribution, the following equations can be obtained:
μ = exp μ ln + σ ln 2 2
σ 2 = exp σ ln 2 1 exp 2 μ ln + σ ln 2
where μ and σ 2 are the mean value and variance of parameters, respectively, and u ln and σ ln 2 are the mean and variance of the logarithm of the parameter values, respectively. When describing the spatial autocorrelation of a single parameter, in addition to the mean and variance, the autocorrelation function represents the attenuation of the parameter with an increase in distance [28]. Li and Lumb [29] found that landslide stability reliability was insensitive to the form of the autocorrelation function while sensitive to the correlation length. Therefore, the exponential correlation function can be adopted as:
ρ τ x , τ z = exp 2 τ x σ h + 2 τ z σ v
where ρ is the autocorrelation coefficient between two points, τ x and τ z are the horizontal and vertical distances between the grids, respectively, and σ h and σ v are the horizontal and vertical scale of fluctuations.
Geological tectonic movements, including strata faults and bending folds, can cause rock and soil masses to exhibit rotational transverse anisotropy [30]. Tian et al. [31] found that the influence of rotational anisotropy on slope reliability gradually weakened with the increase in parameter variation. Cheng et al. [32] pointed out that the correlation function of rotational anisotropy could be expressed by Equation (4), where σ φ is the autocorrelation distance and φ is the direction angle:
ρ τ x , τ z = exp τ x cos β + τ z sin β θ 1 τ x sin β + τ z cos β θ 2
θ φ = θ 1 θ 2 θ 2 cos φ cos β + sin φ sin β + θ 1 cos φ sin β + sin φ cos β
where, θ 1 and θ 2 are the correlation distance in the corresponding direction of x and z, and β is the rotation angle of the correlation structure. When β is 0, the equation is the autocorrelation function of transverse anisotropy. The transverse anisotropy and rotational anisotropy in rock mass are shown in Figure 2. Specifically, isotropic represents the consistent correlation of rock and soil parameters in each direction. Transverse anisotropy refers to the fact that the correlation of parameters has two orthogonal principal axes in space, with the strongest correlation in the long-axis direction and the weakest in the short-axis direction. The implementation of rotational anisotropy is based on transverse anisotropy and then rotated at an appropriate angle [30].
At present, simulation methods of random field commonly include the Covariance matrix decomposition method, Karhunen–Loève series expansion method, Stepwise decomposition method and so on. Cholesky decomposition and spectral decomposition are commonly used in matrix decomposition, which can directly obtain a lower triangular matrix by the decomposition of the correlation matrix. It shares the advantages of a simple calculation and is easy to implement in the program. Therefore, the Cholesky decomposition method was used in this paper to generate random fields:
L × L T = C
C = 1 ρ τ x 1 , 2 , τ y 1 , 2 ρ τ x 1 , n , τ y 1 , n ρ τ x 2 , 1 , τ y 2 , 1 1 ρ τ x 2 , n , τ y 2 , n ρ τ x n , 1 , τ y n , 1 ρ τ x n , 2 , τ y n , 2 1
where C is the n × n correlation matrix, and n is the total number of grids; L is the matrix obtained by Cholesky decomposition, and generates the relevant standard normal random field G i with the given matrix L:
G i = k = 1 i L ik Z k             i = 1 , 2 , , n
where, Z k is an independent standard normal random variable.

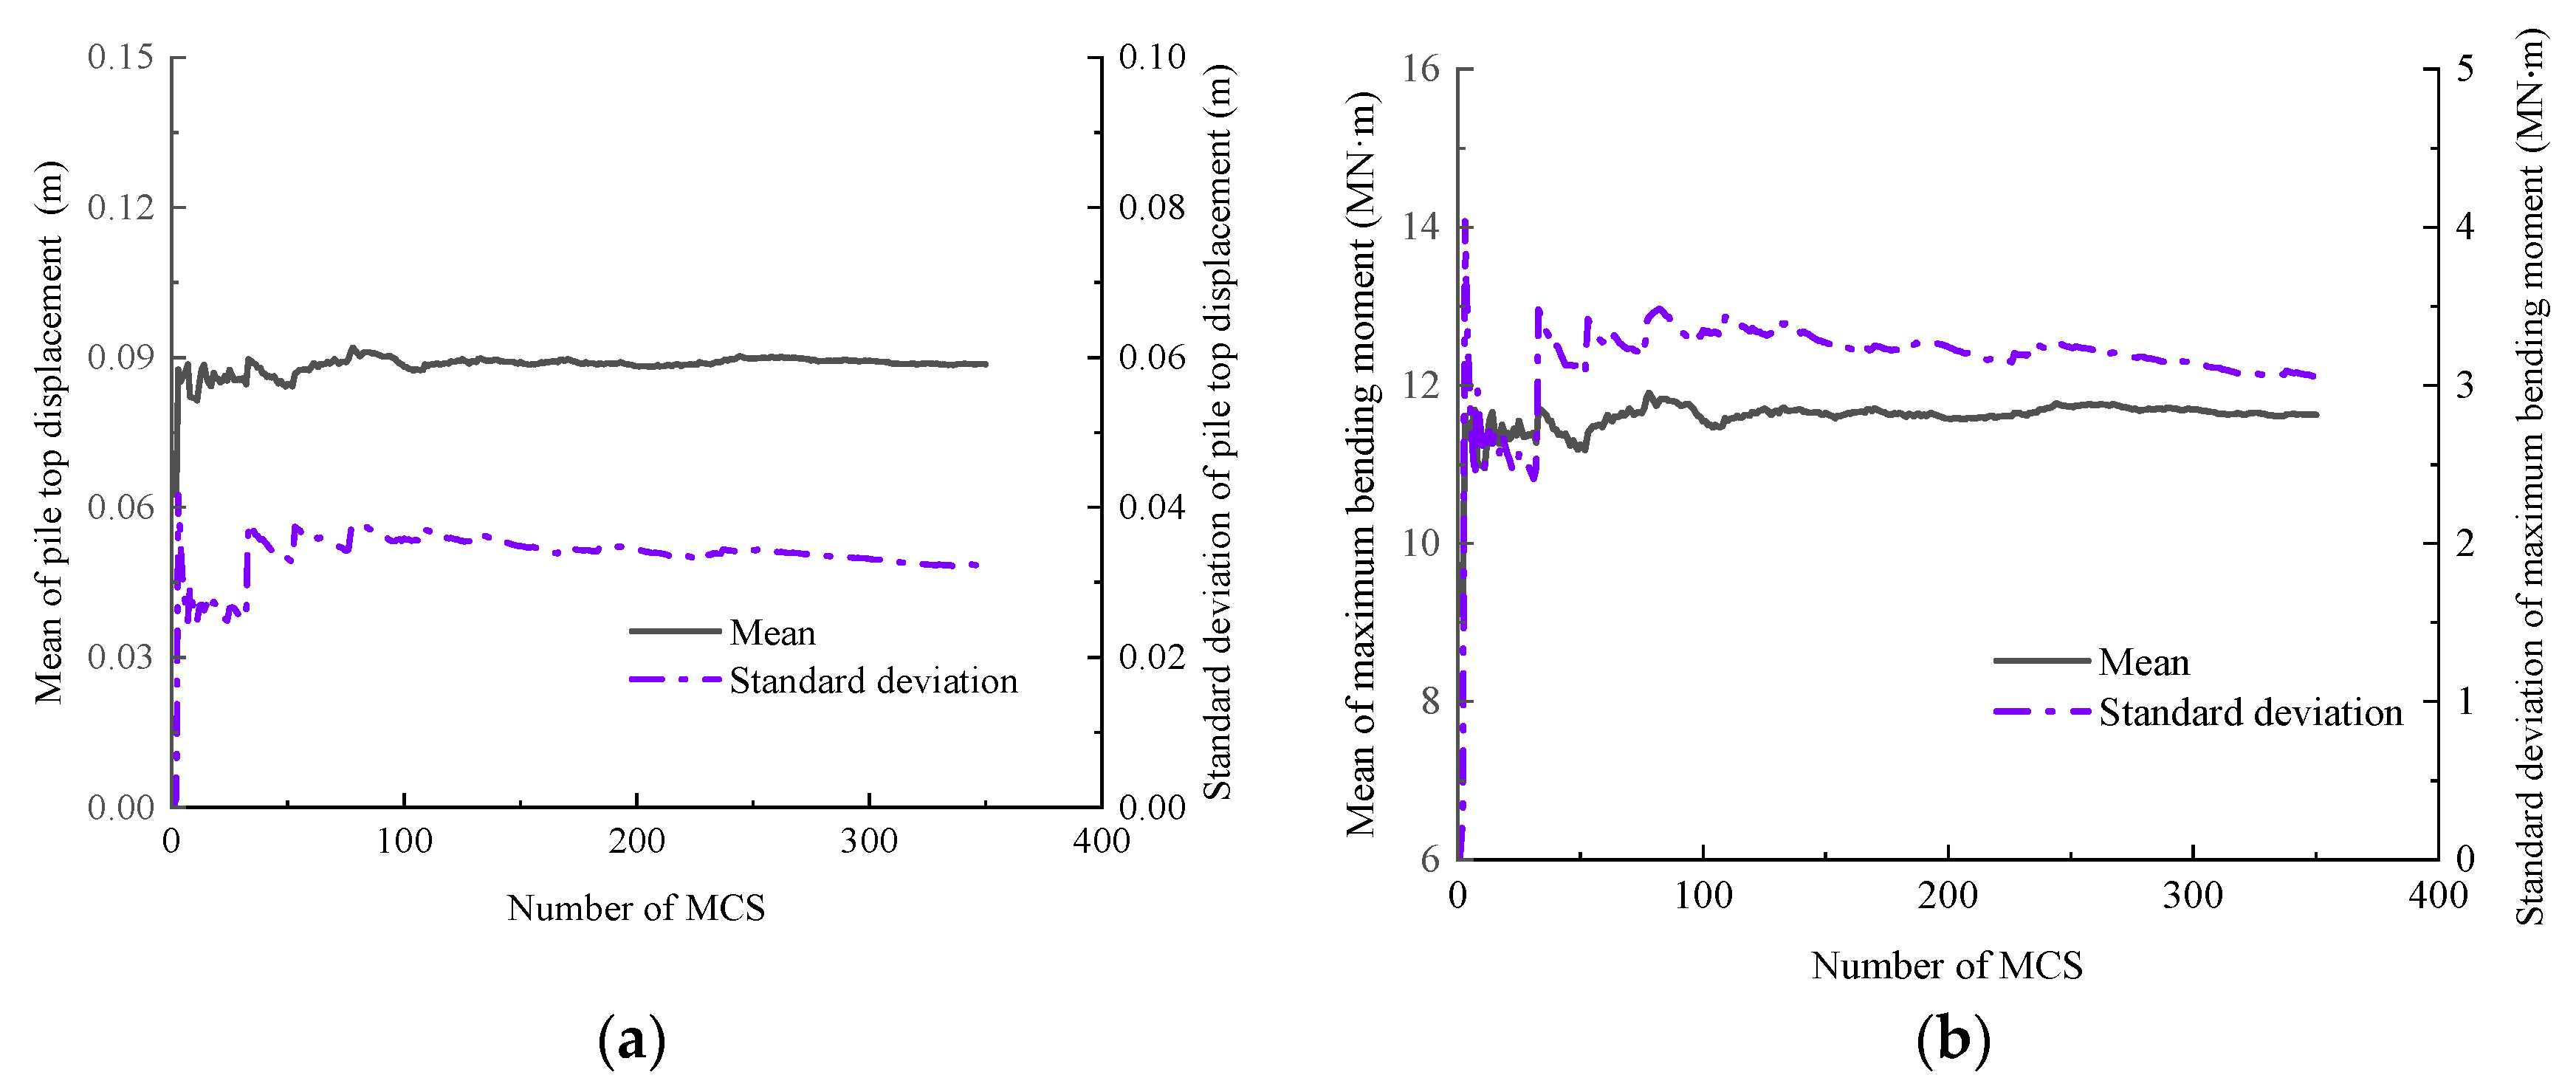
2.2. Failure Probability Calculation

SRM is used in FLAC (Fast Lagrangian Analysis of Continua) to calculate the safety factor of a slope. The strength parameters of rock and soil mass can be changed by altering the reduction coefficient until the slope is unstable. Based on the Mohr–Coulomb criterion, SRM can be presented through the following equations:
tan φ t = tan φ F
c t = c F
where φ and c are the friction angle and cohesion before reduction, respectively; φ t   and c t are the reduced friction angle and cohesion; F is the reduction coefficient.
The Morgenstern–Price method is classified as a strict limit equilibrium method, which considers the interaction of shear forces between strips, satisfies the force and moment balance conditions and makes no assumptions about the shape of the sliding surface. The calculation equation is as follows:
FS = c Δ LR cos α + RN tan φ cos α N sin α
FS = c Δ LR + RN tan φ WL W NL N
N = W + λ f x c Δ L cos α FS c Δ L sin α FS cos α + sin α tan φ FS λ f x cos α tan φ FS sin α
where λ is the COV of the force among soil the strips, f(x) is the varying function of the force among soil strips, and the relationship between the vertical and transverse force is assumed to be Y = λ f x X . L is the length of the soil strip on the sliding plane; L W is the length of the moment arm from the center of the soil strips to the center of the slip surface; L N is the distance between the midpoint of the soil strips on the slip surface and the corresponding normal line; α is the included angle between the tangent line of the soil strips and horizontal plane; R is the moment arm length of the center of the circle; N is the normal force of sliding against the soil strips.
The MCS can accurately calculate the failure probability of the slope. It inputs a large amount of random data into the analysis model for calculation and then the analysis of the occurrence probability of the event. The failure probability can be defined as follows:
P f = 1 N MC i = 1 N MC I FS i X ^ i < 1
I = { 0 ,   if   FS i 1 1 ,   if   FS i < 1
where N MC   is the times of MCS; FS i   is the safety factor calculated at the i-th time; I is an indicative function.
Equation (14) reveals that the failure probability is linked to the number of MCS. Therefore, it is essential to conduct convergence analysis when using the MCS to calculate failure probability. With the increase in MCS times, the failure probability gradually converges to a constant value. When the COV of failure probability is less than a certain value, this probability is regarded as the failure probability of a slope. In this paper, the COV failure probability can be determined according to Equation (16). If the value is less than 0.3, it is judged as computational convergence. To further verify the rationality of simulation times, the changes in the mean and variance of the safety factor with the simulation times can be analyzed.
COV P f = 1 P f / N MC P f

3. Stability Analysis of Landslide

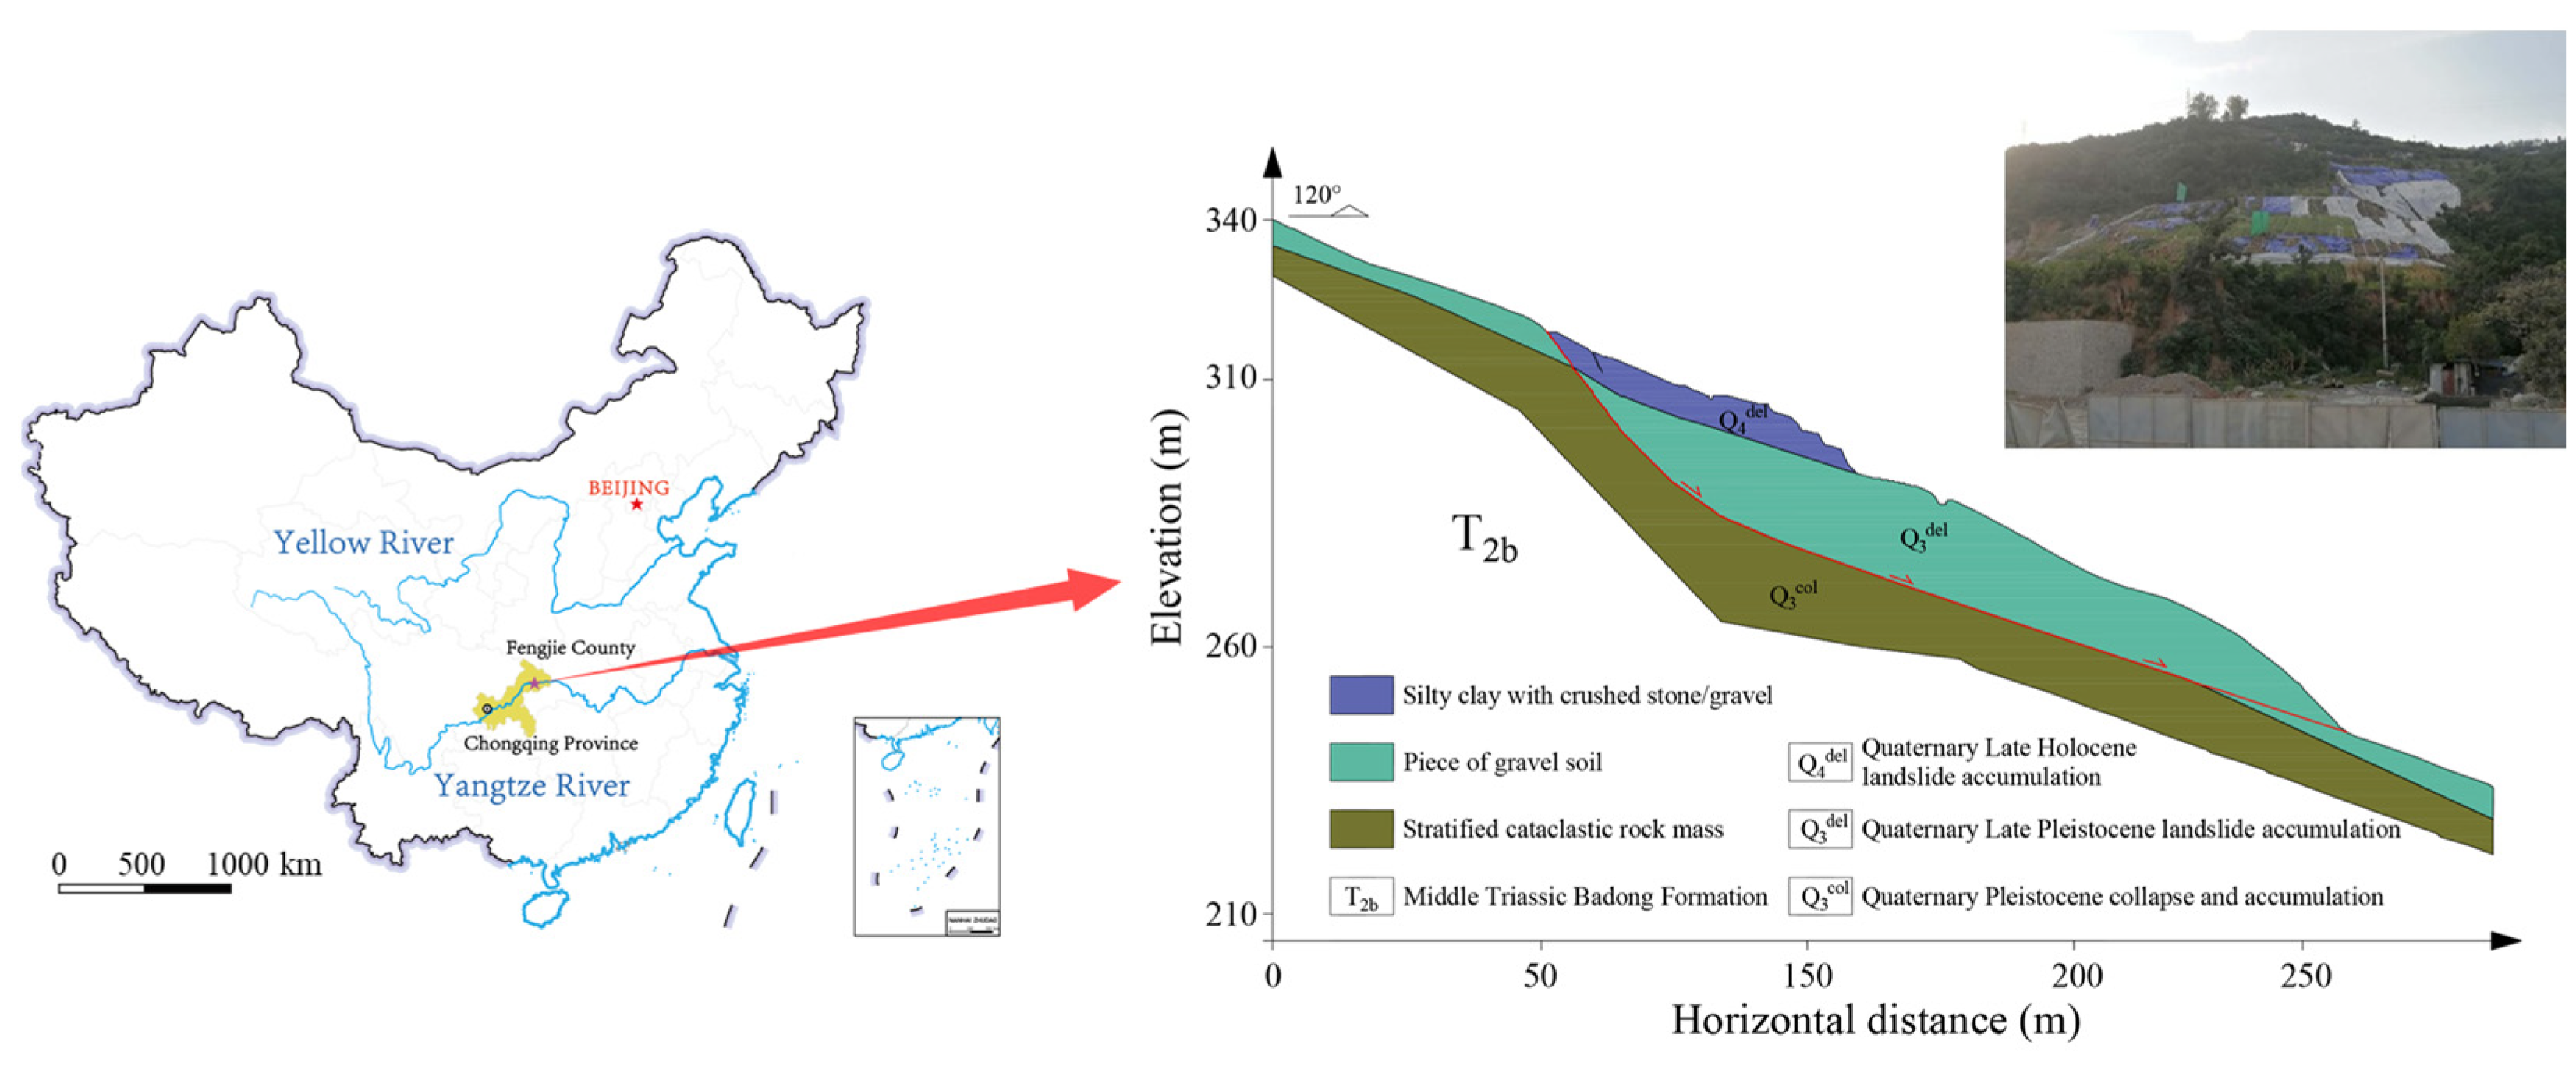
3.1. Geologic Environment

The Erdaogou landslide, categorized as a compound soil landslide, is situated in the Kangning Community of Yufu Street in Fengjie County (109°30′21.86″ E, 31°2′34.59″ N). The trailing edge’s elevation is approximately 330 m, while the leading-edge ranges from 224 m to 240 m. Measuring 220 m in longitudinal length and 135 m in average width, the landslide presents a mean thickness of 13.4 m. The total slide volume, as per the records, is estimated to be around 398,000 m3, with the main slide direction being 124°. The study area exposes Quaternary Late Pleistocene (Q3) and Holocene Series (Q4) strata, as well as the third and fourth sections of the Middle Triassic Badong Formation (T2b3 and T2b4). The typical section is shown in Figure 3.

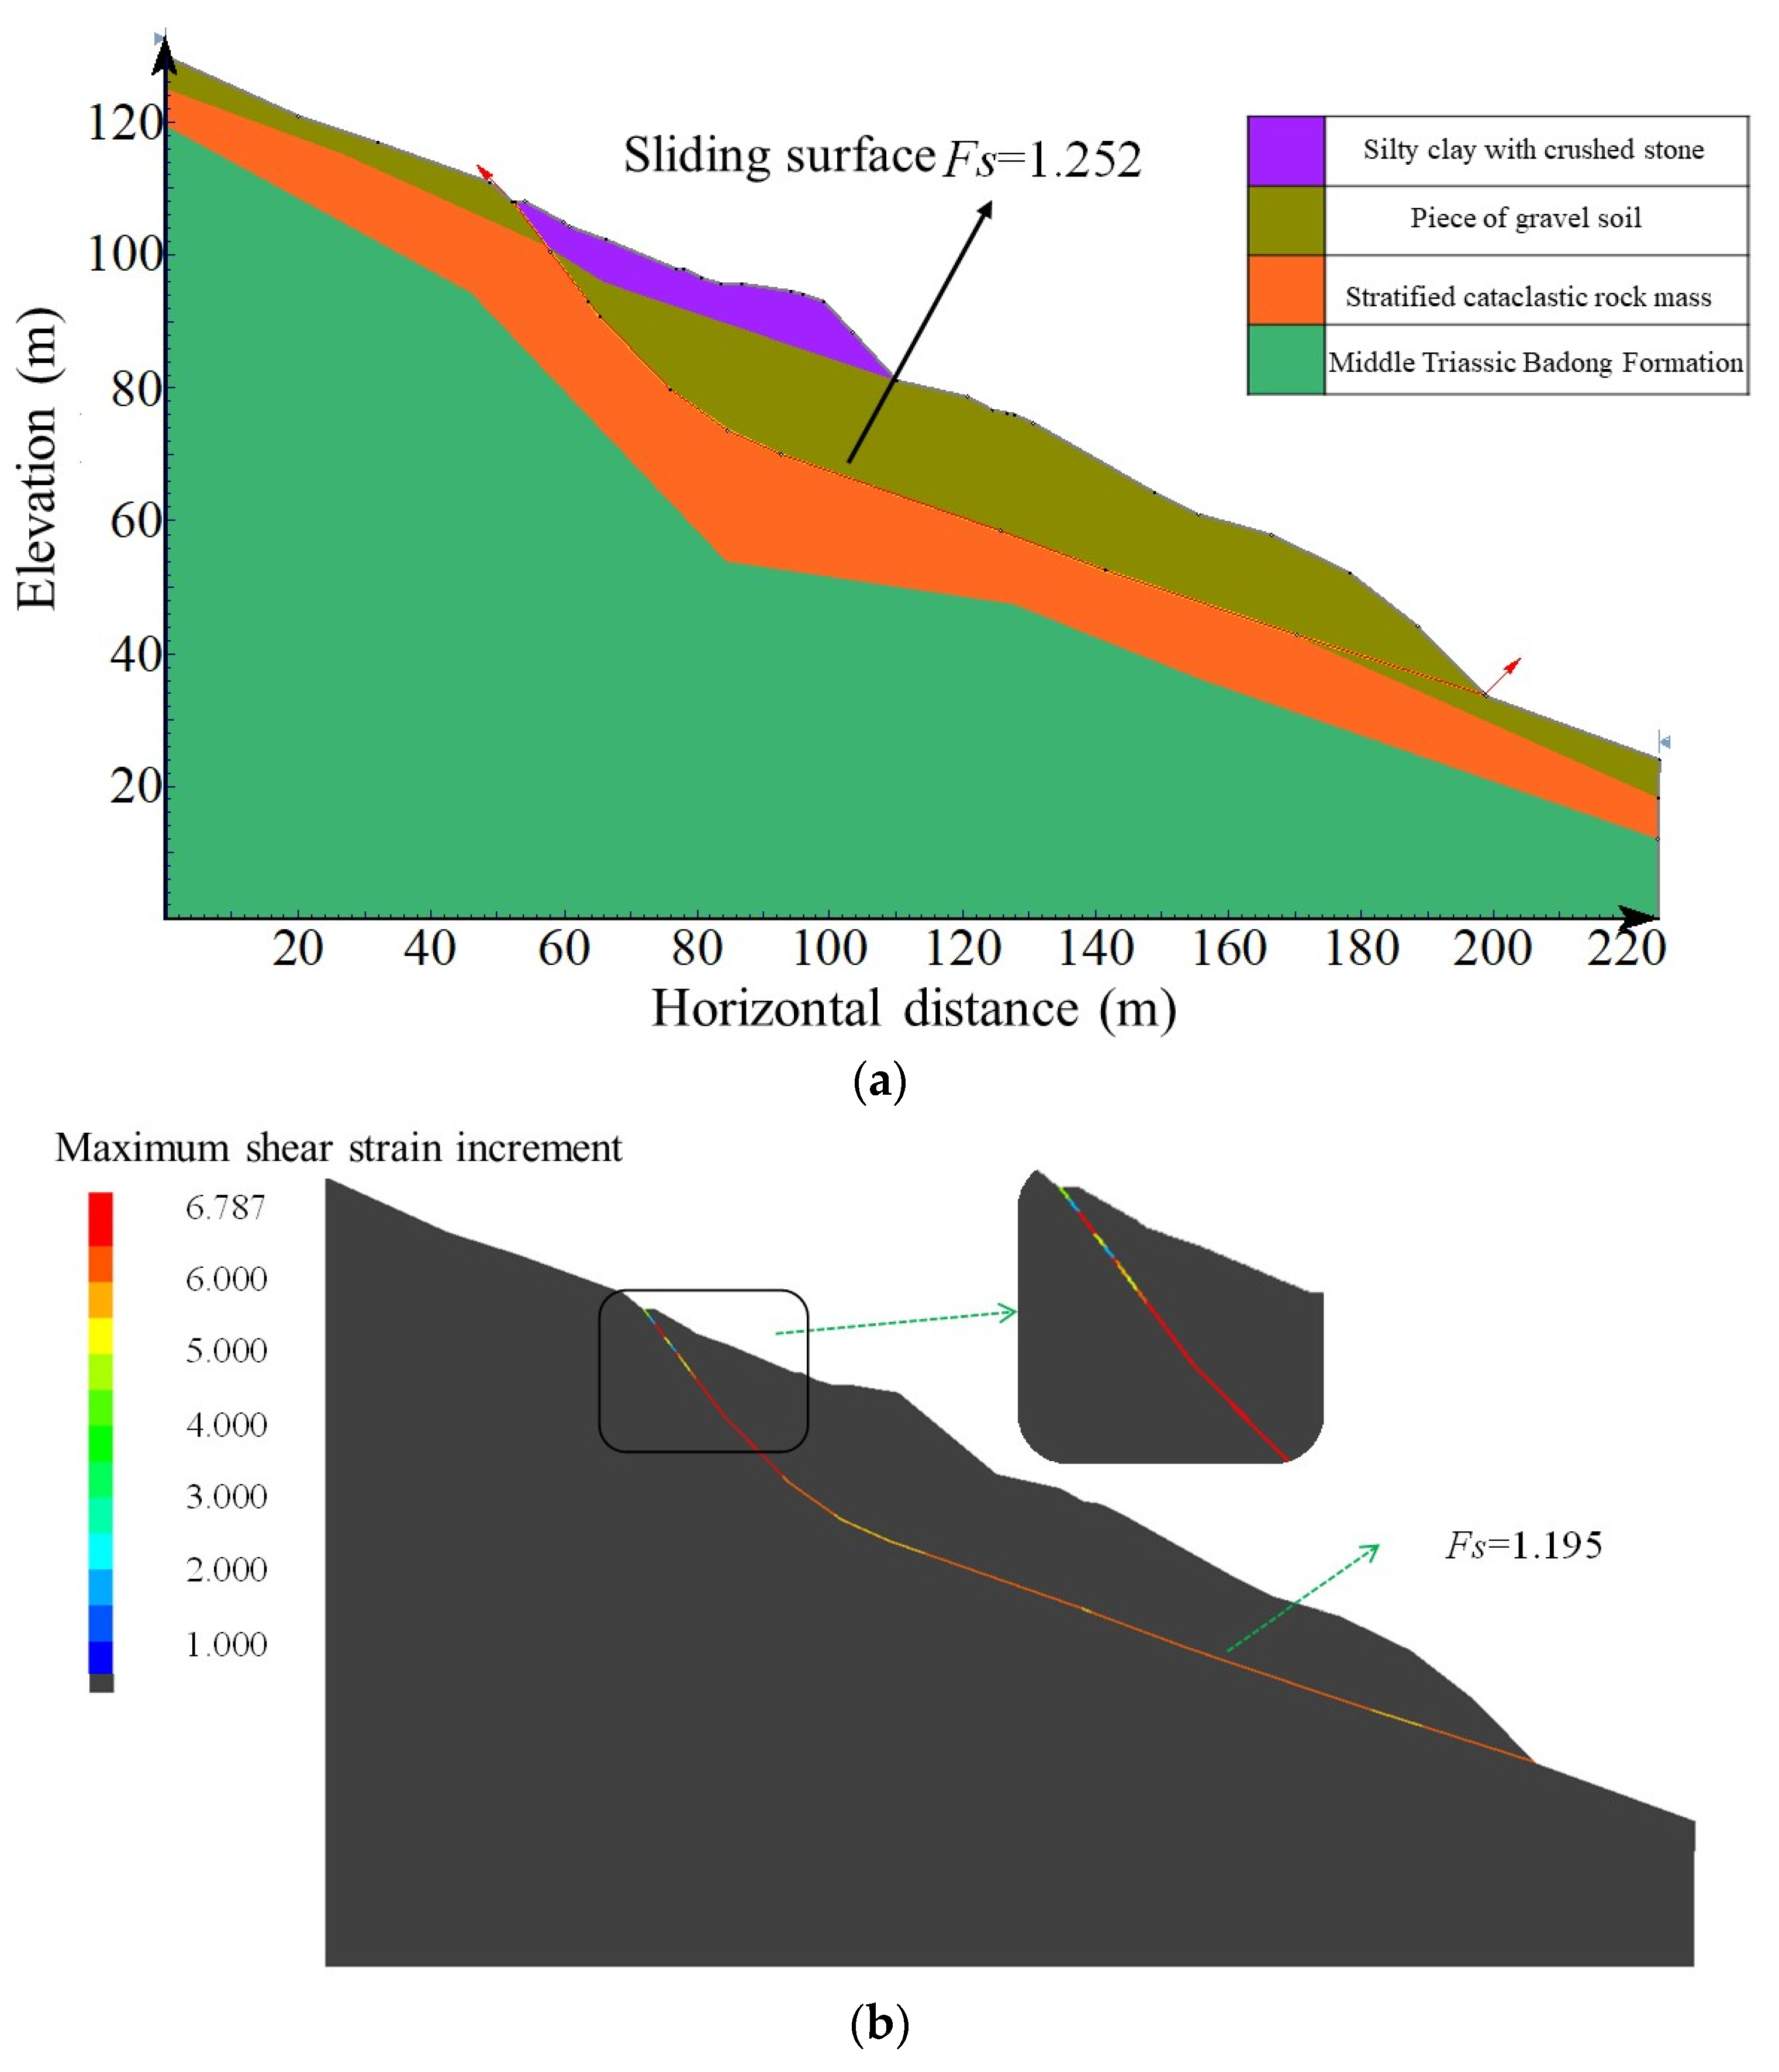
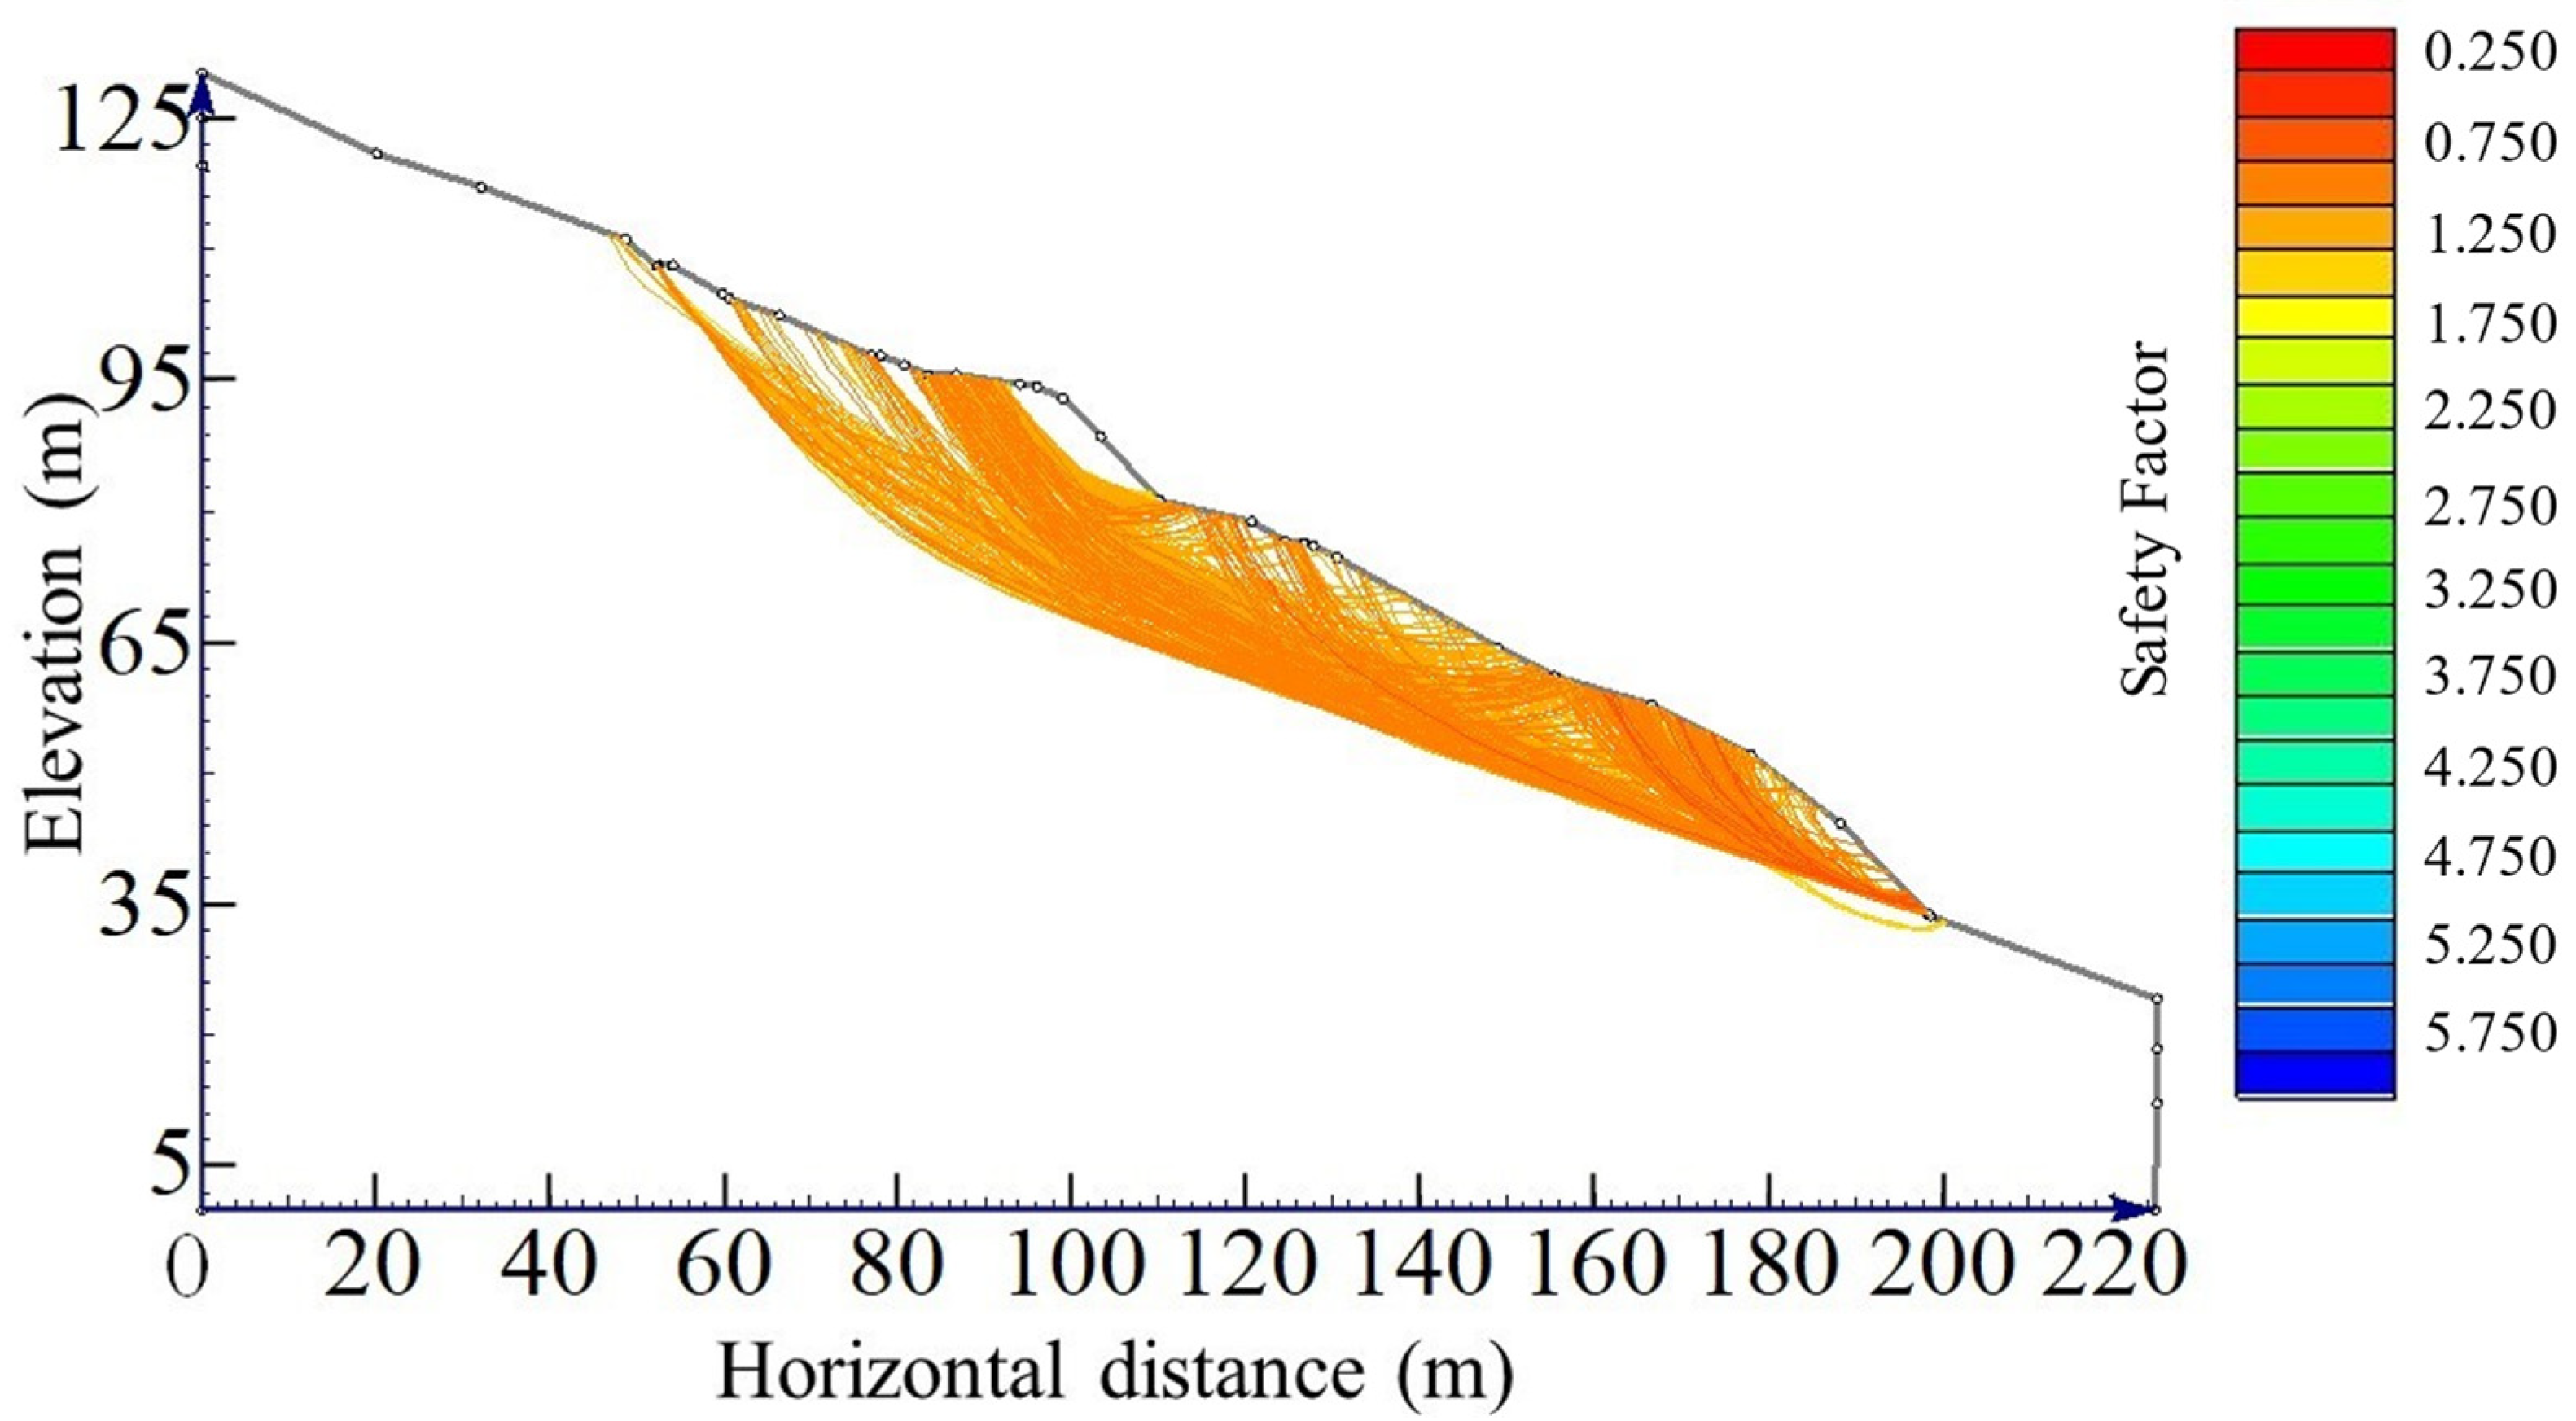
3.2. Deterministic Analysis

The landslide is mainly composed of four kinds of rock and soil mass: silty clay with crushed stone, piece of gravel soil, sliding-zone soil, collapsed deposit and Middle Triassic Badong Formation. The related parameters were obtained by the indoor tests, as shown in Table 1. Based on the landslide’s typical section, the SLIDE2 and FLAC 2D was used to carry out the stability analysis. The Morgenstern–Price method calculated a safety factor of 1.252 (Figure 4a), while the strength reduction method yielded a safety factor of 1.195 (Figure 4b). The difference between the calculation method and grid division may lead to different results.

3.3. Reliability Analysis

SLIDE2 can obtain the safety factor and reliability index for two-dimensional soil or rock slopes based on the limit equilibrium method. To improve the computational efficiency of the random response of an anti-sliding pile in FLAC 2D, SLIDE2 was used for modeling to study the variation laws of slope reliability considering the spatial variability of the piece of gravel soil (Q3del) and sliding mass. In this analysis, the COV of cohesion c and internal friction angle φ varied from 0.1 to 0.5, while the correlation coefficient was constant at −0.4. When studying the influence of ρ c , φ   on failure probability, COV was set as 0.3. Spatial variability was considered, and the horizontal and vertical scales of fluctuation δ h , δ v were 100 m and 50 m, respectively.
To ensure the convergence criterion, the slope stability was analyzed with different numbers of realizations. The failure probability is an important indicator in assessing the accuracy of the reliability analysis. Figure 5 shows the variation in the probability of failure and its COV with the increasing number of MCS. The obtained COV value of 0.3 represented the failure probability that could support the results well. This convergence criterion has been adopted in subsequent analyses.
The results show that when the parameters of stratified rock mass were considered as random variables, the failure probability of the landslide was almost 0, and the uncertainty had a minimal impact on the reliability of the landslide. Therefore, this study focused on the effect of the sliding mass uncertainty and on the landslide’s reliability. Figure 6 and Figure 7 present the comparison results when considering the parameters of sliding mass as random variables and random field variables, respectively. The analysis shows that considering the parameters of the sliding mass as random variables result in an overestimation of the landslide failure probability and a conservative support design, which can lead to the unnecessary wastage of materials.
Figure 8 presents a summary of the sliding surfaces under random field analysis conditions. The uncertainty of parameters may generate more sliding surfaces in the sliding mass. As the study did not fully take into consideration the effect of external factors such as rainfall and earthquakes, the results are relatively conservative. Future engineering support designs should fully consider the influence of potential sliding faces on slopes to ensure the stability of landslides in complex environments.

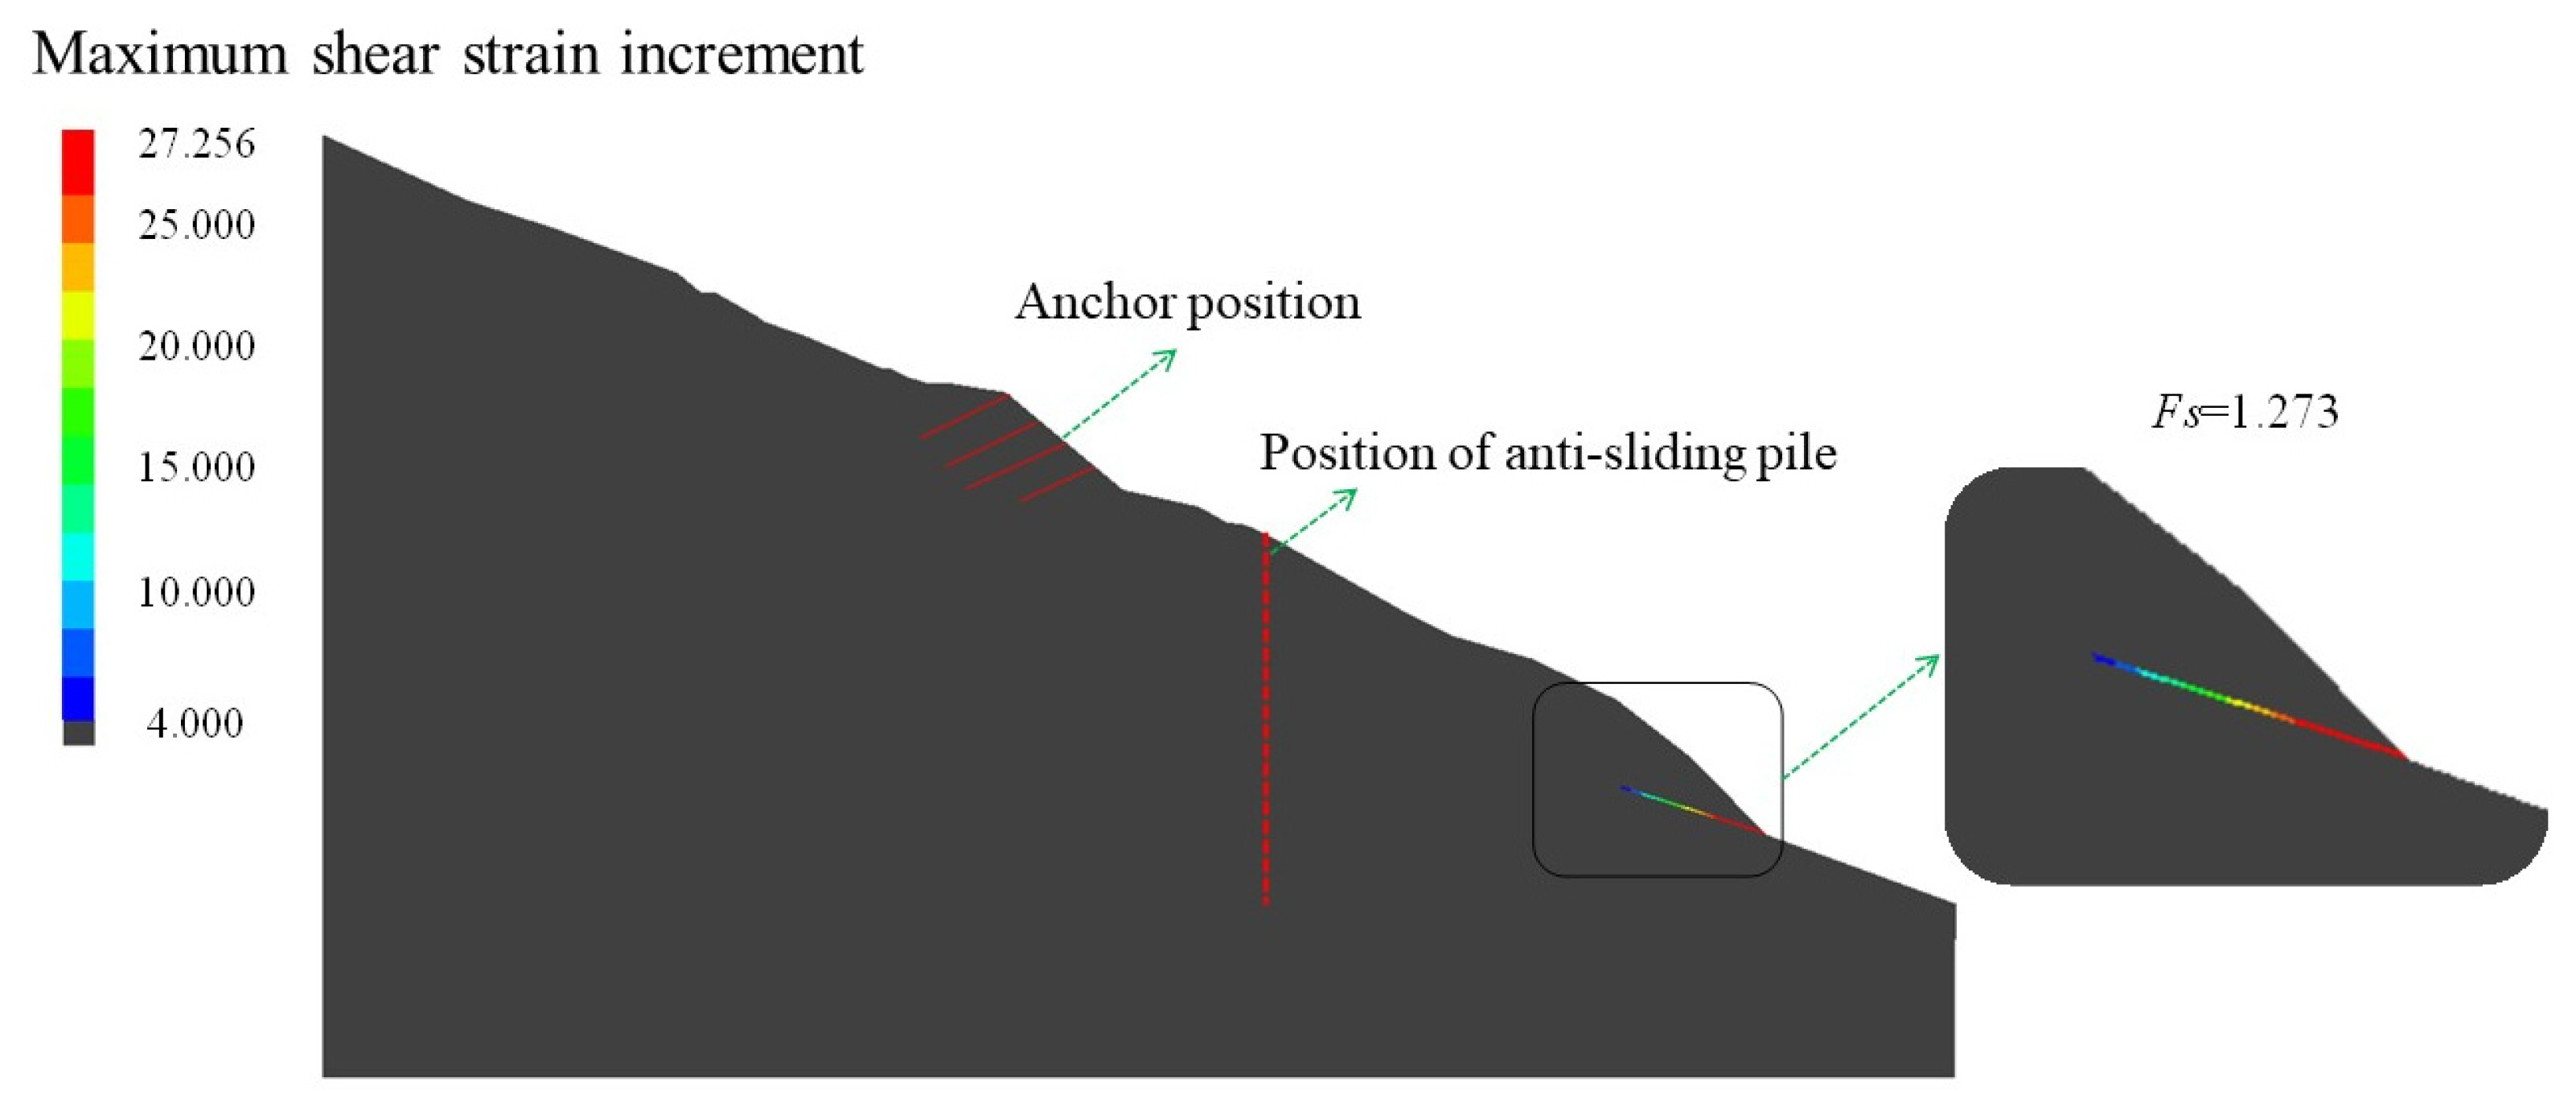
4. Pile Response and Slope Reliability

The anti-sliding pile was situated at an elevation of 285.0 m. To ensure that the length of the anti-sliding pile was embedded in the stable sliding bed, the pile’s length was designed between 17 m and 37 m. Fully bonded anchors, with a horizontal spacing of 3 m and vertical spacing of 2.5 m, had designed lengths of 10 and 13 m and an incline angle of 20°. The parameters of the anchors are shown in Table 2 [33]. Figure 9 indicates that even though the safety factor of the landslide did not significantly improve after reinforcement, the position of the sliding surface of the landslide shifted from the predetermined sliding zone to the lower junction of the sliding zone and the sliding mass, which suggests that the provided support was effective.
The maximum displacement at the top and maximum bending moment of the pile were crucial parameters in designing laterally loaded piles. The anti-sliding pile, as a type of laterally loaded pile, was challenging to characterize using explicit equations. Therefore, it was challenging to determine the statistical properties, such as the mean and variance of the anti-sliding piles. In this section, the response of the anti-sliding pile considering the spatial variability of the sliding mass and the estimation of slope failure probability was achieved by a large number of calculations. Figure 10 shows that the mean and variance of the pile top displacement and the maximum bending moment converged when the number of simulations was 350, with a fluctuation range of less than 5%, to improve computational efficiency and satisfy the accuracy requirements.

4.1. Effect of COV

In deterministic analysis, the pile top displacement was 0.0701 m, and the maximum bending moment was 9.81 MN·m. The mean value of the pile top displacement and the maximum bending moment increased when taking into account the spatial variability of the sliding mass compared to the values determined during deterministic analysis. Furthermore, it was found that the sliding surface of the landslide was not along the previously identified sliding zone after support but was located on the right portion of the sliding mass. Figure 11 illustrates the impact of COV on the pile top displacement and maximum bending moment of the anti-sliding pile. The correlation coefficient ρ c , φ was −0.4, while a horizontal scale of fluctuation δ h at 50 m and a vertical scale of fluctuation δ v at 25 m, respectively. With the increase in COV, the mean and COV of the pile top displacement and maximum bending moment increased significantly, and the failure probability and slip volume of the landslide increased. As a result, the sliding force increased, the instability was enhanced, while the bearing capacity of the anti-sliding pile decreased. This could have a negative impact on the design and construction of the pile foundation, highlighting the need for sufficient attention to be paid to the variability of the sliding mass in practical engineering.

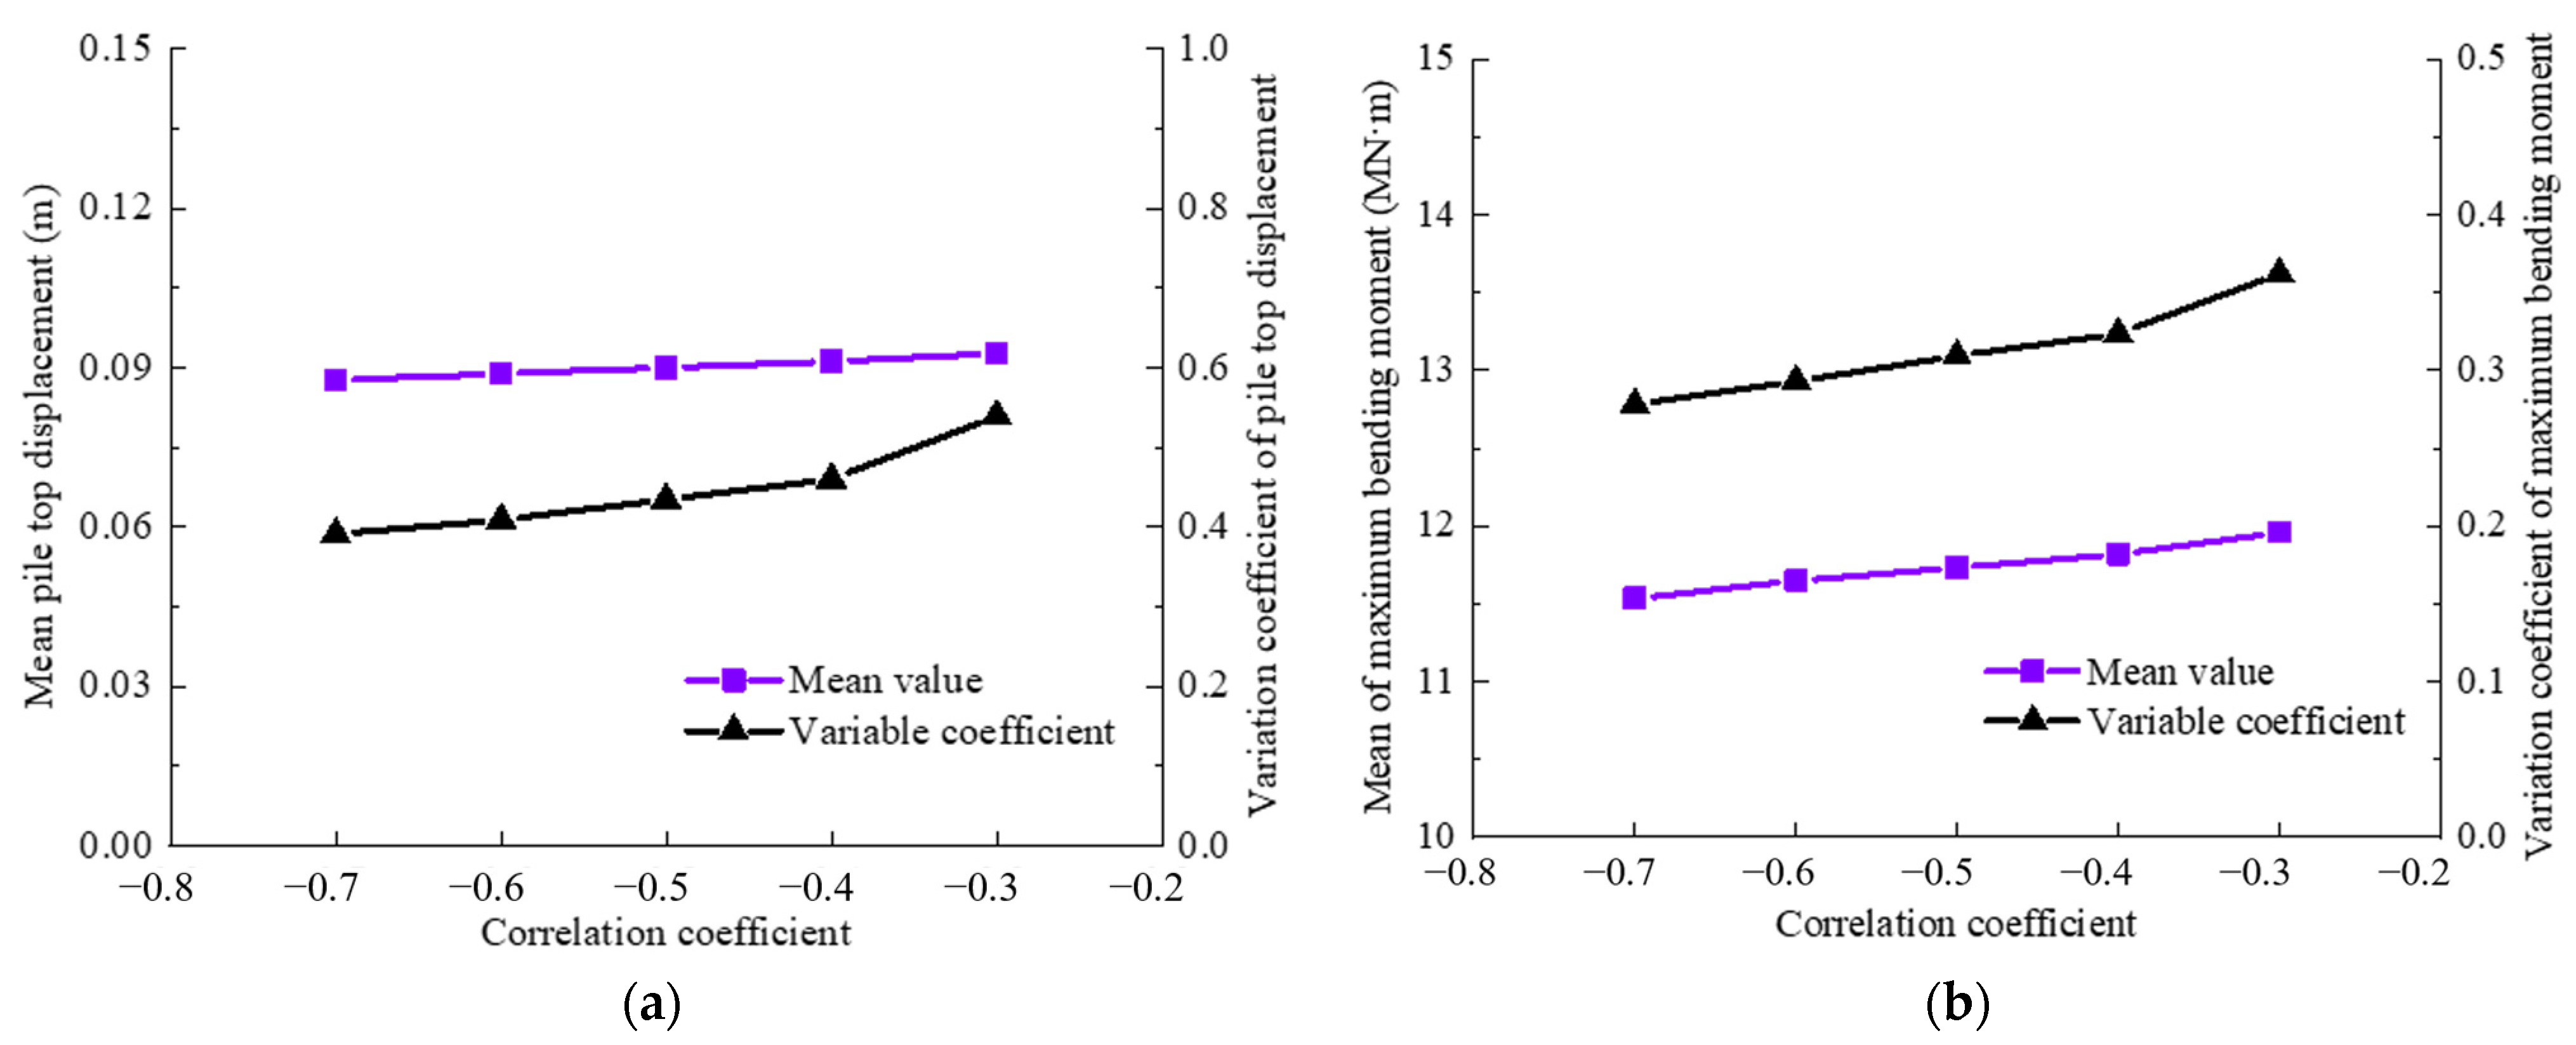
4.2. Effect of Correlation Coefficient

Figure 12 shows the effect of the correlation coefficient ρ c , φ on the random response of the anti-sliding pile. The COV was 0.3, the horizontal scale of fluctuation δ h was 50 m, and the vertical scale of fluctuation δ v was 25 m. With the increase in the correlation coefficient ρ c , φ , the mean value and COV of the pile top displacement and maximum bending moment both increased. Meanwhile, COV increased gradually at first but rapidly increased once the correlation coefficient surpassed −0.4. It was found that with the increase in the correlation coefficient, when the negative correlation between the parameters of the sliding mass (cohesion c and internal friction angle φ ) weakened, the failure probability of the landslide and the volume of the sliding mass increased in different degrees, leading to an increase in the landslide sliding force. The influence of the correlation coefficient on the COV of the pile-top displacement was more significant than that of the maximum bending moment, which illustrated that the pile-top displacement had a high degree of dispersion, as depicted in Figure 12.

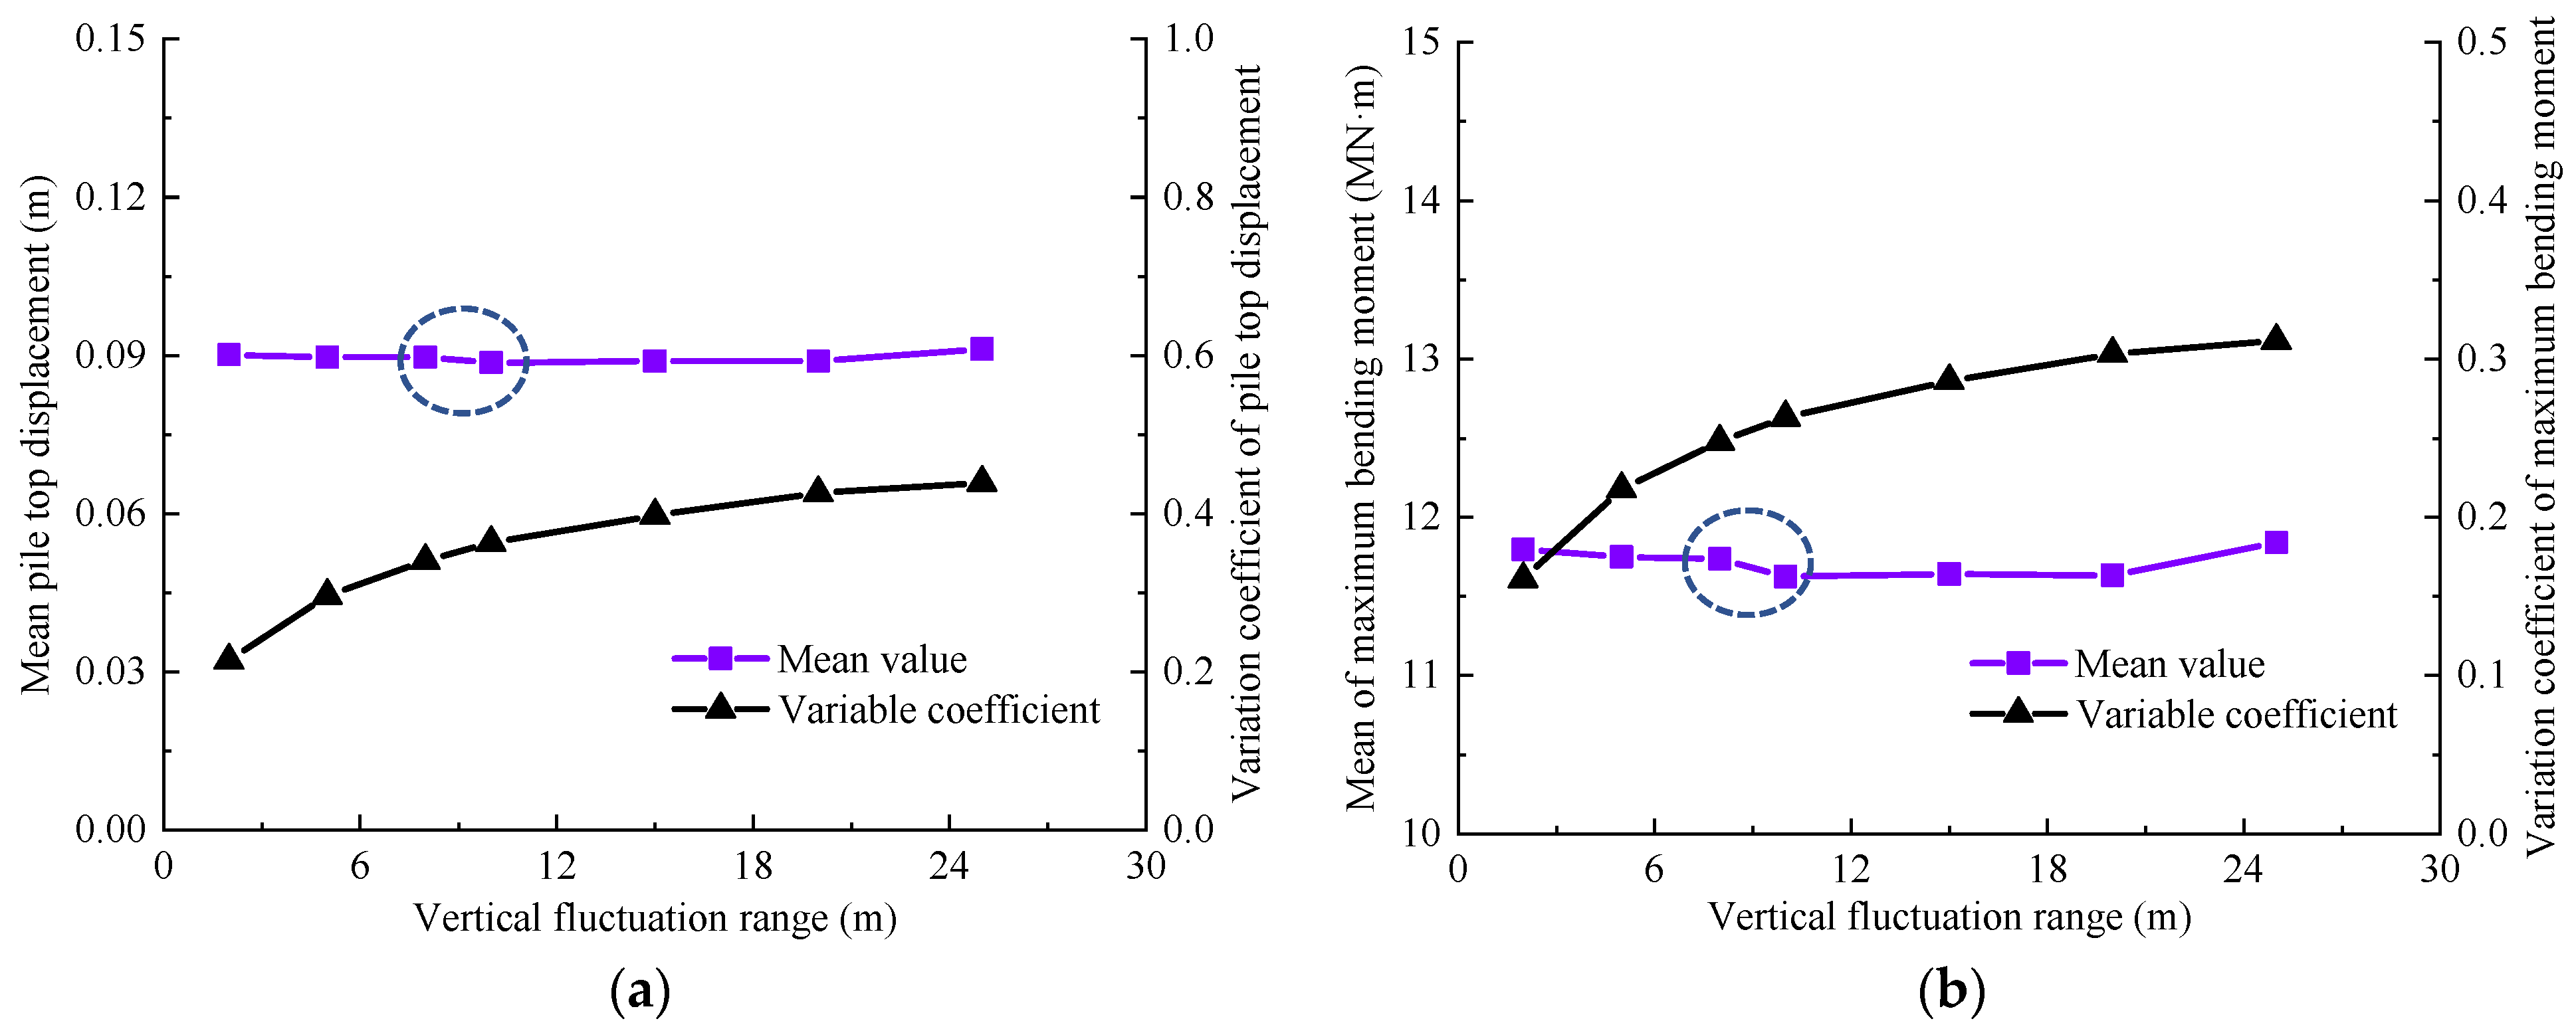
4.3. Effect of Scale of Fluctuation

Figure 13 and Figure 14 display a comparison between the impact of different scales of fluctuations on both the pile top displacement and the maximum bending moment of the anti-sliding pile. The COV was 0.3, and the correlation coefficient ρ c , φ was taken as 0.4. When examining the influence of the horizontal scale of fluctuation   δ h , the vertical scale of fluctuation δ v   was selected to be 10 m, and the δ h ranged from 10 m to 100 m. Similarly, when studying the influence of δ v , δ h was fixed at 50 m and δ h ranged from 2 m to 25 m. It could be seen that an increase in δ h lead to higher mean values and COV for both the pile top displacement and maximum bending moment, with the mean value showing a slight increase. With the increase in δ v , the mean value of the pile top displacement and maximum bending moment decreased firstly and then increased, while the COV continued increasing. However, the increasing rate decreased gradually. In the case of δ v = 10 m, the curve representing the mean value reached its minimum point, suggesting that there may have been an optimal scale of fluctuation that could enhance the stability of the anti-sliding pile. Additionally, the findings indicate that the influence degree of δ v on the mean value of pile response was lower than that of   δ h . This is because the increase in δ v may have caused the sliding mass in the vertical direction to be homogeneous, which could act together with the anti-sliding pile to reduce the risk of landslide.

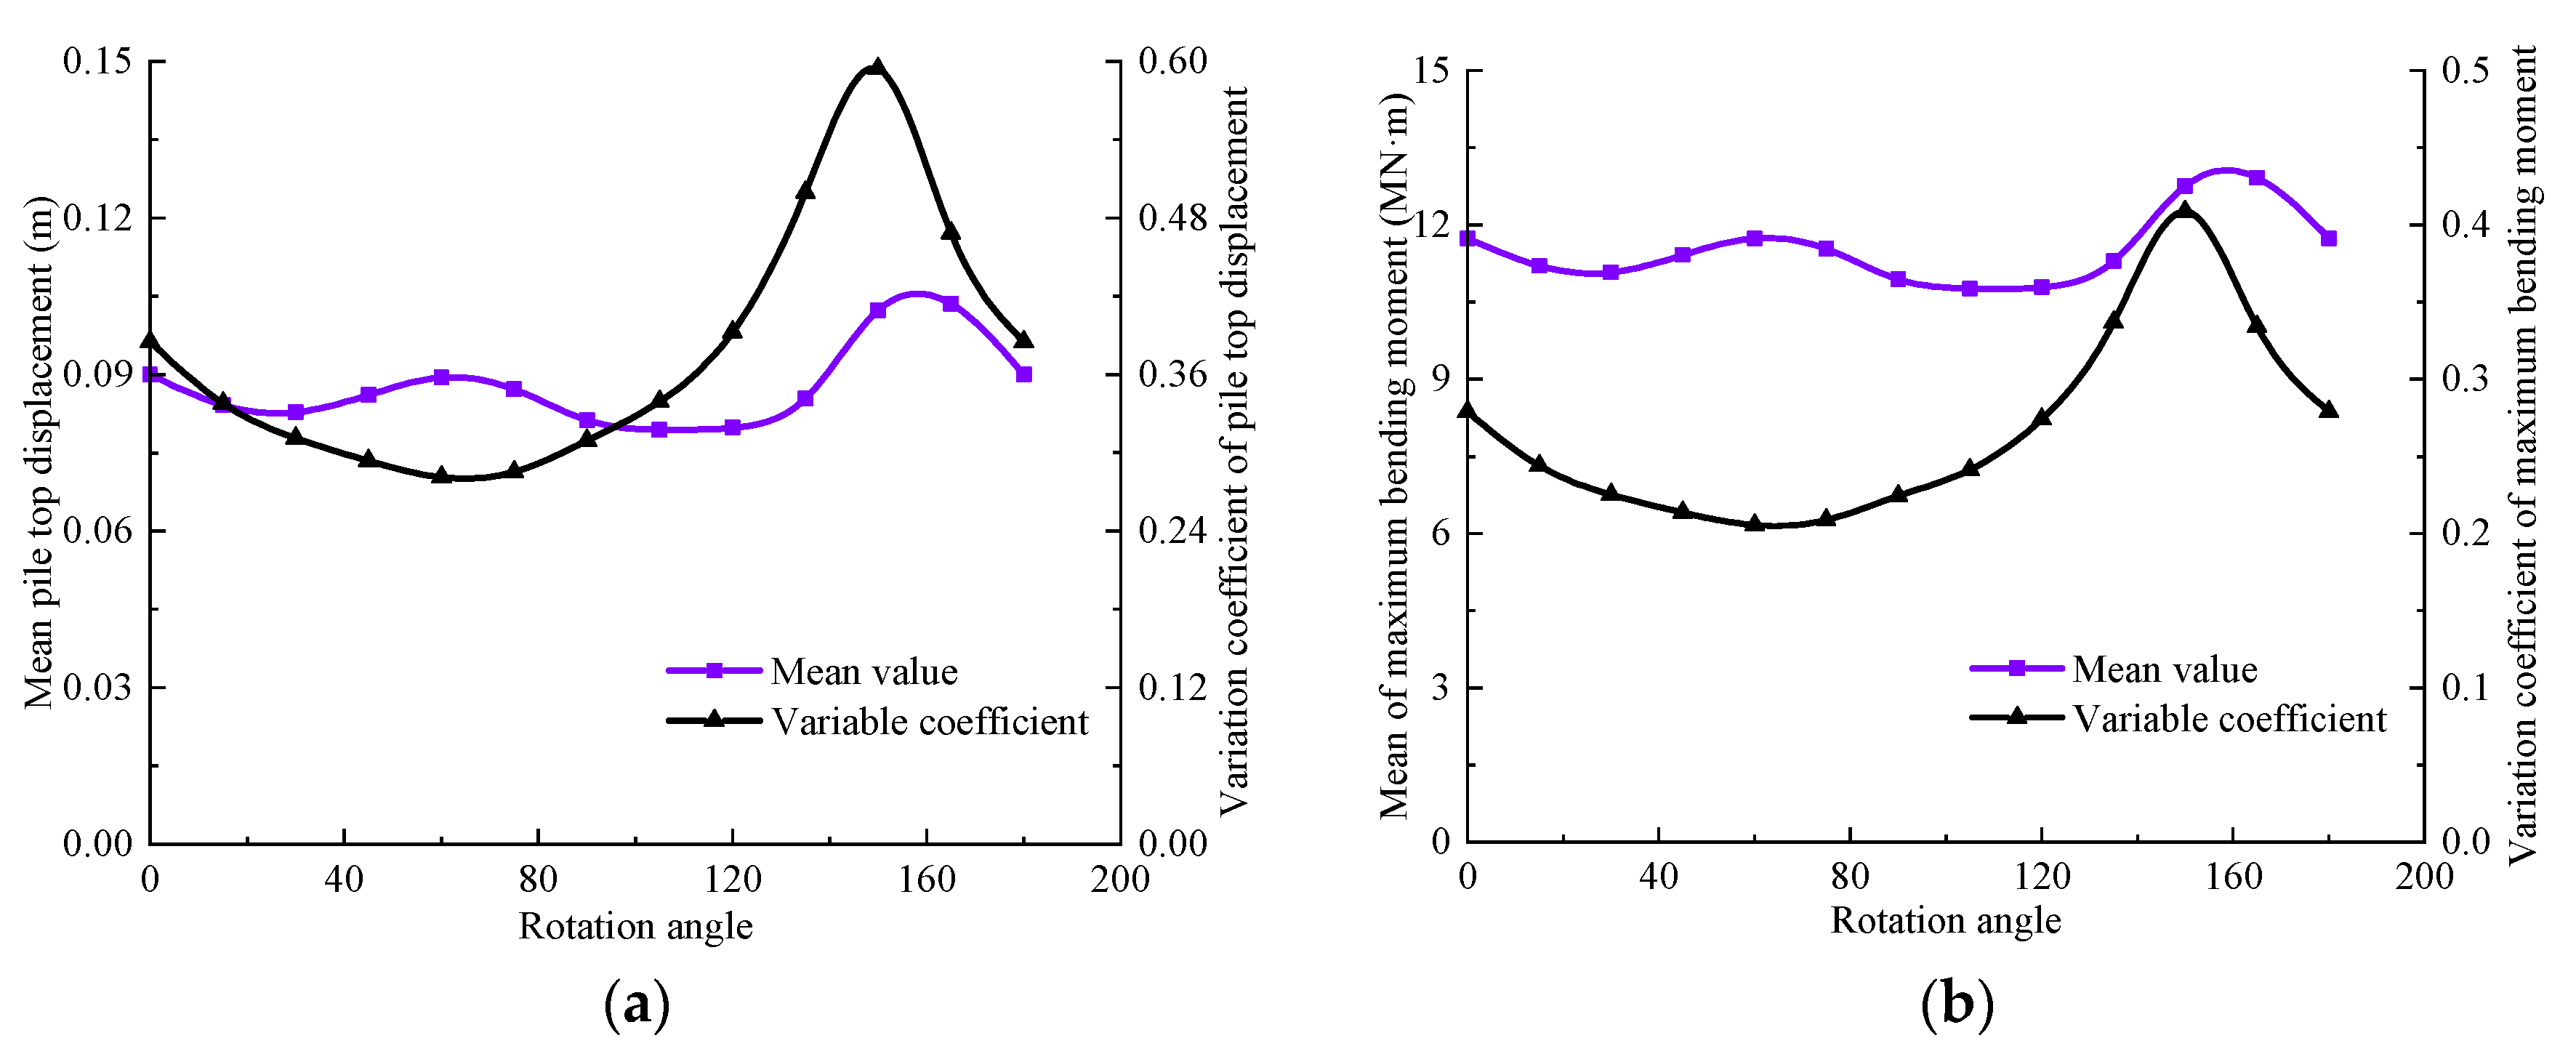
4.4. Effect of Correlation Coefficient Rotation Angle

This section studies the random response of the anti-sliding pile considering the rotational anisotropy of the sliding mass. The scale of fluctuation in the principal axis and secondary axis was 50 m and 5 m, respectively. Similarly, COV was taken as 0.3 and ρ c , φ as 0.4. Figure 15 shows the influence of the different rotation angles on the pile top displacement and maximum bending moment of the anti-sliding pile. As the rotation angle increased, the mean value and COV of the pile top displacement and maximum bending moment presented sinusoidal fluctuations similar to those of a trigonometric function, with the coefficient variation being one cycle less than that of the mean value. Same as per the previous analysis, the COV of the pile response varied widely.

5. Discussion

MCS was adopted to calculate landslide failure probability, and 350 calculation results obtained from random field analysis were statistically analyzed. The safety factor was plotted on the X-axis to determine the cumulative probability distribution. We transformed the sample data by taking the logarithm and then used the mean value and sample variance to create a cumulative distribution curve for a lognormal distribution, as shown in the purple curve in Figure 16. It was found that the cumulative distribution curve of the safety factor was in good agreement with the lognormal distribution curve, indicating that the lognormal distribution curve could describe the distribution law of the safety factor well.
Figure 17 shows the estimation of the failure probability for landslides supported by an anti-sliding pile. As the COV, correlation coefficient and scale of fluctuation increased, the failure probability tended to increase. With the increase in the rotation angle, the failure probability showed a periodic fluctuation similar to the sinusoidal trigonometric function, as illustrated in Figure 17d.
The method proposed in this paper effectively quantified the random response of anti-sliding piles for the landslide considering spatial variability. After introducing the discontinuities of rock mass, the determination of spatial variation is more difficult [34]. Moreover, it is significant to expand the 2D numerical model to 3D; thus, the distribution and interaction of anti-slide piles need to be further analyzed [35,36]. Machine learning can also be used to link the monitoring data and failure modes of landslides when conducting a large number of numerical calculations and data processing [37,38]. As for the landslides caused by complex inducing factors [39,40], these research directions could help numerical systems to be closer to the actual working conditions, thus guiding the prevention of landslides.

6. Conclusions

Taking the Erdaogou landslide as an example, this study investigated the landslide reliability and random response of the anti-sliding pile when considering the spatial variability and rotational anisotropy of the sliding mass. The failure probability of the landslide reinforced by the anti-sliding pile was estimated, and the conclusions are listed below:
In deterministic analysis, the slip surface calculated by the limited equilibrium method in SLIDE2 and the strength reduction method in FLAC2D was consistent with the preset slip zone, and their safety factors were similar. Compared with random field variables, sliding mass parameters as random variables could overestimate the failure probability of landslides, which may lead to the waste of supporting materials and is not conducive to engineering design and construction.
When considering the spatial variability of the sliding mass, the mean value and COV of the pile top displacement presented similar trends, and the curve turned only when the vertical scale of fluctuation was equal to 10 m. However, the pile response trend was complex after introducing rotational anisotropy. In deterministic analysis, pile top displacement was 0.0701 m, and the maximum bending moment was 9.81 MN·m, which is lower than those obtained by the random field analysis. Therefore, it could be inferred that the spatial variability of sliding mass is not conducive to the stability of the anti-sliding pile.
The safety factors calculated by MCS were fitted with lognormal distribution to estimate the failure probability of landslides considering spatial variability and rotational anisotropy. The vertical scale of fluctuation showed a more obvious influence on the failure probability than that of the horizontal scale. Moreover, the failure probability increased with the rotation angle, showing a fluctuating trend similar to that found in existing research.

Author Contributions

Methodology, X.G.; Validation, L.W.; Investigation, Q.W.; Data curation, X.H.; Writing—review & editing, Y.Z.; Visualization, Y.W. All authors have read and agreed to the published version of the manuscript.

Funding

This study was funded by the Postdoctoral Innovative Talents Support Program, Chongqing (CQBX2021020), the Hebei Key Laboratory of Earthquake Disaster Prevention and Risk Assessment (FZ213203), the China Postdoctoral Science Foundation funded project (2021M700608), and the Natural Science Foundation of Chongqing, China (cstc2021jcyj-bsh0047).

Data Availability Statement

The data related to all the laboratory tests performed during the study are available from the corresponding author on request.

Conflicts of Interest

The authors declare no conflict of interest.

References

  1. Chen, H.; Jiang, G.; Zhao, X.; Zhu, D.; Liu, Y.; Tian, H. Seismic Response Evaluation of High-Steep Slopes Supported by Anti-Slide Piles with Different Initial Damage Based on Shaking Table Test. Materials 2022, 15, 3982. [Google Scholar] [CrossRef]
  2. Wang, L.; Wu, C.; Gu, X.; Liu, H.; Mei, G.; Zhang, W. Probabilistic stability analysis of earth dam slope under transient seepage using multivariate adaptive regression splines. Bull. Eng. Geol. Environ. 2020, 79, 2763–2775. [Google Scholar] [CrossRef]
  3. Wang, L.Q.; Xiao, T.; Liu, S.L.; Zhang, W.; Yang, B.; Chen, L. Quantification of model uncertainty and variability for landslide displacement prediction based on Monte Carlo simulation. Gondwana Res. 2023. [Google Scholar] [CrossRef]
  4. Chen, F.; Zhang, R.; Wang, Y.; Liu, H.; Böhlke, T.; Zhang, W. Probabilistic stability analyses of slope reinforced with piles in spatially variable soils. Int. J. Approx. Reason. 2020, 122, 66–79. [Google Scholar] [CrossRef]
  5. Khan, F.S.; Azam, S. Spatial variability in swelling of aggregated expansive clays. Innov. Infrastruct. Solut. 2016, 1, 11. [Google Scholar] [CrossRef]
  6. Wang, L.; Wu, C.; Tang, L.; Zhang, W.; Lacasse, S.; Liu, H.; Gao, L. Efficient reliability analysis of earth dam slope stability using extreme gradient boosting method. Acta Geotech. 2020, 15, 3135–3150. [Google Scholar] [CrossRef]
  7. Qin, C.B.; Zhou, J.F. On the seismic stability of soil slopes containing dual weak layers: True failure load assessment by finite-element limit-analysis. Acta Geotech. 2023, 1–23. [Google Scholar] [CrossRef]
  8. Wang, L.; Wu, C.Z.; Li, Y.Q.; Liu, H.; Zhang, W.; Chen, X. Probabilistic risk assessment of unsaturated slope failure considering spatial variability of hydraulic parameters. KSCE J. Civ. Eng. 2019, 23, 5032–5040. [Google Scholar] [CrossRef]
  9. Chen, F.; Wang, L.; Zhang, W. Reliability assessment on stability of tunnelling perpendicularly beneath an existing tunnel considering spatial variabilities of rock mass properties. Tunn. Undergr. Space Technol. 2019, 88, 276–289. [Google Scholar] [CrossRef]
  10. Zhang, W.G.; He, Y.W.; Wang, L.Q.; Liu, S.; Meng, X. Landslide Susceptibility Mapping Using Random Forest and Extreme Gradient Boosting: A Case Study of Fengjie, Chongqing. Geol. J. 2023. [Google Scholar] [CrossRef]
  11. Jiang, S.H.; Zeng, S.H.; Yang, J.H.; Yao, C.; Huang, J.; Zhou, C. Slope reliability analysis by simulation of non-stationary random field of undrained shear strength. Rock Soil Mech. 2018, 39, 1071–1081. (In Chinese) [Google Scholar]
  12. Chen, L.; Zhang, W.; Gao, X.; Wang, L.; Li, Z.; Böhlke, T.; Perego, U. Design charts for reliability assessment of rock bedding slopes stability against bi-planar sliding: SRLEM and BPNN approaches. Georisk Assess. Manag. Risk Eng. Syst. Geohazards 2020, 16, 360–375. [Google Scholar] [CrossRef]
  13. Chen, L.; Zhang, W.; Zheng, Y.; Gu, D.; Wang, L. Stability analysis and design charts for over-dip rock slope against bi-planar sliding. Eng. Geol. 2020, 275, 105732. [Google Scholar] [CrossRef]
  14. Gao, Y.; Li, Z.; Cui, W.; Sun, D.; Yu, H. Effect of initial void ratio on the tensile strength of unsaturated silty soils. Acta Geotech. 2023, 1–14. [Google Scholar] [CrossRef]
  15. Griffiths, D.V.; Huang, J.; Fenton, G.A. Probabilistic slope stability analysis using RFEM with non-stationary random fields. In Geotechnical Safety and Risk V; IOS Press: Amsterdam, The Netherlands, 2015; pp. 704–709. [Google Scholar]
  16. Wang, C.; Leng, X.L.; Li, H.L.; Li, G. Probabilistic stability analysis of underground caverns considering spatial variation of joint distribution. Rock Soil Mech. 2021, 42, 224–233. [Google Scholar]
  17. Zhu, D.; Griffiths, D.V.; Fenton, G.A. Worst-case spatial correlation length in probabilistic slope stability analysis. Géotechnique 2019, 69, 85–88. [Google Scholar] [CrossRef]
  18. Liu, L.L.; Deng, Z.P.; Zhang, S.H.; Cheng, Y.M. Simplified framework for system reliability analysis of slopes in spatially variable soils. Eng. Geol. 2018, 239, 330–343. [Google Scholar] [CrossRef]
  19. Li, D.Q.; Xiao, T.; Cao, Z.J.; Zhou, C.B.; Zhang, L.M. Enhancement of random finite element method in reliability analysis and risk assessment of soil slopes using Subset Simulation. Landslides 2016, 13, 293–303. [Google Scholar] [CrossRef]
  20. Oguz, E.A.; Yalcin, Y.; Huvaj, N. Probabilistic slope stability analyses: Effects of the coefficient of variation and the cross-correlation of shear strength parameters. In Proceedings of the Geotechnical Frontiers 2017, Orlando, FL, USA, 12–15 March 2017; pp. 363–371. [Google Scholar]
  21. Huang, J.; Zhao, J.; Duan, X.R.; Zhang, J. Reliability analysis for soil slopes reinforced with piles using shear strength reduction method. J. Civ. Environ. Eng. 2020, 42, 11–18. [Google Scholar]
  22. Li, L.; Liang, R.Y. Reliability-based design for slopes reinforced with a row of drilled shafts. Int. J. Numer. Anal. Methods Geomech. 2014, 38, 202–220. [Google Scholar] [CrossRef]
  23. Gong, W.P.; Tang, H.M.; Juang, C.H.; Wang, L. Optimization design of stabilizing piles in slopes considering spatial variability. Acta Geotech. 2020, 15, 3243–3259. [Google Scholar] [CrossRef]
  24. Lü, Q.; Xu, B.; Yu, Y.; Zhan, W.; Zhao, Y.; Zheng, J.; Ji, J. A practical reliability assessment approach and its application for pile-stabilized slopes using FORM and support vector machine. Bull. Eng. Geol. Environ. 2021, 80, 6513–6525. [Google Scholar] [CrossRef]
  25. Vanmarcke, E.H. Probabilistic modeling of soil profiles. J. Geotech. Eng. Div. 1977, 103, 1227–1246. [Google Scholar] [CrossRef]
  26. Cho, S.E. Probabilistic stability analysis of rainfall induced landslides considering spatial variability of permeability. Eng. Geol. 2014, 171, 11–20. [Google Scholar] [CrossRef]
  27. Cho, S.E. Effects of spatial variability of soil properties on slope stability. Eng. Geol. 2007, 92, 97–109. [Google Scholar] [CrossRef]
  28. Lü, Q.; Xiao, Z.; Zheng, J.; Shang, Y. Probabilistic assessment of tunnel convergence considering spatial variability in rock mass properties using interpolated autocorrelation and response surface method. Geosci. Front. 2018, 9, 1619–1629. [Google Scholar] [CrossRef]
  29. Li, K.S.; Lumb, P. Probabilistic design of slopes. Can. Geotech. J. 1987, 24, 520–535. [Google Scholar] [CrossRef]
  30. Zhu, H.; Zhang, L.M. Characterizing geotechnical anisotropic spatial variations using random field theory. Can. Geotech. J. 2013, 50, 723–734. [Google Scholar] [CrossRef]
  31. Tian, N.; Chen, J.; You, W.J.; Huang, J.; Zhang, J.; Yi, S.; Fu, X.; Tian, K. Simulation of undrained shear strength by rotated anisotropy with non-stationary random field. Chin. J. Geotech. Eng. 2021, 43 (Suppl. S2), 92–95. [Google Scholar]
  32. Cheng, H.; Chen, J.; Chen, R.; Chen, G.; Zhong, Y. Risk assessment of slope failure considering the variability in soil properties. Comput. Geotech. 2018, 103, 61–72. [Google Scholar] [CrossRef]
  33. Xu, B.S.; Liu, R.C.; Li, L.X.; Gong, M.; Wang, Y.K. Study of slope deformation and parameters sensitivity in supporting design of composite soil nailing wall. Rock Soil Mech. 2011, 32, 393–400. [Google Scholar]
  34. Wang, L.Q.; Huang, B.L.; Zhang, Z.H.; Dai, Z.; Zhao, P.; Hu, M. The analysis of slippage failure of the HuangNanBei slope under dry-wet cycles in the Three Gorges Reservoir Region, China. Geomat. Nat. Hazards Risk 2020, 11, 1233–1249. [Google Scholar] [CrossRef]
  35. Zhang, S.L.; Yin, Y.P.; Hu, X.W.; Wang, W.P.; Zhang, N.; Zhu, S.N.; Wang, L.Q. Dynamics and emplacement mechanisms of the successive Baige landslides on the Upper Reaches of the Jinsha River, China. Eng. Geol. 2020, 278, 105819. [Google Scholar] [CrossRef]
  36. Zhang, C.Y.; Yin, Y.P.; Yan, H.; Zhu, S.; Li, B.; Hou, X.; Yang, Y. Centrifuge modeling of multi-row stabilizing piles reinforced reservoir landslide with different row spacings. Landslides 2023, 20, 559–577. [Google Scholar] [CrossRef]
  37. Liu, S.L.; Wang, L.Q.; Zhang, W.G.; He, Y.; Pijush, S. A comprehensive review of machine learning-based methods in landslide susceptibility mapping. Geol. J. 2023. [Google Scholar] [CrossRef]
  38. Zhang, W.G.; Gu, X.; Hong, L.; Han, L.; Wang, L. Comprehensive review of machine learning in geotechnical reliability analysis: Algorithms, applications and further challenges. Appl. Soft Comput. 2023, 136, 110066. [Google Scholar] [CrossRef]
  39. Wang, L.Q.; Zhang, Z.H.; Huang, B.L.; Hu, M.; Zhang, C. Triggering mechanism and possible evolution process of the ancient Qingshi landslide in the Three Gorges Reservoir. Geomat. Nat. Hazards Risk 2021, 12, 3160–3174. [Google Scholar] [CrossRef]
  40. Zhang, K.Q.; Wang, L.Q.; Dai, Z.W.; Huang, B.; Zhang, Z. Evolution trend of the Huangyanwo rock mass under the action of reservoir water fluctuation. Nat. Hazards 2022, 113, 1583–1600. [Google Scholar] [CrossRef]
Figure 1. Stability analysis and the random response of anti-sliding piles considering spatial variability.
Mathematics 11 02318 g001
Figure 2. The classifications of spatial variability of the rock mass [30]. (a) Transverse anisotropy; (b) Rotated anisotropy.
Mathematics 11 02318 g002
Figure 3. Schematic diagram of the slope section [10].
Mathematics 11 02318 g003
Figure 4. The deterministic analysis of Erdaogou landslide. (a) Safety factor calculated by SLIDE2; (b) Safety factor calculated by FLAC 2D.
Mathematics 11 02318 g004
Figure 5. Variation in probability of failure and its COV with the number of MCS.
Mathematics 11 02318 g005
Figure 6. Influence of different COV on slope failure probability. (a) Random variable, (b) Random field variable.
Mathematics 11 02318 g006
Figure 7. Influence of different ρ c , φ on slope failure probability.
Mathematics 11 02318 g007
Figure 8. Summary of slip surfaces.
Mathematics 11 02318 g008
Figure 9. The position of anti-slide pile and anchor rod.
Mathematics 11 02318 g009
Figure 10. Variations in mean and standard deviation of monitoring parameters with the number of simulations. (a) Pile top displacement, (b) Maximum bending moment.
Mathematics 11 02318 g010
Figure 11. Influence of different COV. (a) Pile top displacement, (b) Maximum bending moment.
Mathematics 11 02318 g011
Figure 12. Influence of different ρ c , φ : (a) Pile top displacement, (b) Maximum bending moment.
Mathematics 11 02318 g012
Figure 13. Influence of different δ h . (a) Mean pile top displacement, (b) Maximum bending moment.
Mathematics 11 02318 g013
Figure 14. Influence of different δ v . (a) Mean pile top displacement, (b) Maximum bending moment.
Mathematics 11 02318 g014
Figure 15. Influence of different β. (a) Mean pile top displacement, (b) Maximum bending moment.
Mathematics 11 02318 g015
Figure 16. Cumulative distribution curves of safety factor.
Mathematics 11 02318 g016
Figure 17. Estimation of failure probability of landslide reinforced by anti-sliding pile: (a) COV, (b) Correlation coefficient ( ρ c , φ ), (c) Scale of fluctuation ( δ ), (d) Rotation angle ( β ).
Mathematics 11 02318 g017
Table 1. Properties of rock and soil mass.
Rock and Soil MassModulus of Elasticity (E)/MPaPoisson’s Ratio (μ)Severe (γ)/(kN·m−3)Cohesion (c)/(kPa)The Angle of Internal Friction (φ)/(°)
Silty clay with crushed stone (Q4del)400.3519.633.1513.37
Piece of gravel soil (Q3del)71.50.1519.7226.1229.4
Sliding-zone soil250.21721.0224.82
Stratified cataclastic rock mass (Q3col)90000.2625.529031.9
Middle Triassic Badong Formation (T2b)80000.2223100035
Table 2. Anchor mechanical properties.
TypeDensity (kg/m3)Modulus of Elasticity (GPa)Cross-Sectional Area/mm2Slurry Cohesion/(N/m)Internal Friction Angle/°Shear Stiffness/(N/m2)Paste the Perimeter/mmCompression Strength/kNTensile Strength/kN
Anchor7800195181.372 × 1050.081.75 × 107471337.35337.35
Disclaimer/Publisher’s Note: The statements, opinions and data contained in all publications are solely those of the individual author(s) and contributor(s) and not of MDPI and/or the editor(s). MDPI and/or the editor(s) disclaim responsibility for any injury to people or property resulting from any ideas, methods, instructions or products referred to in the content.

