1. Introduction
The growth in life expectancy has increased the demand for Home Health Care (HHC) [
1,
2]. HHC services primarily serve the elderly, disabled, or chronically ill and are largely dependent. In order to provide a full range of care, caregivers or health professionals are usually staffed by nurses, who may vary according to the needs of the patient [
3]. In Portugal, health units provide home care services to the population, and they need to optimize and reorganize their operation to meet the rising demand for HHC services [
4]. This is often due to manually scheduling home visits, making it a time-consuming and difficult procedure that frequently leads to an inefficient solution. In the context of HHC, the problem is to determine the schedule and route of vehicles with nurses to support the patients [
5], considering the travel time and/or distance, treatments required and the number of vehicles available to provide the service that patients need.
Currently, multi-objective optimization techniques have been used to target research in HHC [
6,
7,
8]. Many real situations may consider multiple objectives, such as to reduce costs, increase performance, increase reliability, among others [
9]. However, these are challenging yet doable issues [
10]. In HHC challenges, the objectives are considered to conflict with each other, and improving one objective function may produce unacceptable solutions in relation to the other objectives without worsening the overall solution. The idea of Pareto optimality becomes crucial when there are conflicting objectives, such as cost, time or unforeseen events, because it is typically impossible to find a single solution that optimizes all objective functions simultaneously [
11]. To assist the decision-maker choose the best solution based on his/her preferences, the Pareto optimal solutions are incomparable and form a Pareto front representing the trade-offs in the objective space [
12].
A theoretical and practical approach to optimize the sustainable HHC process is developed in this work to achieve environmental, social and governance (ESG) goals. ESG goals, namely in the social dimension, are issues that have an increasing impact on today’s society and, in turn, on the investment and decision-making by public or private health organizations. Thus, the motivation of this study is linked to the development of an automatic multi-criteria decision-support system to obtain a solution for scheduling and routing home care visits carried out by health professionals, reducing costs related to travel times and distances traveled by vehicles.
This study proposes the formulation of the HHC scheduling and routing problem as a multi-objective approach, taking into account the patients needs, the availability of health care professionals and vehicles. The goal of this approach is to obtain a sustainable HHC process optimal service route solution based on a compromise between three objectives: the total travel time, the travel distance and the vehicles available. Then, a real-world problem of an HHC planning is optimized using the Non-dominated Sorting Genetic Algorithm (NSGA-II) [
13]. The NSGA-II algorithm was chosen and implemented to deal with this approach due to its explicit diversity preservation mechanism, which favors sustainable multi-criteria formulations.
The main contribution of this work is the characterization of the trade-off between the three objectives, proving that they are conflicting measures. The purpose of this research is to identify the Pareto optimal set, a set of feasible compromise solutions that simultaneously minimize (or maximize) the objectives. The data were provided by a Portuguese health institution interested in this study, whose objectives were validated as the most relevant for its operational management. Using a Pareto-based methodology, decision-makers are provided with a wide range of options so they can examine the benefits and create daily operating plans.
2. Literature Review
Home Health Care is an extremely complex system, where management usually pays less attention to managing and planning the operation and is more concerned with increasing the standard of medical care. These health services are commonly related to multi-objective needs to support decision-making.
A multi-criteria system may require identifying decision-making priorities taking into account the multiple factors in order to assist the decision-maker to effectively select the most appropriate solutions based on their importance and impact on public health [
14].
Recent literature reviews by Cissé et al. [
15] and Fikar and Hirsch [
1] make an effort to highlight the generality of the formulations and approaches under study, as well as real application situations. The literature considers several objectives for the HHC problem. As a result, the most frequently addressed objectives are those related to vehicle routing and the cost or duration of nurses’ travel. Additionally, and in a more recent perspective, other objectives such as overtime work, service quality, workload balancing, optimal matching and sequencing tasks and/or patient preferences or priorities have been taken into account. For this reason, many works consider the HHC problem as a multi-objective approach.
Table 1 includes references where the HHC problem is handled as a multi-objective perspective, whose assumptions by the decision-maker are based on the patient needs, nurse skills, available resources and synchronization issues.
In the recent global economic slowdown, especially due to COVID-19, it is increasingly important to describe and select criteria in the decision-making process, such as time windows, periodicity, demand volatility, interruptions, government measures, continuity, customer satisfaction, among others [
23].
With the knowledge and review strategy previously presented by some studies, new approaches and applications emerged in the topic under study. Sun et al. [
24] proposed an important work in the response of patient and resource allocation between hospitals in a healthcare network through mathematical models to optimize multi-objectives such as time and distance during a pandemic. The time preferences of patients are taken into account in the procedure reported by Mankowska et al. [
20], together with a powerful heuristic as a resource for the solution. Hiermann et al. [
19], in turn, presented an application for solving a real-world multimodal HHC scheduling using different metaheuristics.
There are also many hybrid approaches using evolutionary algorithms, such as genetic or annealing approaches, for effective and intelligent solution of multi-objective models of allocation, routes and schedules on the topic of HHC [
25,
26,
27]. Braekers et al. [
16] developed a bi-objective model that assesses the trade-offs between costs and patient inconveniences using a metaheuristic based on a multi-directional local search algorithm using real data. In this segment, there are also authors who proposed more “precise” approaches, such as the use of goal programming and mixed-integer programming models presented in the Cappanera et al. [
28], or even the work presented by En-nahli et al. [
18] which uses CPLEX to solve a multi-objective mixed-integer linear programming problem in order to enhance decision-making in the assignment and routing problem in HHC. On the other hand, many works use constraint programming (CP) and (meta-)heuristics to solve multi-objective approaches [
2,
19,
21]. Furthermore, Jérémy et al. [
3] suggested a model that uses a multi-objective memetic algorithm to minimize the overall working time of the caregivers while optimizing the quality of care and reducing the maximum working time difference among nurses.
Moreover, some reference works were found that report many works developed on the emerging topic of HHC. In light of some of the bibliographical production, some research progress has resulted from Sharma and Mathew [
29] work on multi-objective network design models to solve transportation networks in terms of health-damage costs resulting from vehicle emissions as well as the system travel time. In this work, the Pareto-optimal solution is generated, considering the trade-offs between travel time and emissions in a sustainable approach. Furthermore, much of the evolution of research emerged from the work of Nickel et al. [
2] and Rasmussen et al. [
21], where the routing and scheduling problems, in the context of HHC, began to be seen as an emerging need, and preference-based visit clustering, operational research on planning and scheduling as future trends, respectively. Recently, some works published in the last two years continue to enhance multi-objective approaches in HHC applications [
6,
7,
22].
The evolution and growth in the training of health decision-making systems according to multi-objectives, often conflicting, demands that the literature of the scientific areas involved be highlighted so that more recent research is sustained with greater efficiency in multiple approaches. In this sense, a brief bibliometric analysis was carried out to validate the literature review involved with keywords such as “Multi-objective optimization”, “Health”, and “Scheduling/Planning”. Between 2010 and 2021, searches using the same keywords in the Scopus and Web of Science (WoS) databases produced 314 papers from various sources, including journals, books, and conference proceedings. After selecting the dataset, a pre-processing process was carried out to remove duplicate documents, where 67 papers were found. Thus, the current count of documents for review totals 247 papers. Regarding the final dataset, it is possible to analyze the annual scientific production presented in
Figure 1. The geometric progression rate, which in this case provides a consistent rate of scientific production in both databases over time, is known as the compound annual growth rate in the business world.
In multi-objective optimization related to HHC applied in scheduling/planning, the rate of scientific production shows sustained growth, confirming that these domains are increasingly emerging, especially in recent years. Furthermore, it is possible to verify some jumps that can be associated with turning points, representing the high growth of works and applications in the topic of keywords over the years [
30]. It is expected that the same behavior will continue due to the emerging need for resource optimization in the health area, whether human or material, and with one or more objectives.
The proposal presented in this work intends to contribute to the scientific community with three objective functions that characterize the patient’s needs, the nurse’s skills, and the available vehicles, allowing the optimization the three measures using a multi-objective approach to solve a real problem arising from a Portuguese National Institution.
3. Optimization System
A growing area in the social/medical service (solidarity institutions or public/private health units) is HHC, which refers to nurses, caregivers or specific health professionals who visit patients in their homes. It should be kept in mind that health centers and/or private companies employ health professionals who are partially dedicated to the treatment of patients at home who reside anywhere in the area under the control of the health center, requiring the allocation of different resources and the assignment of scheduling/routing services. A health care facility must provide the schedules of all nursing teams working on tasks/responsibilities inside and outside the facility on a given day, but may also require the operating plans for available vehicles.
Urban places, such as Bragança in Portugal, have extensive land areas and challenging access to many villages and smaller parts of the city, making them complex socio-ecological systems. Due to the great need for HHC by the growing elderly population that needs social and health support, these services need to innovate and optimize their resources to balance the provision of care. In order to keep up with the needs of the elderly population and contribute to a more personalized service, the health and social support units carry out constant visits to the patient’s homes. Usually, these visits involve allocations and routes defined in manual planning performed by managers or chief nurses without computational support. In this sense, the problem arises when optimization mechanisms are not given to the service objectives, which often conflict with supply and demand management. The above conflicting objectives prevent from finding the best solution that satisfies all of them. So, imagine a decision-maker wanting to optimize k objectives, which are not comparable and without an explicit and clear preference for some objectives over others, it is difficult to achieve the best solution.
For this challenge, from a conceptual point of view, the architecture of
Figure 2 has a disruptive approach and computational decision mechanisms according to several criteria, encouraging operational competitiveness as well as strategic and tactical planning to ensure the effectiveness of the number of vehicles employed, improved resource allocation, task balancing and, finally, optimization of routes and schedules.
The idea of this conceptual architecture is to enhance its emerging application in home care visits, in the need to properly allocate health professionals and vehicles to optimized routes (minimizing one or more objectives). More specifically, it is intended to automate the operational process and the management of home visits in a real HHC problem through a multi-criteria approach, where three objective functions are simultaneously optimized, that is, the time and distances spent, as well as a better workload-balance of available vehicles. In this study an evolutionary multi-objective algorithm is used to determine useful trade-offs between conflicting objectives to produce a set of non-dominated solutions, which constitute the Pareto-optimal front [
11]. In the end, the Pareto-optimal solutions are analyzed to represent the best trade-offs between decision-maker preferences and operational planning management, enabling the institution to allocate resources better, optimize routes and schedules, and improve the quality and response time.
4. Multi-Criteria Approach
The HHC planning is one of the most difficult systems from the point of view of decision-making with multiple objectives, thus becoming prone to inefficiency in the final solution. For that reason, multi-criteria planning becomes a tool to assist in this difficult decision-making process. The methodology used to generate the Pareto-optimal front is shown in
Figure 3, which starts from an initial procedure based on a multi-objective evolutionary approach. The basic idea is to discard the dominated solutions from the results to get the Pareto-optimal solutions. The process of representation (visualization tool) helps the validation of Pareto-optimal solutions.
In the first phase, the optimization system will be specified, directly linked to the actors of the decision-making process, and designed to consider the multi-criteria model to simplify the decision problem with multiple objectives. In this sense, to coordinate and enable the system, the multi-objective formulation (sets, parameters, constraints, and objectives) that will support the computational system is presented in the second phase.
4.1. Multi-Objective Problem Formulation
There are some difficulties in the HHC services, such as poor planning of resources and poorly planned times for home visits, causing a long time to obtain the solution and increasing the costs of the Health Units. To overcome these difficulties, a computer support system is needed to assist in the vehicle scheduling for home visits used by nurses, according to the treatment needs, the patients, and the time and distances of the trips to be planned and performed. The number of vehicles employed, the health professionals involved, the patients who request home care and, implicitly, the treatments necessary for patients and provided by nurses, as well as the time and distance to which the various scheduling routes are subject, must be modeled due to the complexity of the problem.
It is crucial to define the properties and/or general assumptions of the problem, such as the HHC planning process, which includes geographical area, resource dimension and their different instances. Thus, thinking about the Health Unit in Bragança (HUB) with qualified home care personnel, the following information is considered (including mathematical model sets):
the locations of all patients, where is the set of places for home care visits, such that is the corresponding index set;
the trip’s duration between the different locations, where is the time matrix between the locations and represents the travel time from node i to node j, for ;
the distance traveled between the different locations, where is the distance matrix between the locations and represents the travelled distance from node i to node j, for ;
each patient’s treatment plan are known (given by HUB), where is the set of treatments that patients are expected to receive, such that is the corresponding index set;
the available treatments and the average execution time are known, where Q is the vector with treatments duration, ;
the number of patients assigned to days of HHC visits, where is the set of patients who need to receive home visits, such that is the corresponding index set;
the number of vehicles available, where is the set of vehicles (with nurse allocated) used as the travel resources in the HHC, such that is the corresponding index set.
In addition, some assumptions of the problem are also considered:
all visits start and end at the HUB (depot);
patients with various profiles may reside in the HUB area;
the patient’s profile is known;
all patients admitted to home care visits must be assigned to a group of nurses or vehicles in order to ensure that all patients assigned to a working day are covered;
the average travel time for different patients in the same location or residential area (defined by the health unit) is considered;
the average travel distance for different patients at the same location or residential area (defined by the health unit) is considered;
only one health professional is allocated to each vehicle.
Considering a routing network with nodes (node 0 is the healthcare unit and the others are patient locations) and is the set of routes. The travel time and travel distance occurs for each arc needed to carry out the care and go back to the beginning location. The following parameters are used to define a problem instance:
: equal to 1 if patient can be visited by vehicle (matching between treatment requested and nurse skill) ; 0 otherwise;
: maximum time duration of any vehicle route (maximum nurse shift duration);
: maximum distance of any vehicle route (limited distance per day).
This work suggests a formulation for mixed integer flow with three sets of decision variables:
—binary variable, 1 if the vehicle goes from to visit patient at location ; 0 otherwise.
—real variable, used to quantify the time spent on travel from location i to location j by vehicle k.
—real variable, used to quantify the distance traveled from location i to location j by vehicle k.
Moreover, another decision variable is used to eliminate subtours, is an integer corresponding to the place in the visit sequence of vehicle k for the location/patient i.
The HHC problem optimization involves three objective functions that can be described as:
where Tmax in (
1) is the maximum value of the total amount of time spent by the caregivers (health professionals), Kmmax in (
2) is the maximum value of the total amount of distance spent by the vehicles and Cmax in (
3) is the number of vehicles used among those available. The goal of the three objective functions is to achieve the minimization of the longest route, both in terms of time (minutes) and distance (kilometers), as well as to accomplish optimization of the vehicles usage, by considering the details of the assumptions, sets and parameters. More details can be found in [
31].
As the objective is to identify the strengths and the best vehicle scheduling strategy that simultaneously reduces the visit times and distances, the proposed optimization model is then mathematically expressed in the following concise manner.
Constraints (
5) make sure all vehicles begin in the depot, while constraints (
6) ensure all vehicles arrive at the depot. On the other hand, constraints (
7)–(
8) state that each patient is visited exactly once and by only one vehicle, respectively. The constraints (
9) state that the same vehicle arrives and leaves a given patient node. Constraints (
10) and (
11) impose an upper bound on the flow in the arcs. Constraints (
12) and (
13) initialize flow in the arc from the depot to the first patient to equal the travel time and distance traveled. After that, constraints (
14) and (
15) are flow conservation equations and ensure that the flow on each arc accumulates trips, service times and distances from all previous visits on a route. Finally, constraints (
16) ensure every patient is visited by a specific vehicle (synchronization of care requested and nurses’ skills), according to the compatibility coefficients. The subtour elimination constraints are expressed by (
17) ensuring that the solution contains no cycles disconnected from the depot (
M is a large number). Constraints (
18), (
19), and (
20) define the lower bounds and types for the variables. There will be a number of variables that, if the compatibility matrix between patients and vehicles is too strict (
16), will be bound and set to zero by constraints, thereby removing the variables from the formulation. The number of constraints is in the order of
, most of them being the bounds on real variables imposed by the constraints (
10) and (
11). In addition, the health unit allocates only one health professional to each vehicle, considering the skills and route (it can be your personal vehicle or not). These constraints are related to the limitations imposed by the HUB to guarantee the feasibility of the service without overloading other activities.
Taking into account the mathematical modeling presented and to guide and support the operational planning, an approach was developed to solve the HHC problem using an evolutionary multi-objective optimization method, the NSGA-II, which has been used to solve a variety of optimization problems, including routing and scheduling problems [
32]. In complex problems belonging to non-deterministic classes, evolutionary multi-objective optimization methods are promising algorithms for searching for fast and good solutions, which is why it was one of the reasons for choosing the NSGA-II.
This kind of work frequently takes into account unrealistic assumptions, which are typically established using datasets in multi-objective scenarios (e.g., it is a popular belief that one unit of travel distance equals one unit of time traveled, although this may not be true, especially when on-the-road distance is given instead of Euclidean distance). Currently, precise information about the travel time and distance between two locations is gathered using Google Maps. These distinct and asymmetric data show a reasonable trade-off between travel time and distance. Examples of distinctions between urban and rural settings (travel time is high compared to the corresponding distance if access is via motorway or secondary roads, traffic, obstructed lanes, or one-way roads, among others). The assessment of multi-objective optimization is significantly more accurate under this assumption since the trip duration is not directly related to the distance traveled.
4.2. Multi-Objective Genetic Algorithm
The popular metaheuristic genetic algorithm (GA) is especially effective for this class of problems, such as scheduling, allocation and routing problems [
26,
33,
34]. By incorporating techniques to encourage solution variety and employing specific fitness functions, traditional GA are modified to account for multi-objective issues. When it comes to multi-objective optimization, there are two general methods. The first, called scalarization methods, consists of aggregating all the objective functions into a single function (e.g., weighted sum method, min-max technique) or including all but one objective function in the constraint set (
-constraint method). The single-objective problem can be solved using trade-offs in the first scenario but choosing the right weights or utility functions to describe preferences in decision-making is a challenge. The second broad strategy, on the other hand, entails approximating the complete Pareto optimal solutions set or selecting a representative subset. A set of solutions that are non-dominated concerning any other workable alternative is known as a Pareto optimal set [
35].
A second approach was adopted in this work, the elitist non-dominated genetic sorting algorithm, NSGA-II, proposed by Deb et al. [
13]. It is an upgraded version of NSGA [
36]. This multiple objective evolutionary algorithm mimics how species evolves naturally. Groups of individuals created at random are the basis of evolution. Each individual is a relevant solution to a multi-objective optimization problem. In NSGA-II, crowding metrics and Pareto rank are used to score each member of the current population. First, all non-dominated individuals in the current population are assigned the best rank. The highest ranked solutions will be removed from the current population. All non-dominated solutions in the remaining population are ranked second best. This assigns a rank to all solutions in the current population. The most suitable (“fittest”) individuals are more likely to be selected by genetic operators to create new individuals. In order to choose a set of coverage solutions, binary tournament selection is used by NSGA-II and is based on crowding distance and non-dominant rank. If two solutions are selected, preference will be given to the solution with the lowest non-domination rank. Otherwise, when the two solutions have equal ranks, the one with the largest crowding distance is chosen. After then, a population of offspring is produced via genetic operators like recombination and mutation. To establish a new population that is structured along various non-dominated fronts, the two populations are combined. All members of the first non-dominated frontier are chosen as the new population if their size is smaller than the existing population. From the subsequent non-dominant fronts, the remaining population members are chosen in rank order.
5. Real-Case Scenario
This work aims to use the developed multi-objective model to address essential logistics in the Health Unit of Bragança, namely in optimizing the HHC service. The Health Care Center of Bragança provided the information that was used (selected by the institution and represented a typical workday in the center). The information provided by the HUB refers to a single day in March 2020.
The case under study is associated with a real day of home care visits to be carried out by the assigned nurses (proportional to the number of vehicles) of the HUB. The Health Unit has five vehicles available (
) to visit 22 patients in their homes for home care (
). Out of five possible therapies (treatments), each patient needs a particular one (care strategy followed by the health unit,
). Each treatment is performed with associated average time, in minutes, as shown in
Table 2.
The information about the different treatments required by the patients to be provided by the nurses is presented in the following points. This data, also presented in Alves et al. [
37] describes and characterizes different treatments performed by the health organization in Bragança, information that is still current and in a standard version that is still practiced in the service. Therefore, the description and characterization of the treatments include:
Treatment 1 (Curative)—Treatments for pressure ulcers, venous ulcers, surgical wounds, traumatic wounds, ligaments, suture removal, burns, assessment and dressing of wound dressings are a few examples. Average time of 30 min.
Treatment 2 (Surveillance and Rehabilitation)—Evaluation, execution and patient surveillance. Average time of 60 min.
Treatment 3 (Curative and Surveillance)—Wound care, bandage supervision, frequency, and tension monitoring, patient education regarding complications and pathologies. Average time of 75 min.
Treatment 4 (Surveillance)—Evaluate patient habits, self-care needs, the risk of falls and the provider’s understanding. Height, stress and heart rate are all monitored. Dietary and medical routines of patients. Average time of 60 min.
Treatment 5 (General)—Assess, encourage and impart knowledge on mourning. Average time of 60 min.
The patients are distributed throughout the region of Bragança in nine distinct places (
).
Table 3 lists each patient’s place in relation to the locations of domiciliary visits (abbreviated for confidential data protection).
Table 4 illustrates the travel time (in minutes) between the
locations, where the diagonal value represents the typical amount of time (defined by 15 min) needed to travel between two patients in the same area. On the other hand,
Table 5 provides the distances, in kilometers, between the
locations. The diagonal value of 10 km is the travel distance between two patients in the same area.
These values on the diagonals, both in
Table 4 and in
Table 5, are assigned by the HUB in which the institution prefers higher average values (time and distance) between locations in the same area (that are not always realistic) in order to ensure that they are not exceeded by unexpected events.
The real data also reveal some constraints, which affect the objective functions and limit time and distance in the domiciliary service. Thus, the shifts for home care activities do not exceed 480 min (), that is, 8 h of daily work and 200 km () to be covered by each vehicle per day (maximum estimated distance in the region). These constants represent imposed or estimated limitations to allocate the health team to HHC without overloading activities in the HUB.
The main goal is to find the best vehicle planning solutions based on all available data (variables and constraints), taking into account the trade-offs between the objectives in order to optimize the number of vehicles used, the total time and the total distance, essentially to perform the treatments the patient needs and then return to the starting point.
6. Results and Discussion
Simulations were run on an Intel(R) Core (TM) M-5Y71 CPU running at 1.4 GHz with 8.0 GB of RAM in an effort to automatically plan the schedules by solving the multi-objective problem. The multi-objective GA algorithm used in this study is the gamultiobj function [
13], implemented in the Global Optimization Toolbox of MatLab
®, that is a variant of the elitist NSGA-II, This function allows users to customize the random key parameters, algorithm properties and termination criteria. Even if they have a lower fitness value, a controlled elitist GA promotes individuals who can help improve the population diversity [
38]. The default values for the population size and the maximum number of generations were set to 50 and 500, respectively. Due to the algorithm’s stochastic behavior, 30 separate runs with a random initial population were carried out, and the maximum number of generations was used as the stopping condition, which was set at 1000. Since the Pareto proportion is 0.35 by default, specific solutions are discovered for each run (
).
The optimization of the multi-objective approach involves the construction of the Pareto optimal front, finding the set of feasible trade-off solutions to facilitate the decision-maker in choosing his/her best option. Then, after obtaining all solutions, a smart and personalized routine that uses efficient computational methods must be created to allow the collection of non-dominated solutions [
39]. This strategy will allow the performance and efficiency of the multi-criteria approach, allowing the quick removal of dominated and/or duplicated solutions.
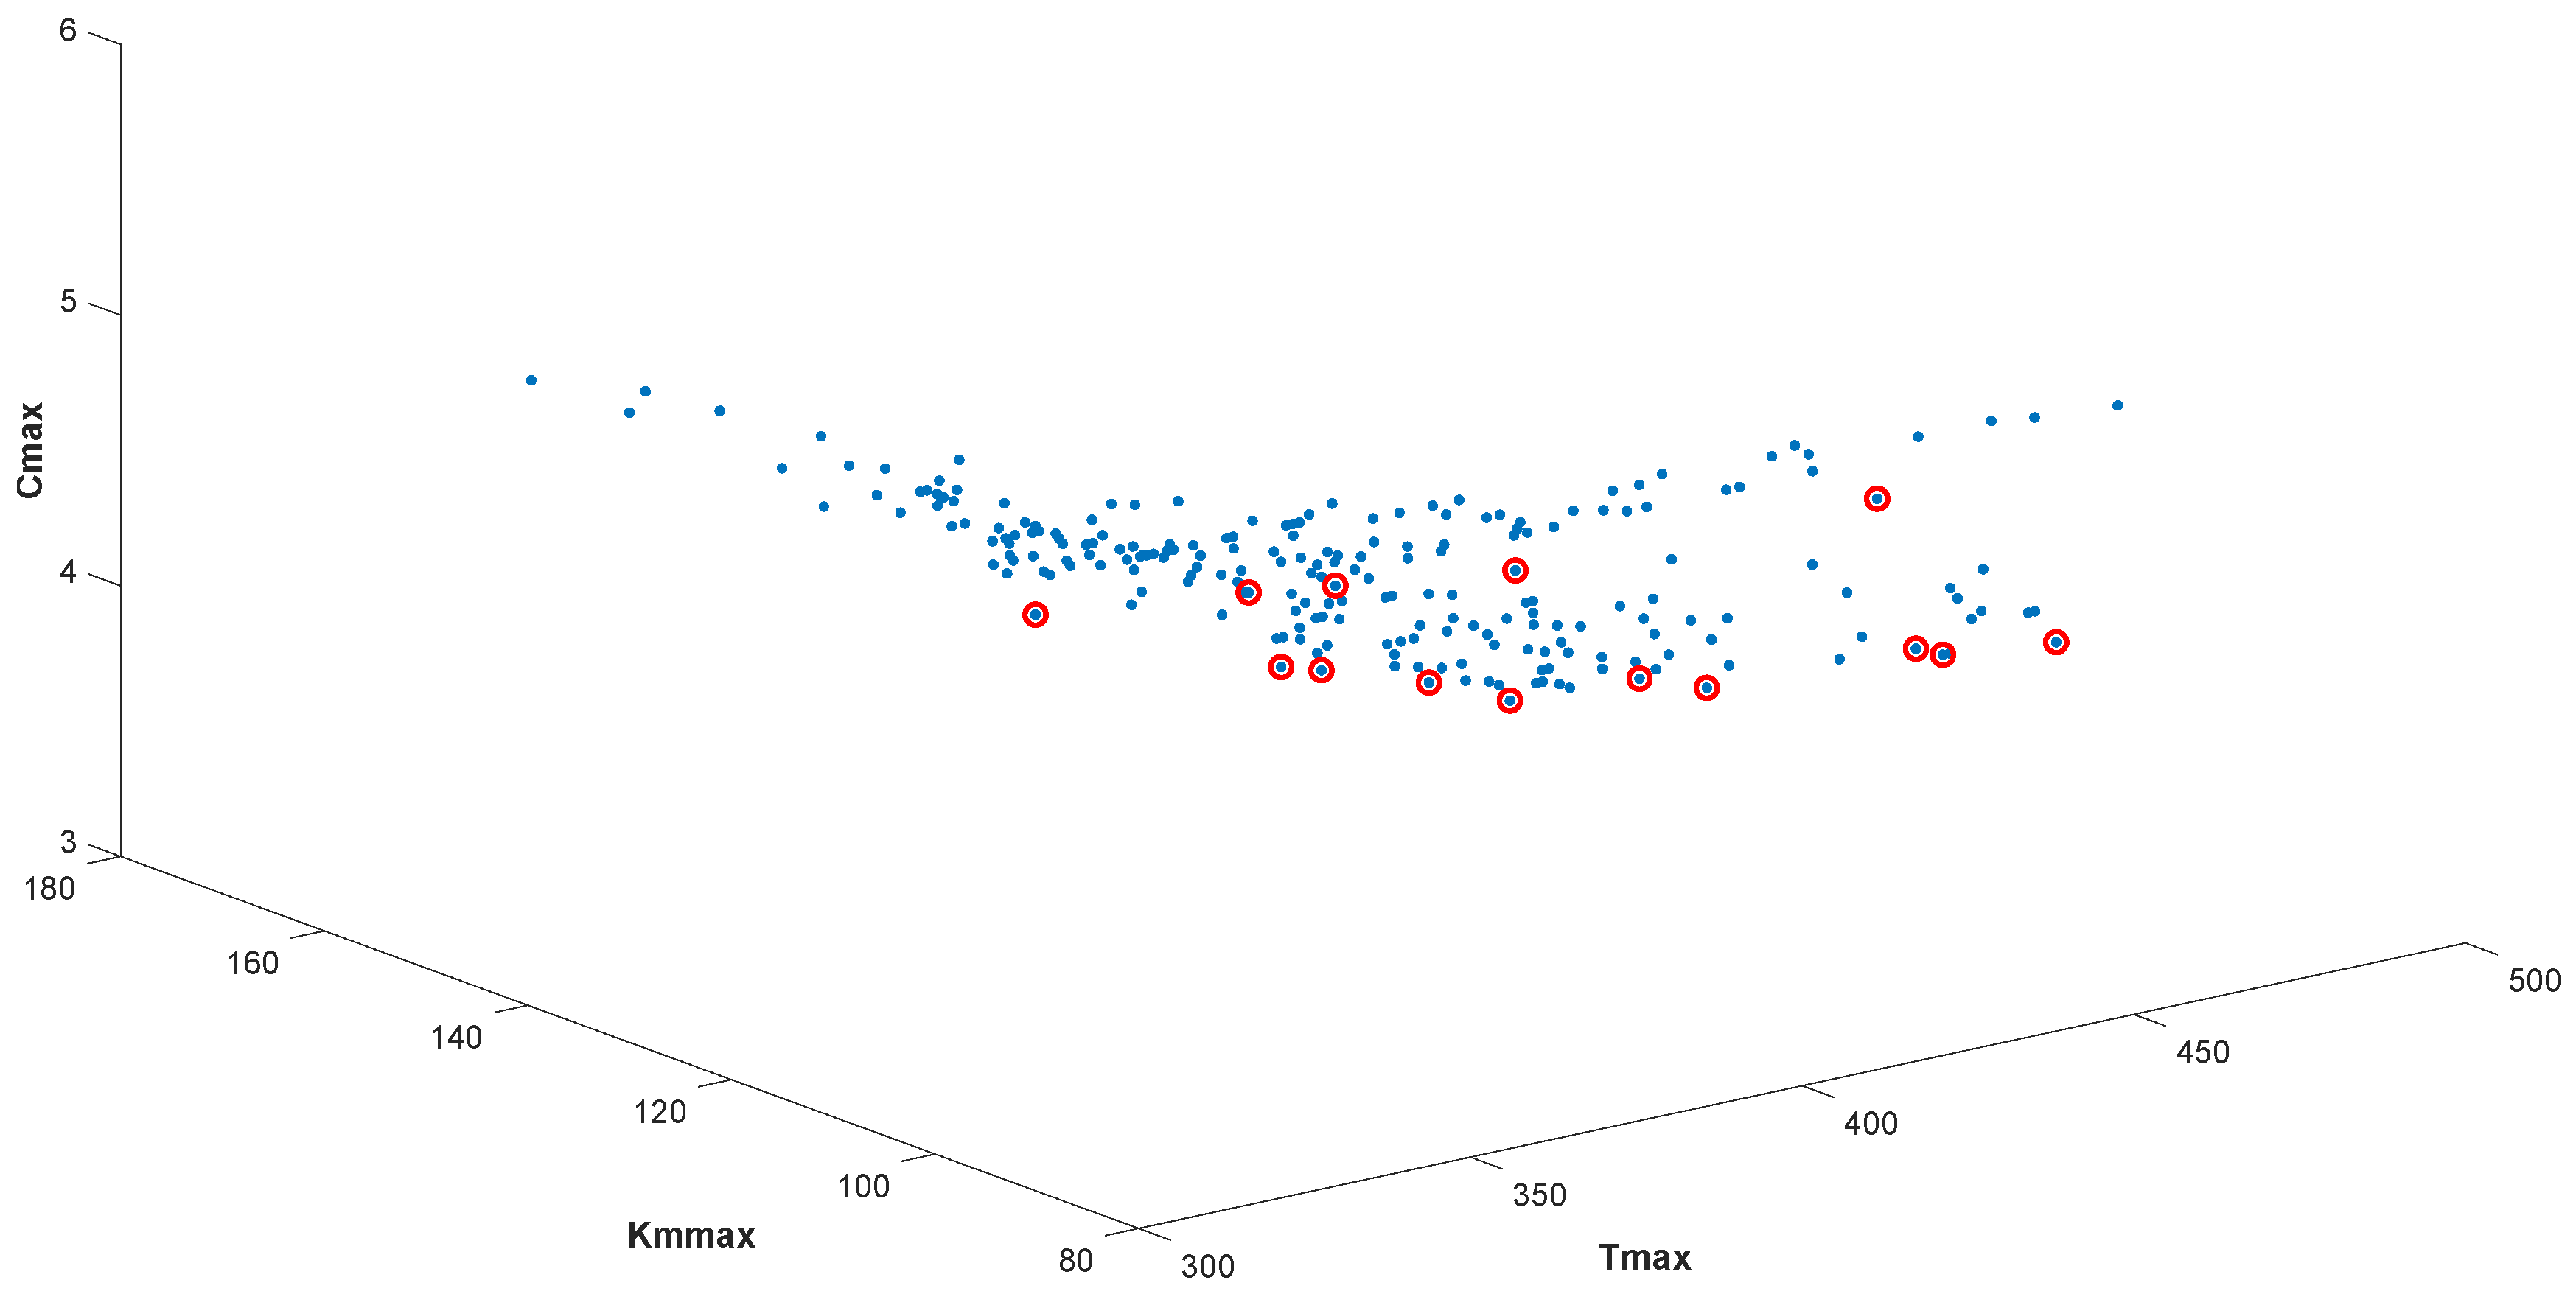
From this perspective, having identified and defined the set of non-dominated solutions in the objective space, it is possible to use graphs to represent and visualize the Pareto front (Pareto optimal set solutions). A blue dot represents all solutions found among the 30 independent runs in all graphs. From this overall set of results, the non-dominated solutions that form the Pareto front were identified with a red circle. It should be noted that the solutions were obtained in a reasonable time, in the average order of 30 s and never more than 1 min.
Figure 4 depicts the Pareto front, showing the dominated and non-dominated solutions obtained when the three objective functions are optimized simultaneously, i.e., solving the multi-criteria problem (
4).
The positions of the non-dominated solutions express the compromises between the objectives, particularly: the time in minutes in the Tmax axis, the distance in kilometers in the Kmmax axis, and finally, the number of vehicles is represented in Cmax axis. It can be seen, from
Figure 4, the set of the most interesting solutions, comprising fourteen different non-dominated solutions. These are the solutions that must be considered since they are optimal in terms of the objectives, and each solution shows a trade-off that needs to be carefully considered and explored.
Table 6 displays the collection of non-dominated solutions, whose first column identifies the solution number, and the other three columns refer to the value obtained for each objective. The solutions were ordered from lowest to highest value using the Tmax objective value as an example. In this manner, it is easier to analyze the various trade-offs between the solutions in the context of the objectives.
Since no single solution optimizes all the objectives simultaneously, the set of non-dominated solutions shows the non-trivial nature of the multi-objective optimization problem. A solution is said to be non-dominated or Pareto optimal if none of the objective functions can be improved without degrading some of the other objective values. Thus, as much as there is a set of finite and optimal solutions, it is important to mention that without a subjective information preference, all of them are considered equally good. However, these solutions make it possible to present and quantify some trade-offs between different objectives, possibly focusing on the insights gained from the difference. In a posterior analysis, these solutions allow the decision-maker to choose a preferred solution from the set of solutions, which can correspond to an extreme point that minimizes one of the objectives (for example, Tmax) or a solution weighted in the three objectives that best translate an approximation to the optimal point (intermediate or elbow point solution).
Note that the non-dominated solutions have a number of vehicles, Cmax, equal to 4 and 5. This is due to the fact that solutions with less than four vehicles would exceed the imposed and estimated constraints that regulate the health unit in terms of working time.
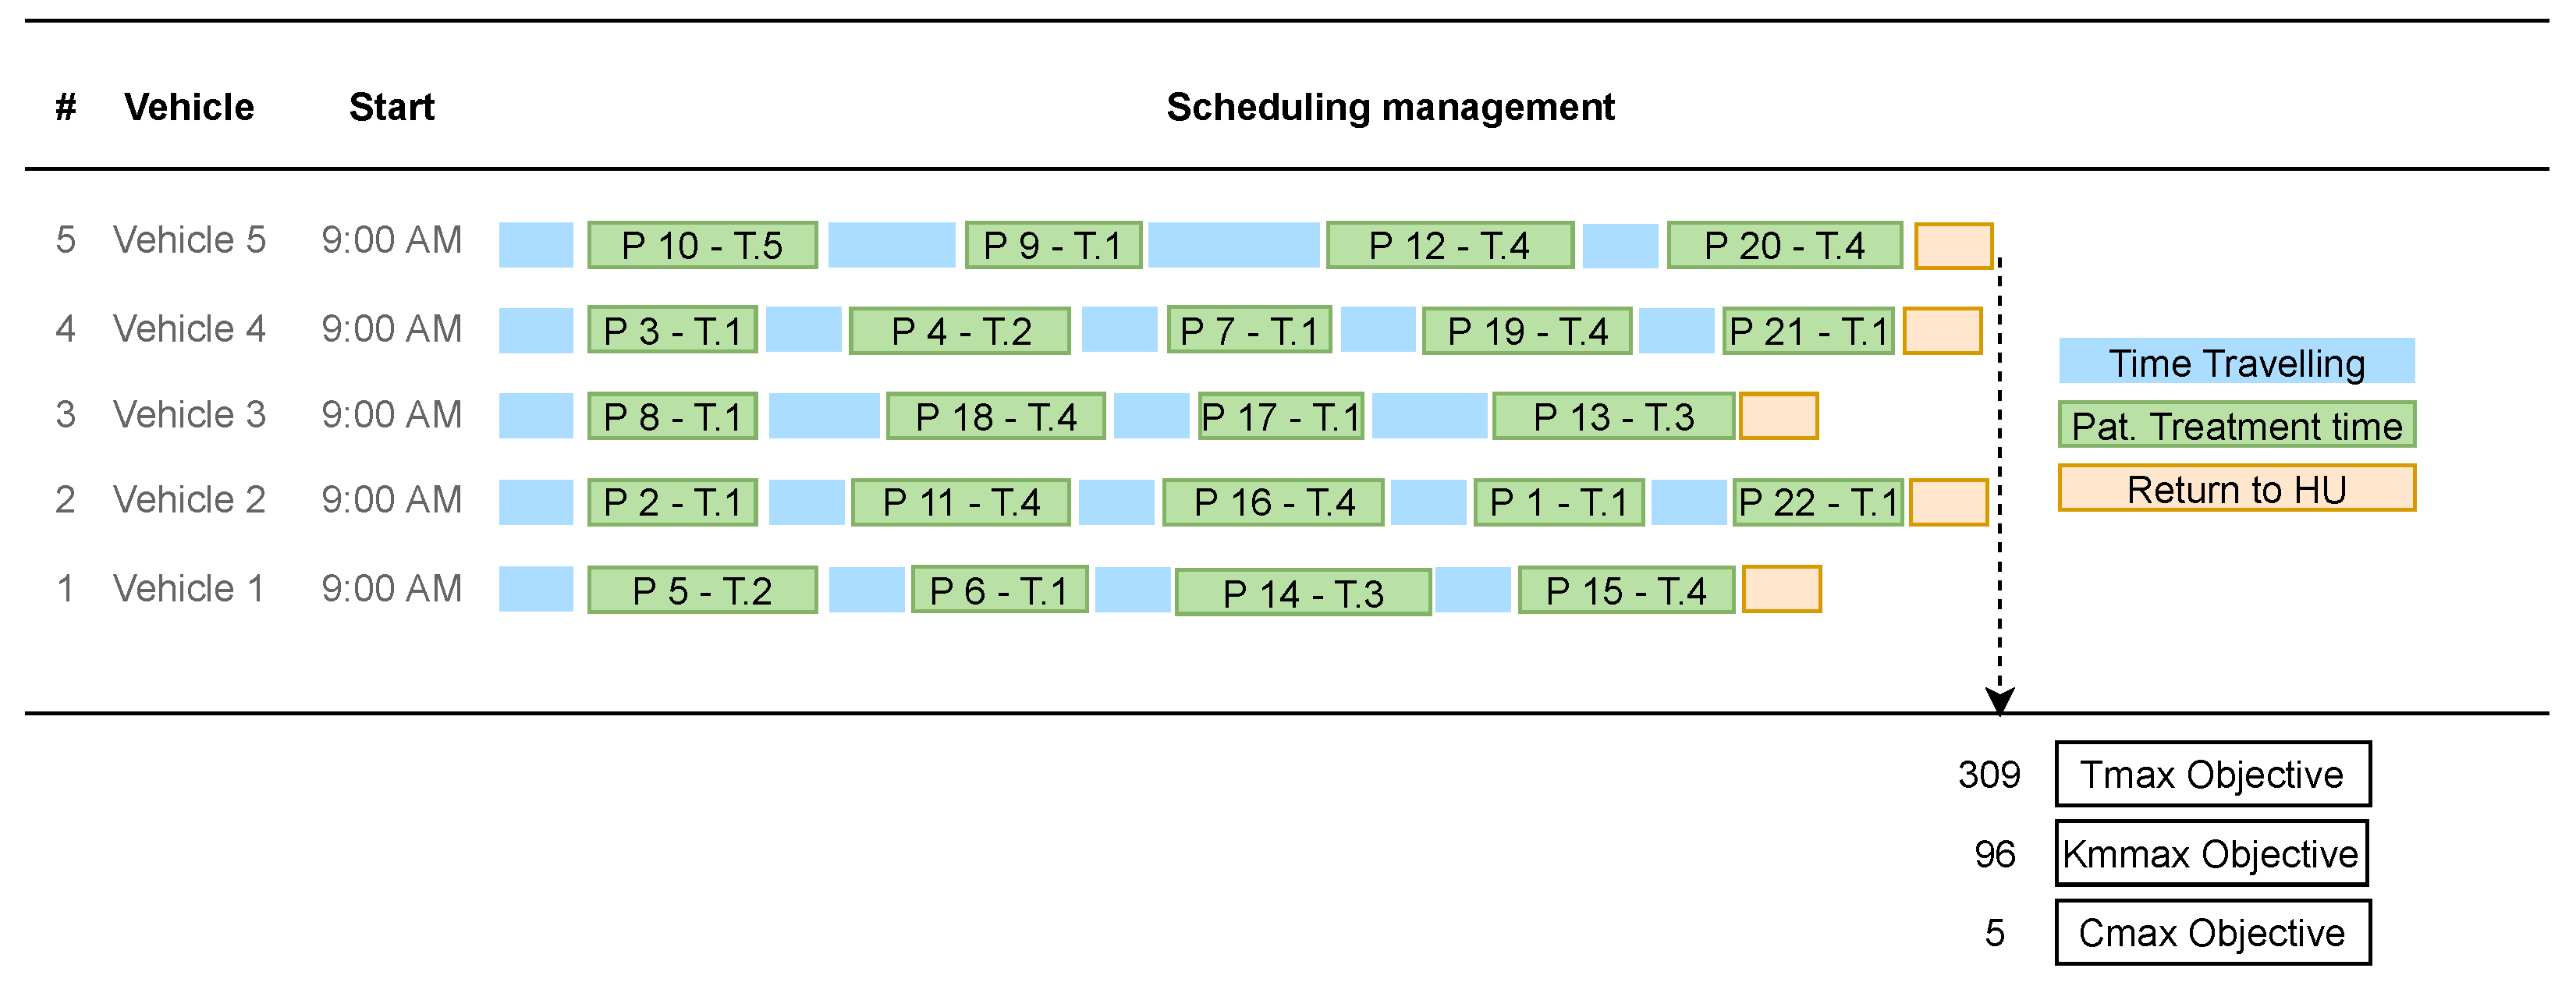
In this sense, a representative, non-dominated solution, solution #1, was chosen in order to discuss the trade-offs between the objectives and to identify the characteristics of this solution. The scheduling management of this solution that best characterizes the objective Tmax is illustrated (Gantt chart) in
Figure 5.
The selected solution fell on those that best represent the Tmax objective, i.e., those that best characterize the time spent on home care visits (solution #1). This solution concerns the extreme point that represents the best result according to the objective Tmax (value of 309), but on the other hand, it is not so good in the remaining two objectives (it requires a maximum of 96 km to end the day of visits, and it needs the five vehicles available).
Figure 5 shows the allocation of patients to each vehicle, presenting the routes that best configure and characterize the minimization of the time spent. The management of this scheduling presents a good workload balancing among all vehicles.
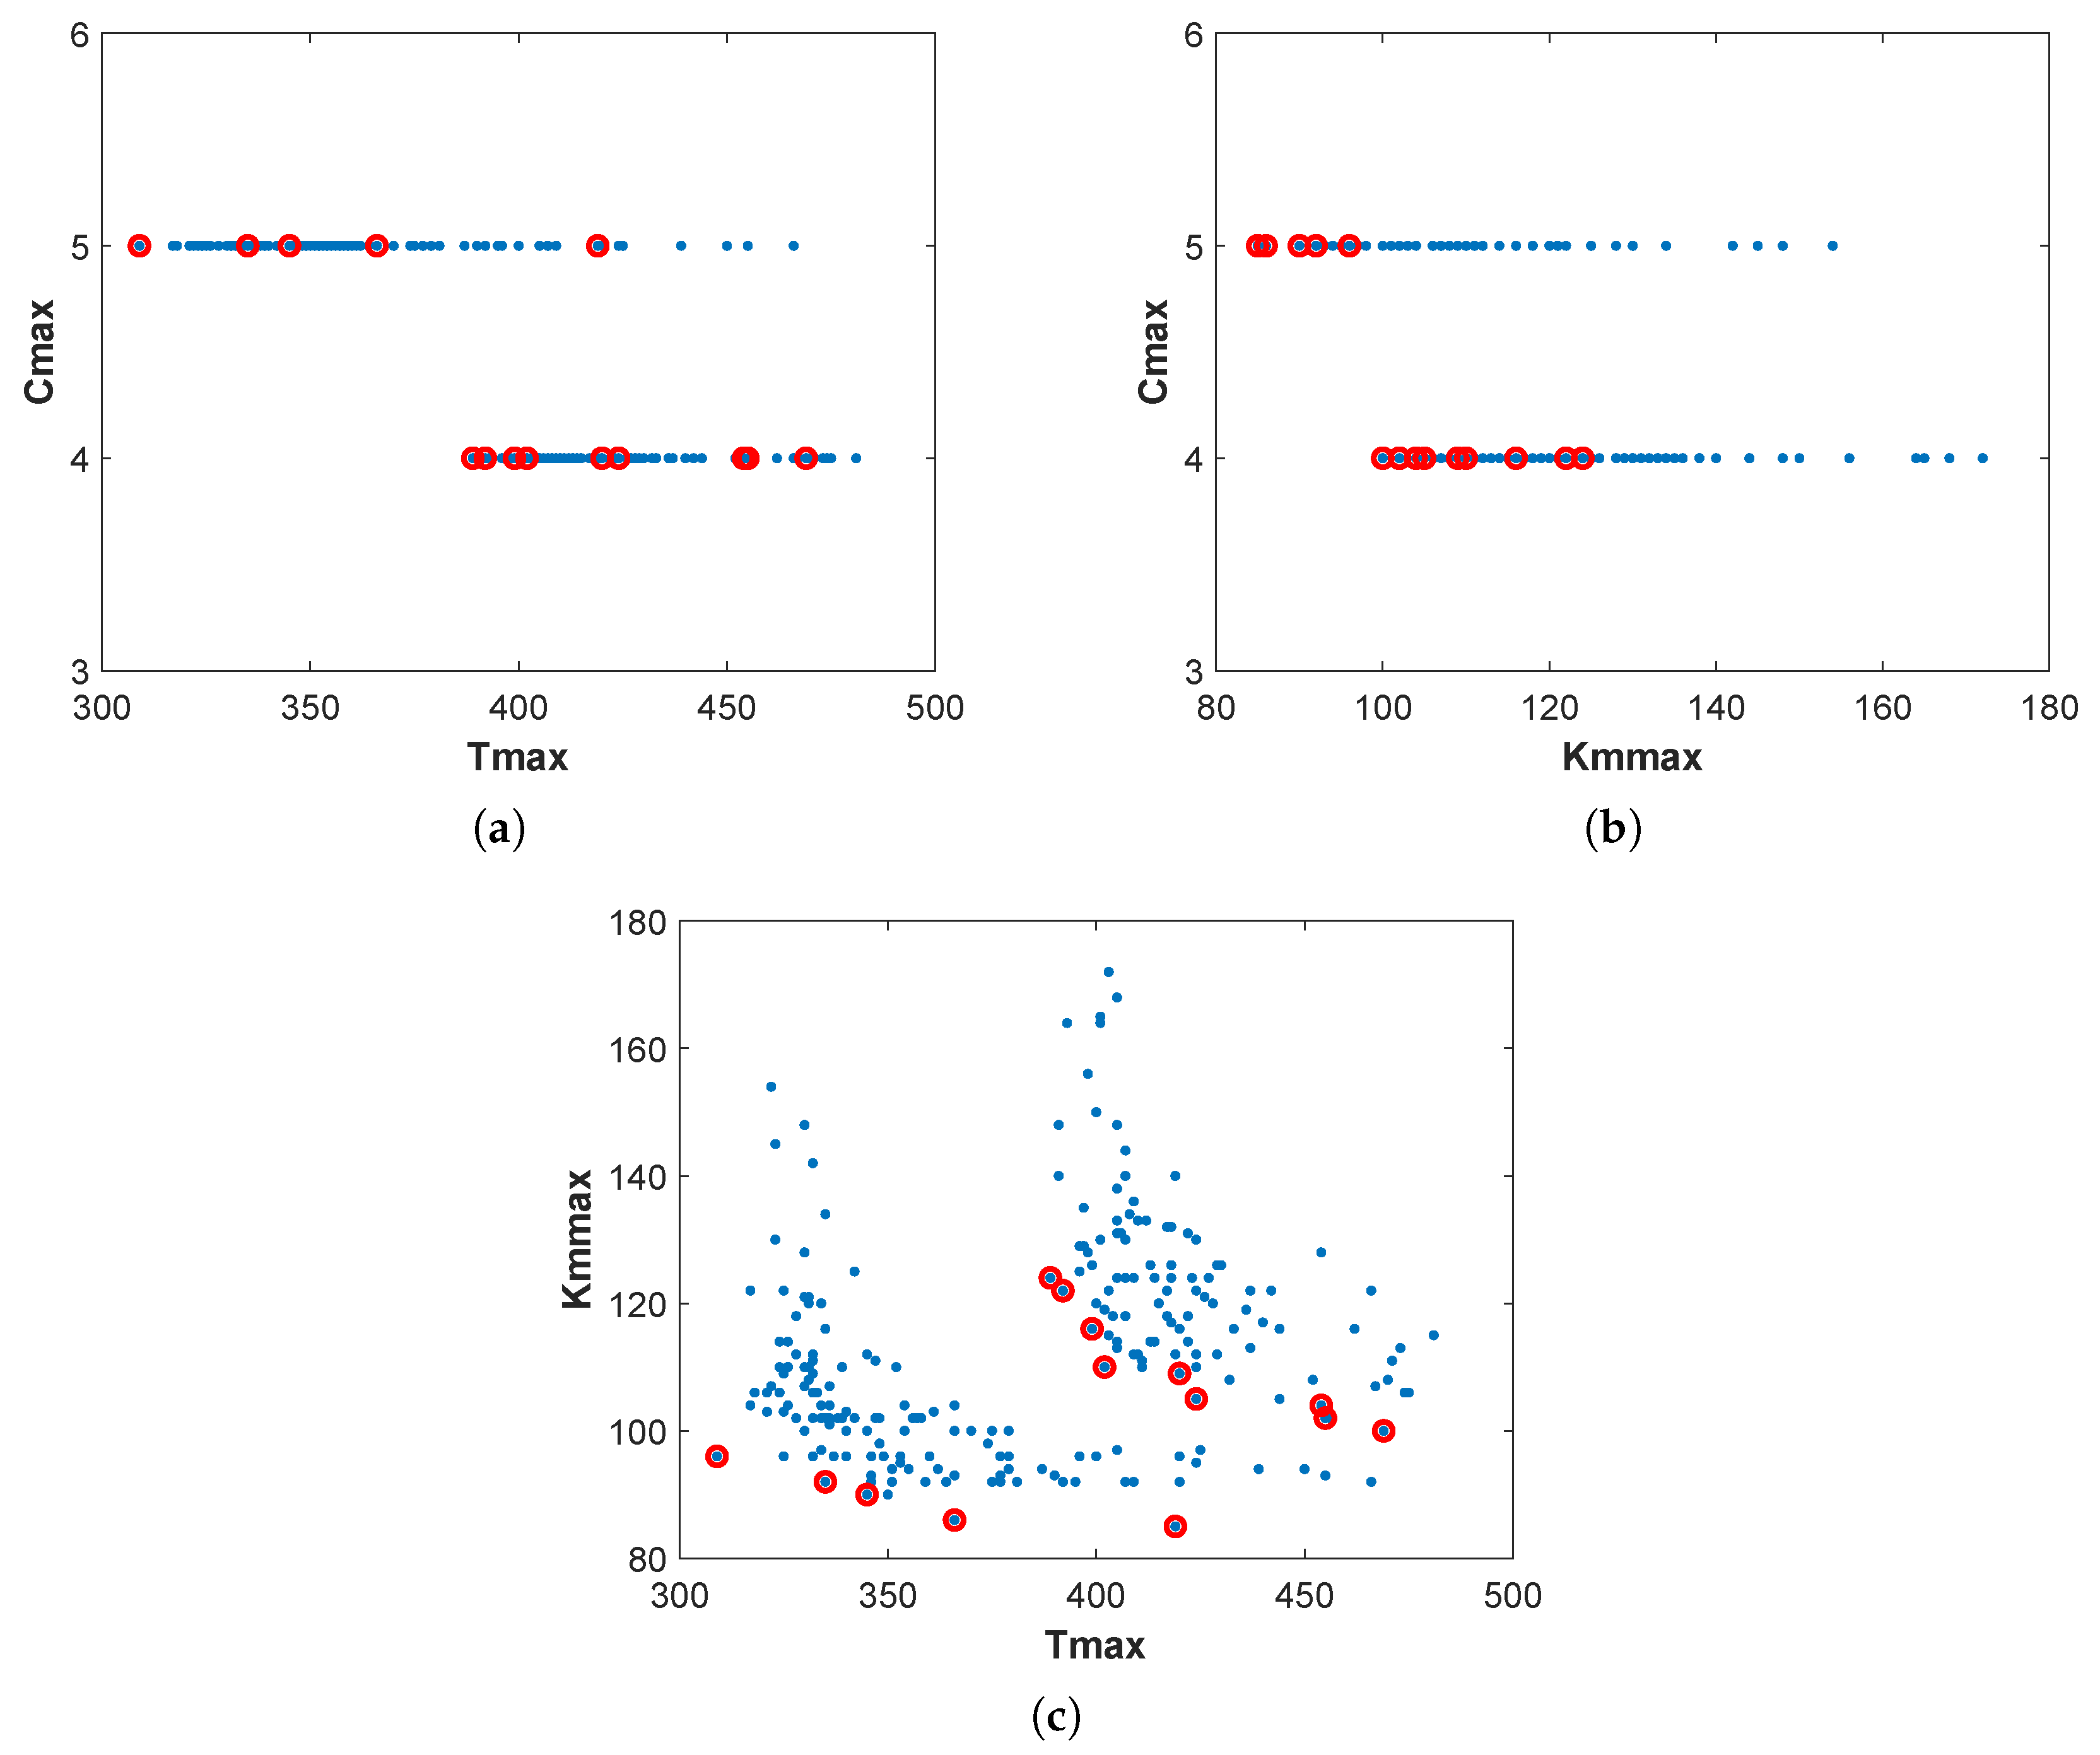
Analyzing the non-dominated solutions in a 3D graph is challenging (see
Figure 4). Thus,
Figure 6 shows the two-dimensional projections of the Pareto fronts to make it easier to analyze and understand the non-dominated solutions (red circle).
Typically, the best solutions for a single objective function, but the worst for the other objectives, are referred to as the extreme points of the Pareto front. From
Figure 6a, where Tmax and Cmax solutions are designed, it is possible to distinguish nine non-dominated solutions for 4 vehicles and 5 non-dominated solutions that use 5 vehicles. When using 4 vehicles, the extreme solutions for the time spent on HHC are
(solution #5 of
Table 6) and
(solution #14). For a selection of 5 vehicles,
(solution #1) and
(solution #9) are the extreme points. Regarding
Figure 6b, which displays the 2D projections of the Pareto front in terms of Kmmax and Cmax, the distance in kilometers varies from
(solution #14) to
(solution #5) when 4 vehicles are used, and between
(solution #9) to
(solution #1) for 5 vehicles.
Figure 6c shows the compromise between the combinations of the Tmax and Kmmax when 4 and 5 vehicles are selected.
The solutions from
Table 6 will be displayed in a path graph value to give the decision-maker better knowledge and understanding of the problem. The goal is to give the decision-maker a visualization tool with several optimal alternatives and details on the trade-offs between objectives. The relevant compromises among the non-dominated solutions were normalized according to the values obtained in each objective function. The need to harmonize scales made it possible to normalize the values of the objectives and thus adapt the scales to build graphs that aggregate all the information in an objective way (easy to understand for the common user), helping the decision-making.
From the total of non-dominated solutions, a clever selection was performed based on the representation of the most interesting solutions, which can be extremes of the Pareto optimal front or “elbow or knee” solutions, leading to a reduction in the analysis space. To achieve the “elbow” solutions, a simple metric, mean ideal distance, that measures the average of distances from an ideal (“optimal”) point was used (e.g., point [0, 0] for a problem with two objectives). In this sense, this metric was tested in the set of 2D projections in
Figure 6 to facilitate its implementation and select, more or less, 2 solutions for each projection, obtaining a total of 6 solutions. Some of these solutions represent points of faster change between the objective functions and can give the decision-maker a sense of where there might be a useful solution “compromise solution” or the “ideal point”. The path value graph for a selection of six non-dominated solutions (out of a total of 14) in terms of the three objectives is presented in
Figure 7.
The standardized target values for different trade-offs are represented by horizontal lines. Since they reflect non-dominated solutions, all horizontal lines naturally intersect. The lowest standardized objective values identify the best solutions because all objective functions are minimized.
Figure 7 shows that using five vehicles, solution #1, is the best option for Tmax. On the other hand, solution #9, which also uses five vehicles, is the optimal solution in terms of Kmmax, although a large value of Tmax. In addition, solutions #5, #8, and #14 has the best Cmax value, meaning that using four vehicles implies spending more time and more kilometers carrying out home care visits. Solutions #2 and #8 show a balanced compromise between all objectives.
This visualization tool guides the decision-maker to implement and support the preferred policy for the HHC service. Knowing these types of services are complex procedures and generally performed manually, these results significantly benefit and optimize the profitability of the plans and schedules currently in force at the Health Unit. It had already been verified that even in single-objective approaches, simplifying and optimizing the scheduling management and route allocation for HHC visits through metaheuristics allowed good results with very fast response rates. Therefore, the results obtained in terms of the three objectives (multi-criteria approach) reached a saving rate of approximately 30%, both in the maximum time and in the distance covered in the route, as well as showing a workload balance between the vehicles, when compared to the existing schedules in the health institution (manually planned or using single-objective approaches).
To make a choice on a daily HHC plan, decision-makers need take into account variables including personal or group preferences, benefits, and trade-offs. Furthermore, the multi-objective approach provided alternative optimal solutions to assist decision-makers in choosing an appropriate schedule for home visiting tasks and demonstrated the effectiveness of a multi-criteria optimization strategy. In addition, the improvement of the benefit for the HHC service planning is clear, compared to the current one, which is manual and time-consuming, in the ease of being able to standardize an emerging decision-making process and reduce variations in results to improve response rates and solutions of the organizational system itself, with inherent advantages for everyone involved (including patients).
The HHC strategy used in this study can be flexible, useful and realistic for other health and emergency institutions or social solidarity organizations, as well as for implementation in other domains, such as industry, business and financial management, tourism, among others. In addition, the optimized solution obtained in the sustainable HHC process allows to reduce transportation costs and resource allocation times, which can help the National Health Service to invest the savings in other healthcare sectors, such as new sustainable transport system and better environmental effects.
7. Conclusions
A multi-criteria decision-support system based on the scheduling of health professionals and routing of vehicles to perform home care visits was implemented. Thus, in this work, a multi-objective approach was developed to simultaneously minimize the number of vehicles available, travel time and travel distance to carry out the home care visits.
A real-world problem from a Health Unit in Bragança was optimized using the NSGA-II method in order to have a sustainable HHC planning process. Five vehicles were available and 22 patients required services from five different treatments.
The experimental results presented a Pareto front containing 14 non-dominated solutions using 4 and 5 vehicles. The analysis of the 2D projections of the Pareto front contributed to the understanding and identification of trade-offs between the non-dominated solutions, highlighting the extreme and/or “elbow” points with interesting solutions to be analyzed. In addition, a visualization tool was used to show a smart selection of optimal solutions to assist the decision-maker in choosing the most interesting and attractive solution from the Pareto set according to his/her preferences. Furthermore, all the non-dominated solutions were validated by the HUB institution, which positively reinforced the automated multi-criteria strategy in terms of competitiveness and efficiency.
In this multi-objective optimization approach, the planning management revealed a good allocation of resources, both in terms of logistics and associated costs, supporting new managerial insights for better strategic, tactical and operational planning. The practical implications of the solutions obtained in this work, allow the HUB institution to incorporate the ESG goals into its strategy and purpose, assuming more responsible policies in terms of its social domain, namely in the chain of operations, improving the workload and response rates, reinforcing optimization, sustainability and impact initiatives in the community.
In the future, multi-criteria decision-making methods will be used, considering the relationships between decision elements and the ability to apply quantitative and qualitative attributes. It will also be interesting to use methodologies that consider a sensitivity analysis of the number of criteria considered and approaches that make use of methods to reduce the number of influencing factors in decision-making.
To generalize the findings, other objective functions may be added to the sustainable home care process, such as the introduction of priority factors among patients, risk assessment, outsourcing and patient satisfaction. Furthermore, solving larger real instances is a future challenge.


 ,
, 


