Article

Do Geopolitical Tensions and Economic Policy Uncertainties Reorient Mineral Imports in the USA? A Fat-Tailed Data Analysis Using Novel Quantile Approaches

1
Graduate School of Economics and Management (GSEM), Ural Federal University (UrFU), Yekaterinburg 620078, Russia
2
Bangladesh Institute of Governance and Management (BIGM), University of Dhaka (Affiliated), Dhaka 1207, Bangladesh
3
Business School, NingboTech University, Ningbo 315000, China
*
Author to whom correspondence should be addressed.
Mathematics 2023, 11(1), 180; https://doi.org/10.3390/math11010180
Submission received: 24 November 2022 / Revised: 17 December 2022 / Accepted: 23 December 2022 / Published: 29 December 2022
(This article belongs to the Section Financial Mathematics)

Abstract

:
Mineral resources are essential raw materials to generate electricity, fuel vehicles, and heat homes and workplaces. Besides, the global agenda of clean energy deployment, including solar photovoltaics (PV), wind turbines, electric vehicles (EV), and storage facilities, calls for a considerable volume of critical minerals, which elevates their respective import demands. This highly concentrated source of those minerals poses a significant concern triggered by the augmented geopolitical tensions and economic policy uncertainties. In light of this context, our objective is to estimate the response of mineral import demand to global geopolitical risk events and economic policy uncertainty covering monthly data from January 1996 to December 2020. In doing so, we apply the cross-quantilogram (CQ) and the quantile-on-quantile (QQ) regression approaches due to the fat-tailed nature of the data property. Besides, these quantile-based data analysis procedures are appropriate for non-normal data sets and show the co-movement of the variables of interest under a bi-variate modelling approach. More importantly, these two techniques also exhibit the quantile connectedness among the variables in the bearish and bullish conditions. Moreover, our findings show that mineral import demand responds negatively to the USA’s (own) and global geopolitical risk events at the high quantiles under long memory. In addition, this demand reacts positively to the USA’s (own) and global economic policy uncertainty in entire quantiles under long memory. Therefore, our policy suggestions are concerned with tackling geopolitical tensions and economic policy uncertainty by adopting pre-emptive measures within a viable institutional mechanism to continue impressive mineral trade flows.

1. Introduction

Critical mineral usage is myriad in every aspect of human life. For example, minerals help generate electricity, fuel vehicles, heat homes and workplaces, and manufacture plastics [1]. Since the previous decade, mineral usage has increased significantly due to the global attempt to materialize the visionary agenda of clean energy transitions. Clean energy, especially solar, wind, biomass, biofuels etc., requires a significant amount of metallic mineral resources to handle and manufacture renewable technologies, including solar photovoltaic (PV), wind turbines, electric vehicles (EV), and power storage systems [2]. Therefore, international markets have witnessed an explosive demand surge for critical minerals. For instance, a recent World Bank Group analysis reveals that the production of critical minerals, e.g., copper, graphite, lithium, and cobalt, will rise by approximately 500% by 2050 to fulfill the soaring requirements for sustainable energy technology. In addition, deploying wind, solar, and geothermal energy and storage will require over 3 billion tons of minerals and metals to keep global warming below 2 °C [3]. However, mineral resources are concentrated in some developing countries, which are typically conflict and risk-prone, hampering the supply of these mineral resources in the international market. Besides, the global and country-specific geopolitical and economic policy uncertainty issues hinder the countries’ import flows of critical minerals [4].
Like other mineral importing countries, the world’s one of the largest mineral importing countries, the United States of America (henceforth the USA), experiences a similarly complex situation regarding mineral importation to mitigate its industrial demands. Some of these resources, such as crushed rock, cement, gold, construction and industrial sand and gravel, iron ore and copper, can be produced domestically in the USA to meet domestic needs. On the other hand, the more significant remaining minerals, including gallium, natural graphite, indium, manganese, niobium, rare earth, uranium, and vanadium, must be imported from diverse nations [5,6]. Although the world has enough of the majority of minerals to suit current needs, their supply is not always guaranteed. In addition, the flow of imported minerals suffers from various risks, including political unpredictability, inadequate infrastructure, and environmental regulation, which cause volatility and uncertainty for the USA’s markets [7]. Amid this situation, we formulate a fundamental research question concerning how mineral import demand for critical minerals responds to the global and country-specific geopolitical risks and economic policy uncertainty in the case of the USA.
Our motivations for essaying this analysis are multifaceted. First, there are numerous ways to utilize minerals. Since the Bronze Age, minerals have been essential to human progress [8]. In modern society, high-tech sectors have elevated the demands for different obscure minerals [9]. The skyrocketed requirements of these critical metallic minerals occur due to society’s substantial move toward hyper-tech innovative activities [10]. Recently, various natural metallic elements, including silicon and germanium, and compounds, such as gallium arsenide, have been used in microchips of electronic gadgets. In addition, a single smartphone necessitates the powers of about 30 different chemical elements. Lithium batteries in eclectic sizes (from a 10-watt cellphone battery to a 650-pound electric car battery) contain nine pounds of lithium [4]. Cobalt, nickel, or manganese are used in various cathodes. Rechargeable batteries play a significant part in the green energy movement to check global warming [11]. Finally, compared to non-hybrid vehicles, hybrid vehicles need twice as much copper and lanthanum in the batteries and neodymium in the electric motors [12]. Notably, according to the USGS [13], the average individual requires 1500 pounds of copper, 3593 pounds of aluminum, and 32,700 pounds of iron during their lifetime [4]. Thus, the towering mineral demands in different life-leading phenomena make challenges for those countries devoid of the reserves of the critical minerals they import from external mineral-producing countries.
Second, as one of the largest minerals importing countries in the world, the USA typically imports its mineral commodities from many nations [14]. For instance, China is the biggest supplier of mineral products to the United States, especially in terms of materials, such as industrial diamonds, germanium, and rare earth elements. In reality, 24 of the 47 mineral commodities on which the United States depends to a greater or lesser extent on imports originated in China [14]. In addition, the USA imports eight distinct non-fuel mineral commodities from Mexico, Russia, and South Africa, the central three suppliers after China. Canada is the second greatest supplier of mineral commodities to the United States, giving it access to 16 different types of minerals [5]. At this point, there appears to be a good trade relationship between the USA, Canada, South Africa, and Mexico. Still, the other two significant mineral exporting countries, China and Russia, are the geostrategic and geopolitical counterparts of the USA. In addition, these two countries are geopolitically susceptible to international politics [15]. However, the lack of an immaculate geostrategic relationship between the USA, China, and Russia and these countries’ (China and Russia) own geopolitical risk issues constrain the mineral supply in the international market, where the USA is a significant importer of these critical mineral resources. It is also argued that some of the minerals on which the United States depends are produced or must pass through politically unstable regions. Additionally, several of the minerals on which the US depends come from nations that have traditionally resisted the US in the global political sphere [16]. Overall, the USA’s mineral import demand suffers from the geopolitical risk issues.
Third, the vast expansion of mineral commodities used by the United States in terms of type and quantity is one of the leading causes of the country’s dependence on foreign suppliers for mineral commodities. Some nations have more extensive supplies of certain minerals than others, and many of these minerals are not reserved equally throughout the world [17]. Most mineral exporting countries are developing countries facing confrontation, cleavage, military rule, ethnic conflict, and terrorism [18]. Besides, these countries also confront mineral mining-centric extremism and political instability which hamper the export of minerals to the USA from these geopolitical risk-prone countries [19]. More importantly, the comparative cost of mineral production is another critical factor explaining why the USA increasingly relies on foreign suppliers for mineral commodities. The relative mineral production cost influences the policymakers of the USA to import it from external countries [6]. On the other hand, mineral mining workers’ wages, employment and living issues drastically hamper mineral production in the supplier countries [20]. Thus, mineral production-related country-specific risks and economic uncertainty issues affect the USA’s import demand for critical mineral resources.
From the study’s motivation mentioned above, we aim to investigate the response of US mineral import demand to the geopolitical risk events and economic policy uncertainty using the monthly data from January 1996 to December 2020. We apply two sophisticated and novel econometric techniques, the cross-quantilogram (CQ) and the quantile on quantile (QQ) approaches, for analyzing our study’s data. These two empirical methods represent the causal associations among the variables at the different quantiles under the bivariate modelling approach. These two techniques show the bearish and bullish states of the relationship between the variables. The findings drawn from the CQ approach divulge a positive response of mineral import demand to the USA and global economic policy uncertainty in both the bearish and bullish states under long memory. In contrast, the reaction of mineral import demand to the USA and global geopolitical risk is significantly adverse in the bullish state under long memory. Our findings are robust across the QQ technique in yielding a similar output obtained from the CQ approach.
Our contribution to the existing pieces of mineral trade literature is manifold. (i) We consider the response of the USA’s mineral import demand to the geopolitical risks and economic policy uncertainty, which is a novel addition to the existing literature regarding the study’s theme and relational delineation among the variables. (ii) We establish the USA’s global geopolitical risk and economic policy uncertainty issues in the study’s model in a decomposed way that illustrates this study’s novelty concerning variable selection. (iii) The investigation of the USA’s context in terms of geopolitical and economic policy uncertainty-induced mineral import demand is scarce in the empirical realm of current literature. However, several researchers in the context of the USA studied the mineral supply-related bottlenecks. (iv) Using two novel and sophisticated economic techniques, the cross-quantilogram (CQ) and quantile-on-quantile (QQ) approaches, we establish similar findings concerning value-addition to the prevailing mineral trade literature. Moreover, these robust analytical techniques yielded findings which can provide helpful insights for the USA’s policymakers in measuring the influence of geopolitical risk events and economic policy uncertainty in the mineral trade. (v) This finding-related acumen can help formulate policy measures to prevent the geopolitical risks and economic policy uncertainty for promoting mineral trade in the US economy.
The remained of this paper is organized in the following way. Section 2 outlines the materials and procedures applied in the data analysis. Section 3 describes the experiential outcomes and pertinent discussions. Finally, Section 4 illustrates the conclusion with significant policy implications.

2. Literature Review and Background Works

The literature review for this study encompasses the stream of critical mineral imports from different countries. Minerals are crucial due to these commodities’ primary usage in all aspects of human life, including manufacturing and handling technologies of life-leading instruments, such as heating for households and industries, electric wire manufacturing, manufacturing of cans and bottles, making coins and jewelry, and creating microchips in mobile phones and other electronically controlled machinery [10]. However, the recent demand surge for critical minerals emanates from the global vision of nestling a cleaner production hub. This energy generation process requires a large volume of metallic minerals to handle respective technologies, such as PV, EV, wind turbines, and battery storage systems [2,21]. However, this explosive demand dynamic for critical minerals is not free from diverse bottlenecks triggered by country-specific and global economic policy uncertainties and geopolitical risk events.
Empirical studies concerning geopolitical risks and economic policy uncertainty-induced mineral import demand still need to be explored. However, some quasi-relevant studies, such as Hamilton [22] and Kilian and Murphy [23], examined the elasticity demands for critical minerals in terms of output and price for relatively short periods. However, these studies overlooked the geopolitical and economic policy uncertainty aspects of the mineral import demand from the respective countries’ perspectives. Jourdan’s [24] and Stuermer’s [25] investigations measured the need for mineral goods caused by the massive flow of industrialization.
Henckens et al. [26] highlighted the threats to the supply of the materials’ substitutability, the rate of recycling, the country’s concentration of the resource supply, and the governance problems of the nations that provide the materials. More importantly, material bottlenecks in future green technology development were scrutinized by Valero et al. [27]. Another study argued that political instability hampered cobalt mining activities in the Democratic Republic of Congo while the demand for this critical mineral enhanced sharply. Jiskani et al. [28] and Nygaard [29] emphasized situations involving mineral extraction that are wicked, crumbling, dictatorial, or unsuccessful from the viewpoints of the various host countries. Finally, Islam et al. [2] and Islam et al. [21] examined the mineral import-driven clean energy transitions in the OECD and top mineral importing countries, respectively.
Economic policies contribute to the mineral boom in the mineral exporting countries, which has helped these economies’ capacities to import other essential traded goods for their industrial proliferation [30]. Some researchers assess material constraints from the geological context by comparing future demand with the existing production capacity [31,32] or by comparing supply with production capability [33]. Several studies [34,35] examined the material restraints in operating futuristic green technologies. Another study asserted that political unrest makes cobalt production challenging, even as the demand for this vital mineral has risen dramatically in the last decade [36].
Some studies, i.e., Fernandez [37], Redlinger and Eggert [38], García and Guzmán [39] measured the mineral price-related dilemma on global markets. They mostly expressed that the concentration of mineral resource reserves in a few regions could hamper mineral use as raw materials for renewable energy generation. Some academics studied the connections between technological cooperation, R&D spending, renewable energy essentials, and mineral extraction, emphasizing the environmental impact of mineral extraction [40,41,42].
A pool of empirical investigations, e.g., Bazilian [43], Tokimatsu et al. [44], and Hanai [45], concentrated on the mineral utilization hazards for importing nations and the governance, socio-economic, and political tensions related to mineral-mining decisions of the producers. They mostly expressed that the concentration of mineral resource reserves in a few regions could hamper mineral use as raw materials for renewable energy generation.
Moreover, the works of the literature surveyed above mainly emphasize metallic mineral mining and supply scenarios and bottlenecks from the perspective of the mineral-producing countries. Therefore, most existing studies failed to observe the geopolitical risks and economic policy uncertainty-driven mineral import demands in the context of mineral-importing countries. Besides, the USA’s economic policy uncertainty- and geopolitical risk-relevant mineral demands are sharply scarce in the prevailing pieces of empirical investigation. Hence, our research can bridge this ominous research gap by suggesting needful policy measures for the USA to deal with country-specific or global economic policy uncertainties and geopolitical tensions.

3. Materials and Methods

3.1. Data and Sources

The main objective of our study is to measure the response of the USA’s mineral import demand to this country’s own and global geopolitical events and economic policy uncertainty. Therefore, our dependent variable is the USA’s mineral import demand, and independent variables are geopolitical risks and economic policy uncertainty of the USA, global geopolitical risks, and global economic policy uncertainty. Our study adopts monthly data (5 days a week) from 1 January 1996 to 31 December 2020. However, selecting this time range for our study has some grounds. (i) The world has been experiencing natural resource trade-related volatility that started in the 1990s to date. (ii) Mineral mining-related workers’ movement concerning wages, working environment, and environmental concerns massively appears during our chosen periods. (iii) The USA’s mineral mining and import portfolio dramatically increased during this period. (iv) Geopolitical tensions, especially war, nuclear weapons, and military threats, are more prominent during our chosen time. More importantly, the horrifying events of 9/11 in the USA intensified the worldwide risk parameters, affecting mineral trade. (v) Different country-specific economic volatilities and the global economic recession in 2008 were critical in affecting the USA’s mineral imports. Notably, the detrimental effects of the COVID-19 pandemic in our selected period caused a massive downturn in the global mineral trade. Table 1 describes the data, their definitions, and sources.
The dependent variable of this study includes the mineral imports (MI) of the USA. Specifically, we consider the cumulative sum of total mineral resources, including crushed rock, cement, gold, construction and industrial sand and gravel, iron ore, copper gallium, natural graphite, indium, manganese, niobium, rare earth, uranium, and vanadium. Moreover, we consider the mineral volumes in thousand metric tons for our study’s analysis.
Our independent variables are geopolitical risks and economic policy uncertainty. Specifically, Caldara and Iacoviello [47] developed a measure of unfavorable geopolitical events and related risks based on a count of 10 US-based dailies’ articles concerning geopolitical tensions. They analyzed these risky events’ consequences and economic implications since 1900. They viewed that an increase in geopolitical risk events leads to declining stock prices, global marketing flows, employment, and investment. Furthermore, more significant economic catastrophes and threats to the worldwide economy are related to higher geopolitical risks. Geopolitical risks consist of geopolitical risks, ‘threats’, and ‘acts’ measures. Military and nuclear tensions, encompassing threats to war, peace, and terrorization, are the key highlights of the geopolitical risk ‘threats’ parameter. Besides, the reality or intensification of aggressive activities, including the start and spread of war, and the operational phase of terrorist functions are the supplementary catchwords included in the geopolitical risk ‘acts’ measure. Overall, the cumulative geopolitical events incorporate words containing categories 1–8 in making the index.
On the other hand, the economic policy uncertainty (EPU) index is based on newspaper coverage frequency. Several types of evidence, including human readings of 12,000 dailies’ articles, imply the index proxies for changes in policy-relevant economic uncertainty. Baker et al. [49] opined that policy uncertainty is linked to increased stock price volatility, decreased investment, and reduced employment in industries that are sensitive to policy. Moreover, new forms of policy uncertainty portend decreases in different economies’ investment, output, and employment at the macro level. Moreover, this economic policy uncertainty is an index massing mainly two fundamental factors, purchasing power parity (PPP) and exchange rate, to evaluate policy-related precariousness on the macroeconomic indicators. Therefore, quantifying media coverage of policy-related economic uncertainty is the most adaptable part of covering the perspectives of the globe, countries, and regions.
The mineral import demand of different countries faces severe bottlenecks due to the countries’ inner and outer volatilities, including geopolitical risks and economic policy uncertainty [50,51]. Mainly, the worldwide spread of militarization, nuclearization, and terrorization processes create tremors and hinder convenient trade flows [52]. Besides, the mineral mining-related policy dilemma among mineral-producing countries instigates an unstable situation. More importantly, imprudent policy interventions on inner micro and macroeconomic determinants, such as consumer prices, expenditures, tax, revenue, and investments, yield uncertainty in the economic spectrum of the country. Overall, global and country-specific economic and geopolitical risky events affect trade, especially mineral trade, due to the massive spread of mineral necessity across the globe.

3.2. Unit-Root Test for Nonlinear Data Property

Unit root testing for time series data property of macroeconomic dynamic is critical in avoiding spurious findings from the regression analysis. However, there is a rising discontent among the researchers concerning traditional unit-root tests’ failure to cover any nonlinearity in the deterministic elements. Given this, Kapetanios, Shin, and Shell (KSS) [53] suggested asymptotic critical values of the tNL statistics organized in the form of Monte Carlo stochastic simulations.
To investigate the characteristics of nonlinear adjustment, we can apply the KSS test to explore the equation by adding the index of the transfer function. The following ESTAR specification provides KSS:
Δ y t = γ y t 1 [ 1 e x p ( θ y t 1 2 ) ] + ε t                               ( θ 0 )
where y t denotes the detrended time series of the variable of interest. γ indicates the unknown factor. ε t illustrates an i.id. error with zero mean and constant variance. In addition, [ 1 e x p ( θ y t 1 2 ) ] shows the function of exponential shift considered in the test to represent the adjustment of nonlinearity.
Our alternate hypothesis includes H 1 : θ > 0 , whereas null hypothesis is H 0 : θ = 0 . Here, y t adheres to a linear unit-root procedure but it is non-linear stationarity ESTAR technique within the alternate hypothesis. This process cannot directly check the null hypothesis, i.e., H 0 : θ = 0 . Therefore, the KSS recommends reparametrizing Equation (1) by calculating a first-order Taylor series to explain Equation (1) to achieve the supplemental regression:
Δ y t = δ y t 1 3 + ε t
The errors in Equation (2) are extended in a more general scenario when they are serially correlated to:
Δ y t = j = 1 p ρ j Δ y t j + δ y t 1 3 + ε t
Augmentations of ρ can adjust serially correlated errors. Here, AR models determine the specified lags. In this case, Equation (2) or Equation (3) can be utilized to test the null hypothesis of non-stationarity (e.g., H 0 : δ = 0 against alternate H 1 : δ < 0 ) . Then, we can get the asymptotic critical value of the tNL statistics, including:
t N L = δ ^ / s . e . ( δ ^ )
where δ ^ denotes OLS approximation of δ where s . e . ( δ ^ ) indicates the standard error emanating from δ ^ . In this case, the statistics ( t N L ) do not follow the asymptotic standard normal distribution.

3.3. Cross-Quantilogram (CQ) Technique

We scrutinize the US mineral import demand’s response to this country’s own and global geopolitical risks and economic policy uncertainty. We do this by estimating the bivariate causal linkage between two pairs of relevant variables using the cross-quantilogram (CQ) method developed by Han et al. [54]. We decided to use this method because of CQ’s various unique characteristics. First, this technique can estimate the bivariate volatility spillover between two variables, even in asymmetrical distribution and extreme observations [55]. Second, using different quantiles, the CQ technique can calculate the shock period from one variable to another. Third, the CQ approach relaxes the assumption of moment conditions. Fourth, this method is suitable for fat-tailed distributions of the data property. Finally, this procedure computes the duration and direction of the linkage between two indicators despite their more significant lag lengths [56].
Equation (5) represents the cross-quantilogram between two events { y 1 t q 1 t ( τ 1 ) } and { y 2 t k q 2 t k ( τ 2 ) } , where k is the length of lags ( k = ± 1 , ± 2 ) for a set of τ 1 and τ 2 :
ρ τ ( k ) = E [ ψ τ 1 ( y 1 t q 1 t ( τ 1 ) ) ψ τ 2 ( y 2 t k q 2 t k ( τ 2 ) ) ] E [ ψ τ 1 2 ( y 1 t q 1 t ( τ 1 ) ) ] E [ ψ τ 2 2 ( y 2 t k q 2 t k ( τ 2 ) ) ]
where y i t divulges time-series’ integration order, i is equal to 1, 2 or 3, which explains mineral import-demand (predicted dynamics). t indicates time (t = 1, 2, …T). F i (⋅) and f i (⋅) illustrates the distribution and density calculation functions of y i t , i = 1, 2. q i t ( τ i ) = inf   { v : F i ( v ) τ i delineate the corresponding quantile function for τ i ( 0 , 1 ) and ψ a ( u ) = 1 [ u < 0 ] a . This is called the quantile-based hit map technique.
The CQ model handles serialized dependence between different quantiles and variables. As a result, both series are included in the model’s monotonic conversion. For the scenario of two cases { y 1 t q 1 t ( τ 1 ) } and { y 2 t k q 2 t k ( τ 2 ) } , ρ τ ( k ) = 0 , which indicates the absence of cross-sectional dependency from case { y 2 t k q 2 t k ( τ 2 ) } to case { y 1 t q 1 t ( τ 1 ) } . We can identify the variance of cross-quantile dependence among our variables at various quantiles by analyzing how ρ τ ( k ) varies with the kth lag period. This lag distinction, therefore, counts the strength and size of the dependency. In our study, we choose k = 1, 3, 6, and 12 to represent monthly, quarterly, biannual, and yearly lags, respectively.
Then, using a Ljung–Box test, we determine the t-statistics in the following way to determine the statistical significance level of ρ τ ( k ) :
Q τ * ( p ) = T ( T + 2 ) k = 1 p ρ ^ τ 2 ( k ) / ( T k )
Here, ρ ^ τ ( k ) denotes the cross-quantilogram, which are estimated below:
ρ ^ τ ( k ) = t k + 1 T ψ τ 1 ( y 1 t q ^ 1 t ( τ 1 ) ) ψ τ 2 ( y 2 t k q ^ 2 t k ( τ 2 ) ) t k + 1 T ψ τ 1 2 ( y 1 t q ^ 1 t ( τ 1 ) t k + 1 T ψ τ 2 2 ( y 2 t k q ^ 2 t k ( τ 2 ) )
where q ^ i t ( τ i )   ( i = 1 , 2 ) displays the quantile function under examination.
Now, we use the stationary bootstrap method to determine the null distributions of the cross-quantilogram (Equation (7)) and the Q-statistics (Equation (6)). Then, we can compute a partial cross-quantilogram (PCQ) between our regressors (geopolitical risk events and economic policy uncertainty) and regressed variable (mineral import demand). z t = [ ψ τ 3 ( y 3 t q 3 t ( τ 3 ) ) , , ψ τ l ( y l t q l t ( τ l ) ) ] is a ( l 2 ) × 1 regressors’ vector for l 3 . We can represent the quantile hit process with its correlation matrix and reverse matrix as follows:
R τ ¯ = E [ h t ( τ ¯ ) h t ( τ ¯ ) T ] ; P τ ¯ = R τ ¯ 1
Here, h t ( τ ¯ ) = ψ τ 1 ( y 1 t q 1 t ( τ 1 ) ) , , ψ τ l ( y l t q l t ( τ l ) ) are the l × 1 vectors of the quantile hit process. For i , j [ 1 ,   , l ] , let r τ ¯ i j and p τ ¯ i j be the ith component of R τ ¯ and P τ ¯ . Note to say that r τ ¯ 12 / r τ ¯ 11 r τ ¯ 22 indicates the cross-quantilogram. The partial cross-quantilogram (PCQ) can now be expressed as follows:
ρ τ | ¯ z = p τ ¯ 12 p τ ¯ 11 p τ ¯ 22
Here, the presumption is that ρ τ | ¯ z represents the cross-quantilogram between y 1 t and y 2 t conditional on z as the control variable.

3.4. Quantile-on-Quantile (QQ) Approach

We employ the quantile-on-quantile (QQ) method coined by Sim & Zhou [57] to evaluate the reliability of the results obtained from the cross-quantilogram (CQ) approach. The QQ approach is well-fit to address some drawbacks of traditional quantile regression. First, this method combines conventional quantile and local linear regression with nonparametric features [58,59]. Second, within the OLS estimation procedure, this QQ technique provides the slope coefficients of the predictors to influence the predicted variable in different quantiles. Third, this method addresses the issue of reverse causality or interconnectivity by allowing the predictor to be clustered into a quantile distribution. Finally, the variables with less skewed and higher kurtosis values suggest that the QQ technique is reliable for evaluating the nonparametric data property. As a function of the regressor (X), we can now denote the quantile of the regressed variable (Y) as follows:
Y t = α Ԏ Y   t 1 + β Ԏ ( X t ) + ε t Ԏ
where β Ԏ ( . ) delineates the unknown parameter when determining the degree of connectivity between Y and X. ε t Ԏ is the error term with a zero Ԏ quantile. Now, we may linearize Equation (6) by allowing for the first-order Taylor extension of β Ԏ ( . ) across Y t , in the manner shown below.
β Ԏ ( Y t ) = β Ԏ ( Y τ ) + α Ԏ Y   t 1 + β Ԏ ´ ( Y τ ) ( Y t Y τ )
The pairing linkage of β Ԏ ( Y τ ) and β Ԏ ´ ( Y τ ) within Ԏ and τ shows that β Ԏ ( Y τ ) and β Ԏ ´ ( Y τ ) are the functions of Ԏ and τ , correspondingly. The above Equation (11) can be rephrased as follows:
β Ԏ ( Y t )   β 0 ( Ԏ , τ ) + α Ԏ Y   t 1 + β 1 ( Ԏ , τ )   ( Y t Y τ )
By replacing Equation (12) into the preliminary QQ equation, we can write:
Y t = β 0 ( Ԏ , τ ) + α Ԏ Y   t 1 + β 1 ( Ԏ , τ ) ( Y t X τ ) + μ t Ԏ
Finally, we uncover the quantile connectivity between geopolitical threats, economic policy uncertainty, and mineral import demand in the USA by using the equation above in the QQ framework.

4. Empirical Findings and Discussions

4.1. Findings from the Descriptive Analysis

At the outset, we demonstrate descriptive statistics to understand the nature of the data (Table 2). We find that the mean and standard deviation values of mineral imports (MI) (dependent variable) are higher, which suggests this variable’s divergence within a little posture over time. Besides, the regressors, including global geopolitical risks (GGPR), global economic policy uncertainty (GEPU), and the USA’s economic policy uncertainty (UEPU), have higher mean and lower standard deviation values, indicating a lower efficiency level with higher variation across the period. However, the single regressor, namely the USA’s geopolitical risks (UGPR), contains a higher efficiency level and changeability over the period with lower mean and standard deviation.
We observe that the Jarque–Bera assessment substantially rejects the assumption of the normally distributed feature of the dataset. Specifically, the Jarque–Bera test’s statistic has positive numbers; their p-values are zero for all variables of interest. This scenario indicates that the sample data do not have a normal distribution. Besides, the dataset is less skewed and has a more or less high (fat-tailed) kurtosis distribution, mainly in the case of UGPR and GGPR.
On the other hand, Figure 1a–e describes that all data series demonstrate a significant change over time due to their non-normal features. In this situation, we can assume that our dataset adheres to the integration order at level, e.g., I(0). Thus, the characteristics of the data in Table 1 and Figure 1 strongly support using the quantile-based method to capture the local linearity rather than relying on the assumption of global linearity.

4.2. Findings from the KSS Unit-Root Test for Nonlinearity

After presenting the descriptive analysis findings, we implement the KSS unit-root test for nonlinear data property. Using the KSS procedure, we can identify the existence of non-stationarity against the nonlinear procedure in the case of the USA’s mineral market as affected by geopolitical risks and economic policy uncertainty. Our findings depict the nullification of unit-root on behalf of nonlinear trend stationary for the time series, including mineral imports, USA’s and global geopolitical risk events, and economic policy uncertainty in the context of the USA (Table 3).
After detrending, the KSS unit-root test results show that mineral imports, USA’s and global geopolitical risks, and global economic policy uncertainty nullify the null hypothesis, implying that these series follow the nonlinear trend stationary. However, merely the USA’s economic policy uncertainty holds the stationary series status and accepts the null hypothesis. Therefore, observing most of the variable’s nonlinear characteristics, we can use the quantile regression procedures, i.e., the cross-quantilogram (CQ) and the quantile-on-quantile (QQ) approaches.

4.3. Findings from the Cross-Quantilogram (CQ) Technique

We use the cross-quantilogram (CQ) method to examine dynamic risk dispersion as stemming from USA’s and global geopolitical risks and economic policy uncertainty indices on the USA’s mineral market. The heat map scale yielded from the CQ framework contains the vertical and horizontal axes. Mineral import’s (MI) quantile-based movement on each heat map is portrayed on the horizontal axis. The vertical axis depicts the movement of USA’s and the global geopolitical risks and economic policy uncertainty indices, including USA’s geopolitical risk (UGPR), global geopolitical risk (GGPR), USA’s economic policy uncertainty (UEPU), and global economic policy uncertainty (GEPU).
In general, the CQ procedure delineates the short, medium and long memories to measure the spillover effect. We consider the monthly as the short memory, quarterly and bi-annual as the medium memory and annual as the long memory to specify a clearer understanding of the findings visible in different time horizons (quantiles). We use the Ljung–Box test to investigate the expected direction between the variables with statistical significance for robust outcomes. As we utilize the monthly data in the CQ estimation framework, we consider 01 lag for the month, 03 lags for the quarter, 06 for bi-annual, and 12 for annual times. For estimation purposes, we divide our study models into four: Model 1: USA’s geopolitical risk (UGPR) and mineral import (MI); Model 2: global geopolitical risk (GGPR) and mineral import (MI); Model 3: USA’s economic policy uncertainty (UEPU) and mineral import (MI); and Model 4: global economic policy uncertainty (GEPU) and mineral import (MI).

4.3.1. USA’s Geopolitical Risk (UGPR) and Mineral Import (MI)

Model 1 shows the response of the mineral import (MI) demand to the USA’s own geopolitical risk (UGPR) within the framework of the cross-quantilogram (CQ) technique. We see that the UGPR positively affects MI demand in the USA at the bearish state in quarterly, bi-annual, and annual periods at the low and medium quantiles, where there is no significant influence of UGPR on MI in the monthly period (Figure 2).
On the other hand, the UGPR negatively influences MI demand at the bullish state in the high and extreme quantiles under medium (quarterly and bi-annual) long (annual) memories. Notably, we consider the negative response of MI demand to the UGPR due to its (this response) influencing profile lies in the extreme quantiles (0.75–0.95) under long memory (Figure 2). The negative response of MI demand to the USA’s geopolitical risks may occur due to utmost freedom of the people creating a confrontational situation in the decision-making process of the government that can hinder the importation of mineral goods. This situation implies that the different stakeholders, such as political parties, civil society, businesspeople, human activists, and social media (Facebook, Instagram, Twitter), influence internal policies of the US government relevant to the imported goods. This group of people use media disclosures and make public opinion against governmental policy decisions regarding imported commodities and their necessities in the context of existing state affairs. According to Auxier [60], people in the USA who have a scarce opinion of the effects of social media specifically note disinformation, hate speech, and harassment they encounter there. In addition, many people opine how social media sites have weaponized false information. Finally, some respondents provide examples of how hate, harassment, conflict, and extremism propagated through social media influence governmental policy choices on important state-leading issues.
On the other hand, the country-specific military and nuclear power/weapons expenditures hamper the stream of imported minerals in the USA. The military ranks as the second-largest spending category in the USA’s government budget. Among them, nuclear modernization ($27.7 billion) is one of the top priorities for 2022. In addition, the present U.S. debt and budget imbalance have increased due to military spending, negatively affecting the country’s other international trade [61]. Besides, this county’s geopolitical engagement in the case of other countries’ interest articulation process is enormous. This circumstance may periodically deviate the USA from concentrating on trading commodities, such as critical minerals currently used abysmally for manufacturing and handling renewable energy technologies for clean energy production.
More importantly, the USA, a leading country, has taken different significant measures to combat global terrorism in association with other allied forces worldwide. NSC [62] revealed that ‘as a forefront of freedom, constitutional government and democracy, the United States plays a unique role among other countries. The USA will be there in any corner of the world with more challenges and threats from terrorist forces that endanger the American people, our vital interests, and the security and prosperity of our allies and partners. The USA holds this luminous ideal to defend assiduously’. USA’s initiative against the global risk phenomena may help overlook its internal trade ramifications, especially mineral trade growth. Moreover, USA’s policymakers highly concentrate on preventing risk issues as this country experienced a drastic catastrophe with the 9/11 terrorist attack on its crucial establishments. Overall, USA’s own geopolitical risks negatively influence the mineral import demands in the USA.

4.3.2. Global Geopolitical Risk (GGPR) to Mineral Import (MI)

Model 2 investigates the response of mineral-import (MI) demand to the global geopolitical risk (GGPR) in the USA using the CQ procedure. Our findings depict that the GGPR positively affects the MI demand in the bearish state when GGPR is in the low quantiles under medium (bi-annual) and long (annual) memories, and MI demand remains trivial in the short (monthly) and medium (quarterly) memories to respond to the GGPR in the context of the USA (Figure 3). On the other hand, the MI demand negatively responds to the GGPR in the bullish state while the MI stays in the (0.8–0.95 and 0.85–0.95) extreme quantiles under medium (bi-annual) and long (annual) memories, respectively. Moreover, we consider a significantly negative response of MI demand to the GGPR in the context of the USA due to prioritizing the findings at the extreme quantiles under long memory (Figure 3). This situation illustrates USA’s media outlets’ huge propagation of geopolitical risk events, especially geopolitical ‘threats’ measures concerning military and nuclear attacks, terrorist assaults, etc., which hinder the mineral trade of this economy.
More importantly, the USA experienced a major geopolitical risk ‘acts’ parameter with the notorious and brutal terrorist attack on 9/11 ruining the World Trade Centre in the city of New York. This situation showed the vulnerable circumstance the US faced in terms of different security mechanisms, such as military and munitions capabilities, electronic criminal detectors, automated business running systems, fended transportation, and shipment methods, etc. Moreover, geopolitical risk events significantly affect the trade volumes of the USA. The whole business sector experienced the blow of the 11 September 2001 terrorist attack on the USA. Following the dot-com bubble, the US economy experienced a moderate recession, and the terrorist attacks severely stretched the corporate community. Notably, the agriculture sector experienced significant financial losses as trading in commodity futures, worldwide air flights, and the international importation of consumable goods from Mexico and Canada were temporarily suspended [63].
Many earlier authors, such as Su et al. [64], Cheng and Chiu [65], Santillán-Saldivar et al. [66], and Lee [67] supported trade deterrents as faced by the different countries, which is in line with our findings in terms of the US mineral import’s negative reply to the global geopolitical risk events. However, our findings are incoherent with Bilgin et al. [68], who measured the correlation between government investment and geopolitical events, corroborate our findings. Furthermore, these researchers provide evidence that, in the case of 18 developing nations, the global geopolitical risk appears to boost government spending to counteract their unfavorable impact.

4.3.3. USA’s Economic Policy Uncertainty (UEPU) to Mineral Import (MI)

In Model 3, we apply the CQ approach to examine the response mineral import (MI) demand to the USA’s economic policy uncertainty (UEPU). The CQ-yielded findings delineate that the UEPU positively influences MI demand in the USA in the bullish states when the UEPU prevails in low quantiles under medium memory (quarterly) memory and from low to extreme quantiles under medium (bi-annual) and long (annual) memories (Figure 4). Notably, there is no significant response of MI to UEPU under short (monthly) memory and a negative reply of MI to UEPU at the bearish state in the medium quantiles (0.45–0.65) under medium (bi-annual) memory (Figure 4).
This favorable impact of economic policy uncertainty from quarterly to annual periods points to the USA’s prudent economic policy measures in stabilizing prices of consumers’ goods, government expenditures, and revenues from taxes. More specifically, the US Federal Reserve’s primary responsibility is to keep inflation under control while averting a recession. It accomplishes this through its monetary policy. The Federal Reserve must adopt a contractionary monetary policy to impede economic growth to control inflation. If inflation rises above the Federal Reserve’s expected range of 2%, demand will increase prices for goods. In this situation, the Federal Reserve can ameliorate this increase by reducing the money supply, i.e., the total credit allowed to enter the market. The financial system’s liquidity has decreased due to the Federal Reserve’s policies, raising the cost of borrowing money. As a result, it lowers demand, and economic expansion drives down prices and lowers prices of commodities, encouraging local and foreign trade [69]. Thus, the USA’s one of the dominant economic policy uncertainty parameters, the consumer price index (CPI), measured by the inflation rate, spurs the mineral trade of this economy. This finding is in line with Dotsey and Sarte [70], who opined that growth and inflation uncertainty are positively associated. They contend that a rise in the volatility of money growth (inflation) makes the return on money balances uncertain and lowers consumer demand and real money balance demand. Precautionary savings rise as a result, while the investment pool increases economic growth due to increased projected inflation. Barro’s [71] research further lends credence to our result that uncertainty alone is not harmful to long-term trade growth, which is contrary to Friedman’s [72] main finding that inflation uncertainty negatively affects economic growth.
Another economic policy certainty indicator is government spending based on the fiscal policy initiative of any country. Recently, many economists and decision-makers have expressed worry about the negative impact of uncertain fiscal policy on economic activity. For instance, the debt-ceiling crisis, the government shutdown, and the Trump administration’s plan to invest heavily in infrastructure have increased uncertainty regarding government spending policy in the United States, and many people are concerned about the negative consequences that will follow [73]. Despite this, our finding establishes the positive response of US mineral imports to the economic policy uncertainty (especially government spending). It is logical in the case of the USA because government spending reduces firms’ outer financial costs as determined by the GZ credit spread. USA’s government spending becomes helpful for increasing consumption, investment, and real wages of workers. Finally, this expenditure volume and effectiveness increases the private sector activities in boosting internal and external trade and economic growth in the USA. Our finding is inconsistent with Bloom [74], Rubio-Ramírez et al. [75], and Kim [73], who proved that uncertainty with government spending policy has a detrimental effect on the USA’s business and income growth. However, our finding is also coherent with Born and Pfeifer [76]. They established that the leading cause of business fluctuations is not the fiscal policy uncertainty (measured by government spending) assessed by time-varying volatility within an estimated dynamic stochastic general equilibrium (DSGE) model.
The final economic policy uncertainty includes the tax revenue and employment in the economic activities. A country tries to maintain its overall tax-GDP ratio vis-à-vis the trade taxes to GDP. An increase in tax revenue boosts government investment and trade volume in an economy. However, sometimes, a higher tax ratio causes a sharp fall in the country’s income level at around the same time. This situation generates tax revenue-related economic uncertainty in the economy [77]. Like other countries, the USA relies on a contractionary fiscal policy prone to raising the tax to reduce the trade deficit and national debt. It prevents the economy from overheating and creating risky bubbles. Thus, the US tackles uncertainty in the significant economic determinant, via tax collection, and contributes to its trade, especially imports. Our finding relating to the positive response of mineral import demand to the USA’s economic policy uncertainty (tax revenue) is supported by Teera and Hudson [78] and Bikas and Andruskaite [79]. In addition, Matschke [80] also advocated our finding by investigating the costliness of taxation that makes trade subsidies less appealing and trade taxes more acceptable within the typical protection for sale framework in the case of the USA.

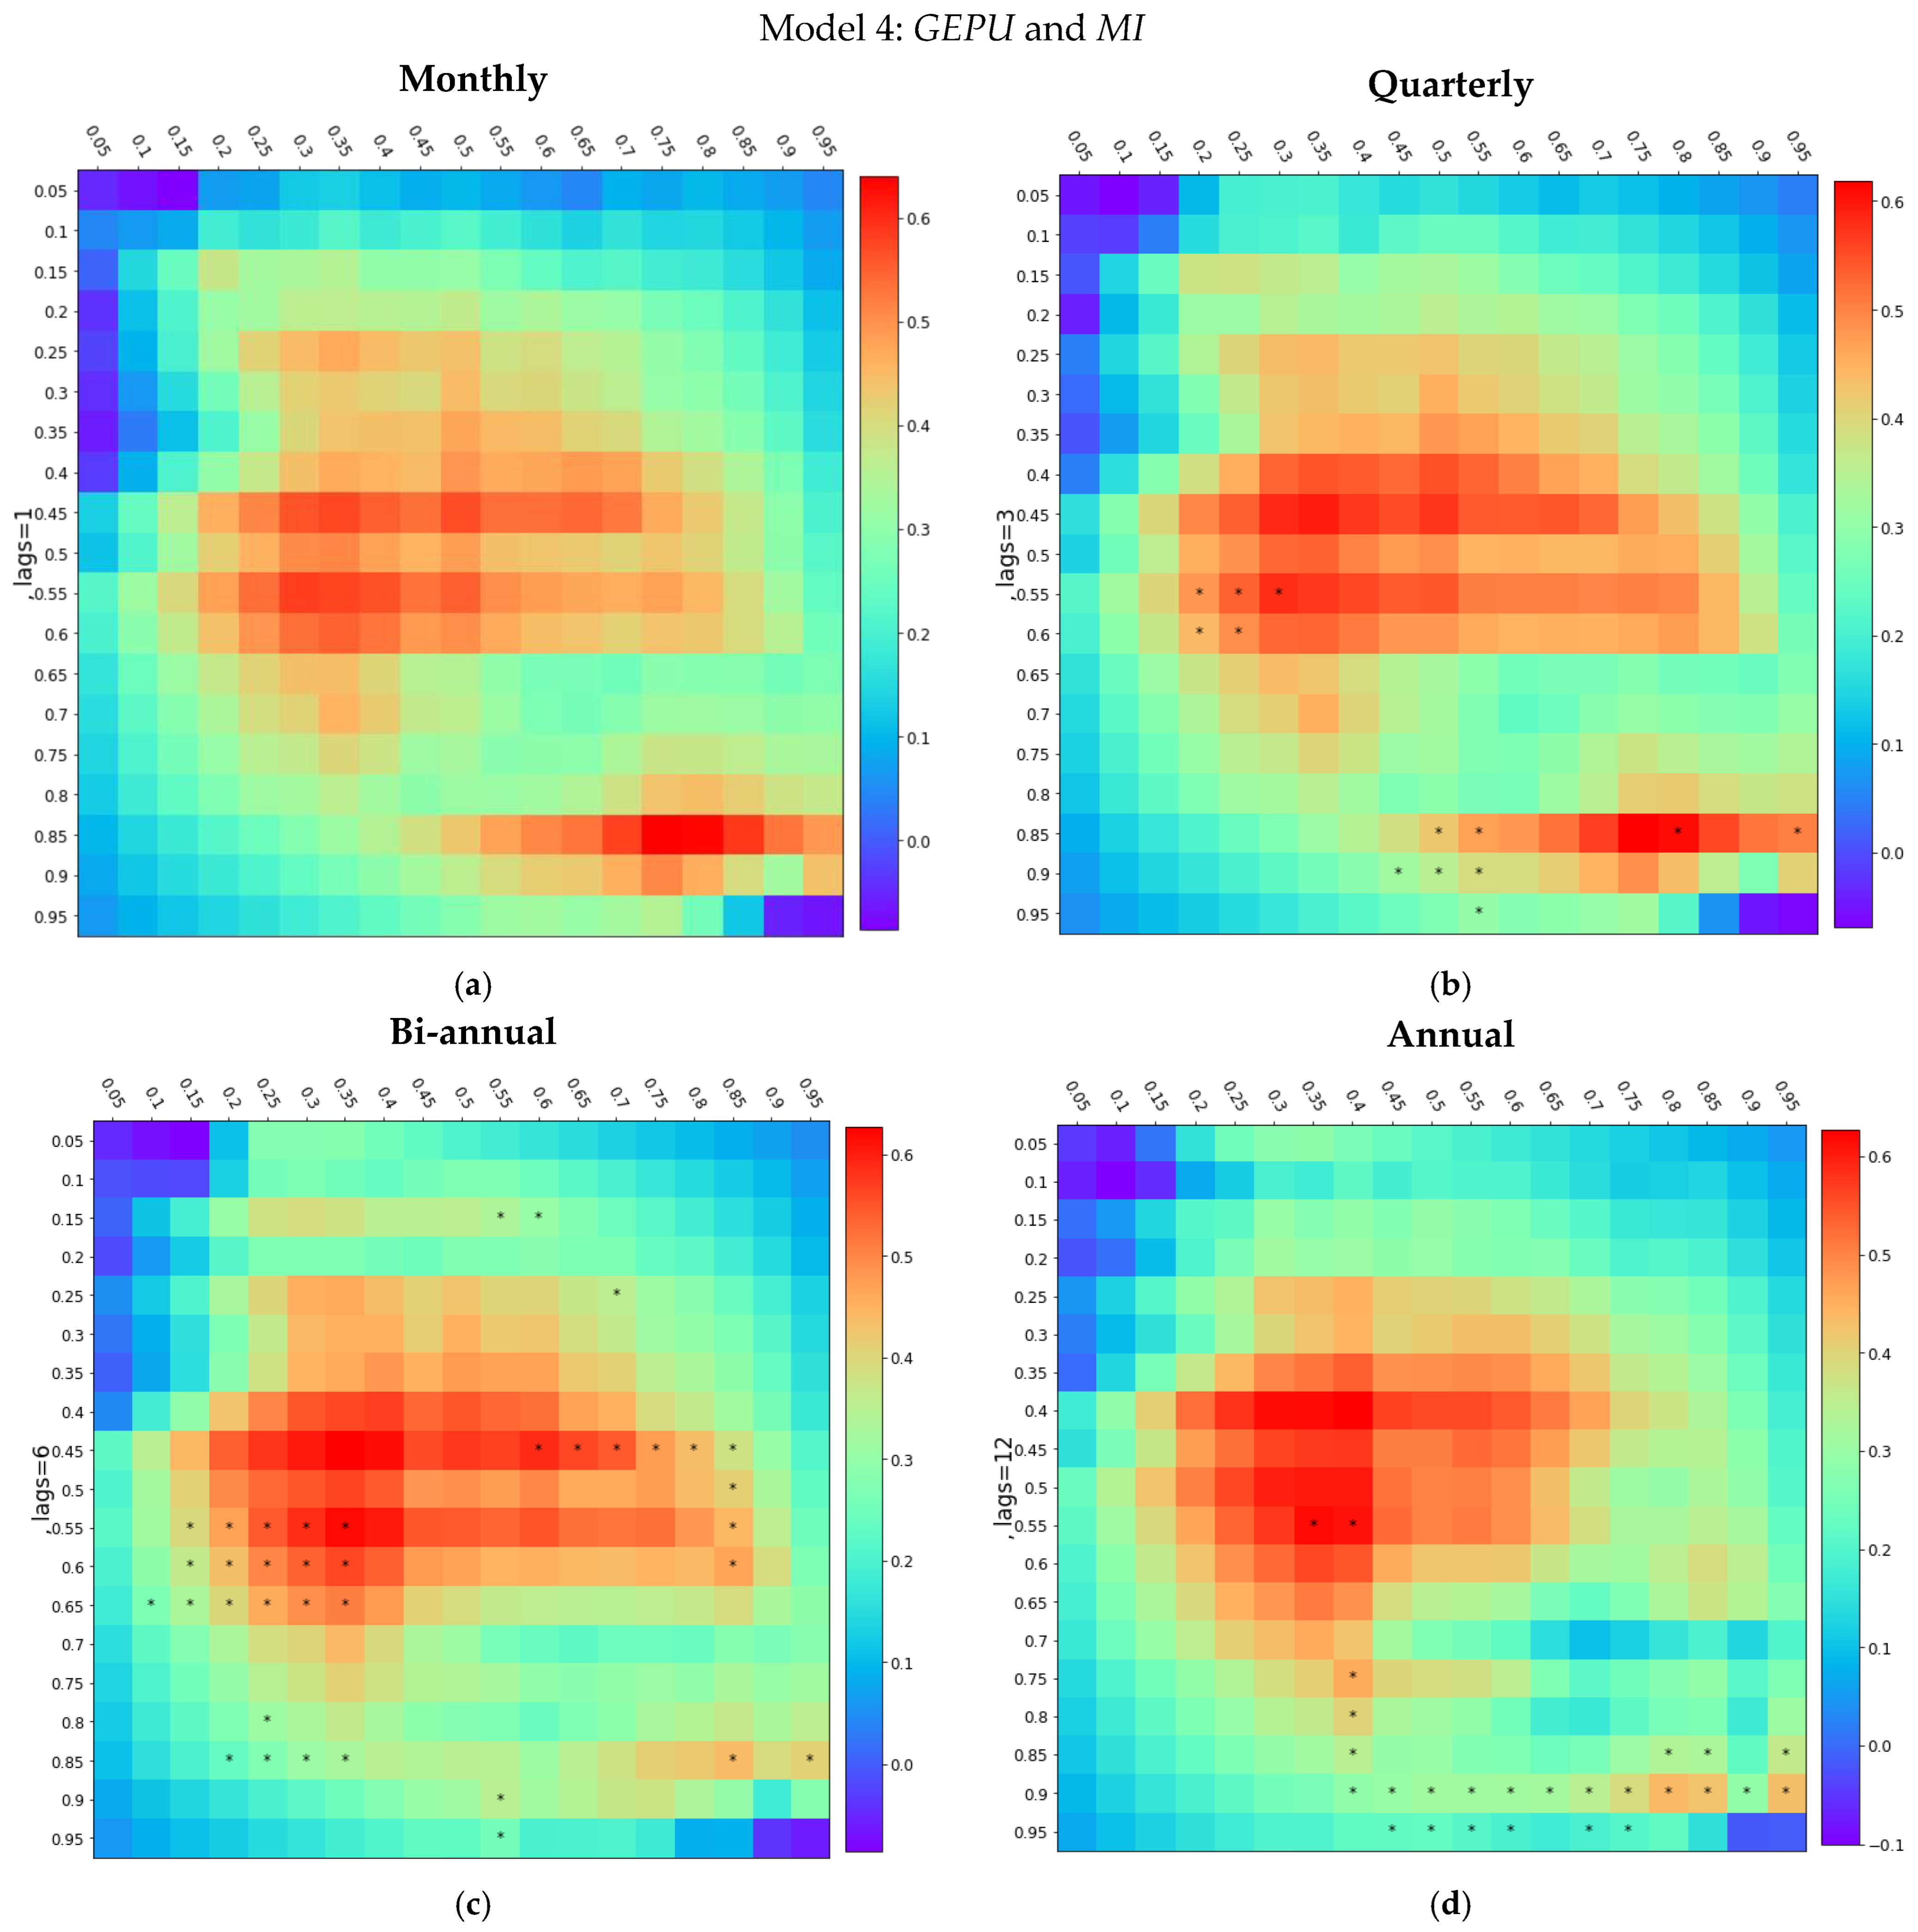
4.3.4. Global Economic Policy Uncertainty (GEPU) to Mineral Import (MI)

Model 4 measures the response of the USA’s mineral import (MI) demand to the global economic policy uncertainty (GEPU) under the CQ framework. The findings emerging from the CQ technique depict that the GEPU positively influences MI demand at the bearish and bullish states, where the GEPU lies in the low, medium, and upper quantiles under medium (quarterly and bi-annual) and long (annual) memories. However, mineral imports’ (MI) response to global economic policy uncertainty (GEPU) is inconsequential under short (monthly) memory (Figure 5).
Both the medium and long-run optimistic impacts of GEPU occur due to USA’s higher purchasing power parity (PPP) and strong currency values (exchange rate) compared to the externally located mineral-exporting countries. Generally, global economic policy uncertainty (GEPU) accentuates the theories of ‘exchange rate determination’ and ‘pressure of imported inflation’. The actual exchange rate movements can be explained via PPP. Usually, countries with high inflation have falling currencies, while those with low inflation belong to currency appreciation (during long-term hyperinflation). We can call it a “positive” (factual) usage of PPP. Besides, it is common to think that deviation from PPP causes imported inflation [81]. More specifically, the lower PPP of a country encourages exports of the goods in the international markets, whereas countries with higher PPP consume these commodities via import promotions [82]. In this case, volatility in mineral producers’ PPP contributes to increasing the mineral exports. The USA takes this opportunity through importation because of its (USA) higher level of PPP and currency values (exchange rate). It also implies that exchange rate volatilities in the mineral exporter economies make the mineral imports easy for the USA in the international markets. Thus, the significant measures of the global economic policy uncertainty, such as purchasing power parity (PPP) and exchange rate factors, become favorable for USA’s mineral importation from external countries, as found from our investigated findings. Some quasi-relevant studies support our research findings, which consider economic policy uncertainty to scrutinize its influence on different macroeconomic determinants. For example, Albulescu et al. [14] showed how the economic policy uncertainty through the oil price and currency market influences the financial market, investment and trade. In addition, the reverse directional relationship scrutinized by Tam [83] found that economic volatility in the United States significantly impacts international business. This is because major economies worldwide have significant direct and indirect trade links with the United States. Finally, the study by Sharma and Paramati [84] established that global economic policy uncertainty dampens India’s firm-level import demands of 97 commodities, which is opposite to our investigated findings.

4.4. Findings from the Quantile-on-Quantile (QQ) Technique

Using the quantile-on-quantile (CQ) technique, we examine the reliability of our findings from the CQ approach. This procedure assesses the impact of every quantile of the predictors on the quantile of the predicted factor while the latter stays constant. Thus, the technique gives a matrix of slope coefficients. We execute the QQ technique to establish the relationship between the variables under a bi-variating modelling approach.

4.4.1. USA’s Geopolitical Risk (UGPR) and Mineral Import (MI)

In Model 1, we examine the response of the USA’s geopolitical risk (UGPR) to mineral import (MI) demand using the QQ technique.
Our findings show that the MI demand negatively responds to the UGPR at all quantiles (0.2–0.8) except for some medium and upper quantiles (0.6 and 0.8–0.9) (Figure 6). This finding may appear in the case of the USA due to more freedom of the people and media which creates messy and confrontational situations, hampering governmental decisions concerning imported goods such as mineral resources. These results from the QQ approach are coherent with the CQ technique.

4.4.2. Global Geopolitical Risk (GGPR) and Mineral Import (MI)

In Model 2, the QQ technique measures the response of the mineral import (MI) demand to the global geopolitical risk (GGPR) in the case of the USA.
The quantile-on-quantile (QQ) technique-based findings show that MI negatively responds to the GGPR at almost all quantiles, though a slightly positive response appears in the (0.2–0.4) lower quantiles (Figure 7). The GGPR’s negative role is due to USA’s adopted pre-cautious measures which do not respond appropriately to preclude any geopolitical event, such as nuclear, military, and terrorist attacks. These findings from the QQ approach are also in line with the CQ method in the context of the USA.

4.4.3. USA’s Economic Policy Uncertainty (UEPU) and Mineral Import (MI)

In Model 3, we delve into the response of the mineral import (MI) demand to the USA’s economic policy uncertainty (UEPU) within the framework of the quantile-on-quantile (QQ) technique in the USA.
The finding from the quantile-on-quantile (QQ) approach divulges that mineral import (MI) demand positively responds to the USA’s economic policy uncertainty (UEPU) in the (0.5–0.8) upper quantiles though there exists a bit of negative response of MI to the UEPU at the lower quantiles (0.2–0.4) (Figure 8). The positive reaction of MI demand on the UEPU is associated with the USA’s practical economic policy measures in soothing the prices of consumer goods and taking sensible fiscal initiatives in the case of government spending and tax revenues. This finding from the QQ technique is consistent with the outcomes drawn from the CQ approach.

4.4.4. Global Economic Policy Uncertainty (GEPU) and Mineral Import (MI)

In Model 4, we examine the reply of mineral import (MI) demand to the global economic policy uncertainty (GEPU) by applying the quantile-on-quantile (QQ) technique.
We find that mineral import (MI) positively responds to the global economic policy uncertainty (GEPU) at all quantiles except for low and medium quantiles at 0.2 and 0.4 (Figure 9). The GEPU’s positive relationship with USA’s mineral import demand (MI) is much concerned with the USA’s higher purchasing power parity (PPP) and strong currency values (exchange rate). Our findings align with findings from the cross-quantilogram (CQ) technique.

5. Conclusions and Policy Implications

The overwhelming need for metallic minerals (from households to industries) has increased the demands and risks in different corners of the world. However, the mineral demand-driven geopolitical and economic volatilities are our primary concern in conducting this research from the perspective of the world’s dominant country, the USA, covering time series monthly data from 1 January 1996 to 31 December 2020. Primarily, we check the USA’s mineral import demand’s response to this country’s (USA) own and global geopolitical risks and economic policy uncertainty using two sophisticated quantile regression techniques, namely the cross-quantilogram (CQ) and the quantile-on-quantile (QQ) procedures. These two robust quantile methods yield similar findings where mineral import demand appears to respond positively to the USA’s and global economic policy uncertainty, mainly at the bullish state under long memory. In contrast, the reaction of mineral import demand to the USA’s and global geopolitical risk events are significantly adverse in the bullish condition under long memory. However, under short memory, some deviations exist in our findings relating to the response of the USA’s mineral import demand to the geopolitical events and economic policy uncertainty.
Based on the findings mentioned above, we provide some policy implications. First, country-specific (own) risks are evident in the USA, which hampers the trading of much-needed mineral resources. In this regard, proper policy measures are a dire need in sensibly responding to the demands of the people and media or social media (Facebook, Twitter, Instagram etc.) which usually hinder the government’s trade (mineral)-related policy implementation. Mainly, more freedom of the people and media may create unsound state circumstances (risky events) to affect the mineral import decisions of the US economy significantly. Second, global geopolitical events negatively influence the mineral import demand due to the USA’s lack of adopting pre-emptive measures in tackling uneven international events. In this case, the USA should consider it as policy inadequacy with the existing fence of security measures. Therefore, this country must be well-responsive to confronting the upcoming global geopolitical events emanating from the intensifying global geostrategic intricacies. Notably, the scholarly annunciation espouses that more geopolitically risky events the mineral-exporting and importing countries will hinder future metallic minerals supply. Third, according to our study’s findings, the USA’s own and global economic uncertainty issues have become favorable for this economy’s mineral trade. This fortunate circumstance can strengthen the mineral imports in mitigating the mineral demands for industrial equipment manufacturing and the clean energy transition process where metallic minerals are used as the critical raw materials. Fourth, the USA must take pragmatic economic and environmental policies to concentrate on the mineral recycling issue. This mineral recycling policy implementation can bring about societal well-being by providing congenial living opportunities for people in a pollution-free landscape. Finally, more prudent policy measures are crucial in tackling geopolitical risk events to expand USA’s mineral trade to keep up with its impressive economic development.
This study has some limitations. First, we consider only single countries such as the USA and note a panel of countries. Second, we ignore measuring any potential shock to the regressors (geopolitical tensions and economic policy uncertainties) on the regressed variable (mineral import demands) in the context of the USA. In this regard, future work could include a panel estimation procedure considering major mineral-importing countries with potential shock analysis by applying machine learning tools.

Author Contributions

Conceptualization, formal analysis, and writing, M.M.I.; review, methodology, K.S.; review and supervision, F.u.R. All authors have read and agreed to the published version of the manuscript.

Funding

The research funding from the Ministry of Science and Higher Education of the Russian Federation (Ural Federal University project within the Priority-2030 Program) is gratefully acknowledged.

Data Availability Statement

Data available in a publicly accessible repository that does not issue DOIs. Publicly available datasets were analyzed in this study. This data can be found here: https://www.policyuncertainty.com/index.html; https://www2.bgs.ac.uk/mineralsuk/statistics/UKStatistics.html (accessed on 23 November 2022).

Acknowledgments

We are greatly indebted to four anonymous referees for many helpful comments.

Conflicts of Interest

The authors declare that they have no conflict of interest.

References

  1. Azapagic, A. Developing a framework for sustainable development indicators for the mining and minerals industry. J. Clean. Prod. 2004, 1, 639–662. [Google Scholar] [CrossRef]
  2. Islam, M.M.; Sohag, K.; Hammoudeh, S.; Mariev, O.; Samargandi, N. Minerals import demands and clean energy transitions: A disaggregated analysis. Energy Econ. 2022, 113, 106205. [Google Scholar] [CrossRef]
  3. World Bank. Mineral Production to Soar as Demand for Clean Energy Increases. World Bank. 2020. Available online: https://www.worldbank.org/en/news/press-release/2020/05/11/mineral-production-to-soar-as-demand-for-clean-energy-increases (accessed on 12 April 2022).
  4. Li, J.; Lv, L.; Zhou, G.; Li, X. Mechanism of a microscale flat plate heat pipe with extremely high nominal thermal conductivity for cooling high-end smartphone chips. Energy Convers. Manag. 2019, 201, 112202. [Google Scholar] [CrossRef]
  5. Chapman, B. The geopolitics of rare earth elements: Emerging challenge for US National Security and Economics. J. Self-Gov. Manag. Econ. 2018, 6, 50–91. [Google Scholar]
  6. Eckes, A.E., Jr. The United States and the Global Struggle for Minerals; University of Texas Press: Austin, TX, USA, 1979. [Google Scholar]
  7. Lee, A. Strategic and Critical Minerals: What They Are Why They Matter. BIG ROCK Exploration. 2019. Available online: https://bigrockexploration.com/2019/04/what-makes-minerals-strategic-critical/ (accessed on 26 July 2022).
  8. Amzallag, N. From metallurgy to bronze age civilizations: The synthetic theory. Am. J. Archaeol. 2009, 113, 497–519. [Google Scholar] [CrossRef] [Green Version]
  9. Bortnikov, N.S.; Volkov, A.V.; Galyamov, A.L.; Vikent’ev, I.V.; Aristov, V.V.; Lalomov, A.V.; Murashov, K.Y. Mineral resources of high-tech metals in Russia: State of the art and outlook. Geol. Ore Depos. 2016, 58, 83–103. [Google Scholar] [CrossRef]
  10. Sonnemann, G.; Gemechu, E.D.; Adibi, N.; De Bruille, V.; Bulle, C. From a critical review to a conceptual framework for integrating the criticality of resources into Life Cycle Sustainability Assessment. J. Clean. Prod. 2015, 94, 20–34. [Google Scholar] [CrossRef]
  11. Da Silva Lima, L.; Quartier, M.; Buchmayr, A.; Sanjuan-Delmás, D.; Laget, H.; Corbisier, D.; Mertens, J.; Dewulf, J. Life cycle assessment of lithium-ion batteries and vanadium redox flow batteries-based renewable energy storage systems. Sustain. Energy Technol. Assess. 2021, 46, 101286. [Google Scholar] [CrossRef]
  12. Omodara, L.; Pitkäaho, S.; Turpeinen, E.-M.; Saavalainen, P.; Oravisjärvi, K.; Keiski, R.L. Recycling and substitution of light rare earth elements, cerium, lanthanum, neodymium, and praseodymium from end-of-life applications-A review. J. Clean. Prod. 2019, 236, 117573. [Google Scholar] [CrossRef]
  13. USGS. Facts About Nickel Nickel Uses, Resources, Supply, Demand, and Production Information. Geoscience News and Information: Geology.com. 2021. Available online: https://geology.com/usgs/uses-of-nickel/ (accessed on 20 April 2022).
  14. Albulescu, C.T.; Demirer, R.; Raheem, I.D.; Tiwari, A.K. Does the US economic policy uncertainty connect financial markets? Evidence from oil and commodity currencies. Energy Econ. 2019, 83, 375–388. [Google Scholar] [CrossRef]
  15. Brzezinski, Z. The Geostrategic Triad: Living with China, Europe, and Russia; CSIS: Washington, DC, USA, 2001; Volume 23. [Google Scholar]
  16. Spykman, N.J. America’s Strategy in World Politics: The United States and the Balance of Power; Routledge: Abingdon, UK, 2017. [Google Scholar]
  17. Massari, S.; Ruberti, M. Rare earth elements as critical raw materials: Focus on international markets and future strategies. Resour Policy 2013, 38, 36–43. [Google Scholar] [CrossRef]
  18. Harff, B.; Gurr, T.R. Ethnic Conflict in World Politics; Routledge: Abingdon, UK, 2018. [Google Scholar]
  19. Gordon, T.; Webber, J.R. Blood of Extraction: Canadian Imperialism in Latin America; Fernwood Publishing: Black Point, NS, Canada, 2016. [Google Scholar]
  20. Davis, G.A.; Tilton, J.E. The resource curse. In Natural Resources Forum; Wiley Online Library: Hoboken, NJ, USA, 2005; pp. 233–242. [Google Scholar]
  21. Islam, M.M.; Sohag, K.; Alam, M.M. Mineral import demand and clean energy transitions in the top mineral-importing countries. Resour. Policy 2022, 78, 102893. [Google Scholar] [CrossRef]
  22. Hamilton, J.D. Understanding crude oil prices. Energy J. 2009, 30, 56–78. [Google Scholar] [CrossRef] [Green Version]
  23. Kilian, L.; Murphy, D.P. The role of inventories and speculative trading in the global market for crude oil. J. Appl. Econom. 2014, 29, 454–478. [Google Scholar] [CrossRef]
  24. Jourdan, P. Toward a resource-based African industrialization strategy. In The Industrial Policy Revolution II; Springer: Berlin/Heidelberg, Germany, 2013; pp. 364–385. [Google Scholar]
  25. Stuermer, M. Industrialization and the demand for mineral commodities. J. Int. Money Finance 2017, 76, 16–27. [Google Scholar] [CrossRef] [Green Version]
  26. Henckens, M.; Biermann, F.H.B.; Driessen, P.P.J. Mineral resources governance: A call for the establishment of an International Competence Center on Mineral Resources Management. Resour. Conserv. Recycl. 2019, 141, 255–263. [Google Scholar] [CrossRef]
  27. Valero, A.; Valero, A.; Calvo, G.; Ortego, A. Material bottlenecks in the future development of green technologies. Renew. Sustain. Energy Rev. 2018, 93, 178–200. [Google Scholar] [CrossRef]
  28. Jiskani, I.M.; Moreno-Cabezali, B.M.; Rehman, A.U.; Fernandez-Crehuet, J.M.; Uddin, S. Implications to secure mineral supply for clean energy technologies for developing countries: A fuzzy based risk analysis for mining projects. J. Clean. Prod. 2022, 358, 132055. [Google Scholar] [CrossRef]
  29. Nygaard, A. The Geopolitical Risk and Strategic Uncertainty of Green Growth after the Ukraine Invasion: How the Circular Economy Can Decrease the Market Power of and Resource Dependency on Critical Minerals. Circ. Econ. Sustain. 2022, 1–28. [Google Scholar] [CrossRef]
  30. Daniel, P. Economic policy in mineral-exporting countries: What have we learned? In Mineral Wealth and Economic Development; Routledge: Abingdon, UK, 2015; pp. 81–121. [Google Scholar]
  31. Elshkaki, A. Materials, energy, water, and emissions nexus impacts on the future contribution of PV solar technologies to global energy scenarios. Sci. Rep. 2019, 9, 19238. [Google Scholar] [CrossRef] [Green Version]
  32. Zhou, T.; Li, K.; Yang, S.L. Remanufacturing with material restrictions in monopoly and duopoly. Eur. J. Ind. Eng. 2022, 16, 556–583. [Google Scholar] [CrossRef]
  33. Sohn, I. Long-term projections of non-fuel minerals: We were wrong, but why? Resour. Policy 2005, 30, 259–284. [Google Scholar] [CrossRef]
  34. Seck, G.S.; Hache, E.; Barnet, C. Potential bottleneck in the energy transition: The case of cobalt in an accelerating electro-mobility world. Resour. Policy 2022, 75, 102516. [Google Scholar] [CrossRef]
  35. Calvo, G.; Valero, A. Strategic mineral resources: Availability and future estimations for the renewable energy sector. Environ. Dev. 2022, 41, 100640. [Google Scholar] [CrossRef]
  36. Li, Y.; Huang, J.; Zhang, H. The impact of country risks on cobalt trade patterns from the perspective of the industrial chain. Resour. Policy 2022, 77, 102641. [Google Scholar] [CrossRef]
  37. Fernandez, V. Price and income elasticity of demand for mineral commodities. Resour. Policy 2018, 59, 160–183. [Google Scholar] [CrossRef]
  38. Redlinger, M.; Eggert, R. Volatility of by-product metal and mineral prices. Resour. Policy 2016, 47, 69–77. [Google Scholar] [CrossRef] [Green Version]
  39. García, D.; Guzmán, J.I. Short-term price volatility and reversion rate in mineral commodity markets. Miner. Econ. 2020, 33, 217–229. [Google Scholar] [CrossRef]
  40. Hu, Y.; Zhang, Y.; Bao, S.; Liu, T. Effects of the mineral phase and valence of vanadium on vanadium extraction from stone coal. Int. J. Miner. Metall. Mater. 2012, 19, 893–898. [Google Scholar] [CrossRef]
  41. Aldakhil, A.M.; Nassani, A.A.; Zaman, K. The role of technical cooperation grants in mineral resource extraction: Evidence from a panel of 12 abundant resource economies. Resour. Policy 2020, 69, 101822. [Google Scholar] [CrossRef]
  42. Church, C.; Crawford, A. Minerals and the metals for the energy transition: Exploring the conflict implications for mineral-rich, fragile states. In The Geopolitics of the Global Energy Transition; Springer: Berlin/Heidelberg, Germany, 2020; pp. 279–304. [Google Scholar]
  43. Bazilian, M.D. The mineral foundation of the energy transition. Extr. Ind. Soc. 2018, 5, 93–97. [Google Scholar] [CrossRef]
  44. Tokimatsu, K.; Höök, M.; McLellan, B.; Wachtmeister, H.; Murakami, S.; Yasuoka, R.; Nishio, M. Energy modeling approach to the global energy-mineral nexus: Exploring metal requirements and the well-below 2 C target with 100 percent renewable energy. Appl. Energy 2018, 225, 1158–1175. [Google Scholar] [CrossRef]
  45. Hanai, K. Conflict minerals regulation and mechanism changes in the DR Congo. Resour. Policy 2021, 74, 102394. [Google Scholar] [CrossRef]
  46. British Geological Survey (BGS). MineralsUK. British Geological Survey (BGS), Center for Sustainable Mineral Development. 2022. Available online: https://www2.bgs.ac.uk/mineralsuk/statistics/UKStatistics.html (accessed on 26 February 2022).
  47. Caldara, D.; Iacoviello, M. Measuring geopolitical risk. Am. Econ. Rev. 2022, 112, 1194–1225. [Google Scholar] [CrossRef]
  48. EPU. Economic Policy Uncertainty Index. Research on Economic Policy Uncertainty. 2022. Available online: https://www.policyuncertainty.com/index.html (accessed on 10 December 2022).
  49. Baker, S.R.; Bloom, N.; Davis, S.J. Measuring economic policy uncertainty. Q. J. Econ. 2016, 131, 1593–1636. [Google Scholar] [CrossRef]
  50. Jaber, J.O.; Elkarmi, F.; Alasis, E.; Kostas, A. Employment of renewable energy in Jordan: Current status, SWOT and problem analysis. Renew. Sustain. Energy Rev. 2015, 49, 490–499. [Google Scholar] [CrossRef]
  51. Vakulchuk, R.; Overland, I.; Scholten, D. Renewable energy and geopolitics: A review. Renew. Sustain. Energy Rev. 2020, 122, 109547. [Google Scholar] [CrossRef]
  52. Li, F.; Yang, C.; Li, Z.; Failler, P. Does geopolitics have an impact on energy trade? Empirical research on emerging countries. Sustainability 2021, 13, 5199. [Google Scholar] [CrossRef]
  53. Kapetanios, G.; Shin, Y.; Snell, A. Testing for a unit root in the nonlinear STAR framework. J. Econom. 2003, 112, 359–379. [Google Scholar] [CrossRef]
  54. Han, H.; Linton, O.; Oka, T.; Whang, Y.-J. The cross-quantilogram: Measuring quantile dependence and testing directional predictability between time series. J. Econom. 2016, 193, 251–270. [Google Scholar] [CrossRef] [Green Version]
  55. Cho, D.; Han, H. The tail behavior of safe haven currencies: A cross-quantilogram analysis. J. Int. Financ. Mark. Inst. Money 2021, 70, 101257. [Google Scholar] [CrossRef]
  56. Sohag, K.; Hammoudeh, S.; Elsayed, A.H.; Mariev, O.; Safonova, Y. Do geopolitical events transmit opportunity or threat to green markets? Decomposed measures of geopolitical risks. Energy Econ. 2022, 111, 106068. [Google Scholar] [CrossRef]
  57. Sim, N.; Zhou, H. Oil prices, US stock return, and the dependence between their quantiles. J. Bank. Financ. 2015, 55, 1–8. [Google Scholar] [CrossRef]
  58. Bouoiyour, J.; Selmi, R.; Wohar, M.E. Measuring the response of gold prices to uncertainty: An analysis beyond the mean. Econ. Model. 2018, 75, 105–116. [Google Scholar] [CrossRef] [Green Version]
  59. Fatima, T.; Karim, M.Z.a.; Meo, M.S. Sectoral CO2 emissions in China: Asymmetric and time-varying analysis. J. Environ. Plan. Manag. 2021, 64, 581–610. [Google Scholar] [CrossRef]
  60. Auxier, B. 64% of Americans Say Social Media Have a Mostly Negative Effect on the Way Things Are Going in the U.S. Today. Pew Research Center. 2020. Available online: https://www.pewresearch.org/fact-tank/2020/10/15/64-of-americans-say-social-media-have-a-mostly-negative-effect-on-the-way-things-are-going-in-the-u-s-today/ (accessed on 24 July 2022).
  61. Amaded, K.U.S. Military Budget, Its Components, Challenges, and Growth. The Balance. 2022. Available online: https://www.thebalance.com/u-s-military-budget-components-challenges-growth-3306320 (accessed on 24 July 2022).
  62. NSC. National Strategy for Counterterrorism of the United States of America [Internet]. Office of the Director of National Intelligence; 2018. Available online: https://www.dni.gov/index.php/features/national-strategy-for-counterterrorism (accessed on 24 July 2022).
  63. Davis, M. The Impact of 9/11 on Business. Investopedia. 2022. Available online: https://www.investopedia.com/financial-edge/0911/the-impact-of-september-11-on-business.aspx (accessed on 20 September 2022).
  64. Su, C.-W.; Khan, K.; Umar, M.; Zhang, W. Does renewable energy redefine geopolitical risks? Energy Policy 2021, 158, 112566. [Google Scholar] [CrossRef]
  65. Cheng, C.H.J.; Chiu, C.-W.J. How important are global geopolitical risks to emerging countries? Int. Econ. 2018, 156, 305–325. [Google Scholar] [CrossRef]
  66. Santillán-Saldivar, J.; Cimprich, A.; Shaikh, N.; Laratte, B.; Young, S.B.; Sonnemann, G. How recycling mitigates supply risks of critical raw materials: Extension of the geopolitical supply risk methodology applied to information and communication technologies in the European Union. Resour. Conserv. Recycl. 2021, 164, 105108. [Google Scholar] [CrossRef]
  67. Lee, J. The world stock markets under geopolitical risks: Dependence structure. World Econ. 2019, 42, 1898–1930. [Google Scholar] [CrossRef]
  68. Bilgin, M.H.; Gozgor, G.; Karabulut, G. How do geopolitical risks affect government investment? An empirical investigation. Def. Peace Econ. 2020, 31, 550–564. [Google Scholar] [CrossRef]
  69. Amadeo, K. How the Federal Reserve Controls Inflation. The Balance. 2022. Available online: https://www.thebalance.com/what-is-being-done-to-control-inflation-3306095 (accessed on 15 August 2022).
  70. Dotsey, M.; Sarte, P.D. Inflation uncertainty and growth in a cash-in-advance economy. J. Monet. Econ. 2000, 45, 631–655. [Google Scholar] [CrossRef]
  71. Barro, R.J. Inflation and economic growth. Ann. Econ. Financ. 2013, 14, 85–109. [Google Scholar]
  72. Friedman, M. Nobel lecture: Inflation and unemployment. J. Political Econ. 1977, 85, 451–472. [Google Scholar] [CrossRef]
  73. Kim, W. Government spending policy uncertainty and economic activity: US time series evidence. J. Macroecon. 2019, 61, 103124. [Google Scholar] [CrossRef]
  74. Bloom, N. The impact of uncertainty shocks. Econometrica 2009, 77, 623–685. [Google Scholar]
  75. Rubio-Ramírez, J.F.; Fernández-Villaverde, J.; Kuester, K.; Guerron-Quintana, P.A. Fiscal Volatility Shocks and Economic Activity. Am. Econ. Rev. 2011, 105, 3352–3384. [Google Scholar]
  76. Born, B.; Pfeifer, J. Policy risk and the business cycle. J. Monet. Econ. 2014, 68, 68–85. [Google Scholar] [CrossRef] [Green Version]
  77. Baunsgaard, T.; Keen, M. Tax revenue and (or?) trade liberalization. J. Public Econ. 2010, 94, 563–577. [Google Scholar] [CrossRef] [Green Version]
  78. Teera, J.M.; Hudson, J. Tax performance: A comparative study. J. Int. Dev. 2004, 16, 785–802. [Google Scholar] [CrossRef]
  79. Bikas, E.; Andruskaite, E. Factors affecting value added tax revenue. Eur. Sci. J. 2013, 9, 8–19. [Google Scholar]
  80. Matschke, X. Costly revenue-raising and the case for favoring import-competing industries. J. Int. Econ. 2008, 74, 143–157. [Google Scholar] [CrossRef] [Green Version]
  81. Chou, W.L.; Shih, Y.C. The equilibrium exchange rate of the Chinese Renminbi. J. Comp. Econ. 1998, 26, 165–174. [Google Scholar] [CrossRef]
  82. Danmola, R.A. The impact of exchange rate volatility on the macro economic variables in Nigeria. Eur. Sci. J. 2013, 9, 152–165. [Google Scholar]
  83. Tam, P.S. Global trade flows and economic policy uncertainty. Appl. Econ. 2018, 50, 3718–3734. [Google Scholar] [CrossRef]
  84. Sharma, C.; Paramati, S.R. Does economic policy uncertainty dampen imports? Commodity-level evidence from India. Econ. Model. 2021, 94, 139–149. [Google Scholar] [CrossRef]
Figure 1. (ae) show the trends of mineral import demand, USA’s geopolitical risks, global geopolitical risks, USA’s economic policy uncertainty, global economic policy uncertainty, respectively.
Mathematics 11 00180 g001
Figure 2. Effect of USA’s geopolitical risks (UGPR) on mineral import (MI) in short (monthly (a) and quarterly (b)), medium (bi-annual) (c) and long (annual) (d) memories. Notes: * shows the significance level. 0.95 depicts the highest bullish scenario, and 0.05 shows the bearish state for both the UGPR and MI demand. The deep blue spectrum exhibits a solid negative consequence, while the deep red range portrays the strong positive influence of the UGPR on MI. Besides, light green and red colors display a moderately positive relationship between UGPR and MI.
Mathematics 11 00180 g002
Figure 3. Effect of global geopolitical risks (GGPR) on mineral import (MI) in short (monthly (a) and quarterly (b)), medium (bi-annual) (c) and long (annual) (d) memories. Notes: * shows the significance level. 0.95 depicts the highest bullish scenario, and 0.05 shows the lowest bearish state for both the GGPR and MI demand. The deep blue spectrum exhibits a solid negative consequence, while the deep red range portrays the strong positive influence of the UGPR on MI. Besides, light green and red colours display a moderately positive relationship between GGPR and MI.
Mathematics 11 00180 g003
Figure 4. Effect of USA’s economic policy uncertainty (UEPU) on mineral import (MI) in short (monthly (a) and quarterly (b)), medium (bi-annual) (c) and long (annual) (d) memories. Notes: * shows the significance level. 0.95 depicts the highest bullish scenario, and 0.05 shows the lowest bearish state for both the UEPU and MI demand. The deep blue spectrum exhibits a solid negative consequence, while the deep red range portrays the strong positive influence of the UEPU on MI. Besides, light green and red colors display a moderately positive relationship between UEPU and MI.
Mathematics 11 00180 g004
Figure 5. Effect of global economic policy uncertainty (GEPU) on mineral import (MI) in short (monthly (a) and quarterly (b)), medium (bi-annual) (c) and long (annual) (d) memories. Notes: * shows the significance level. 0.95 depicts the highest bullish scenario, and 0.05 shows the lowest bearish state for both the GEPU and MI demand. The deep blue spectrum exhibits a solid negative consequence, while the deep red range portrays the strong positive influence of the GEPU on MI. Besides, light green and red colors display a moderately positive relationship between GEPU and MI.
Mathematics 11 00180 g005
Figure 6. US geopolitical risk (UGPR) and mineral import (MI). Notes: The z-axis exhibits the slope coefficients against the quantiles of MI (θ) on the y-axis and the quantiles of UGPR (τ) on the x-axis. The yellow and green colors represent the strongly positive slope coefficients, while the light blue colors display the moderately positive slope coefficients. Besides, the dark blue color reveals the trivially negative slope coefficients.
Mathematics 11 00180 g006
Figure 7. Global geopolitical risk (GGPR) and mineral import (MI). Notes: The z-axis exhibits the slope coefficients against the quantiles of MI (θ) on the y-axis and the quantiles of GGPR (τ) on the x-axis. The yellow and green colors represent the strongly positive slope coefficients, while the light blue colors display the moderately positive slope coefficients. Besides, the dark blue color reveals the trivially negative slope coefficients.
Mathematics 11 00180 g007
Figure 8. US economic policy uncertainty (UEPU) and mineral import (MI). Notes: The z-axis exhibits the slope coefficients against the quantiles of MI (θ) on the y-axis and the quantiles of UEPU (τ) on the x-axis. The yellow and green colors represent the strongly positive slope coefficients, while the light blue colors display the moderately positive slope coefficients. Besides, the dark blue color reveals the trivially negative slope coefficients.
Mathematics 11 00180 g008
Figure 9. Global economic policy uncertainty (GEPU) and mineral import (MI). Notes: The z-axis exhibits the slope coefficients against the quantiles of MI (θ) on the y-axis and the quantiles of GEPU (τ) on the x-axis. The yellow and green colors represent the strongly positive slope coefficients, while the light blue colors display the moderately positive slope coefficients. Besides, the dark blue color reveals the trivially negative slope coefficients.
Mathematics 11 00180 g009
Table 1. Data descriptions and sources.
CodeDescriptionMeasurementSources
Dependent variable
MIMineral imports Total mineral imports volume in metric ton (measured in thousands)British Geological Survey [46]
Independent variables
UGPRUSA’s geopolitical risk indexThree USA-based newspapers include “The New York Times, Washington Post, and Chicago Tribune,” whose electronic archives are the sources of the USA’s geopolitical risk (GPR) index. This index is shown as a percentage of the monthly newspaper writings. Mainly, the generated index reflects how the United States views the risks that affect the concerned countries.Caldara & Iacoviello [47]
GGPRGlobal geopolitical risk indexThe global geopolitical risks index highlights the monthly news articles from 11 renowned dailies covering six aspects of geopolitical events. In addition, this index distinguishes between the threats of geopolitical risks and the direct adverse effects of geopolitical events.
UEPUUSA’s economic policy uncertainty indexThe newspaper-based index of the USA’s economic policy uncertainty is the product of the search results from 10 prominent newspapers. A normalized index is devised based on the number of news items on economic policy uncertainty. Moreover, the uncertainty index about the policy-related macroeconomic variables is a dispersion measure of forecasts made by different predictors regarding future levels of the Consumer Price Index, Federal Expenditures, and State and Local Expenditures.EPU [48]
GEPUGlobal economic policy uncertainty indexGlobal economic policy uncertainty is an index congregating mainly two underlying components, purchasing power parity (PPP) and exchange rate, to gauge policy-related volatility on these macroeconomic determinants. Therefore, quantifying media coverage of policy-related economic uncertainty is the most adaptable part of covering the perspectives of the globe, countries and regions.
Note: The data are converted to natural logarithmic form.
Table 2. Descriptive statistics.
MIUGPRGGPRUEPUGEPU
Mean15.64460.93394.50414.74744.7535
Median15.87550.93344.47144.69714.7056
Maximum16.18802.38446.23936.22256.0641
Minimum14.8810−0.04833.66473.80183.8911
Std. Dev.1.52000.35190.35800.42910.4671
Skewness−0.37700.36711.13260.54470.4296
Kurtosis1.37804.98176.83943.29262.4977
Jarque-Bera39.993455.828948.412915.907212.3847
Prob.0.00000.00000.00000.00030.0020
Obs.300300300300300
Note: MI: Mineral import; UGPR: USA’s geopolitical risk index; GGPR: Global geopolitical risk index; UEPU: USA’s economic policy uncertainty index; and GEPU: Global economic policy uncertainty index.
Table 3. Results from the KSS unit-root test.
SeriesKSS Estimated ValuesSignificance at 10% Level
MI−4.68−2.66
UGPR−3.74−2.66
GGPR−3.89−2.66
UEPU−2.78−2.66
GEPU−3.54−2.66
Note: MI: Mineral import; UGPR: USA’s geopolitical risks index; GGPR: Global geopolitical risk index; UEPU: USA’s economic policy uncertainty index; and GEPU: Global economic policy uncertainty index.
Disclaimer/Publisher’s Note: The statements, opinions and data contained in all publications are solely those of the individual author(s) and contributor(s) and not of MDPI and/or the editor(s). MDPI and/or the editor(s) disclaim responsibility for any injury to people or property resulting from any ideas, methods, instructions or products referred to in the content.

