Abstract
The automatic handling of banknotes can be conducted not only by specialized facilities, such as vending machines, teller machines, and banknote counters, but also by handheld devices, such as smartphones, with the utilization of built-in cameras and detection algorithms. As smartphones are becoming increasingly popular, they can be used to assist visually impaired individuals in daily tasks, including banknote handling. Although previous studies regarding banknote detection by smartphone cameras for visually impaired individuals have been conducted, these studies are limited, even when conducted in a cross-dataset environment. Therefore, we propose a deep learning-based method for detecting fake multinational banknotes using smartphone cameras in a cross-dataset environment. Experimental results of the self-collected genuine and fake multinational datasets for US dollar, Euro, Korean won, and Jordanian dinar banknotes confirm that our method demonstrates a higher detection accuracy than conventional “you only look once, version 3” (YOLOv3) methods and the combined method of YOLOv3 and the state-of-the-art convolutional neural network (CNN).
Keywords:
deep learning; multinational fake banknote detection; smartphone camera; cross-dataset environment; visually impaired people MSC:
68T07; 68U10
1. Introduction
Counterfeit or fake banknote recognition is critical for the automatic handling of paper money, which is mostly conducted by automated transaction facilities, such as counting or vending machines. These specialized devices are equipped with various detection sensors, such as visible light, infrared (IR), ultraviolet (UV), and magnetic sensors, to process multiple anti-counterfeit features, including watermarks, security threads, anti-copier patterns, and hologram patterns [1]. Frequently checking counterfeit notes is generally difficult owing to the significant number of notes in recirculation, and specialized devices are not always accessible, especially for general users. This can be resolved by applying electronic financial transaction methods; however, owing to their simplicity and reliability, banknotes largely remain in recirculation.
The recent development of smartphones and handheld devices has made these devices available to nearly every individual and they can assist users in various daily tasks. On the other hand, advanced technologies in imaging devices have made it easy to reproduce counterfeit banknotes from genuine banknotes. These types of fake banknotes can be easily recognized by specialized devices that consist of multiple built-in counterfeit detection sensors; however, they may not be recognized in recirculation by general users, especially visually impaired individuals. Moreover, detection devices are unavailable to certain users, unlike smartphones that are becoming more common. Therefore, we propose a multinational fake banknote detection method using smartphone cameras in a cross-dataset environment, which aims to recognize fake banknotes reproduced from genuine banknotes by general-purpose imaging devices. Compared to previous studies, our proposed method is novel considering the following four features:
- (1)
- This is the first study of multinational fake banknote detection using smartphone cameras in a cross-dataset environment.
- (2)
- We propose a two-stage classification model, including a “you only look once, version 3” (YOLOv3)-based detector and an additional convolutional neural network (CNN) classifier. The input images for the detector were retinex-filtered, which helped enhance the detection results. To enhance the overall detection results, we tested the model by using various scores and feature-lever fusion methods.
- (3)
- Multinational and cross-dataset environments were considered to confirm the generality of the proposed model without retraining. To enhance the generality, sharpness-aware minimization (SAM) optimization was adopted for the training of our model.
- (4)
- Our trained CNN models and algorithms are made available, as shown in [2], for a fair comparison by other researchers.
2. Related Works
Most previous studies regarding the detection of fake banknotes used multiple imaging sensors to detect the various implemented features and patterns on banknotes; these sensors have been applied to automated sorting devices, such as counting machines or vending machines. Considering the visible-light imaging method, banknote detection can be conducted either by transaction machines, as already indicated, or by general users. The previously presented methods are categorized as follows: detection-based, classification-based, and a combination of detection- and classification-based methods. These are explained in the following subsections.
2.1. Detection-Based Methods
In banknote detection studies, a local feature description can be utilized to detect the presence of banknotes in an input image as one approach. Costa reported a method for the recognition of Euro banknotes using several detection algorithms and keypoint descriptors, such as scale-invariant feature transform (SIFT) and speeded-up robust features (SURF), on important features of reference banknote images [3]. This method was reported to detect banknotes under various conditions, including being partially visible, folded, wrinkled, or worn-out in complex environments [4]. SURF was also used in the study by Hasanuzzaman et al. to automatically recognize banknotes to assist visually impaired individuals [5]. Another recent approach includes utilizing localization algorithms to determine whether a banknote is presented in the input image. Zhang and Yan proposed a method for detecting and recognizing paper currency using a CNN as the feature extractor under the framework of a single-shot multibox detector (SSD) model [6]. For the banknote detection and recognition system for visually impaired individuals proposed in [7], Joshi et al. employed the YOLOv3 CNN model and conducted experiments on a self-built Indian banknote dataset. Since all methods consider only detection-based methods without additional classifiers, the accuracy can be improved by using an additional classifier.
2.2. Classification-Based Methods
In addition to detection-based approaches, studies regarding automatic banknote handling can be identified as using classification-based approaches; that is, banknote images or regions of interest (ROIs) are captured in specialized devices or extracted from the original captured image to reduce the effect of the background and are subsequently classified into specified categories using a classification algorithm. When using visible-light images of banknotes in classification-based approaches for counterfeit verification, a combination with additional imaging sensors, such as ultraviolet (UV) [8] and infrared (IR) [9,10] sensors, is generally considered. Bhavani and Karthikeyan [11] transformed banknote images into YIQ color space using only visible-light images and used the luminance histogram of the Y channel as the input for the support vector machine (SVM) classifier for counterfeit detection. A similar type of feature was also used by Yeh et al. [12]; however, they used transmitted visible-light images of banknotes instead. In the method proposed by Pham et al. [13], genuine and reproduced fake banknote images were captured by a smartphone camera using composite images of ROIs and CNNs as classifiers. Classification-based studies regarding fake banknote recognition mostly used input images readily prepared for the classifiers, without the detection or verification step, to confirm the existence of the banknote in use.
2.3. Detection- and Classification-Based Methods
Considering the issues presented by detection-based and classification-based methods, Park et al. proposed a three-stage detection method for both banknotes and coins using a faster region-based CNN (Faster R-CNN) and an additional classifier of ResNet CNN architecture [14]. However, their study involved only the recognition of the banknote type and denomination, rather than the counterfeit (fake) detection of banknotes. Additionally, they did not consider a cross-dataset environment.
Based on the analysis of previous studies, we propose a method for the detection and classification of fake and genuine banknotes using visible-light images captured by smartphone cameras in a cross-dataset environment. The banknote regions in the captured banknote images are localized using the YOLOv3 model with the input of pre-processed images. The detected ROIs are then used as inputs for additional CNN classifiers and various scores and feature-lever fusion methods for classifying banknotes into fake or genuine categories in a cross-dataset environment, regardless of the denomination and exposed side of an image.
Table 1 presents a comparison of the previous studies and our proposed method.

Table 1.
Comparisons of previous studies and our proposed method.
Table 1.
Comparisons of previous studies and our proposed method.
| Category | Method | Advantage | Disadvantage | |
|---|---|---|---|---|
| Detection-based |
|
|
| |
| Classification-based |
| The effect of the background is reduced or eliminated because only the banknote areas or ROIs are used as the input to the system | Input images of banknotes need to be captured by specialized devices or manually selected from the original images | |
| Detection- and classification-based | Homogeneous dataset environment | A three-stage detection method using Faster R-CNN and ResNet [14] | High accuracies of banknote detection and classification | Does not consider cross-dataset environment |
| Cross-dataset environment | Using YOLOv3 for banknote detection and additional CNNs with fusion methods for recognition of fake banknotes |
| Requires training for multiple CNN models | |
3. Proposed Method
3.1. Overview of the Proposed Method
Figure 1 presents the overall flowchart of the proposed method. The inputted banknote image captured by a smartphone camera is pre-processed by applying a retinex filter. This preprocessing step enhances the detection result by YOLOv3 in the next step. Although the YOLOv3 model has two outputs that can detect the two classes of fake and genuine banknotes, additional CNN models are used to obtain the final classification results. The inputs for these CNN classifiers were the banknote regions cropped from the original input image based on the bounding boxes detected by YOLOv3. We used two CNN models and various scores or feature-level fusion methods to obtain the final classification results of fake or genuine banknotes.
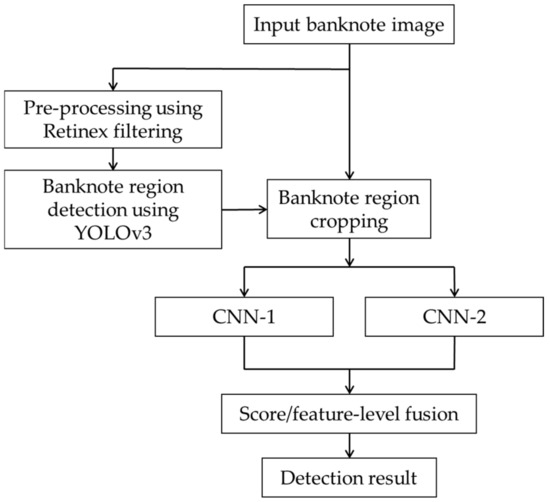
Figure 1.
Overall flowchart of the proposed method.
3.2. Inputted Banknote Image and Pre-Processing
We used a smartphone camera to capture banknote images. The camera’s capturing modes and parameters were automatically set by the smartphone to represent a general use scenario in practice. While being held in front of the camera, the banknote was exposed either on the front or back side and in arbitrary directions, as shown in Figure 2a,b.
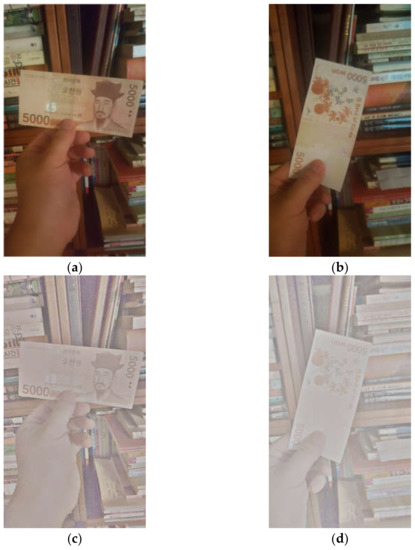
Figure 2.
Example of banknote images captured from the (a) front side and (b) back side; (c) and (d) are the corresponding pre-processed images using MSRCR.
In the next pre-processing step, a multi-scale retinex (MSR) filter is applied to the original captured banknote image. This filtering technique is commonly used to enhance the object detection results of YOLOv3 [15,16]. In this study, we use a variant of retinex, namely, multi-scale retinex with color restoration (MRSCR) [17] because the color difference is essential for the recognition of reproduced fake banknotes. The retinex theory states that the image is affected by the incident light source and the reflection properties of the surface [18]. To emphasize the objects’ color, the retinex algorithm helps to reduce the effect of illumination and compensates for the reflection. The single-scale retinex (SSR) equation is expressed as follows:
where Ii(x,y) is the image in the ith color spectral band, F(x,y) denotes the Gaussian filter, and Ri(x,y) is the retinex output, that is, the reflectance for each pixel. To obtain the MSR, we calculated the weighted sum of the SSR results with various Gaussian scales, as indicated in (2):
where N is the number of scales and Rni is the ith component of the nth scale associated with the weight wn. The color restoration algorithm for MSR is as follows [17]:
where α and β are the coefficients controlling the strength of the nonlinearity and the gain constant, respectively, G is the gain, and b is the bias value. These parameters were set to the default values in [17]. Figure 2c,d present the results of the pre-processing step on the captured banknote images.
3.3. Banknote Detection by YOLOv3
We adopted the YOLOv3 model for banknote detection. This is a deep learning-based object detection algorithm that predicts bounding boxes using logistic regression and the sum of squared error loss [19]. Compared to the previous versions, YOLOv3 uses the Darknet-53 network architecture for feature extraction. This CNN-based feature extractor is followed by a detector and classifier. The architecture of YOLOv3 is shown in Figure 3.
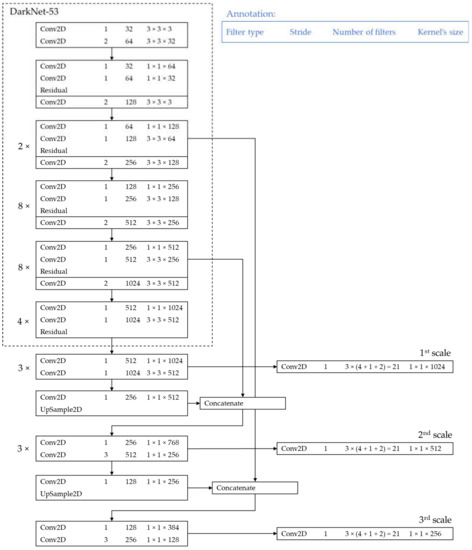
Figure 3.
Architecture of YOLOv3 object detector. “Conv2D” and “UpSample2D” denote the two-dimensional convolutional layers and up-sampling layers, respectively.
In Darknet-53, convolutional layers with a stride of two are used to reduce the dimension of the feature maps instead of pooling layers. This helps to maintain the quality of object detection and prevents information loss, which usually occurs during subsampling. Residual connections and multi-scale detection help improve the detection of small objects [19]. In YOLOv3, a convolutional layer of 1 × 1 with logistic regression is used instead of softmax to enable multilabel classification.
The entire detection process of the inputted images was performed in a single evaluation using YOLO. First, the inputted image is divided into grids and the bounding boxes, confidence scores, and class probabilities are encoded based on the grid where the center of the object is located. There are four values for the box coordinates indicating the following: two offsets to the center of the object, width, and height (x, y, w, h). The box confidence score indicates the likelihood of an object in the box and the class probabilities represent the probabilities of the object in the box belonging to the classes. As a result, the output tensors at each feature map have a size calculated by “Number of bounding boxes × (4 + 1 + Number of classes)”. YOLOv3 generates detection results on three scales, as shown in Figure 3.
This algorithm results in the detection of multiple bounding boxes. In our study, predictions with an object confidence that is less than the optimal threshold are rejected. The optimal threshold was experimentally determined as 0.3, with the training data demonstrating the highest detection accuracies. The remaining boxes may overlap and are filtered using the non-max suppression (NMS) algorithm [20]. In the NMS, the bounding box with the maximum confidence score is compared with the other boxes that intersect with it. If the intersection over union (IoU) ratio is higher than 0.3, the box is rejected as multiple detection on one banknote; this threshold of 0.3 is also experimentally determined with the training data, which demonstrated the highest detection accuracies with the training data.
Although the YOLOv3 model in our method has two outputs corresponding to the two classes of fake and genuine banknotes, we use additional CNN classifiers in the next step to enhance the overall detection result, particularly for the cross-dataset testing experiment to confirm the multinational usage ability of our method.
In the “Banknote region detection using YOLOv3” step of Figure 1, both real and fake banknotes whose ground-truth regions were manually annotated were used for training. Therefore, YOLOv3 produces the detected region with the class label and probability of real and fake banknotes. As shown in Figure 1 and Figure 2, it is difficult to know the rotation angle in the captured banknote image and the detected banknote region by YOLOv3 in advance. Therefore, the detected banknote region is directly inputted to the additional two CNNs for the final classification of genuine and fake banknotes without reorientation. “Directly inputted” does not mean that the orientation is manually corrected; it means that the detected banknote region itself is inputted to the additional two CNNs without any orientation compensation and modification.
3.4. CNN Classifiers
In the next step of our method, we used additional CNN classifiers for the banknotes detected in the previous step. In this study, we used ResNet-18 [21] and GoogleNet [22] architectures for the classification step after YOLOv3 detection because they yielded good results in previous studies [13,14] with original captured banknote images; GoogleNet was used as the comparative method for the experiments in [10]. We also tested the classification using Inception-ResNet-v2 [23], which is a combination of the inception architecture and residual connections of ResNet. Considering the types of input images for fake banknote detection, we used the original banknote images as inputs for the CNN classifiers. That is, based on the bounding boxes predicted by YOLOv3 in the previous step, we cropped the ROIs from the original images and fed them into the CNNs to determine whether the detected image regions belonged to the fake or genuine classes. The classification results were then used instead of the class detected by YOLO to calculate the overall accuracy.
Figure 4 presents the structure of the CNN classifiers used in the proposed method. In the case of ResNet-18 and GoogleNet, each architecture is comprised of substructures, namely, the residual block and the inception block, respectively. Details regarding these blocks are shown in Figure 5. In the residual block, denoted by “Two-Layer-Res” in Figure 4a, the skip connection directly delivers the input data to the output of the two-layer convolutional subnetwork, as shown in Figure 5a, which is useful for a network with several layers. That is, when a group of layers produces an output identical to the input or acts as an identity function, the skip connection can be used in the residual block instead of the convolutional layers because the identical function is optimal. Residual blocks help prevent performance degradation in very deep networks. The number of 3 × 3 filters in each residual block may vary according to the group of blocks, which is denoted by the indices in Figure 4a [21]. As shown in Figure 5a, two convolutional layers were used in each residual block of ResNet-18.
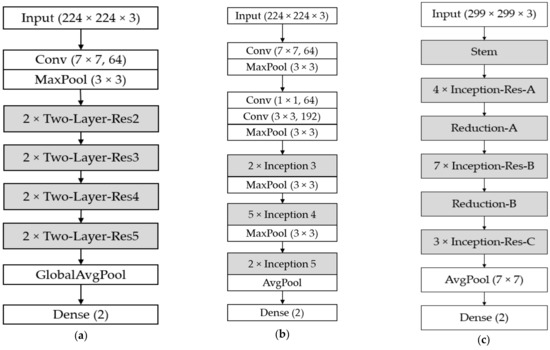
Figure 4.
Structures of the CNNs used in our method: (a) ResNet-18, (b) GoogleNet, and (c) Inception-ResNet-v2. “Conv” denotes the two-dimensional convolutional layer, with filter size and the number of filters in parentheses; “MaxPool” and “AvgPool” indicate the max pooling and average pooling layers, respectively.
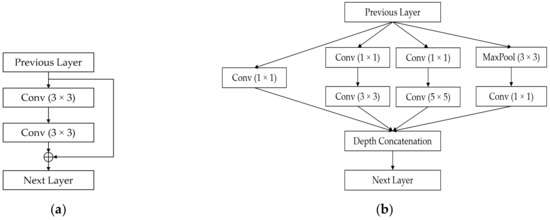
Figure 5.
Structures of (a) the two-layer residual block in ResNet-18 and (b) the inception block in GoogleNet, respectively.
The inception block in GoogleNet, which is denoted by “Inception” in Figure 4b, comprises a filter with different scales of 1 × 1, 3 × 3, and 5 × 5 for extracting features of various scales, as shown in Figure 5b. As shown in Figure 5b, six convolutional layers were used in each inception block of GoogleNet. At the output of the filter branches, the feature maps were concatenated depth-wise. Similar to the case of ResNet-18, the number of filters in the branches of each inception block vary among the group of blocks in the GoogleNet architecture [22]. Batch normalization was used between the convolutional layers of both architectures to add generalization to the network [24].
The substructures in Inception-ResNet-v2, denoted by “Inception-Res” in Figure 4c, contain the key features of the residual block and inception block combined. The structures of the residual inception blocks are shown in Figure 6. There are several modifications to these blocks compared to the previous version of the inception network. First, in the Inception-Res-A subblock, a 5 × 5 convolution is factorized into two 3 × 3 operations to improve the computational speed. In addition, the filter size of n × n was factorized to a combination of 1 × n and n × 1 convolutions, which significantly reduced the computational cost [25]. This technique was applied to all residual inception blocks, as shown in Figure 6. In the residual inception block C, shown in Figure 6c, the filter banks are expanded instead of being made deeper. This helps remove the representational bottleneck, which is the phenomenon of information loss when dimensions are drastically reduced [25]. In addition, 7, 10, and 10 convolutional layers were used in Inception-Res-A, Inception-Res-B, and Inception-Res-C of Inception-ResNet-v2, as shown in Figure 6. The optimal numbers of all the convolutional layers in the residual block of ResNet-18, inception block of GoogleNet, and Inception-Res-A, B, and C of Inception-ResNet-v2 were experimentally determined, and the best classification accuracies of genuine and fake banknotes were obtained with training data.
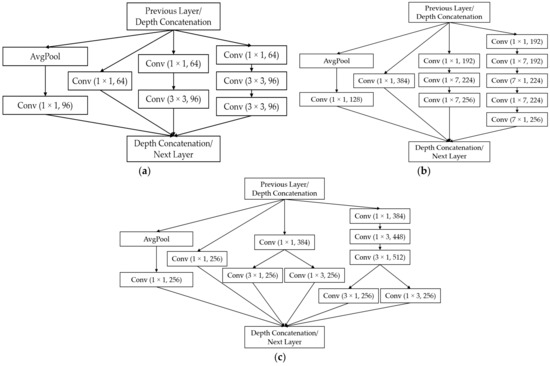
Figure 6.
Structures of the residual inception blocks in the Inception-ResNet-v2 architecture: (a) Inception-Res-A, (b) Inception-Res-B, and (c) Inception-Res-C in Figure 4c.
As shown in Figure 7, the stem block, which provides the initial set of operations before feeding the data to the inception blocks, is modified in Inception-ResNet-v2 to be more uniform with other modules. Compared to previous versions of inception networks, the Inception-ResNet-v2 architecture includes specialized reduction blocks, which are used to change the height and width of the feature map grid. These uniform designs can enable performance boosting compared to previous versions, which have similar functionalities but no specified blocks [23].
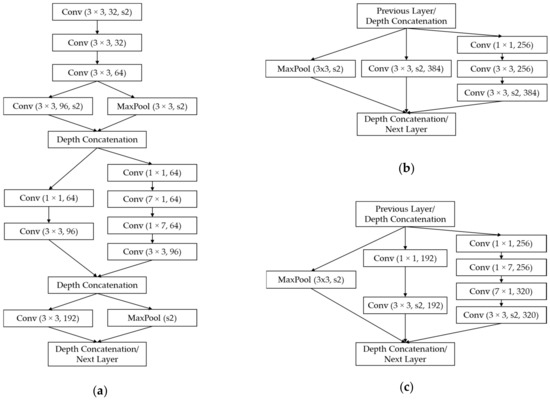
Figure 7.
Structures of other blocks in Inception-ResNet-v2 architectures: (a) Stem, (b) Reduction-A, and (c) Reduction-B in Figure 4c. “s2” denotes a stride number of 2.
The convolutional blocks are considered as the feature extractor and are followed by one fully connected layer (denoted by “Dense” in Figure 4), which plays the role of a classifier in the CNN architecture. Dropout layers are employed in all of these fully connected layers, with a 50% probability of randomly disconnecting nodes during training, and help prevent overfitting in the network training process [26].
3.5. Score-Level and Feature-Level Fusion of CNN Classifiers and the Evaluation Criterion
In this study, the performance of the proposed method was tested under cross-dataset conditions. That is, the model trained on the currency dataset was used for testing on a different dataset. To enhance the testing result, we considered not only one additional CNN classifier in the subsequence of YOLOv3 detection but also used two CNNs and applied various score-level fusions and feature-level fusions on the outputs of these two additional classifiers.
The CNN classifiers used in our study have two outputs corresponding to the probability of the input image belonging to either the fake or genuine banknote class. The output values were calculated using the softmax function, whose formula is given as follows:
where yi and pi are the activation value and the calculated class probability at the ith output of the network, respectively, and C is the number of classes. In this study, C is equal to two, namely, the fake and genuine classes. That is, the p1 and p2 of Equation (5) show the output probabilities of fake and genuine banknote classes by CNN, respectively, and the p1 and p2 have ranges from 0 to 1, respectively. As shown in Figure 1, we use two CNNs which produce a total of four output probabilities of p1~p4 (p1 and p2 from CNN-1 and p3 and p4 from CNN-2), and these four output probabilities are too many to be combined by score-level fusion. Therefore, we obtain the combined score () from p1 and p2 and the combined score () from p3 and p4 by Equations (6) and (7), where the and values have a range from −1 to 1, respectively. Finally, these two scores ( and ) are combined by various score-level fusion methods of Equations (8)–(18). Based on combined scores of Equations (8)–(18), the final classification of genuine and fake banknotes is performed.
Among the score-level fusion rules indicated above, the MIN and MAX rules with absolute values shown in Equations (9) and (11) imply the evaluation of the separation degree of the prediction probabilities of the two classes on the CNN classifiers, as the component scores of the fusion method are the differences of the prediction probabilities. The optimal weight values in Equations (12) and (13) were determined using the training set. In the weighted-PRODUCT rule, 1 is added to ensure that the base of the exponentiation is non-negative, as the score values are in the range of [−1, 1]. In the support vector machine (SVM) score-level fusion in equation (14), the performances of various kernel functions of Equations (15)–(18) were compared with the training data, and the radial basis function (RBF) kernel of Equation (16) was selected. In Equation (14), ai, yi, and b are the parameters trained using the training dataset [27].
We also used a feature-level fusion method with a three-layer neural network (NN), where we removed the last fully connected layers (dense layers) of the CNN classifiers, concatenated the activation vectors at the last pooling layers connected to the original dense layers of the two CNNs, and fed them into a three-layer NN. This NN consists of three fully connected layers, with the number of nodes in each layer being 10, 5, and 2, and the last number corresponding to the two classes as the original CNN classifiers. As a result, we can obtain the class probabilities directly from the NN-rule.
In the last step, we replaced the class detection results of YOLOv3 with the classification results of additional CNNs with fusion methods. The overall performance was evaluated using the mean average precision (mAP) criterion, with the IoU selected to be 0.5, which is widely used in object detection studies [19,28,29]. The average precision (AP) demonstrates the area under the receiver operating characteristic (ROC) curve in the graphs whose x- and y-axes are precision and recall, respectively, and the mAP value can be calculated using Equation (19) as follows:
where N is the number of queries and AvgP(q) is the average precision score for each query. That is, the mAP shows the mean value of APs calculated with all the inputs. Therefore, the mAP already has the measurement concepts of sensitivity (recall) [30], precision, and area under ROC, and it has been widely used as the performance measurement criterion in object detection and classification studies [19,20,28,29].
4. Experimental Results
4.1. Experimental Dataset
The experimental dataset used in this study consists of fake and genuine banknote images from the following three national currencies: the Euro (EUR), Korean won (KRW), and US dollar (USD). There are five denominations of EUR (EUR 5, EUR 10, EUR 20, EUR 50, and EUR 100), four of KRW (KRW 1000, KRW 5000, KRW 10,000, and KRW 50,000), and six of USD (USD 1, USD 5, USD 10, USD 20, USD 50, and USD 100). The fake banknotes were created by reproduction as follows: we used the scanner of the HP® LaserJet Pro M1536dnf multifunction printer [31], the Samsung Galaxy Note 5 [32] and Samsung Galaxy Note 10 [33] cameras to capture images on both sides of the original banknotes. Utilizing the captured images, we used the HP Color LaserJet CP4525 printer [34] to print colored banknote images on normal paper to create a reproduced banknote. Subsequently, we captured images using the aforementioned smartphone models while holding the fake and genuine banknotes in front of the cameras or placing them on surfaces to simulate the typical use scenario of banknotes. The background of the capture varied between a plain color and complex backgrounds, as shown in Figure 8, Figure 9 and Figure 10. Each type of fake banknote (smartphone-reproduced or scanner-reproduced) and genuine banknote was captured ten times individually, and in the group of three types twice, on both sides. The resulting number of images for each currency type, including EUR, KRW, and USD, were 360, 288, and 432, respectively.
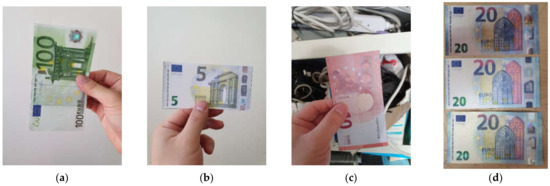
Figure 8.
Examples of EUR banknote images in the dataset: (a) genuine, (b) scanner-reproduced, (c) smartphone-reproduced, and (d) a group photo of the three types, from upper to lower: smartphone-reproduced, scanner-reproduced, and genuine.
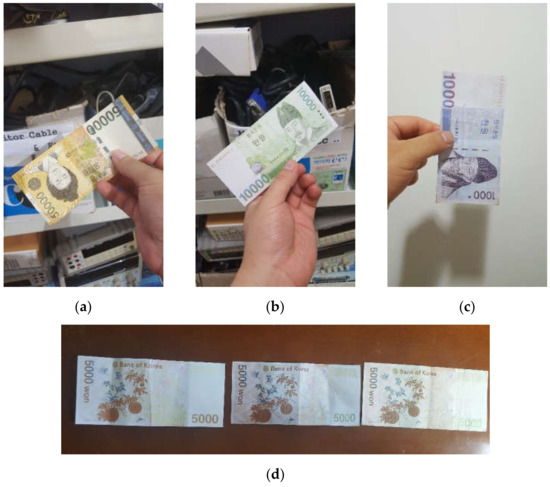
Figure 9.
Examples of KRW banknote images in the dataset: (a) genuine, (b) scanner-reproduced, (c) smartphone-reproduced, and (d) a group photo of the three types, from left to right: scanner-reproduced, smartphone-reproduced, and genuine.
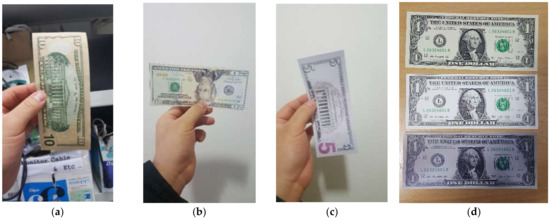
Figure 10.
Examples of USD banknote images in the dataset: (a) genuine, (b) scanner-reproduced, (c) smartphone-reproduced, and (d) a group photo of the three types, from upper to lower: genuine, scanner-reproduced, and smartphone-reproduced.
To further test the performance of our method on banknotes with a variety of qualities, we used an additional open dataset of Jordanian dinar (JOD) bill images provided in [4]. The banknote images in the original dataset consist of four denominations (JOD 1, JOD 5, JOD 10, and JOD 20) and were captured at various angles, distances, scales, illumination degrees, and conditions, such as being folded and wrinkled, resembling street quality, as shown in Figure 11. We considered these images to be genuine, printed them on normal paper, recaptured the reproduced ones, and considered these as the smartphone-reproduced banknotes, as indicated in our aforementioned dataset. The number of fake and genuine images was 180 for each class, for a total of 360 images in the JOD dataset. Examples of the images in our experimental dataset are shown in Figure 8, Figure 9, Figure 10 and Figure 11.
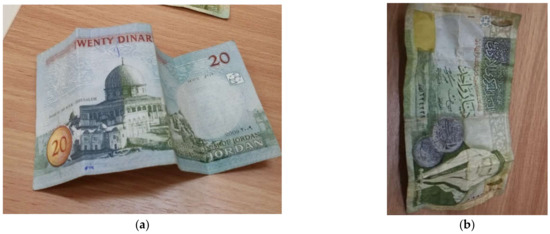
Figure 11.
Examples of JOD banknote images in the dataset: (a) genuine, (b) fake (smartphone-reproduced).
4.2. Training and Testing YOLOv3 on the Multinational Dataset
In the first experiment, we performed a four-fold cross-validation of the YOLOv3 architecture on the combined dataset of four national currencies using the original image. We randomly divided the dataset of banknote images into four equal parts, three of which were used for training and the remaining for testing. This training and testing procedure was repeated four times with alternate dataset parts.
The training and testing experiments were conducted using the Keras deep learning library [35] on a desktop computer with the following configuration: Intel® Core™ i7-3770 K CPU @ 3.50 GHz [36], 16 GB DDR3 memory, and an NVIDIA GeForce GTX 1070 graphics card (1920 CUDA cores, 8 GB GDDR5 memory) [37]. We trained the YOLOv3 model with transfer learning on pretrained weights using the MSCOCO dataset [19]. The loss graphs for the four training processes are shown in Figure 12.
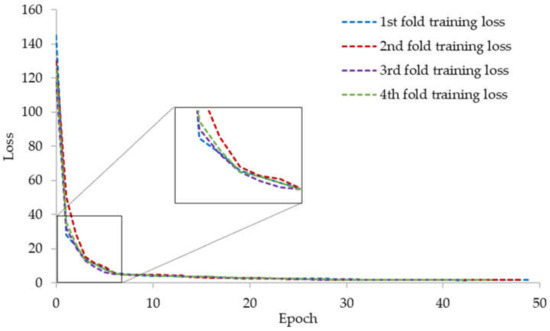
Figure 12.
Training loss of YOLOv3 on the combined multinational dataset of the four currency types.
Table 2 presents the test results of the four-fold cross-validation on the combined dataset.
Table 2.
Testing results of YOLOv3 on the combined multinational dataset. (Measure: mAP, unit: %).
As shown in Table 2, only YOLOv3 provides a good performance in terms of a high mAP value in the four-fold cross-validation condition, even with the original captured banknotes. We further tested the cross-dataset condition in subsequent experiments.
4.3. Cross-Dataset Training and Testing of YOLOv3 and CNNs
In this training and testing experiment, we used an image dataset of one currency type for training and tested the banknote images of the remaining currencies. The training process was alternately conducted on the EUR, KRW, and USD datasets; the remaining three datasets in each case were used for testing.
For the YOLOv3 training, we used retinex-filtered images of banknotes to enhance the detection result. The Adam optimizer was used for the training of YOLOv3 [38]. Transfer learning was used in these experiments.
To train the additional CNNs, we used the following three optimizers: stochastic gradient descent (SGD), Adam, and sharpness-aware minimization (SAM) [39]. We manually cropped the banknote regions in the original captured banknote images and used them as the training input. The data augmentation methods used in these training processes were based on random rotation and shifting. Figure 13, Figure 14 and Figure 15 present the loss graphs of the training process for the three CNN architectures used in this study using various optimization methods on the three national currency datasets.
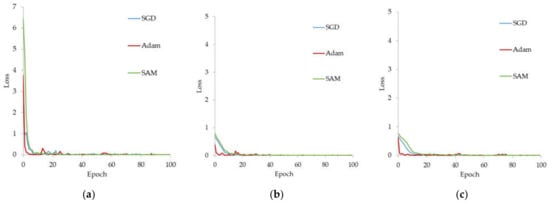
Figure 13.
Training losses of CNN classifiers on the EUR dataset with various optimization methods: (a) ResNet-18, (b) GoogleNet, and (c) Inception-ResNet-v2.
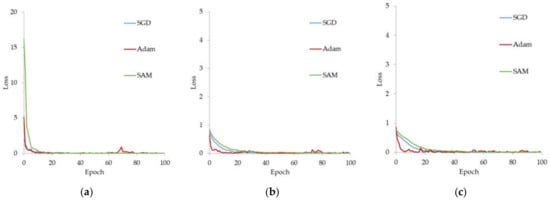
Figure 14.
Training losses of CNN classifiers on the KRW dataset with various optimization methods: (a) ResNet-18, (b) GoogleNet, and (c) Inception-ResNet-v2.
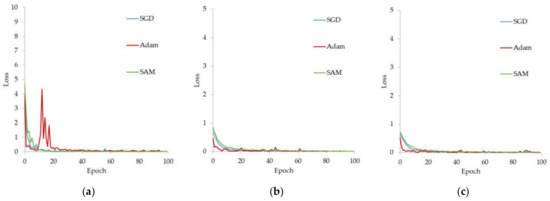
Figure 15.
Training losses of CNN classifiers on the USD dataset with various optimization methods: (a) ResNet-18, (b) GoogleNet, and (c) Inception-ResNet-v2.
Using the trained CNN models, we tested the remaining (different) datasets and compared the results. In the first comparative experiment, we used YOLOv3 and a single additional CNN classifier to select the combination that yielded the best results. Table 3, Table 4 and Table 5 present the experimental results of using YOLOv3 and a single CNN trained for each national currency dataset and tested on the remaining ones, which confirms that YOLOv3, with a single classifier, demonstrates a higher accuracy than YOLOv3, without additional classifiers.
Table 3.
Experimental results of training on EUR and testing on the other currency types using YOLOv3 and a single state-of-the-art CNN classifier. (Measure: mAP, unit: %).
Table 3.
Experimental results of training on EUR and testing on the other currency types using YOLOv3 and a single state-of-the-art CNN classifier. (Measure: mAP, unit: %).
| Additional CNN Classifier | Optimizer | KRW | USD | JOD |
|---|---|---|---|---|
| ResNet-18 [21] | SGD | 64.717 | 63.549 | 41.570 |
| Adam | 57.801 | 71.771 | 41.141 | |
| SAM | 64.413 | 65.395 | 43.749 | |
| GoogleNet [22] | SGD | 66.968 | 75.618 | 37.607 |
| Adam | 64.393 | 77.720 | 23.285 | |
| SAM | 64.050 | 72.480 | 39.006 | |
| Inception-ResNet-v2 [23] | SGD | 65.560 | 72.558 | 34.280 |
| Adam | 61.941 | 71.012 | 43.229 | |
| SAM | 65.227 | 69.133 | 41.125 | |
| YOLOv3 Only (without additional CNN) [19] | 56.713 | 60.253 | 40.769 | |
Table 4.
Experimental results of training on KRW and testing on the other currency types using YOLOv3 and single state-of-the-art CNN classifier. (Measure: mAP, unit: %).
Table 4.
Experimental results of training on KRW and testing on the other currency types using YOLOv3 and single state-of-the-art CNN classifier. (Measure: mAP, unit: %).
| Additional CNN Classifier | Optimizer | EUR | USD | JOD |
|---|---|---|---|---|
| ResNet-18 [21] | SGD | 59.022 | 61.948 | 24.553 |
| Adam | 77.471 | 50.556 | 33.103 | |
| SAM | 70.638 | 66.131 | 26.774 | |
| GoogleNet [22] | SGD | 77.695 | 58.269 | 26.811 |
| Adam | 65.954 | 49.535 | 28.661 | |
| SAM | 73.361 | 58.651 | 27.677 | |
| Inception-ResNet-v2 [23] | SGD | 65.195 | 53.242 | 21.609 |
| Adam | 65.664 | 50.478 | 24.163 | |
| SAM | 84.757 | 57.312 | 29.093 | |
| YOLOv3 Only (without additional CNN) [19] | 78.800 | 54.326 | 23.117 | |
Table 5.
Experimental results of training on USD and testing on the other currency types using YOLOv3 and single state-of-the-art CNN classifier. (Measure: mAP, unit: %).
Table 5.
Experimental results of training on USD and testing on the other currency types using YOLOv3 and single state-of-the-art CNN classifier. (Measure: mAP, unit: %).
| Additional CNN Classifier | Optimizer | KRW | EUR | JOD |
|---|---|---|---|---|
| ResNet-18 [21] | SGD | 56.219 | 45.593 | 20.481 |
| Adam | 43.454 | 36.673 | 9.489 | |
| SAM | 58.267 | 50.389 | 20.581 | |
| GoogleNet [22] | SGD | 38.775 | 33.303 | 8.604 |
| Adam | 54.066 | 52.967 | 13.382 | |
| SAM | 42.912 | 36.287 | 8.269 | |
| Inception-ResNet-v2 [23] | SGD | 37.961 | 36.996 | 8.013 |
| Adam | 53.025 | 54.588 | 15.749 | |
| SAM | 38.651 | 38.843 | 7.851 | |
| YOLOv3 Only (without additional CNN) [19] | 37.214 | 35.499 | 12.146 | |
Based on the aforementioned experimental results, for each case we selected the two combinations that yielded the best and second-best results and used these two CNN classifiers as CNN-1 and CNN-1, respectively, as shown in Figure 1. Finally, we tested the overall method with various score-level and feature-level fusion methods, as indicated in Section 3.5. The experimental results are shown in Table 6, Table 7 and Table 8, which confirm the higher accuracies of the score-level and feature-level fusion methods relative to those of the single CNN, as shown in Table 3, Table 4 and Table 5. Nevertheless, the detection accuracies for JOD were lower than those for the other currencies. This is because the image quality of the JOD banknotes was significantly lower than those of the other currencies, as shown in Figure 11, and the consequent image characteristics of JOD differ from those of other currencies.
Table 6.
Experimental results of training on EUR and testing on the other currency types using the proposed fusion methods on two additional CNN classifiers. (Measure: mAP, unit: %).
Table 7.
Experimental results of training on KRW and testing on the other currency types using the proposed fusion methods on two additional CNN classifiers. (Measure: mAP, unit: %).
Table 8.
Experimental results of training on USD and testing on the other currency types using the proposed fusion methods on two additional CNN classifiers. (Measure: mAP, unit: %).
In addition, we show the classification accuracies of genuine and fake banknotes in Table 9, which confirms that the proposed method yields accuracies higher than 70% even in the cross-dataset environment. However, the classification accuracies with JOD are lower than those for the other currencies. This is because the image quality of the JOD banknotes is significantly lower than those of the other currencies, as shown in Figure 11, and the consequent image characteristics of JOD severely differ from those of other currencies.
Table 9.
Experimental results of training on EUR, KRW, and USD, and testing on the other currency types using the proposed fusion methods on two additional CNN classifiers. (Measure: average classification accuracy, unit: %).
Even in Table 9, the classification accuracies are far from 0.9999. That is because we used different datasets for training and testing of our method (cross-dataset environment), respectively. For example, after training on the EUR dataset, we tested on the untrained dataset of USD. Since the image characteristics between cross-datasets are different, the classification accuracies are much lower than 0.9999. However, in case we used the same multinational dataset of USD, EUR, KRW, and JOD for training and testing (in detail, in each fold, 75% of the whole multinational dataset was used for training, and the remained 25% of the whole multinational dataset was used for testing), the detection accuracies of the counterfeit banknotes were almost 99.3% only by YOLOv3 without additional CNN classifiers, as shown in Table 2.
Table 10 shows the confusion matrices of classification accuracies. As shown in Table 10, except for the case of testing with JOD, all the accuracies are higher than 70%.
Table 10.
Confusion matrices of experimental results of training on EUR, KRW, and USD, and testing on the other currency types using proposed fusion methods on two additional CNN classifiers. (Measure: average classification accuracy, unit: %).
Figure 16, Figure 17 and Figure 18 present the correctly detected cases in the testing experiments that yielded the best results in Table 6, Table 7 and Table 8, which confirmed that our method can correctly detect and differentiate genuine and fake banknotes, despite banknotes having complex backgrounds, the presence of image blurring, folded banknotes, and low image quality.
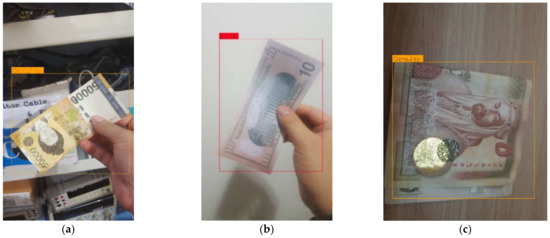
Figure 16.
Correctly detected cases of (a) genuine KRW, (b) fake USD, and (c) genuine JOD banknotes using the models trained on the EUR dataset.
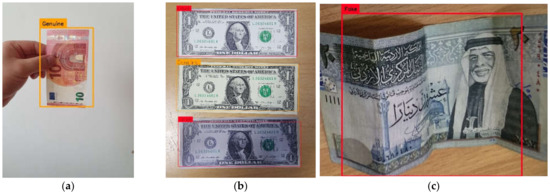
Figure 17.
Correctly detected cases of (a) a genuine EUR note; (b) (from top to bottom) scanner-reproduced fake, genuine, and smartphone-reproduced fake USD notes; and (c) a fake JOD note using the models trained on the KRW dataset.
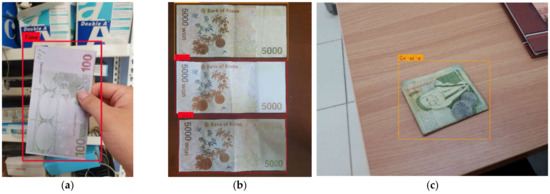
Figure 18.
Correctly detected cases of (a) a fake EUR note; (b) (from top to bottom) genuine and two fake KRW notes; and (c) a genuine JOD note using the models trained on the USD dataset.
Figure 19, Figure 20 and Figure 21 present the error cases in the testing experiments that yielded the best results in Table 6, Table 7 and Table 8.
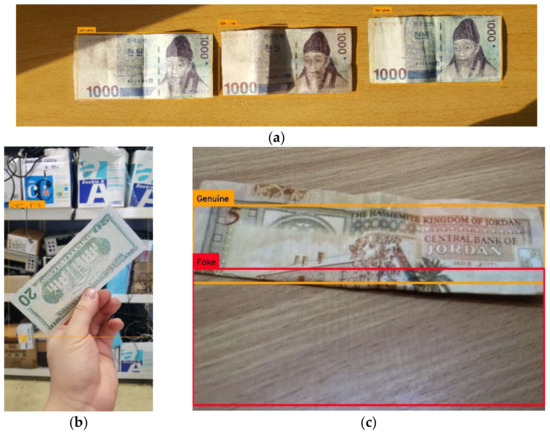
Figure 19.
Error cases of (a) KRW, (b) USD, and (c) JOD banknote images using the models trained on the EUR dataset for detection.
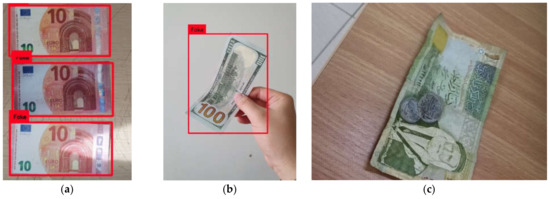
Figure 20.
Error cases of (a) EUR, (b) USD, and (c) JOD banknote images using the models trained on the KRW dataset for detection.
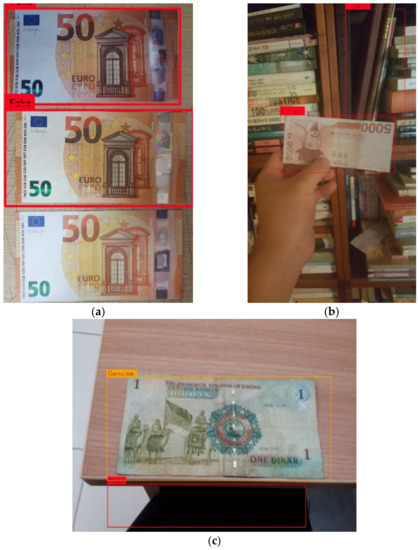
Figure 21.
Error cases of (a) EUR, (b) KRW, and (c) JOD banknote images using the models trained on the USD dataset for detection.
Only the far-right banknote is a genuine banknote in Figure 19a; however, all three banknotes were incorrectly detected as genuine. The USD banknote in Figure 19b is actually a fake banknote; however, it was misclassified as genuine. As shown in Figure 19c, multiple bounding boxes were detected; however, only one banknote is presented in the image. In addition, the fake JOD note here was misclassified as being genuine. These errors were caused by nonuniform illumination, rotated banknotes, as well as folded and dirty banknotes.
The genuine EUR and USD banknotes shown in the uppermost position of Figure 20a,b, respectively, were misclassified as fake banknotes. As shown in Figure 20c, no bounding box was detected although there is a banknote in the image. These errors were caused by non-uniform illumination, rotated banknotes, as well as occluded and dirty banknotes.
In Figure 21a, not only was the lowermost banknote not detected, but the genuine banknote in the middle was also misclassified as a fake banknote. In the image shown in Figure 21b, although the fake banknote was correctly detected, an additional non-banknote bounding box was detected in the background. A similar case was observed for the genuine JOD banknote in Figure 21c. These errors were caused by complex backgrounds.
4.4. Discussion
As shown in Figure 1 and Figure 2, it is difficult to know the factors of affine transformation in the captured banknote image and the detected banknote region by YOLOv3 in advance. Therefore, the detected banknote region is directly inputted to the additional two CNNs for the final classification of genuine and fake banknotes. In order to measure the detection accuracies of counterfeit banknotes according to the factors of affine transformation, we should artificially generate the image by translation, in-plane rotation, scaling, and sheering [40]. However, these transformations produce non-real images because the additional pixel interpolations should be performed after all the transformations except for translation [41], and experimental results with these transformed images cannot reflect the actual detection accuracies of counterfeit banknotes in real-world applications (collected by actual cameras). Even in the case that we generate images according to the various factors of uneven lighting, low resolution, etc., this artificial generation makes non-real images because additional pixel interpolation and artificial changes to pixel values should be performed [41], and experimental results with these images cannot reflect the actual detection accuracies of counterfeit banknotes in real-world applications, either.
However, as shown in Figure 8, Figure 9, Figure 10, Figure 11, Figure 16, Figure 17, Figure 18, Figure 19, Figure 20, and Figure 21, our experimental images were captured in natural user environments, including complex backgrounds, various time and places, illuminations, resolutions, and distances, etc. Therefore, they already include the various factors of translation, in-plane and out-plane rotation, scaling, sheering, and warping of banknotes, which corresponds to perspective transformation. Perspective transformation includes more transformation factors than affine transformation which includes only translation, in-plane rotation, scaling, and sheering [40]. In addition, they already include the various factors of uneven lighting, low resolution, occlusions, etc. Therefore, we confirm that our experimental results in Table 2, Table 3, Table 4, Table 5, Table 6, Table 7, Table 8 and Table 9 were obtained with the banknote images collected by various perspective transformations and factors in real-world applications. Although our experimental data were collected in natural user environments, there is no case of overlapping multiple banknotes and this will be evaluated in future work.
As the next experiment, for analyzing the classification features extracted by the proposed networks for genuine and fake banknotes, we adopted the class activation map (CAM) technique [42]. In Figure 22, we show the visualized CAMs for correctly classified genuine, smartphone-reproduced, and scanner-reproduced fake EUR 100 banknotes captured from the front side, using the Inception-ResNet-v2 model trained on the KRW dataset. The average activation map was calculated at each stage of the network architecture, scaled, and shown on the banknote regions cropped from the bounding boxes detected by YOLOv3 in pseudo-color scheme, with maximum and minimum values denoted by red and blue colors, respectively. Consequently, the image regions superimposed by closed-to-red colors represents the important features extracted by the CNN classifiers.
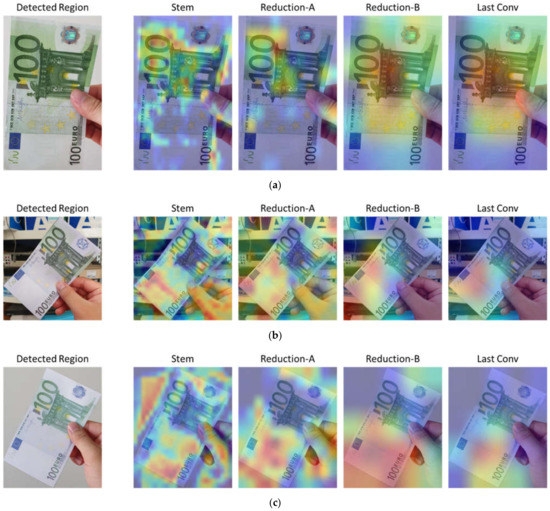
Figure 22.
Visualization of CAM at Stem, Reduction-A, Reduction-B, and the last convolutional layers (Figure 4c) of the correctly classified EUR banknotes using Inception-ResNet-v2 trained on the KRW dataset: (a) genuine, (b) smartphone-reproduced fake, and (c) scanner-reproduced fake.
As shown in Figure 22a, in the case of genuine banknotes, the higher activation values on genuine banknotes are focused on the texture areas containing structures such as building and number patterns, whereas on the fake banknotes of Figure 22b,c, the regions with less patterning (blank areas, including watermarks) are more activated. That is because the invisible noises produced in the smartphone- and scanner-reproduced fake banknote images can be more precisely extracted by our model in the blank area than in the textured areas due to the complicated patterns of texture area and these noises can act as key features for distinguishing the fake banknotes. In addition, according to the depth of the network, the unwanted regions become more unimportant for the classification task, and the high activation values become more of a focus on the inside regions of banknotes, as shown in the figures from left to right in Figure 22.
5. Conclusions
In this study, we have proposed a deep learning-based method for detecting multinational fake banknotes using smartphone cameras in a cross-dataset environment. This is the first study of multinational fake banknote detection using a smartphone camera in a cross-dataset environment. In this study, we have proposed a two-stage classification model that includes a YOLOv3-based detector and an additional CNN classifier. The input images for the detector were retinex-filtered images, which helped enhance the detection result. To further enhance the overall detection results, we proposed a model with various scores and feature-lever fusion methods. In our study, multinational and cross-dataset environments were considered to confirm the generality of the proposed model without retraining; furthermore, to enhance the generality, SAM optimization was also adopted for the training of our model.
Experimental results for the self-collected multinational genuine and fake datasets of the USD, EUR, KRW, and JOD banknotes confirm that our method demonstrates higher detection accuracies than those of conventional YOLOv3 or YOLOv3 with state-of-the-art CNN. Nevertheless, the detection errors incurred by our method occur in cases of non-uniform illumination, rotated banknotes, folded and dirty banknotes, occluded and dirty banknotes, and banknotes with complex backgrounds. In addition, the detection accuracies of JOD banknotes using our method are lower than those of other currencies. This is because the image quality of the JOD notes was significantly lower than those of other currencies, and the consequent image characteristics of JOD are different from those of the other currencies.
Although we could not evaluate the limit of our method as to how much of the banknote can be obscured, we can estimate that severe occlusions by hand can cause false rejection. In future work, we would measure performance degradation with the database, including severe occlusions by hand. In addition, we would investigate a method for enhancing the accuracies in the cases of non-uniform illumination, rotated banknotes, folded and dirty banknotes, occluded and dirty banknotes, and banknotes with complex backgrounds. We already used data augmentation methods in the training processes based on random rotation and shifting. Therefore, our trained model can cope with the cases of oriented banknote images captured in the natural user environments of Figure 8, Figure 9, Figure 10, Figure 11, Figure 16, Figure 17, Figure 18, Figure 19, Figure 20, and Figure 21. However, the accuracy of our method can be degraded with more banknote images including severe rotation, even with data augmentation based on random rotation in the training processes. In future work, we would look to make the method robust with respect to severe rotation based on orientation compensation or the features invariant to orientation. In addition, we would research a method for solving the problem of different image characteristics on testing data compared to training data. In detail, we would research the method of enhancing the classification accuracy close to 99.99% by using the image transformation method between different currencies based on various generative adversarial networks. In addition, we would research the method of extracting the features for counterfeit banknote classification, which are not dependent on the types of currencies, and we would consider how results vary with various types of smartphones produced by different companies.
Author Contributions
Methodology, T.D.P.; conceptualization, Y.W.L.; validation, C.P.; supervision, K.R.P.; writing—original draft, T.D.P.; writing—review and editing, K.R.P. All authors have read and agreed to the published version of the manuscript.
Funding
This research was supported in part by the National Research Foundation of Korea (NRF) funded by the Ministry of Science and ICT (MSIT) through the Basic Science Research Program (NRF-2021R1F1A1045587), in part by the NRF funded by the MSIT through the Basic Science Research Program (NRF-2020R1A2C1006179), and in part by the MSIT, Korea, under the ITRC (Information Technology Research Center) support program (IITP-2022-2020-0-01789) supervised by the IITP (Institute for Information & Communications Technology Planning & Evaluation).
Institutional Review Board Statement
Not applicable.
Informed Consent Statement
Not applicable.
Data Availability Statement
Not applicable.
Conflicts of Interest
The authors declare no conflict of interest.
References
- Lee, J.W.; Hong, H.G.; Kim, K.W.; Park, K.R. A Survey on Banknote Recognition Methods by Various Sensors. Sensors 2017, 17, 313. [Google Scholar] [CrossRef] [PubMed] [Green Version]
- Multinational Fake Banknote Detection Model and Algorithm in Cross-Dataset Environment. Available online: http://dm.dgu.edu/link.html (accessed on 25 February 2022).
- Da Costa, C.M.C. Multiview Banknote Recognition with Component and Shape Analysis. Available online: https://www.researchgate.net/publication/260392128_Multiview_banknote_recognition_with_component_and_shape_analysis (accessed on 25 March 2022).
- Doush, I.A.; Sahar, A.-B. Currency recognition using a smartphone: Comparison between color SIFT and gray scale SIFT algorithms. J. King Saud Univ. Comput. Inform. Sci. 2017, 29, 484–492. [Google Scholar]
- Hasanuzzaman, F.M.; Yang, X.; Tian, Y. Robust and effective component-based banknote recognition for the blind. IEEE Trans. Syst. Man Cybern. C Appl. Rev. 2012, 42, 1021–1030. [Google Scholar] [CrossRef] [PubMed] [Green Version]
- Zhang, Q.; Yan, W.Q. Currency Detection and Recognition Based on Deep Learning. In Proceedings of the 15th IEEE International Conference on Advanced Video and Signal Based Surveillance, Auckland, New Zealand, 27–30 November 2018. [Google Scholar]
- Joshi, R.C.; Yadav, S.; Dutta, M.K. YOLO-v3 Based Currency Detection and Recognition System for Visually Impaired Persons. In Proceedings of the International Conference on Contemporary Computing and Applications, Lucknow, India, 5–7 February 2020. [Google Scholar]
- Chae, S.-H.; Kim, J.K.; Pan, S.B. A Study on the Korean Banknote Recognition Using RGB and UV Information. In Proceedings of the International Conference on Communication and Networking, Jeju Island, Korea, 10–12 December 2009. [Google Scholar]
- Baek, S.; Choi, E.; Baek, Y.; Lee, C. Detection of counterfeit banknotes using multispectral images. Digit. Signal Process. 2018, 78, 294–304. [Google Scholar] [CrossRef]
- Han, M.; Kim, J. Joint banknote recognition and counterfeit detection using explainable artificial intelligence. Sensors 2019, 19, 3607. [Google Scholar] [CrossRef] [Green Version]
- Bhavani, R.; Karthikeyan, A. A Novel Method for Counterfeit Banknote Detection. Int. J. Comput. Sci. Eng. 2014, 2, 165–167. [Google Scholar]
- Yeh, C.-Y.; Su, W.-P.; Lee, S.-J. Employing multiple-kernel support vector machines for counterfeit banknote recognition. Appl. Soft Comput. 2011, 11, 1439–1447. [Google Scholar] [CrossRef]
- Pham, T.D.; Park, C.; Nguyen, D.T.; Batchuluun, G.; Park, K.R. Deep learning-based fake-banknote detection for the visually impaired people using visible-light images captured by smartphone cameras. IEEE Access 2020, 8, 63144–63161. [Google Scholar] [CrossRef]
- Park, C.; Cho, S.W.; Baek, N.R.; Choi, J.; Park, K.R. Deep feature-based three-stage detection of banknotes and coins for assisting visually impaired people. IEEE Access 2020, 8, 184598–184613. [Google Scholar] [CrossRef]
- Wageeh, Y.; Mohamed, H.E.-D.; Fadl, A.; Anas, O.; ElMasry, N.; Nabil, A.; Atia, A. YOLO fish detection with Euclidean tracking in fish farms. J. Ambient Intell. Humaniz. Comput. 2021, 12, 5–12. [Google Scholar] [CrossRef]
- Qu, H.; Yuan, T.; Sheng, Z.; Zhang, Y. A Pedestrian Detection Method Based on YOLOv3 Model and Image Enhanced by Retinex. In Proceedings of the 11th International Congress on Image and Signal Processing, BioMedical Engineering and Informatics, Beijing, China, 13–15 October 2018. [Google Scholar]
- Parthasarathy, S.; Sankaran, P. An Automated Multi Scale Retinex with Color Restoration for Image Enhancement. In Proceedings of the National Conference on Communications, Kharagpur, India, 3–5 February 2012. [Google Scholar]
- Land, E.H.; McCann, J.J. Lightness and retinex theory. J. Opt. Soc. Am. 1971, 61, 1–11. [Google Scholar] [CrossRef] [PubMed]
- Redmon, J.; Farhadi, A. YOLOv3: An incremental improvement. arXiv 2018, arXiv:1804.02767. [Google Scholar]
- Redmon, J.; Divvala, S.; Girshick, R.; Farhadi, A. You only look once: Unified, real-time object detection. arXiv 2016, arXiv:1506.02640. [Google Scholar]
- He, K.; Zhang, X.; Ren, S.; Sun, J. Deep Residual Learning for Image Recognition. In Proceedings of the IEEE Conference on Computer Vision and Pattern Recognition, Las Vegas, NV, USA, 27–30 June 2016. [Google Scholar]
- Szegedy, C.; Liu, W.; Jia, Y.; Sermanet, P.; Reed, S.; Anguelov, D.; Erhan, D.; Vanhoucke, V.; Rabinovich, A. Going Deeper with Convolutions. In Proceedings of the IEEE Conference on Computer Vision and Pattern Recognition, Boston, MA, USA, 7–12 June 2015. [Google Scholar]
- Szegedy, C.; Ioffe, S.; Vanhoucke, V.; Alemi, A. Inception-v4, Inception-ResNet and the impact of residual connections on learning. arXiv 2016, arXiv:1602.07261. [Google Scholar]
- Ioffe, S.; Szegedy, C. Batch normalization: Accelerating deep network training by reducing internal covariate shift. arXiv 2015, arXiv:1502.03167. [Google Scholar]
- Szegedy, C.; Vanhoucke, V.; Ioffe, S.; Shlens, J.; Wojna, Z. Rethinking the Inception Architecture for Computer Vision. In Proceedings of the IEEE Conference on Computer Vision and Pattern Recognition, Las Vegas, NV, USA, 27–30 June 2016. [Google Scholar]
- Srivastava, N.; Hinton, G.; Krizhevsky, A.; Sutskever, I.; Salakhutdinov, R. Dropout: A simple way to prevent neural networks from overfitting. J. Mach. Learn. Res. 2014, 15, 1929–1958. [Google Scholar]
- Koo, J.H.; Cho, S.W.; Baek, N.R.; Park, K.R. Multimodal human recognition in significantly low illumination environment using modified EnlightenGAN. Mathematics 2021, 9, 1934. [Google Scholar] [CrossRef]
- Kang, J.K.; Hoang, T.M.; Park, K.R. Person re-identification between visible and thermal camera images based on deep residual CNN using single input. IEEE Access 2019, 7, 57972–57984. [Google Scholar] [CrossRef]
- Hossin, M.; Sulaiman, M.N. A review on evaluation metrics for data classification evaluations. Int. J. Data Min. Knowl. Manag. Process 2015, 5, 1–11. [Google Scholar]
- Sensitivity and Specificity. Available online: https://en.wikipedia.org/wiki/Sensitivity_and_specificity (accessed on 27 April 2022).
- HP LaserJet Pro M1536dnf Multifunction Printer Software and Driver Downloads | HP® Customer Support. Available online: https://support.hp.com/us-en/drivers/selfservice/hp-laserjet-pro-m1536dnf-multifunction-printer/3974271/model/3974278 (accessed on 25 February 2022).
- Samsung Galaxy Note5. Available online: http://www.samsung.com/global/galaxy/galaxy-note5 (accessed on 25 February 2022).
- Samsung Galaxy Note10 & Note10+ 5G | Official Samsung Galaxy Site. Available online: https://www.samsung.com/global/galaxy/galaxy-note10 (accessed on 25 February 2022).
- HP Color LaserJet Enterprise CP4525 Printer Series Software and Driver Downloads | HP® Customer Support. Available online: https://support.hp.com/us-en/drivers/selfservice/hp-color-laserjet-enterprise-cp4525-printer-series/3965798 (accessed on 25 February 2022).
- Keras: The Python Deep Learning API. Available online: https://keras.io (accessed on 25 February 2022).
- Intel® CoreTM I7-3770K Processor (8 M Cache, Up to 3.90 GHz) Product Specifications. Available online: https://ark.intel.com/products/65523/Intel-Core-i7-3770K-Processor-8M-Cache-up-to-3_90-GHz (accessed on 25 February 2022).
- Introducing the GeForce GTX 1070Ti Graphics Card: Gaming Perfected. Available online: https://www.nvidia.com/en-us/geforce/products/10series/geforce-gtx-1070-ti (accessed on 25 February 2022).
- Kingma, D.P.; Ba, J. Adam: A method for stochastic optimization. arXiv 2017, arXiv:1412.6980. [Google Scholar]
- Foret, P.; Kleiner, A.; Mobahi, H.; Neyshabur, B. Sharpness-aware minimization for efficiently improving generalization. arXiv 2021, arXiv:2010.01412. [Google Scholar]
- Richard, H.; Andrew, Z. Multiple View Geometry in Computer Vision; Cambridge University Press: Cambridge, UK, 2000. [Google Scholar]
- Gonzalez, R.C.; Woods, R.E. Digital Image Processing, 3rd ed.; Pearson: Upper Saddle River, NJ, USA, 2008. [Google Scholar]
- Zhou, B.; Khosla, A.; Lapedriza, A.; Oliva, A.; Torralba, A. Learning deep features for discriminative localization. In Proceedings of the IEEE Conference on Computer Vision and Pattern Recognition, Las Vegas, NV, USA, 27–30 June 2016; pp. 2921–2929. [Google Scholar]
Publisher’s Note: MDPI stays neutral with regard to jurisdictional claims in published maps and institutional affiliations. |
© 2022 by the authors. Licensee MDPI, Basel, Switzerland. This article is an open access article distributed under the terms and conditions of the Creative Commons Attribution (CC BY) license (https://creativecommons.org/licenses/by/4.0/).