
Stochastic Neural Networks-Based Algorithmic Trading for the Cryptocurrency Market

 ,
,  , ,
, ,  and
and 
Abstract
:1. Introduction
1.1. Motivation
1.2. Contribution
- We propose a technique to embed future prices in current statistical-based trading algorithms
- We use stochastic neural networks based on price prediction, which is then pipelined with proposed trading algorithms.
- We present mechanisms for integrating price prediction from stochastic neural networks with well-known trading algorithms.
1.3. Organization
2. Related Work
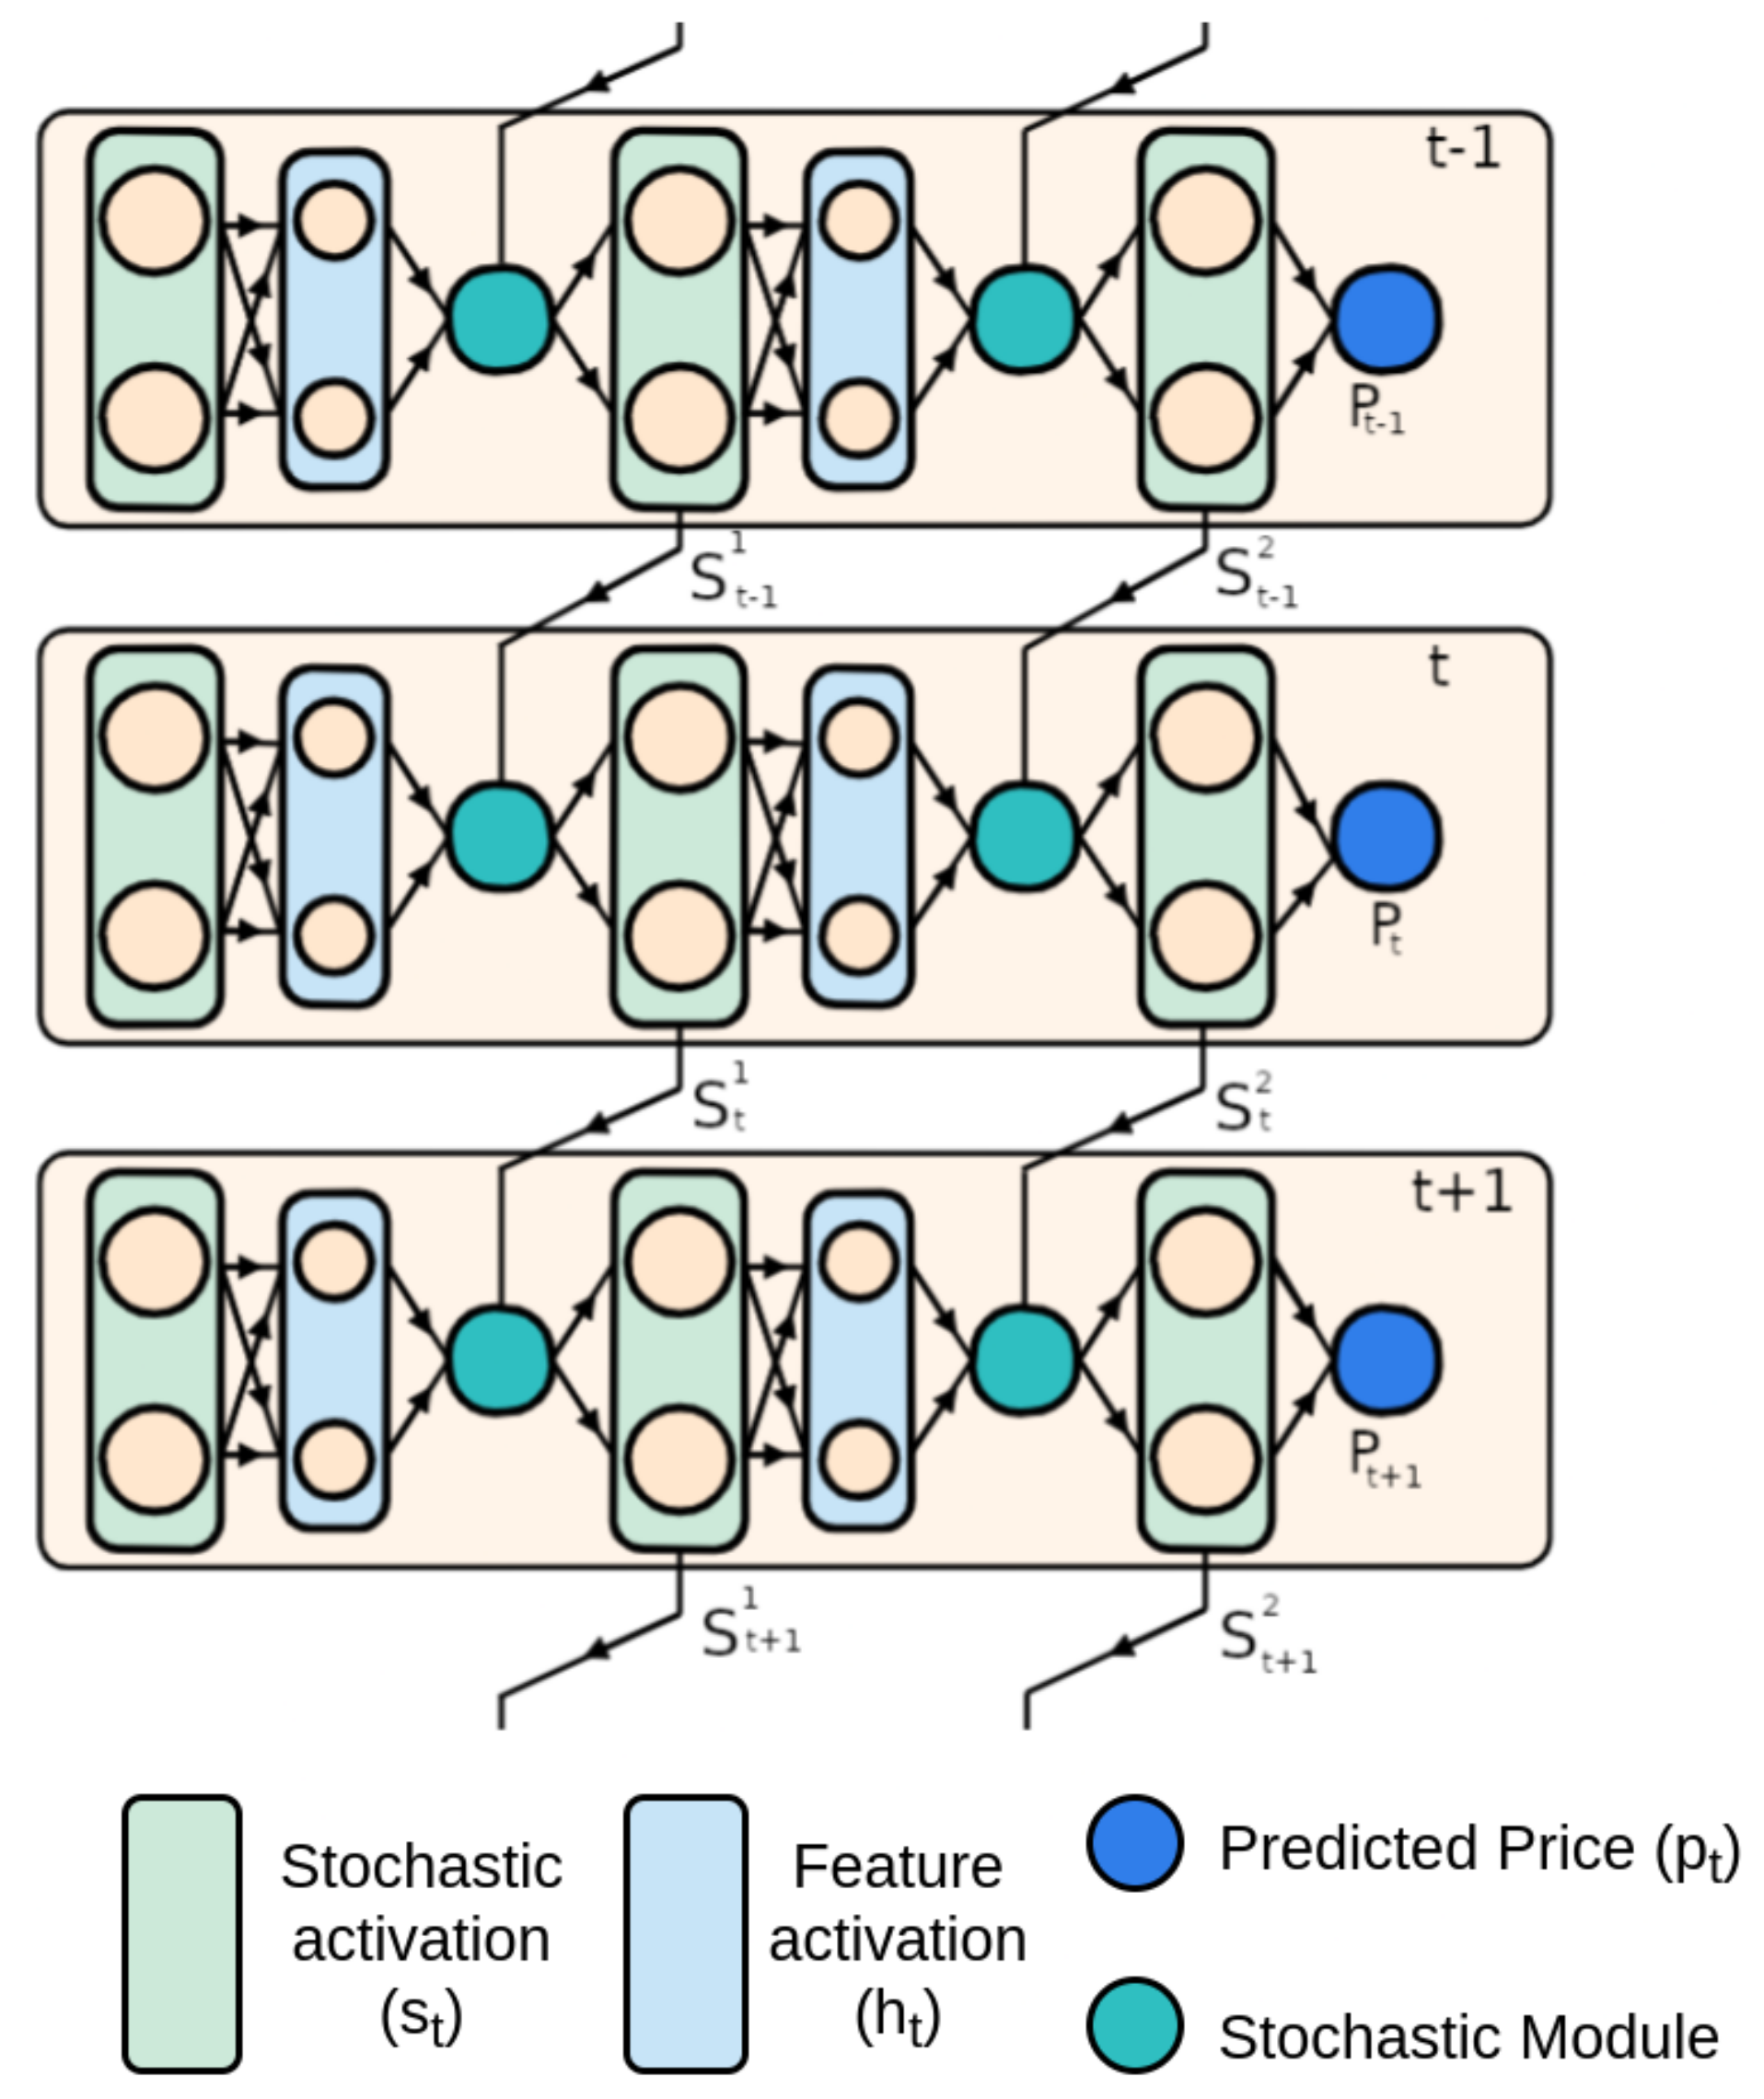
3. Background: Stochastic Neural Networks
3.1. The Need for Stochasticity
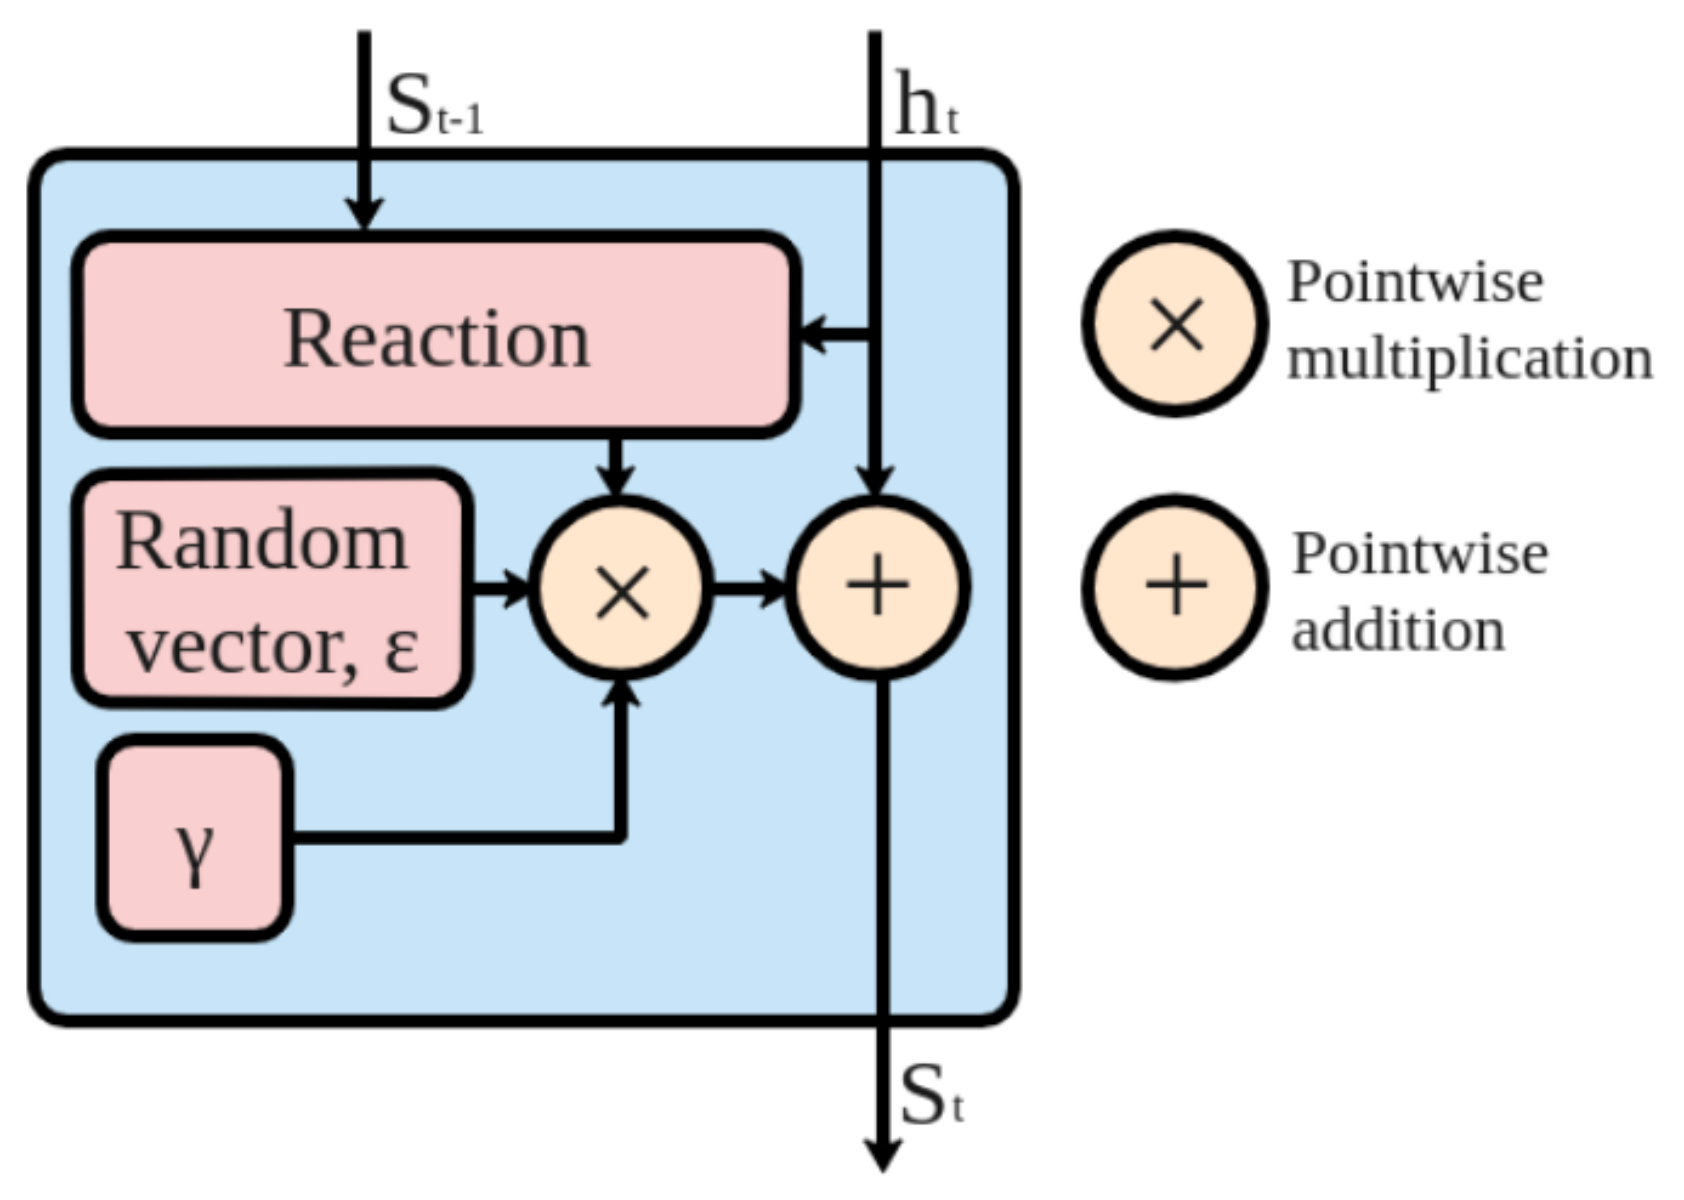
3.2. Stochasticity in Neural Networks
| Algorithm 1 Forward propagation in a stochastic neural network. |
| Input:X, Market indicators and cryptocurrencies data. |
| Input: Model architecture having l hidden layers. |
| Input: Trained , , . |
| Output:, . |
| Forward Propagation: |
| for to n do |
| for to l do |
| r ← random variable vector, |
| = + × r ⊙(,) |
| end for |
| Predicted price |
| end for |
4. Algorithmic Trading
4.1. Bollinger Bands
| Algorithm 2 Bollinger Bands using stochastic neural networks. |
| Input:P, Predicted price of the next day using stochastic neural networks |
| Input:SMAn, SMA of prices for past n days. |
| Input:UBB, Upper Bollinger Band. |
| Input:LBB, Lower Bollinger Band. |
| Output: Buy and sell signals |
| ifthen |
| if then |
| Generate Buy Signal |
| end if |
| else |
| if then |
| Generate Sell Signal |
| end if |
| end if |
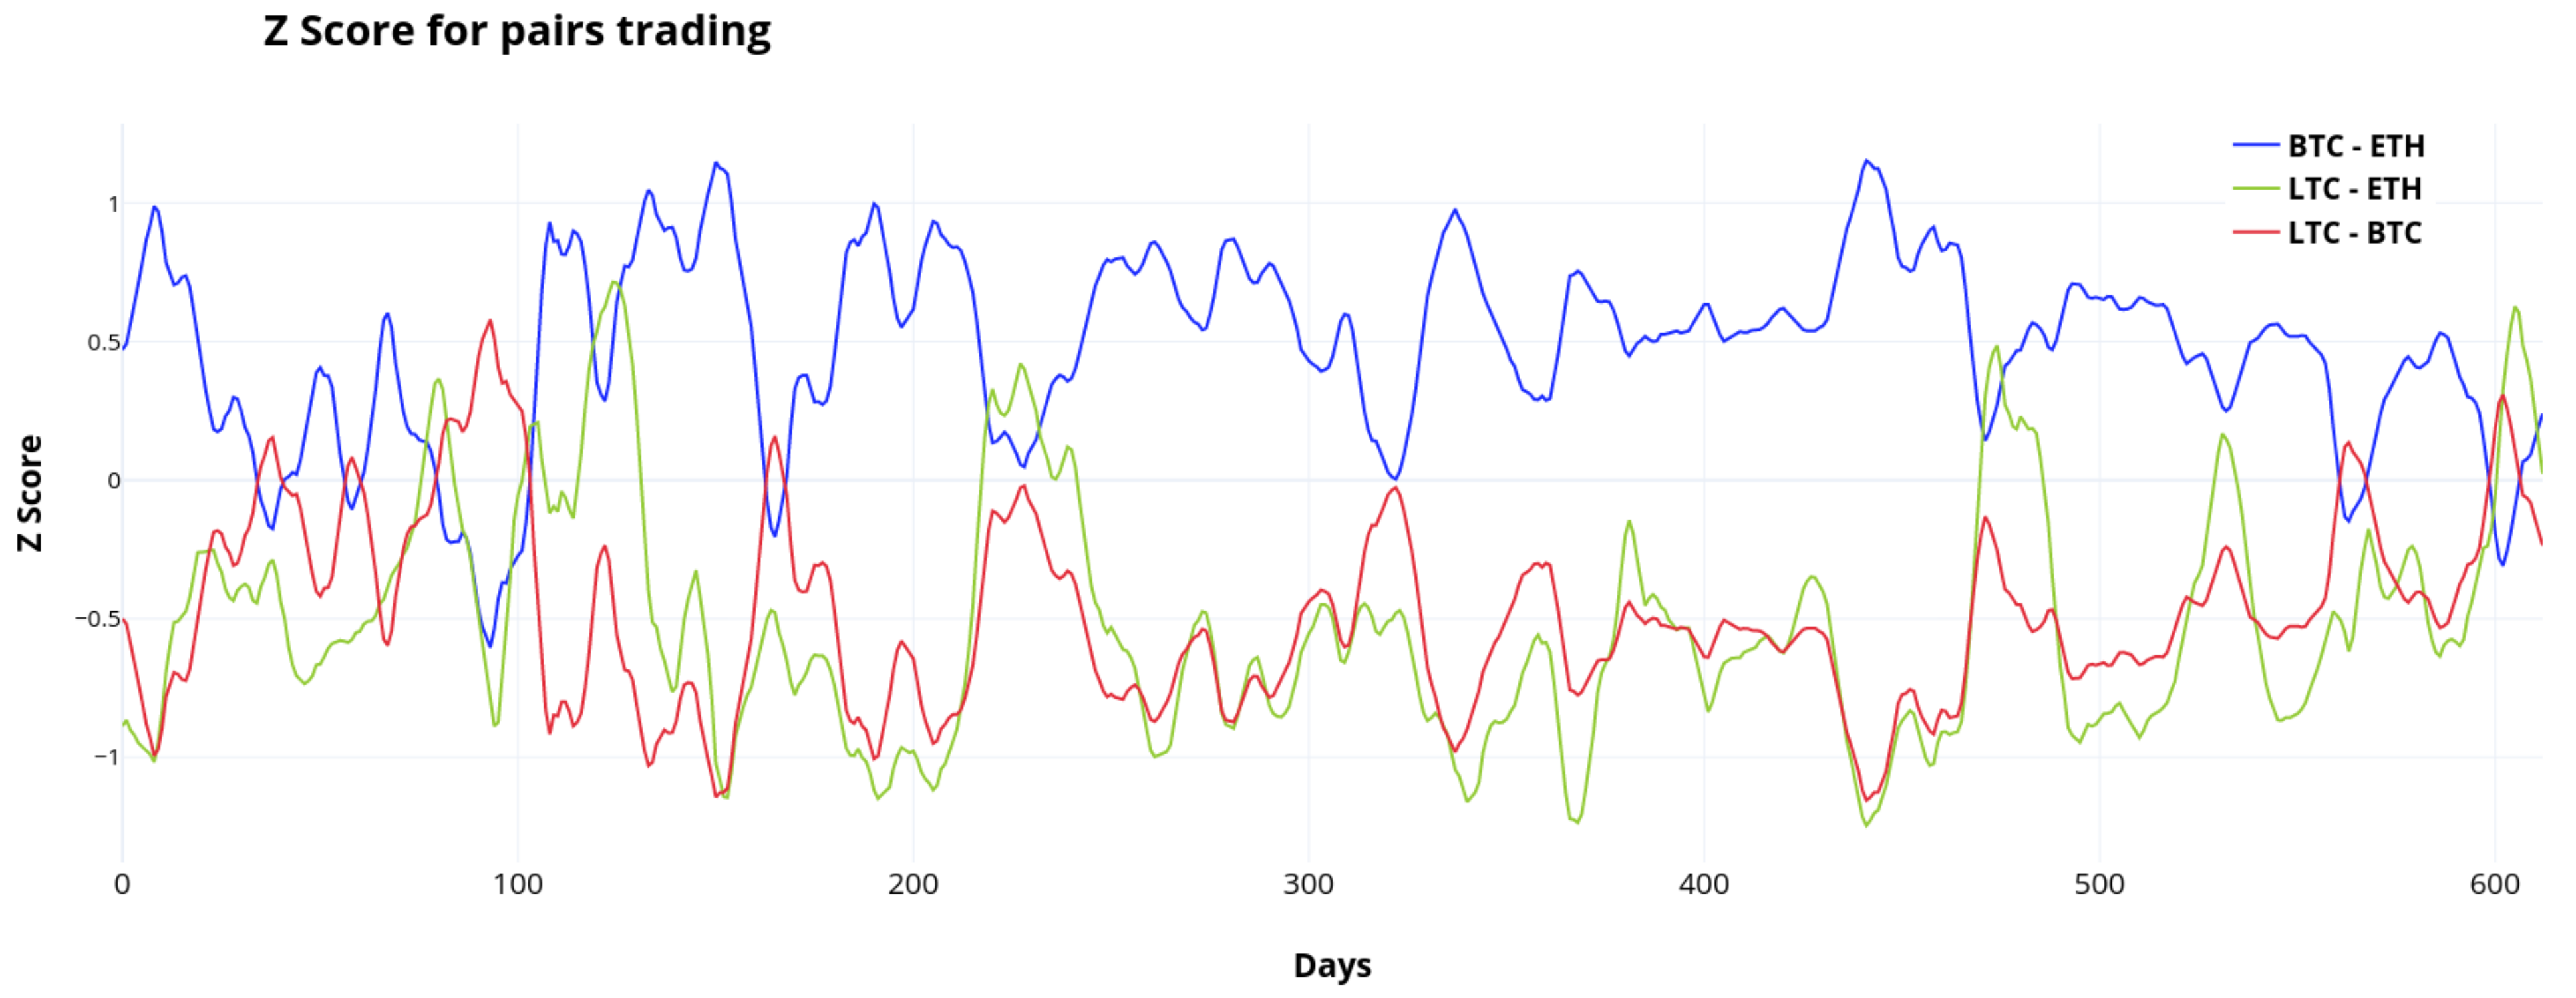
4.2. Pairs Trading
| Algorithm 3 Pairs trading using stochastic neural networks. |
| Input:date, date to calculate z score for. |
| Input:, 30 days and , 5 days prices for X currency. |
| Input:, 30 days and , 5 days prices for Y currency. |
| Input: Stochastic neural networks trained on currencies X and Y. |
| Obtain predictions: |
| , |
| , |
| Calculate metrics: |
| Decision making: |
| if then |
| Go short currency on Y and long on X. |
| end if |
| if then |
| Go short currency on X and long on Y. |
| end if |
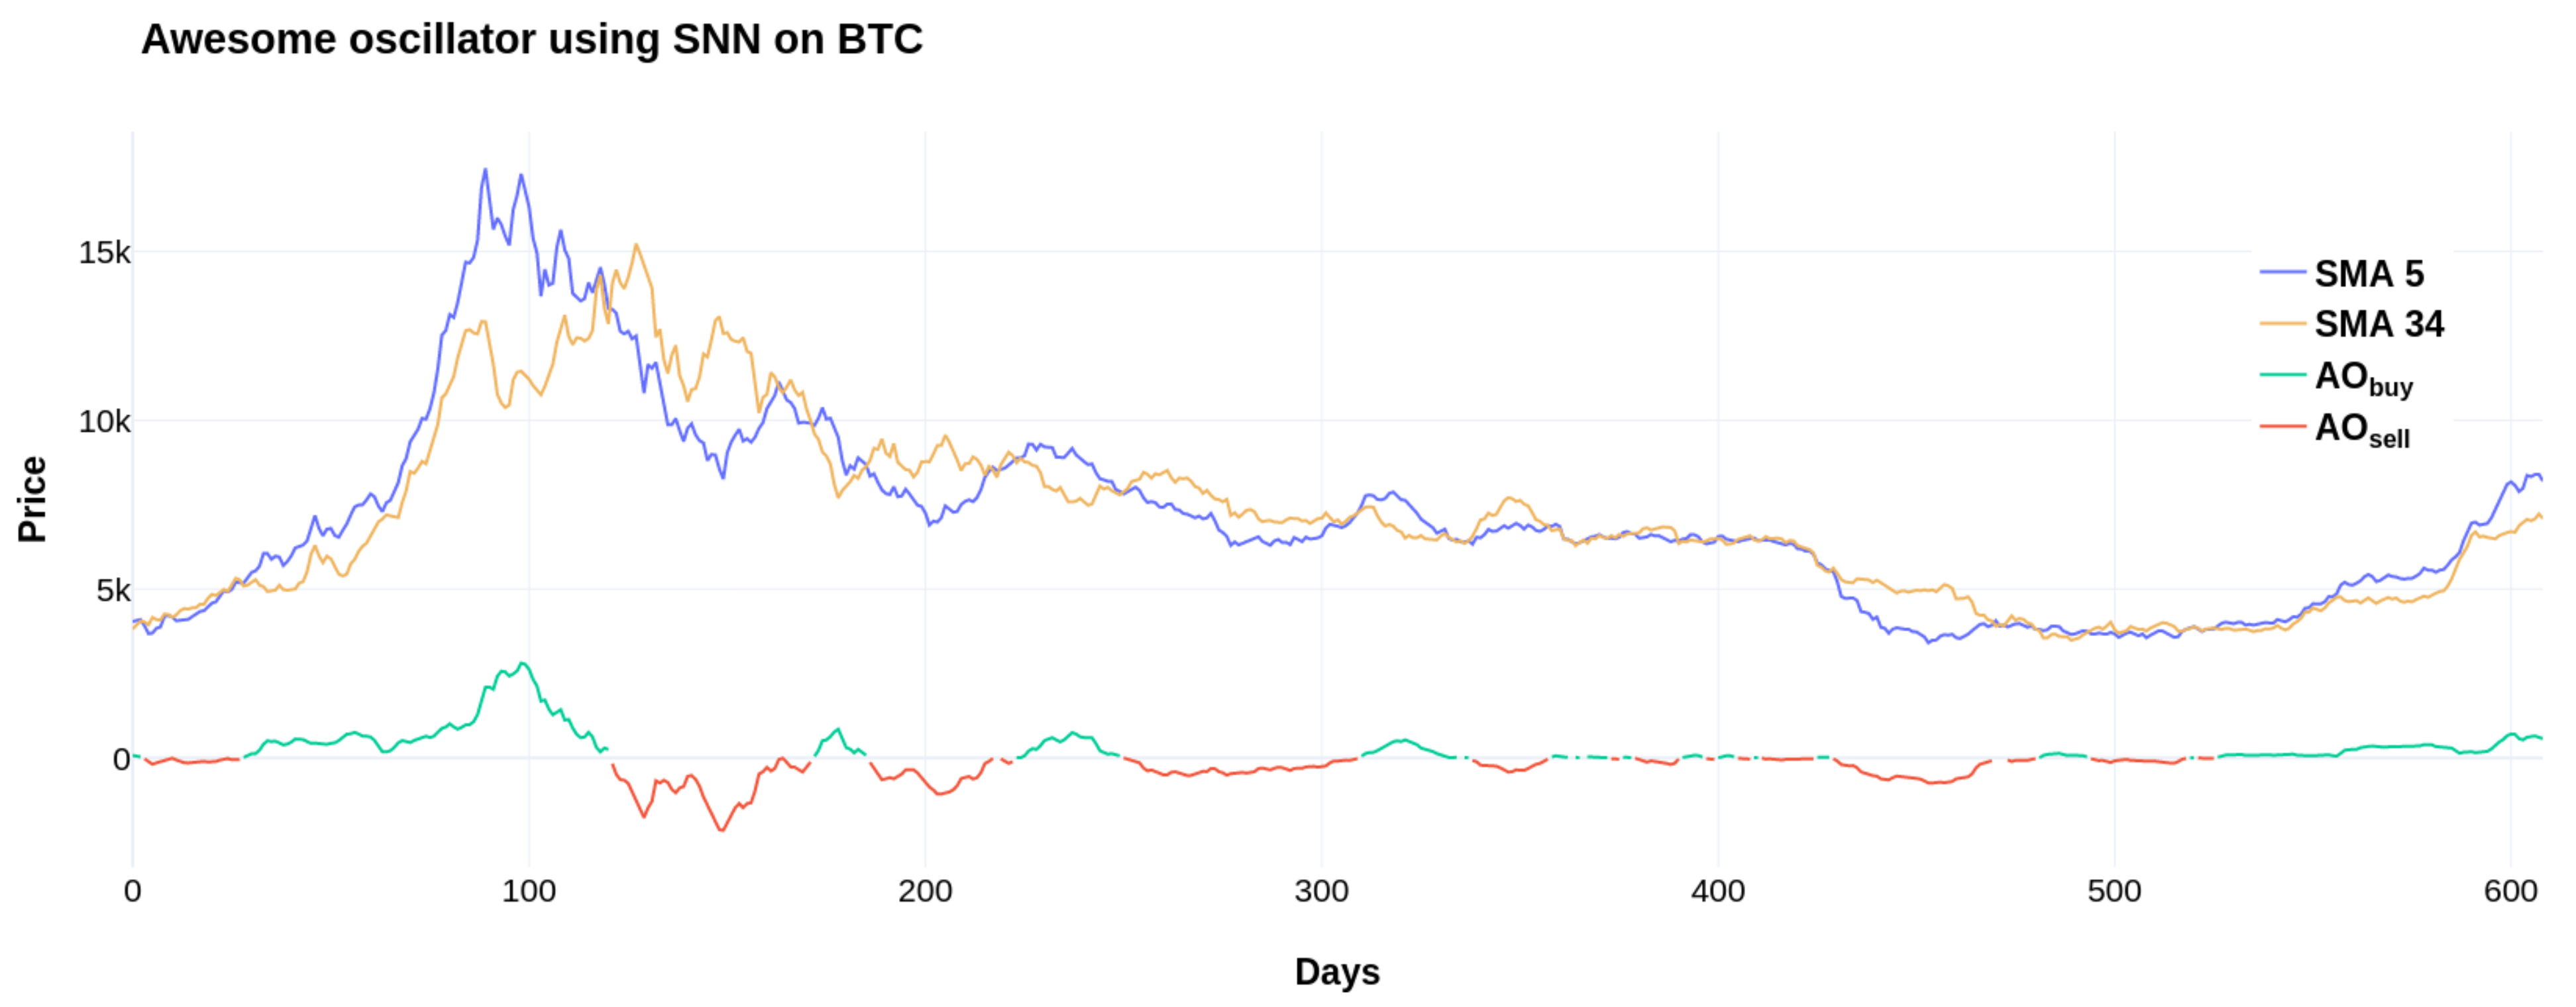
4.3. Awesome Oscillator
| Algorithm 4 Awesome Oscillator using stochastic neural networks. |
| Input:Ppred, Predicted price of the next day using stochastic neural networks |
| Input:, Previous day AO value |
| Input:, 5-day simple moving average |
| Input:, 34-day simple moving average |
| Output: Buy and sell signals |
| if then |
| Generate Buy Signal |
| end if |
| if then |
| Generate Sell Signal |
| end if |
5. Backtesting Results
5.1. Price Prediction Using Stochastic Neural Networks
5.2. Investment Strategy
6. Conclusions
Author Contributions
Funding
Institutional Review Board Statement
Informed Consent Statement
Data Availability Statement
Acknowledgments
Conflicts of Interest
References
- Messina, I. The Effects of Chavez’s Populism on Today’s Venezuela. Perceptions 2019, 5, 1–5. [Google Scholar] [CrossRef]
- Vora, J.; Nayyar, A.; Tanwar, S.; Tyagi, S.; Kumar, N.; Obaidat, M.S.; Rodrigues, J.J.P.C. BHEEM: A Blockchain-Based Framework for Securing Electronic Health Records. In Proceedings of the 2018 IEEE Globecom Workshops (GC Wkshps), Abu Dhabi, United Arab Emirates, 9–13 December 2018; pp. 1–6. [Google Scholar]
- Mehta, P.; Gupta, R.; Tanwar, S. Blockchain envisioned UAV networks: Challenges, solutions, and comparisons. Comput. Commun. 2020, 151, 518–538. [Google Scholar] [CrossRef]
- Tanwar, S.; Bhatia, Q.; Patel, P.; Kumari, A.; Singh, P.K.; Hong, W. Machine Learning Adoption in Blockchain-Based Smart Applications: The Challenges, and a Way Forward. IEEE Access 2020, 8, 474–488. [Google Scholar] [CrossRef]
- Nakamoto, S. Bitcoin: A Peer-to-Peer Electronic Cash System. 2008. Available online: http://bitcoin.org/bitcoin.pdf (accessed on 26 March 2022).
- Ali, R.; Barrdear, J.; Clews, R.; Southgate, J. The economics of digital currencies. Bank Engl. Q. Bull. 2014, 54, 276–286. [Google Scholar]
- Thakkar, P.; Varma, K.; Ukani, V.; Mankad, S.; Tanwar, S. Combining User-Based and Item-Based Collaborative Filtering Using Machine Learning. In Information and Communication Technology for Intelligent Systems; Satapathy, S.C., Joshi, A., Eds.; Springer: Singapore, 2019; pp. 173–180. [Google Scholar]
- Bhattacharya, P.; Tanwar, S.; Bodke, U.; Tyagi, S.; Kumar, N. BinDaaS: Blockchain-Based Deep-Learning as-a-Service in Healthcare 4.0 Applications. IEEE Trans. Netw. Sci. Eng. 2019, 8, 1242–1255. [Google Scholar] [CrossRef]
- Vachhani, H.; Obiadat, M.S.; Thakkar, A.; Shah, V.; Sojitra, R.; Bhatia, J.; Tanwar, S. Machine Learning Based Stock Market Analysis: A Short Survey. In Innovative Data Communication Technologies and Application; Raj, J.S., Bashar, A., Ramson, S.R.J., Eds.; Springer International Publishing: Cham, Switzerland, 2020; pp. 12–26. [Google Scholar]
- Gupta, R.; Tanwar, S.; Tyagi, S.; Kumar, N. Machine Learning Models for Secure Data Analytics: A taxonomy and threat model. Comput. Commun. 2020, 153, 406–440. [Google Scholar] [CrossRef]
- McCoy, M.; Rahimi, S. Prediction of highly volatile cryptocurrency prices using social media. Int. J. Comput. Intell. Appl. 2020, 19, 2050025. [Google Scholar] [CrossRef]
- Liew, J.; Li, R.; Budavári, T.; Sharma, A. Cryptocurrency Investing Examined. J. Br. Blockchain Assoc. 2019, 2, 1–12. [Google Scholar] [CrossRef] [Green Version]
- Mokni, K. When, where, and how economic policy uncertainty predicts Bitcoin returns and volatility? A quantiles-based analysis. Q. Rev. Econ. Financ. 2021, 80, 65–73. [Google Scholar] [CrossRef]
- Liu, J.; Serletis, A. Volatility in the cryptocurrency market. Open Econ. Rev. 2019, 30, 779–811. [Google Scholar] [CrossRef] [Green Version]
- CoinMarketCap. Available online: https://coinmarketcap.com/charts/ (accessed on 26 March 2022).
- Begušić, S.; Kostanjčar, Z.; Stanley, H.E.; Podobnik, B. Scaling properties of extreme price fluctuations in Bitcoin markets. Phys. A Stat. Mech. Its Appl. 2018, 510, 400–406. [Google Scholar] [CrossRef] [Green Version]
- Bouri, E.; Gkillas, K.; Gupta, R.; Pierdzioch, C. Forecasting realized volatility of bitcoin: The role of the trade war. Comput. Econ. 2021, 57, 29–53. [Google Scholar] [CrossRef]
- Garcia, D.; Schweitzer, F. Social signals and algorithmic trading of Bitcoin. R. Soc. Open Sci. 2015, 2, 150288. [Google Scholar] [CrossRef] [Green Version]
- Deng, Y.; Bao, F.; Kong, Y.; Ren, Z.; Dai, Q. Deep direct reinforcement learning for financial signal representation and trading. IEEE Trans. Neural Netw. Learn. Syst. 2016, 28, 653–664. [Google Scholar] [CrossRef]
- Nakano, M.; Takahashi, A.; Takahashi, S. Bitcoin technical trading with artificial neural network. Phys. A Stat. Mech. Its Appl. 2018, 510, 587–609. [Google Scholar] [CrossRef]
- Fil, M.; Kristoufek, L. Pairs trading in cryptocurrency markets. IEEE Access 2020, 8, 172644–172651. [Google Scholar] [CrossRef]
- Colianni, S.; Rosales, S.; Signorotti, M. Algorithmic trading of cryptocurrency based on Twitter sentiment analysis. CS229 Proj. 2015, 1, 1–5. [Google Scholar]
- Fister, D.; Mun, J.; Jagrič, V.; Jagrič, T. Deep Learning for Stock Market Trading: A Superior Trading Strategy? Neural Netw. World 2019, 29, 151–171. [Google Scholar] [CrossRef] [Green Version]
- Takeuchi, L.; Lee, Y.Y.A. Applying Deep Learning to Enhance Momentum Trading Strategies in Stocks; Technical Report; Stanford University: Stanford, CA, USA, 2013. [Google Scholar]
- Yong, B.X.; Rahim, M.R.A.; Abdullah, A.S. A stock market trading system using deep neural network. In Proceedings of the Asian Simulation Conference, Melaka, Malaysia, 27–29 August 2017; Springer: Singapore, 2017; pp. 356–364. [Google Scholar]
- Zanc, R.; Cioara, T.; Anghel, I. Forecasting Financial Markets using Deep Learning. In Proceedings of the 2019 IEEE 15th International Conference on Intelligent Computer Communication and Processing (ICCP), Cluj-Napoca, Romania, 5–7 September 2019; pp. 459–466. [Google Scholar]
- Dipple, S.; Choudhary, A.; Flamino, J.; Szymanski, B.K.; Korniss, G. Using correlated stochastic differential equations to forecast cryptocurrency rates and social media activities. Appl. Netw. Sci. 2020, 5, 17. [Google Scholar] [CrossRef] [Green Version]
- Wong, E. Stochastic neural networks. Algorithmica 1991, 6, 466–478. [Google Scholar] [CrossRef]
- Florensa, C.; Duan, Y.; Abbeel, P. Stochastic neural networks for hierarchical reinforcement learning. arXiv 2017, arXiv:1704.03012. [Google Scholar]
- Fama, E.F. Random Walks in Stock Market Prices. Financ. Anal. J. 1965, 21, 55–59. [Google Scholar] [CrossRef] [Green Version]
- Jay, P.; Kalariya, V.; Parmar, P.; Tanwar, S.; Kumar, N.; Alazab, M. Stochastic neural networks for cryptocurrency price prediction. IEEE Access 2020, 8, 82804–82818. [Google Scholar] [CrossRef]
- Koki, C.; Leonardos, S.; Piliouras, G. Do Cryptocurrency Prices Camouflage Latent Economic Effects? A Bayesian Hidden Markov Approach. Proceedings 2019, 28, 5. [Google Scholar]
- Ginzburg, I.; Sompolinsky, H. Theory of correlations in stochastic neural networks. Phys. Rev. E 1994, 50, 3171. [Google Scholar] [CrossRef] [PubMed] [Green Version]
- Bollinger, J. Bollinger on Bollinger Bands; McGraw-Hill: New York, NY, USA, 2002. [Google Scholar]
- Bollinger, J. Using bollinger bands. Stock. Commod. 1992, 10, 47–51. [Google Scholar]
- Lento, C.; Gradojevic, N.; Wright, C. Investment information content in Bollinger Bands? Appl. Financ. Econ. Lett. 2007, 3, 263–267. [Google Scholar] [CrossRef]
- Elliott, R.J.; Van Der Hoek, J.; Malcolm, W.P. Pairs trading. Quant. Financ. 2005, 5, 271–276. [Google Scholar] [CrossRef]
- Vidyamurthy, G. Pairs Trading: Quantitative Methods and Analysis; John Wiley & Sons: Hoboken, NJ, USA, 2004; Volume 217. [Google Scholar]
- Trading Strategy Guides. Bill Williams Awesome Oscillator Strategy–Big Profits, Small Losses. 2017. Available online: https://tradingstrategyguides.com/indicator-combinations-in-forex-trading/ (accessed on 26 March 2022).
- Trading Strategy Guides. The 10 Best Indicator Combinations in Forex Trading. 2017. Available online: https://tradingstrategyguides.com/bill-williams-awesome-oscillator-strategy/ (accessed on 26 March 2022).
- Trading Strategy Guides. NEO Cryptocurrency Strategy–Scalping with BB and AO. 2018. Available online: https://tradingstrategyguides.com/neo-cryptocurrency-strategy/ (accessed on 26 March 2022).
- Mittal, A.; Dhiman, V.; Singh, A.; Prakash, C. Short-Term Bitcoin Price Fluctuation Prediction Using Social Media and Web Search Data. In Proceedings of the 2019 Twelfth International Conference on Contemporary Computing (IC3), Noida, India, 8–10 August 2019. [Google Scholar]
- Smuts, N. What Drives Cryptocurrency Prices? ACM Sigmetrics Perform. Eval. Rev. 2019, 46, 131–134. [Google Scholar] [CrossRef]
- Cohen, G. Forecasting bitcoin trends using algorithmic learning systems. Entropy 2020, 22, 838. [Google Scholar] [CrossRef]


| Author | Year | Description | Parameters | Results |
|---|---|---|---|---|
| Garcia et al. [18] | 2015 | In their analysis, they incorporate market information such as transaction volume and prices. They also used social signals such as word-of-mouth volume, opinion polarization in tweets, and emotional valence over three years. They concluded that opinion polarization was the most relevant factor determining the worth of the currency, closely followed by exchange volumes and emotional valence. | Bitcoin market information and its social and economic signals | Author, along with market information like volume and prices, trained a model that provides a return of 0.3% per day. |
| Deng et al. [19] | 2016 | Author uses two biological-related learning concepts of deep learning (DL) and reinforcement learning (RL). DL model senses dynamic market conditions to important abstract information and the RL model tries to make a trading decision based on the output of DL. | Not provided | They verified the computational effectiveness of their model. |
| Nakona et al. [20] | 2018 | Used 7 layered ANN with ReLU and LeakyReLU to predict intraday price of bitcoin. They also perform a sensitivity analysis to verify the robustness of their approach. | Bitcoin data with the following features: volume, closing price, high price, and low prices over 15 min | Their best performing ANN model increased asset value by 64.46 times. Their Sharpe ratio for the best performing strategy is 24,601.06. |
| Fil et al. [21] | 2020 | They applied the distance and cointegration methods to a basket of 26 liquid cryptocurrencies traded on the Binance exchange, specifically at 5-min, 1-h, and daily frequencies. They observed that high-frequency trading was more profitable when compared to short-term and long-term holding strategies. | They used the Binance exchange data of 26 cryptocurrencies. | The most common daily distance method returns −0.07% monthly. This increases to 11.61% monthly for a 5-min frequency. |
| Colianni et al. [22] | 2015 | Authors proposed supervised learning algorithms to conduct sentiment analysis on BTC based on Twitter data using tweepy on the keyword search. They show that public sentiment has a statistical significance in determining the day-to-day value of cryptocurrencies. | Tweets related to Bitcoin were fetched from Twitter. | Their approach leads to a final hour-to-hour and day-to-day prediction accuracy exceeding 90%. |
| Fister et al. [23] | 2019 | Author used LSTM based network for automated trading and the proposed approach was compared with passive and rule-based trading strategies as well as with machine learning classifier. | Yahoo finance dataset | LSTM peaks for 2-day stock return at 190.2% of overall returns. |
| Takeuchi et al. [24] | 2013 | Author proposed an autoencoder model consisting of stacked restricted Boltzmann machines, which were used to extract significant features from the historical market data. Their model discovers the momentum effect in stock prices. | Ordinary shares traded on NYSE, AMEX, and NASDAQ from 1965 to 1989 | They devised a trading strategy that brought in annualized returns of 45.93% for basic momentum when backtested in stock markets from 1990 to 2009. |
| Yong et al. [25] | 2017 | Authors used a deep neural network to anticipate the index price of the Singapore exchange using the FTSE Straits Time Index. These forecasted results were used along with specified entry and exit trade rules. | Singapore exchange | The model was evaluated using RMSE and MAPE, having a profit factor of 18.67 and a Sharpe ratio of 5.34 on simulation. |
| Proposed approach | 2022 | This paper proposes hybrid trading strategies that take advantage of the traditional mean reversal strategies alongside robust price predictions from stochastic neural networks. We trained stochastic neural networks to predict prices based on market data and social sentiment. The backtesting was conducted on three cryptocurrencies: Bitcoin, Ethereum, and Litecoin, for over 600 days from August 2017 to December 2019. | Market information, Google Trends and Tweet volume of Bitcoin, Ethereum, and Litecoin | SNN-enhanced Bollinger bands trading algorithm was the best strategy giving an annualized returns of 241.44%, 293.89%, and 332.65% for BTC, ETH, and LTC, respectively. |
| Algorithm | Currency | Net Returns | NP (%) | PP (%) | PF | MDD (%) | Total Trades |
|---|---|---|---|---|---|---|---|
| Bollinger Band | BTC | 6768.55 | 676.86 | 80 | 22.99 | 18.38 | 5 |
| ETH | 8861.68 | 886.17 | 100 | - | 20.73 | 3 | |
| LTC | 10,534.62 | 1053.46 | 40 | 9.74 | 26.27 | 5 | |
| Awesome Oscillator | BTC | 3438.42 | 343.84 | 68.42 | 2.33 | 61.84 | 19 |
| ETH | 898.14 | 89.81 | 55.56 | 1.80 | 68.65 | 18 | |
| LTC | 2433.40 | 243.34 | 52.94 | 2.51 | 69.36 | 17 |
| Stand-Alone Model | Combination of Neural Network and Stand-Alone Model | ||||
|---|---|---|---|---|---|
| Currency 1 | Currency 2 | Net Returns ($) | NP (%) | Net Returns ($) | NP (%) |
| ETH | BTC | −43.68 | −4.37 | 478.39 | 47.84 |
| ETH | LTC | 765.64 | 76.56 | 281.33 | 28.13 |
| LTC | BTC | 3167.49 | 316.75 | 851.22 | 85.12 |
| Algorithm | Threshold | Currency | Net Returns ($) | NP (%) |
|---|---|---|---|---|
| Buy and Hold | BTC | 1245.29 | 124.53 | |
| ETH | −52.28 | −5.23 | ||
| LTC | 1240.10 | 124.01 | ||
| RSI (Time Period 21 days) | Buy 20 Sell 80 | BTC | 341.60 | 34.16 |
| ETH | −193.13 | −19.31 | ||
| LTC | 1340.56 | 134.06 | ||
| RSI (Time Period 14 days) | Buy 30 Sell 70 | BTC | −278.78 | −27.88 |
| ETH | −624.76 | −62.48 | ||
| LTC | −133.01 | −13.30 | ||
| Stand-alone Neural Network | BTC | −117.74 | −11.77 | |
| ETH | 147.91 | 14.79 | ||
| LTC | 568.56 | 56.86 | ||
| Stand-alone Bollinger Band | BTC | 1261.75 | 126.18 | |
| ETH | 2550.59 | 255.06 | ||
| LTC | 3836.42 | 383.64 | ||
| Stand-alone Awesome Oscillator | BTC | 2311.57 | 231.16 | |
| ETH | 805.74 | 80.57 | ||
| LTC | 3458.75 | 345.88 |
Publisher’s Note: MDPI stays neutral with regard to jurisdictional claims in published maps and institutional affiliations. |
© 2022 by the authors. Licensee MDPI, Basel, Switzerland. This article is an open access article distributed under the terms and conditions of the Creative Commons Attribution (CC BY) license (https://creativecommons.org/licenses/by/4.0/).
Share and Cite
Kalariya, V.; Parmar, P.; Jay, P.; Tanwar, S.; Raboaca, M.S.; Alqahtani, F.; Tolba, A.; Neagu, B.-C. Stochastic Neural Networks-Based Algorithmic Trading for the Cryptocurrency Market. Mathematics 2022, 10, 1456. https://doi.org/10.3390/math10091456
Kalariya V, Parmar P, Jay P, Tanwar S, Raboaca MS, Alqahtani F, Tolba A, Neagu B-C. Stochastic Neural Networks-Based Algorithmic Trading for the Cryptocurrency Market. Mathematics. 2022; 10(9):1456. https://doi.org/10.3390/math10091456
Chicago/Turabian StyleKalariya, Vasu, Pushpendra Parmar, Patel Jay, Sudeep Tanwar, Maria Simona Raboaca, Fayez Alqahtani, Amr Tolba, and Bogdan-Constantin Neagu. 2022. "Stochastic Neural Networks-Based Algorithmic Trading for the Cryptocurrency Market" Mathematics 10, no. 9: 1456. https://doi.org/10.3390/math10091456
APA StyleKalariya, V., Parmar, P., Jay, P., Tanwar, S., Raboaca, M. S., Alqahtani, F., Tolba, A., & Neagu, B.-C. (2022). Stochastic Neural Networks-Based Algorithmic Trading for the Cryptocurrency Market. Mathematics, 10(9), 1456. https://doi.org/10.3390/math10091456