1. Introduction
The aim of this paper is to study loss functions that are used in machine learning for training binary classification machines. We refer to [
1,
2,
3,
4,
5] for an introduction to machine learning. Loss functions play an extremely important role in differential machine learning, and many different loss functions have been created for each problem, based on some general principles (see, e.g., [
4,
6,
7,
8,
9]). However, most people use some available loss functions without paying much attention to the question of “how the choice of a loss function will affect the outcome of a machine learning problem”. Recently, researchers started paying more attention to the properties of the loss functions, which would help the stochastic gradient flows in differential machine learning converge to the desired values of the parameters; see, e.g., [
10,
11,
12,
13,
14,
15,
16,
17,
18,
19]. Our present work is also a contribution in this direction.
The question that we want to address in this paper is how to design the loss functions so that the machines that are loss minimizers are also optimal in terms of prediction accuracy. In order to study this question, we first need to study the ways to measure and compare the accuracy of different binary machines. This led us to the notions of information spaces, real probability machines, optimal machines, the convexity of the ROC curve, and natural inequalities relating different metrics of accuracy. We then discovered that the convexity condition is the main condition on the loss function in order to ensure that its minimizer will be an optimal machine in terms of precision. In general, those loss-minimizing machines will give distorted probabilities instead of real probabilities. (When people interpret sigmoid values as probabilities in the artificial intelligence literature, this is not accurate in general, as those numbers are not real probabilities.) However, this distortion may be viewed positively, as a feature instead of a bug, and one can go back from distorted probabilities to real probabilities by performing large-scale testing if one wishes.
The main results presented in this paper are the following:
(
Section 2, Proposition 1) Different measures of accuracy such as the area under the curve (AUC) of the ROC curve, the maximal balanced accuracy, and the maximally weighted accuracy are “topologically equivalent” in the sense that if one of them is high (i.e., close to 1), then the other ones are also automatically high, with natural inequalities relating them.
(
Section 3, Proposition 2) The so-called real probability machines with respect to given information spaces are the optimal machines, i.e., they have the highest precision among all possible machines, and moreover, their ROC curves are automatically convex.
(
Section 4, Proposition 3) The cross-entropy and the square loss are the most natural loss functions in the sense that the real probability machine is their minimizer.
(
Section 5 and
Section 6, Proposition 4) An arbitrary smooth strictly convex loss function will also have as its minimizer an optimal machine, which is related to the real probability machine by just a reparametrization of the sigmoid values. However, if the loss function is not convex, then its minimizer is not an optimal machine, and strange phenomena may happen.
Propositions 1 and 2 have been announced by us in a recent talk at AICI 2022 [
20].
2. Binary Machines, ROC Curves, and Accuracy Metrics
Let us fix some notations for this paper. Denote by
an input space together with some probability measure
, and
a binary classification problem on
. For example,
is the population, and
Y is COVID-positive (1) or COVID-negative (0).
Y is often called the
ground truth.
We want to build a
binary machine:
(a test, whose values are in the interval [0,1]) that predicts the value of
Y. Given a threshold
, for each element
, we put
The performance (i.e., precision) of the predictor
with respect to the ground truth
Y can be measured by two basic performance indicators, called the
sensitivity (=
true positive rate)
and
specificity (=
true negative rate)
, defined by the following formulas:
The curve
given by the formula
is called the receiver operating characteristic (ROC) curve of the machine
M in the literature and is very widely used in many fields; see, e.g., [
21,
22,
23,
24,
25,
26] and the references therein. The number
is called the
false positive rate at the threshold
.
The ROC curves goes “backward” from the point
to the point
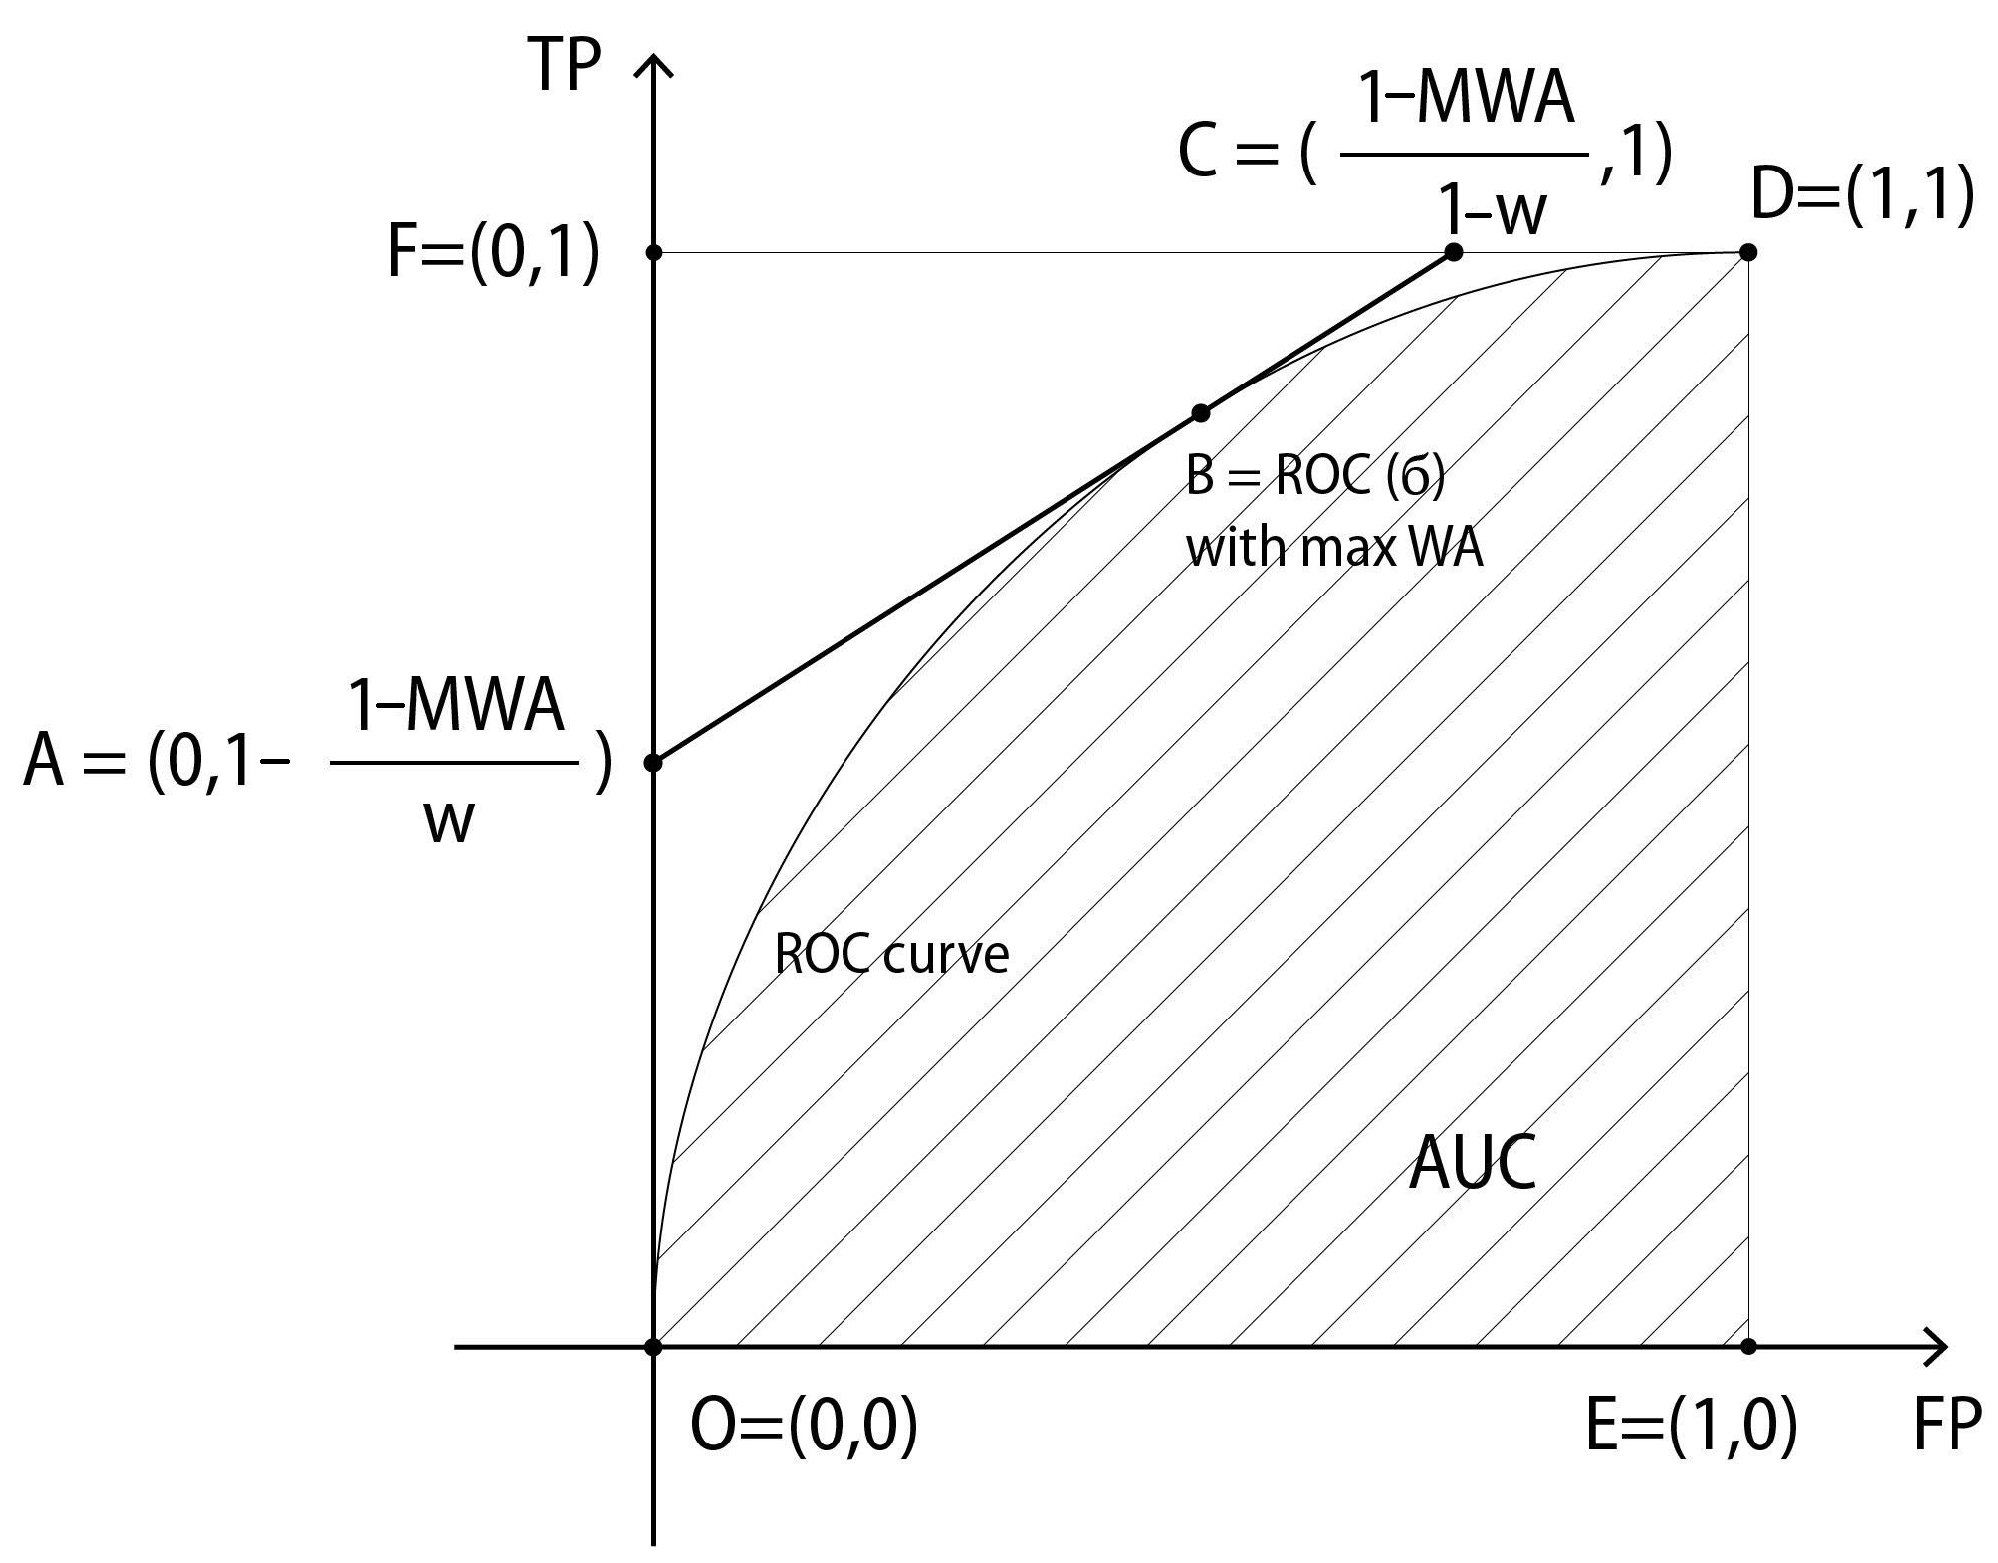
in the unit square, and the higher the curve, the more accurate the machine is. The so-called AUC is the area of the region under the ROC curve in the unit square and is a popular measure for the accuracy of the machine. See
Figure 1 for an illustration.
Another popular measure of accuracy is the
maximally weighted accuracy, denoted here by MWA (see, e.g., [
23]): given a weight
(determined by the ratio between the cost of a false negative and the cost of a false positive), we put
In particular, when
, then one obtains the so-called
maximal balanced accuracy:
We remark that for any machine, and if any of these numbers is equal to 1, then it means that the machine is perfect, 100% accurate. To borrow a notion from topology and functional analysis, we can say that the AUC, MWA, and MBA are different metrics of accuracy, but they are topologically equivalent, in the sense that if one of these numbers is close to 1, then the other two numbers must also be automatically close to 1, i.e., if the machine is highly precise with respect to one of these metrics, then it is also highly precise with respect to the other metrics. More precisely, we have the following simple inequalities relating these metrics of accuracy:
Proposition 1. With the above notations:
(i) For any binary machine M, we haveIf, moreover, the ROC curve of the machine M is convex, then we have(ii) For any given weight and any given binary machine M, we haveIf, moreover, the ROC curve of the machine M is convex, then we have Proof. (See
Figure 1). W remark that a number
is a threshold where the machine
M attains the highest weighted accuracy if and only if the straight line through the point
, consisting of the points
lies above the ROC curve. Indeed, the lines
of slope
are simply “lines of constant weighted accuracy”. If the point
of the ROC curve gives the maximally weighted accuracy, then no point of the ROC curve can lie above its corresponding line of slope
, because lying above means higher weighted accuracy.
The line
, where
gives the maximally weighted accuracy for the machine
M, cuts the boundary of the unit square at two points
and
. The triangle
, where
, is disjoint from the region under the ROC curve, which implies that
. Since
we obtain the inequality
On the other hand, the region under the ROC curve contains the rectangle whose vertices are
. The surface area of this rectangle is
(for every
). Hence, we obtain the inequality
If the ROC curve is convex, then the region below it contains the quadrilateral , where , (for any . The surface area of this quadrilateral is exactly equal to , i.e., to MBA; hence, we obtain the inequality for any , i.e., we have
Finally, the inequality
in the case when the ROC curve is convex and the weight
w is arbitrary is a direct consequence of the inequalities
and the equalities
. □
Remark 1. For some inequalities in Proposition 1, we assume the ROC curve to be convex. The (near-)convexity of ROC curves has been observed empirically in many monographs and articles for long time; see e.g., [21,22,23,24,25,26] and the references therein; it has been shown in [22] (Theorem 3) that the convexity of the ROC curve is equivalent to some other natural reasonable “rationality” conditions on the machine (namely, the higher the “sigmoid value” is, the higher the probability of the event being true is). In Section 3, we show that the so-called real probability machine, which is in a sense the most natural machine, is also the most precise machine, and its ROC is automatically convex. Our result helps explain why most ROC curves met in practice are nearly convex (because the machines must be nearly optimal in some sense if the machine learning processes for creating them are efficient). Remark 2. If we reparametrize a sigmoid function Σ by composing it with an arbitrary increasing bijection , then we obtain a new sigmoid function whose ROC curve is the same as the ROC curve of Σ, up to a reparametrization by f. Namely, for all . In particular, a reparametrization allows us to change the sigmoid values without changing the performance metrics AUC, MBA, and MWA of a system.
Remark 3. Some authors (see., e.g., [27]) also use the geometric mean of sensitivity () and specificity () as a measure of accuracy for binary prediction problems. The obvious arithmetical inequalities (for any positive numbers ) relate (in two ways) the geometric mean accuracy with the balanced accuracy . In particular, it means that the (maximal) geometric mean accuracy is also as good a measure of accuracy as MBA and the AUC, in the sense that they are topologically equivalent. Remark 4. Given an original probability distribution on the data space Ω
, which is imbalanced in the sense that (imbalance between negative and positive cases), we may change it to a new, balanced, probability distribution , defined by the following formula:It is easy to verify that the parametrized ROC curve (for a given machine ) with respect to coincides exactly with the ROC curve with respect to P. Indeed, for any , the true positive level at σ is , and similarly for . Thus, in the study of accuracy, without loss of generality, one may suppose that the probability distribution is balanced with respect to Y in the sense that . 3. Information Projection, Sigmoid Functions, and Optimal Machines
Conceptually, we can describe a binary machine
M as a composition of two steps:
where
may be called the
information projection map from the original data space
to a certain “distilled features space” or
information space , and
is a function from the information space
to the interval
, which we will call a (generalized)
sigmoid function, in analogy with the classical sigmoid function
often used in the last layer of a neural network in deep learning, even though our
is a function of many variables in general.
The idea is that, in most cases, we cannot know everything about an element ; we can know only some information about x, and that information is given by the projection map . Based on the available information about x, we have to decide, via the value , whether x is “negative” or “positive”. Even when we know everything about x (e.g., when x is a digital image), the information contained in x may be too big (millions of bits for an image), so we have first to “distill” that information into something smaller, which we call and which we can control more easily.
In this paper, we assume that the information space and the projection map are fixed, and what we want to choose is just the sigmoid function . The probability measure on is the push-forward of the probability measure on via the projection map .
In the artificial intelligence (AI) literature, the number is often called the probability (of x being positive given the information ), even though it is not true in general, because can be chosen rather arbitrarily, and as we will see in the following sections of this paper, even optimal machines obtained by machine learning methods usually give what we call distorted probabilities instead of real probabilities.
Nevertheless, among all the possible machines
M (all the possible sigmoid functions
), there is one that is more natural than the others, which we call the
real probability machine (the
probability sigmoid function). The probability sigmoid function is simply the following conditional probability function:
for each
.
We remark that, if we change the sigmoid function by composing it with another function, where is a strictly increasing bijective function, then and give the same ROC curve up to a reparametrization by . In other words, we can change a sigmoid value to any other value by composing it with a function, without changing the accuracy of the system, and this is one more reason why the sigmoid values should not be called “probabilities” in general.
Proposition 2. With the above notations:
(i) If is an arbitrary sigmoid function, then the real probability machine is more precise than (or at least as precise as) the machine , in the sense that the ROC curve of lies above the ROC curve of M. In other words, for any false positive level , if σ and are the corresponding thresholds such thatthen (ii) The ROC curve of the real probability machine is convex.
Proof. Fix an arbitrary false positive level
and
the two corresponding threshold values as in the statement of the proposition. Then, we have the following formula for
:
(where
is the probability measure of the negative set
), which implies that
To simplify the notations, put
Then, we have
which implies that
Since
on
while
on
, we must have that
, which implies that
which implies that
This last inequality means exactly that the true positive level of at the false positive level is greater than or equal to the true positive level of at the same false positive level. In other words, the ROC curve of the probability sigmoid function lies above the ROC curve of everywhere, i.e., is the optimal sigmoid function.
The two ROC curves coincide if and only if, in the above formulas, B coincides with A (up to a set of measure zero) for every false positive level , and it basically means that is obtained from by composing it with a monotonous function. In other words, up to a reparametrization of the sigmoid values, the probability sigmoid function is the only optimal sigmoid function.
The convexity of the ROC curve of the probability sigmoid function
follows directly from its construction, which ensures that the conditional event probability is nondecreasing (the higher the sigmoid value
, the higher the conditional probability value is, which is obvious because this value is equal to
in our construction). See Theorem 3 of [
22]. Indeed, denote by
the false negative and false positive levels at threshold
for the probability sigmoid function
, then we have
which is an increasing function in
, but a decreasing function in
, because
itself is a decreasing function in
. Hence,
is a concave function in
, which means that the ROC curve is convex. □
4. Differential Machine Learning and Loss Functions
The main idea of machine learning is that we have not just one, but a large family of machines
that depend on some vector parameter
, where
is a multi-dimensional space, and the learning process consists of changing
step by step, e.g.,
in order to improve the performance or the precision of
. In
differential learning, one constructs a
loss function:
which acts as a proxy for the precision of the machines (the lower the loss
, the higher the precision of the machine
in some sense) and uses the stochastic gradient descent method to find a minimal point
(or a near-minimal point) for the loss function
L. That (near-)minimal point
would logically correspond to a (near-)optimal machine
. Theoretically,
L is equal to the integral over the whole data space
of a
pointwise loss function ℓ:
A priori, one can choose the loss function
ℓ as one pleases, the only natural restriction being that the further
is away from the ground truth
, the higher the loss
should be, and if
, then there is no loss, i.e.,
. The two most popular loss functions are the
quadratic loss:
and the so-called binary
cross-entropy, which corresponds to the function
However, one can choose many other loss functions. For example, the following
quartic loss function will work very well in many problems:
One can even try to use non-smooth, non-convex loss functions, for example
Below, we give a theoretical explanation of the following facts:
- (i)
The quadratic loss and the cross-entropy are the two most natural loss functions;
- (ii)
Convex loss functions such as are good loss functions in the sense that their minimizers are optimal machines in terms of accuracy);
- (iii)
Nonconvex loss functions such as may lead to very erratic results (stochastic traps) in machine learning.
One can rewrite the loss
of a binary machine
as an integral on the information space
and then call it the loss of the sigmoid function
, as follows:
(For each given , the value of under the condition will be equal to with probability and equal to with probability . The integrand in the above formula is nothing but the integral of over the space with respect to the conditional probability measure on that space; that is why we have the above formula).
For example, in the case of the cross-entropy loss, we have the integral formula, whose integrand is really a cross-entropy:
The above examples of loss functions are
symmetric, in the sense that they treat the losses in negative cases (
) and the losses in positive cases (
) on an equal footing. However, due to huge data imbalance in some problems (for example, when the number of positive cases is just 1/1000 the number of negative cases), in practice, it is sometimes better to use
asymmetric loss functions instead of symmetric loss functions. Given a function:
which is increasing and such that
, we can create a family of
asymmetric loss functions depending on an
asymmetry coefficient by the following formula:
Since our ground truth admits only two values
and
, the above formula simply means that the loss is equal to
if
and is equal to
if
, so the negative cases and the positive cases are treated differently in the total loss. For example, when
, then it is like every positive case is counted one hundred times while every negative case is counted only once. As such, the asymmetry coefficient can be used to offset data imbalances.
The two Formulas (
35) and (
38) give us the following formula for the loss of a machine
with respect to a given generating function
f and asymmetry coefficient
c:
For each given
, the integrand
in the above integral formula can be written as a function of one variable
and one parameter
(we cannot change
p, but can choose our sigmoid function
, i.e., choose
, in order to minimize the loss):
Minimizing the loss
means minimizing
for each
. In other words, a sigmoid function
is a minimizer of the loss function
given by Formula (
39) if and only if (up to a set of measure zero) for each
and each
such that
, we have
This last equation leads us to the following very interesting result about the naturality of the classical quadratic loss function (the case with and ) and the binary cross-entropy (the case with and ):
Proposition 3. With the above notations, we have:
(i) The real probability machine is the only loss minimizer for the quadratic loss function.
(ii) The real probability machine is also the only loss minimizer for the binary cross entropy function.
Proof. (i) The quadratic loss case. As discussed above, a sigmoid function
is a minimizer of the quadratic loss function if and only if
for each
[0,1] and each
such that
.
The quadratic function has its derivative equal to , and the equation has a unique solution . This point is the unique minimal point for the function . It follows that the loss achieves its minimal at (and only at) the function i.e., when the machine is the real probability machine.
(ii) The cross-entropy case. In this case, the minimizer of the loss function satisfies the equation
for each
and each
such that
.
The logarithmic function tends to infinity at both ends (when tends to 0 and when tends to 1) and has its derivative equal to , and the equation has a unique solution . This value of is the unique minimal point of , so similar to the previous case, the probability function is also the unique minimizer of the cross-entropy loss function. □
6. Non-Convex Loss Functions and Stochastic Traps
We performed many experiments of deep learning with both “good” (hyper-convex loss functions, such as the quartic loss function in Formula (
33)) and “bad” loss functions (non-convex functions, such as the broken loss function in Formula (
34) and other functions, which the reader can probably invent easily by herself/himself). We used only well-known neural networks such as VGG16 [
30] and standard data augmentation methods, absolutely nothing fancy. The purpose was not to achieve the best-performing AI models, but to study phenomena created by different loss functions.
For example, we performed hundreds of experiments with the binary classification problems such as “cat versus not-cat”, “dog versus not-dog” on the well-known public dataset called CIFAR-10 collected by Alex Krizhevsky, Vinod Nair, and Geoffrey Hinton (see [
31,
32]). This dataset consists of 60 thousand
color images divided into 10 equal classes: cat, dog, ship, plane, etc. The experiments confirmed our theoretical reasoning that hyper-convex loss functions lead to good results in general, while non-convex loss functions very often (more than half of the time in our experiments) lead to
stochastic traps in the parameter space: the stochastic descent of the machine learning process falls into those places of low accuracy, gets trapped there, and cannot get out.
Due to the stochastic nature of machine learning, sometimes, the machine does break out of the stochastic trap after being stuck there for many epochs (learning steps). Sometimes, the trap is so big or so strong that the machine breaks out of it only to fall back into it again after some machine learning epochs. An illustration of a stochastic trap that we observed is shown in
Figure 2.
The problem of describing precisely the mechanisms for stochastic traps in machine learning is a very large and interesting problem, but it is outside of the scope of this paper. Here, we just wanted to show our observation that ill-designed non-convex loss functions may be responsible for such traps.


