1. Introduction
Several scientists are engaged in mathematical modeling and optimization processes of protein extraction [
1,
2,
3]. Furthermore, in work [
1] the potential of three additives, including dithiothreitol (DTT), sodium dodecyl sulfate (SDS) and Tween 20, were applied to improve the extraction efficiency. The aim of this study [
2] is to investigate the effect of dihydric alcohol chain length (1,2-ethanediol, 1,3-propanediol, and 1,4-butane diol) on the structure of deep eutectic solvents (DESs) and the properties of the extracted oat proteins. In [
3], the effects of an elevated static pressure up to 5-bar, sound amplitude, and treatment duration on energy consumption and protein extraction yield were explored.
There are several ways to isolate proteins. For example, a method for isolating proteins is known, which is based on the method of isoelectric precipitation. To extract proteins from solutions, sorption is also used, which is based on the different affinity of the mixture components for certain substances—sorbents [
4]. To isolate proteins, the method of molecular sieves is widely used, which are nanoporous materials with very fine pores (0.2–2) nm in size. The difference between these “sieves”: large particles do not remain on the surface of the sieve material, but flow around its granules, while small particles of impurities diffuse through the nanopores deep into the sieves, and thereby are retained. Another method for extracting proteins is thermal denaturation. This method of extracting whey proteins is based on the long established fact that all whey proteins, according to their molecular structure, are sensitive to heat, albeit to varying degrees [
5]. To isolate proteins from cheese whey, the most widely used methods are thermal, acidic and acid-base methods of coagulation of whey proteins. Acidification of cheese whey with hydrochloric acid to pH = 4.5 makes it possible to isolate 10% more protein than with thermal coagulation. Incomplete isolation of protein fractions during acid coagulation is explained by their heterogeneity and difference in properties. Further isolation of whey proteins can be achieved by deacidifying cheese whey from pH = 4.5 to pH = 6.5. Acidification and subsequent deacidification bring the reaction of the medium to the isoelectric point of all proteins present in the serum. The amount of released serum proteins, besides the temperature and pH of the medium, is affected by the time of exposure [
6,
7].
Coagulation with calcium chloride makes it possible to increase the degree of protein extraction from cheese whey to values over 50%. However, calcium chloride can only be used for fresh cheese whey.
One direction of reagent-less coagulation of whey proteins is their isolation at the stage of thickening. When whey is thickened to 28% dry matter, the degree of protein coagulation is 61.5%, which is almost 10% higher than with the acid-base method. In addition, up to 20% of minerals are removed with protein.
Recently, baromembrane methods have been used to extract milk proteins from solutions, when low molecular weight substances are transferred through membranes because of the pressure difference [
8]. For the extraction of proteins from vegetable and dairy raw materials, the use of electrochemical technologies (electroflotation and electrocoagulation) is very promising [
9,
10,
11,
12].
The scientific foundations of the electrochemical technology of protein extraction in the last two decades have been the subject of close attention of many researchers [
9,
10,
11,
12,
13,
14,
15,
16,
17,
18].
Research paper [
1] studied the effect of electroflotation treatment on the elemental and chemical composition, acidity, solubility of whey proteins, optical properties of curd whey, as well as on its organoleptic characteristics. The possibility of using whey, which has undergone membrane electroflotation treatment for the production of fermented milk drinks has been studied. In research paper [
2], the issues of modeling the process of ultrafiltration of floated curd whey are considered. It is shown that because of the increase in the pH value and the decrease in the content of calcium ions, the rate of ultrafiltration of whey that has undergone electroflotation treatment increases. In [
19], it was proposed to use the electroflotation method to isolate milk proteins from whey. In the process of whey electroflotation, it was found that the maximum extraction of proteins is achieved at a current density of 60–120 A/m
2 in the temperature range of 40–50 °C.
The indisputable advantage of electroflotation and electrocoagulation is the possibility, because of the polyelectrolyte properties of proteins, at the stage of their isolation from solution, to carry out reagent-free adjustment of the pH of the medium by adjusting the current density. A big advantage of the methods of electroflotation and electrocoagulation is also the low concentration of the background electrolyte introduced into the solution to provide the required electrical conductivity. However, several issues related to the possibility and efficiency of combining the processes of electroflotation and electrocoagulation in a single instrumental module have not yet been resolved.
The aim of the study is to develop a combined electroflotation coagulation technology for extracting proteins from vegetable and dairy raw materials.
To achieve this goal, it was necessary to investigate and optimize the processes of extracting proteins from chickpea and curd whey solutions by electroflotation coagulation, as well as to develop an installation for electroflotocoagulation extraction of proteins from vegetable and dairy raw materials.
2. Materials and Methods
In this work, chickpea varieties “Krasnokutsky 28” and “Privo 1” were used as a raw material for obtaining vegetable proteins. Curd whey was used as a source of milk proteins, meeting the requirements of GOST R 53438-2009.
To ensure good electrical conductivity of the solutions, sodium sulfite Na2SO3 and potassium hydroxide KOH were studied in the concentration range from 0.1 to 1.0 wt. %.
As the main electrode for recording cyclic potentiodynamic curves, we used electrodes made of smooth platinum as a 1 cm2 plate, pressed-graphite foil, and glassy carbon.
The study of the fractional composition of chickpea proteins showed that they are mainly represented by albumins (water-soluble proteins) and globulins (salt-soluble proteins). The total content of these protein fractions is about 96%. Prolamins (alcohol-soluble) and glutelins (alkali-soluble) have also been isolated, but their content is low (
Table 1) [
20].
The study of the fractional composition of curd whey proteins showed that they are mainly represented by globulins (salt-soluble proteins) and albumins (water-soluble proteins). The total content of these protein fractions is about 99%. Lactoferrin (an alkali-soluble protein) has also been isolated, but its content is low (
Table 2) [
20].
The characteristics of the electrolytes used in the work are given in
Table 3. The specific electrical conductivity of the solutions was measured with a conductometer “Expert 002”.
According to
Table 3, KOH solutions are characterized by a higher electrical conductivity compared to Na
2SO
3 solutions. Therefore, KOH solutions were used in further experiments.
Platinum, glassy carbon, and graphite foil are presented as electrode materials. An electrode made of compressed-graphite foil coated with polypropylene fabric was used as an auxiliary electrode.
Before carrying out the process of extracting proteins from curd whey, the latter was previously pasteurized at a temperature of 63–65 °C for 30 min. Next, the pasteurized whey was diluted with distilled water in a ratio of 1:4 to achieve a protein concentration in the solution of 30 mg/mL, which was optimal for the electrolysis process.
The extraction of chickpea extract was preceded by preparing of chickpea beans: grinding into grits, decreasing with diethyl ether in two stages (10 h and 2 h), repeated extraction of defatted chickpea flour with an aqueous solution of KOH, centrifugation, separation of the insoluble residue (chickpea protein extract). The concentration of extractants varied within (0.01–0.1)%. Empirically, the concentration of the chickpea protein solution was selected, at which the process of electroflotation coagulation proceeded intensively and stably, the highest mass yield of proteins from the solution and a high degree of their extraction were ensured. The optimal concentration of proteins lay near 15 mg/mL.
To test the technology for extracting proteins from mixed solutions of chickpeas and curd whey, solutions of chickpea proteins and curd whey were used at various volume ratios from 5/0 to 0/5 (
Table 4).
Measurement of the concentration of hydrogen ions in solutions (pH) was carried out using a pH meter (pH-410) with submersible electrodes and a temperature sensor in accordance with the requirement of GOST 26781-85.
To measure the content of proteins in the solution before and after electrolysis, the biuret micromethod was used [
21]. The content of proteins in solutions was determined by their optical density, which was measured on an SF-46 spectrophotometer.
The relative yield of proteins (degree of extraction α) in % was calculated by the formula:
where
—concentration of proteins in the initial solution before extraction, mg/mL;
—concentration of proteins in solution after extraction, mg/mL.
To measure the mass yield of proteins after electrolysis, we used the method for determining the content of proteins in the dry residue by the Kjeldahl method according to GOST 10846-91.
2.1. Technique for Statistical Processing of Experimental Data
The online system “MultiChrome 1.52” for Windows was used to process the experimental data. Based on the results of the experiments, the absolute (protein yield) and relative (in %) amount of proteins extracted from the solution (degree of extraction) were determined.
The obtained experimental data was subjected to statistical processing. In the first stage, the primary processing methods determined such parameters as:
sample mean (characterized as the mean value of experimental data);
scatter (was calculated by approximating the graph data with obtaining the approximation value using the MS Word program);
variance (arithmetic mean of the squares of deviations of the values of the variable from its mean value; the results are presented on the graphs as deviation error bars).
Further statistical analysis of the experimental data was carried out using the Statistica 6.0 software package (StatSoft, Tulsa, OK, USA). The mean value and standard deviation were calculated at a confidence level of 95% using the formula:
where
—sample standard deviation;
—separate value;
—average of all
;
—total number of measurements.
The standard error was calculated using the formula:
where
—standard error;
—sample standard deviation;
—total number of measurements.
Accuracy data, as well as positive and negative results of the experiment, were obtained by processing the decision matrix (four-field table) [
22,
23,
24,
25,
26,
27].
Accuracy (
) corresponded to the proportion of correct experimental results in the total number of results:
where
a,
b,
c,
d—parameters of the four-field table.
2.2. Influence of Electroflotation Mode on the Degree of Extraction of Chickpea Proteins and Curd Whey
The main indicator of the efficiency of electroflotation is the degree of protein extraction. To ensure the highest efficiency of the process, it was necessary to study the effect on the protein yield of the main determining factors: protein concentration in the initial solution, current density, duration of the electrolysis process, and ambient temperature.
An analysis of the literature data [
4,
5,
6,
7,
8,
9] showed that the most efficient process of electroflotation extraction of proteins from a solution proceeds at a medium temperature
t = 20–25 °C. It was found that the optimal electrolysis time is
τ = 30 min. It was also established by preliminary experiments that for the electroflotation process, the most optimal initial concentrations of chickpea and curd whey proteins are 15 and 30 mg/mL, respectively.
Based on these data, the study of electroflotation of solutions of chickpea proteins and curd whey on a two-electrode cell was carried out for τ = 30 min at tsolution = 25 °C and initial protein concentrations of 15 and 30 mg/mL, respectively.
Figure 1 and
Figure 2 show the dependence of the degree of extraction of proteins from a solution of chickpeas and curd whey on the current density. Analysis of the results showed that the maximum degree of extraction of chickpea proteins reaches 46% (at a current density of 60–80 A/m
2), and the maximum degree of whey protein extraction is 50% (at a current density of 100–120 A/m
2). With a subsequent increase in current, the efficiency of protein extraction from solutions of chickpea extract and curd whey, in practice, does not change, despite the increased electrolysis of the solution. This is due, first of all, to the different isoelectric states of the protein fractions (albumin and globulins), which requires a higher current density to maintain the electroflotation process.
In both cases, at lower current densities, an induction period can be observed (for a solution of chickpea proteins—below 30 A/m2, for curd whey—below 80 A/m2), when the protein yield does not exceed 30%. This can be explained by the low rate of gas formation and, as a result, by the low concentration and small size of gas bubbles, as well as by the slowness of the processes of protein adsorption on the electrode.
According to works [
10,
27] and the conducted studies, the analysis of the results of calculations of the kinetic parameters of the process of electroflotation of chickpea proteins in a two-electrode electrolyzer revealed a low value of the specific consumption of bubbling gas, which is associated with low values of current density. In solutions of whey proteins, the specific consumption of bubbling gases turned out to be 4 times higher, which can be explained by higher values of the electrical conductivity of the solution and higher current densities. Conversely, the protein particle capture efficiency coefficient (
E) is higher for chickpea protein particles, which is explained by their smaller size compared to whey proteins. Considering, also, the higher concentration of whey proteins in the solution (30 mg/mL) compared to the concentration of chickpea proteins (15 mg/mL), as a result, the degree of extraction of whey proteins (50%) was slightly higher than the degree of extraction of chickpea proteins (46%).
In the course of the study, it was found that over time, the solution became cloudy near the electrode surface and a coagulated protein precipitate formed at the bottom of the cell. This served as the basis for setting up experiments on combining the processes of electroflotation and electrocoagulation in order to increase the degree of protein extraction.
3. Results
3.1. Influence of Cell Design on the Process of Protein Extraction by Electroflotation Coagulation
In search of ways to increase the current density and, accordingly, the release rate, concentration, and size of gas bubbles, a design of a three-electrode cell-electrolyzer was developed. When developing a cell of a new design, the results of experiments on a two-electrode cell were used, as well as literature data [
4,
5,
6,
7,
10,
27]. The design of the three-electrode cell is shown in
Figure 3. The process of electroflotocoagulation was carried out in a cell (electrolyzer) of a special three-electrode design with a strictly specified vertical arrangement of three electrodes: two cathodes and one anode (
Figure 3). The glassy carbon anode was placed strictly in the center between the glassy carbon cathodes. The anode height was 60 mm, the working surface area was 2400 mm
2, and the interelectrode gap width was 5 mm. The selected dimensions made it possible to ensure the diffusion mode of electrolysis under the conditions of the joint flow of electroflotation and electrocoagulation processes.
The new cell made it possible to increase the operating current density from 80 to 200 A/m2 (for a solution of chickpea proteins) and from 150 to 350 A/m2 (for a solution of curd whey proteins).
The increase in the operating current ranges and the possibility of combining the processes of electroflotation and electrocoagulation made it possible to significantly increase the efficiency of the effect on the dispersed state of proteins under the influence of electrocoagulation, and on the size and fixation of electrolytic gas bubbles on the surface of coagulated protein particles, which ensured their subsequent flotation.
Table 5 shows the fractional composition and properties of protein fractions of chickpea and curd whey in the investigated solutions [
28].
In the process of electroflotocoagulation of a solution of chickpea proteins in a three-electrode cell developed by us, which allows for the simultaneous flow of electroflotation and electrocoagulation processes, it was possible to change the pH from 10 ± 1 to 4.1 ± 1.
Albumin (
Table 5), prevailing in chickpea proteins (80.2%), under the influence of an electric field, passes into the isoelectric state at pH = 4.5–4.7. Due to the fact that in the isoelectric state, albumins are in an undissolved, neutral, and weakly hydrated state, because of the electrolytic decomposition of water, they are picked up and transferred to the surface by gas bubbles of hydrogen (at the cathode) and oxygen (at the anode). This ensures the process of their flotation [
29].
Globulins (
Table 5) under the action of an electric field pass into the isoelectric state at pH > 6.0. Therefore, at pH = 4.5–4.7, they are not in the isoelectric state. However, because of the adsorption of ions present in the solution due to the electrolytic dissociation of water, globulins gain a negative charge (at pH > 4.1, the electrokinetic potential of protein particles is negative) and move in an electric field to the anode, followed by coagulation near its surface. In our case, the value of the ζ-potential of the chickpea protein solution at this pH value was −31 × 10
−3 V, which ensured the process of coagulation of proteins in the solution. According to the data of [
29], the coagulation of globulins in solutions is guaranteed to be carried out at values of ζ—potential ≥ 30 × 10
−3 V (modulo).
Similar experiments on electroflotocoagulation of curd whey protein solutions showed the possibility of changing the pH of curd whey solutions from 4.8 ± 1 to 6.0 ± 1.
Globulins (
Table 5), prevailing in the structure of curd whey proteins (66%), under the action of an electric field, pass into the isoelectric state at pH = 6.0 ± 1. Given that in isoelectric states, globulins are in undissolved, neutral, and weakly hydrated states, due to the electrolytic decomposition of water, they are picked up and transferred to the surface by gas bubbles of hydrogen (at the cathode) and oxygen (at the anode). This ensures the process of their flotation. [
29].
Albumin (
Table 5) constituting 33% in the structure of curd whey proteins under the influence of an electric field pass into an isoelectric state at pH = 4.5–4.7. Therefore, at pH = 6.0 ± 1, they are not in the isoelectric state. However, because of the adsorption of anions present in the solution due to the electrolytic dissociation of water, the albumins acquire a negative charge (at pH > 4.1, the electrokinetic potential of albumin particles is negative [
9]) and move in an electric field to the anode with subsequent coagulation near its surface [
29]. In our case, the value of the ζ-potential of the solution of curd whey proteins at the specified pH value was −37.5 × 10
−3 V, which ensured the process of coagulation of albumin in the solution. According to the data of [
24], the coagulation of albumin in solutions is guaranteed to be carried out at values of ζ—potential ≥ 30 × 10
−3 V (modulo). The course of the protein coagulation process was also confirmed by visual observations.
3.2. Influence of Technological Parameters on the Degree of Protein Extraction in Electroflotocoagulation Mode
Technological parameters (solution temperature, duration of the electrolysis process, initial concentration of proteins in the solution, current density) have a major influence on the yield of proteins during the electrolysis of solutions.
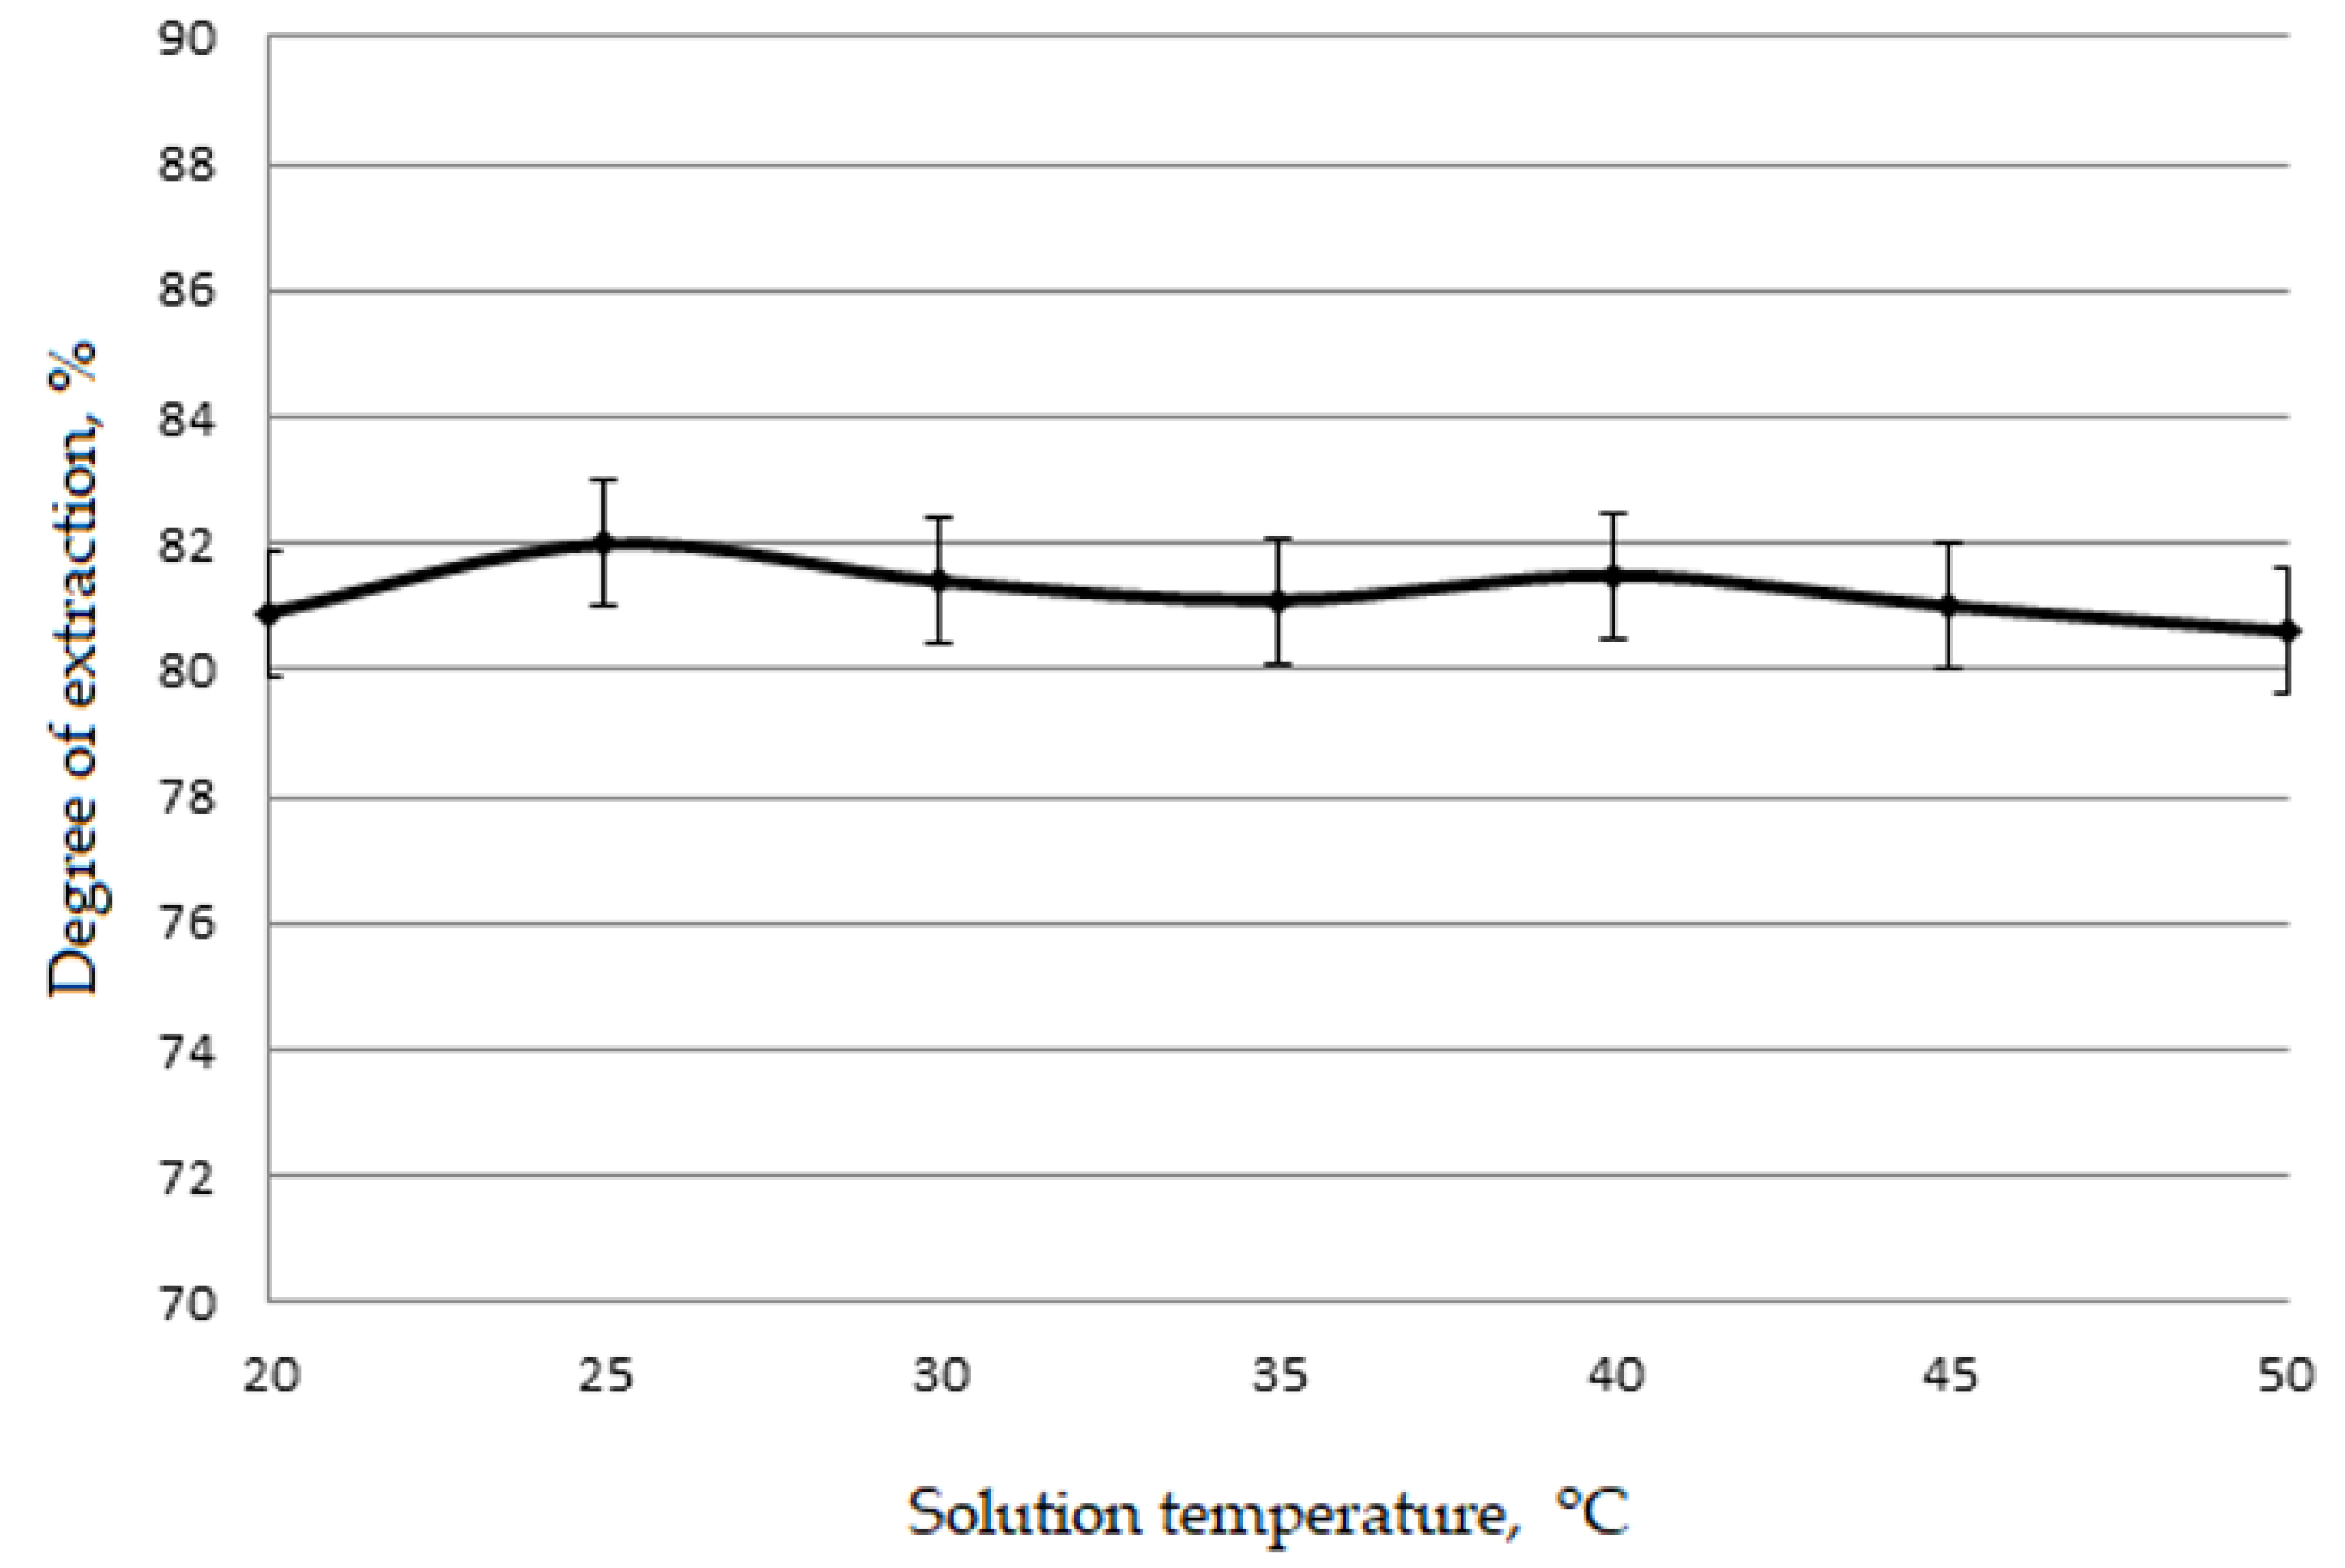
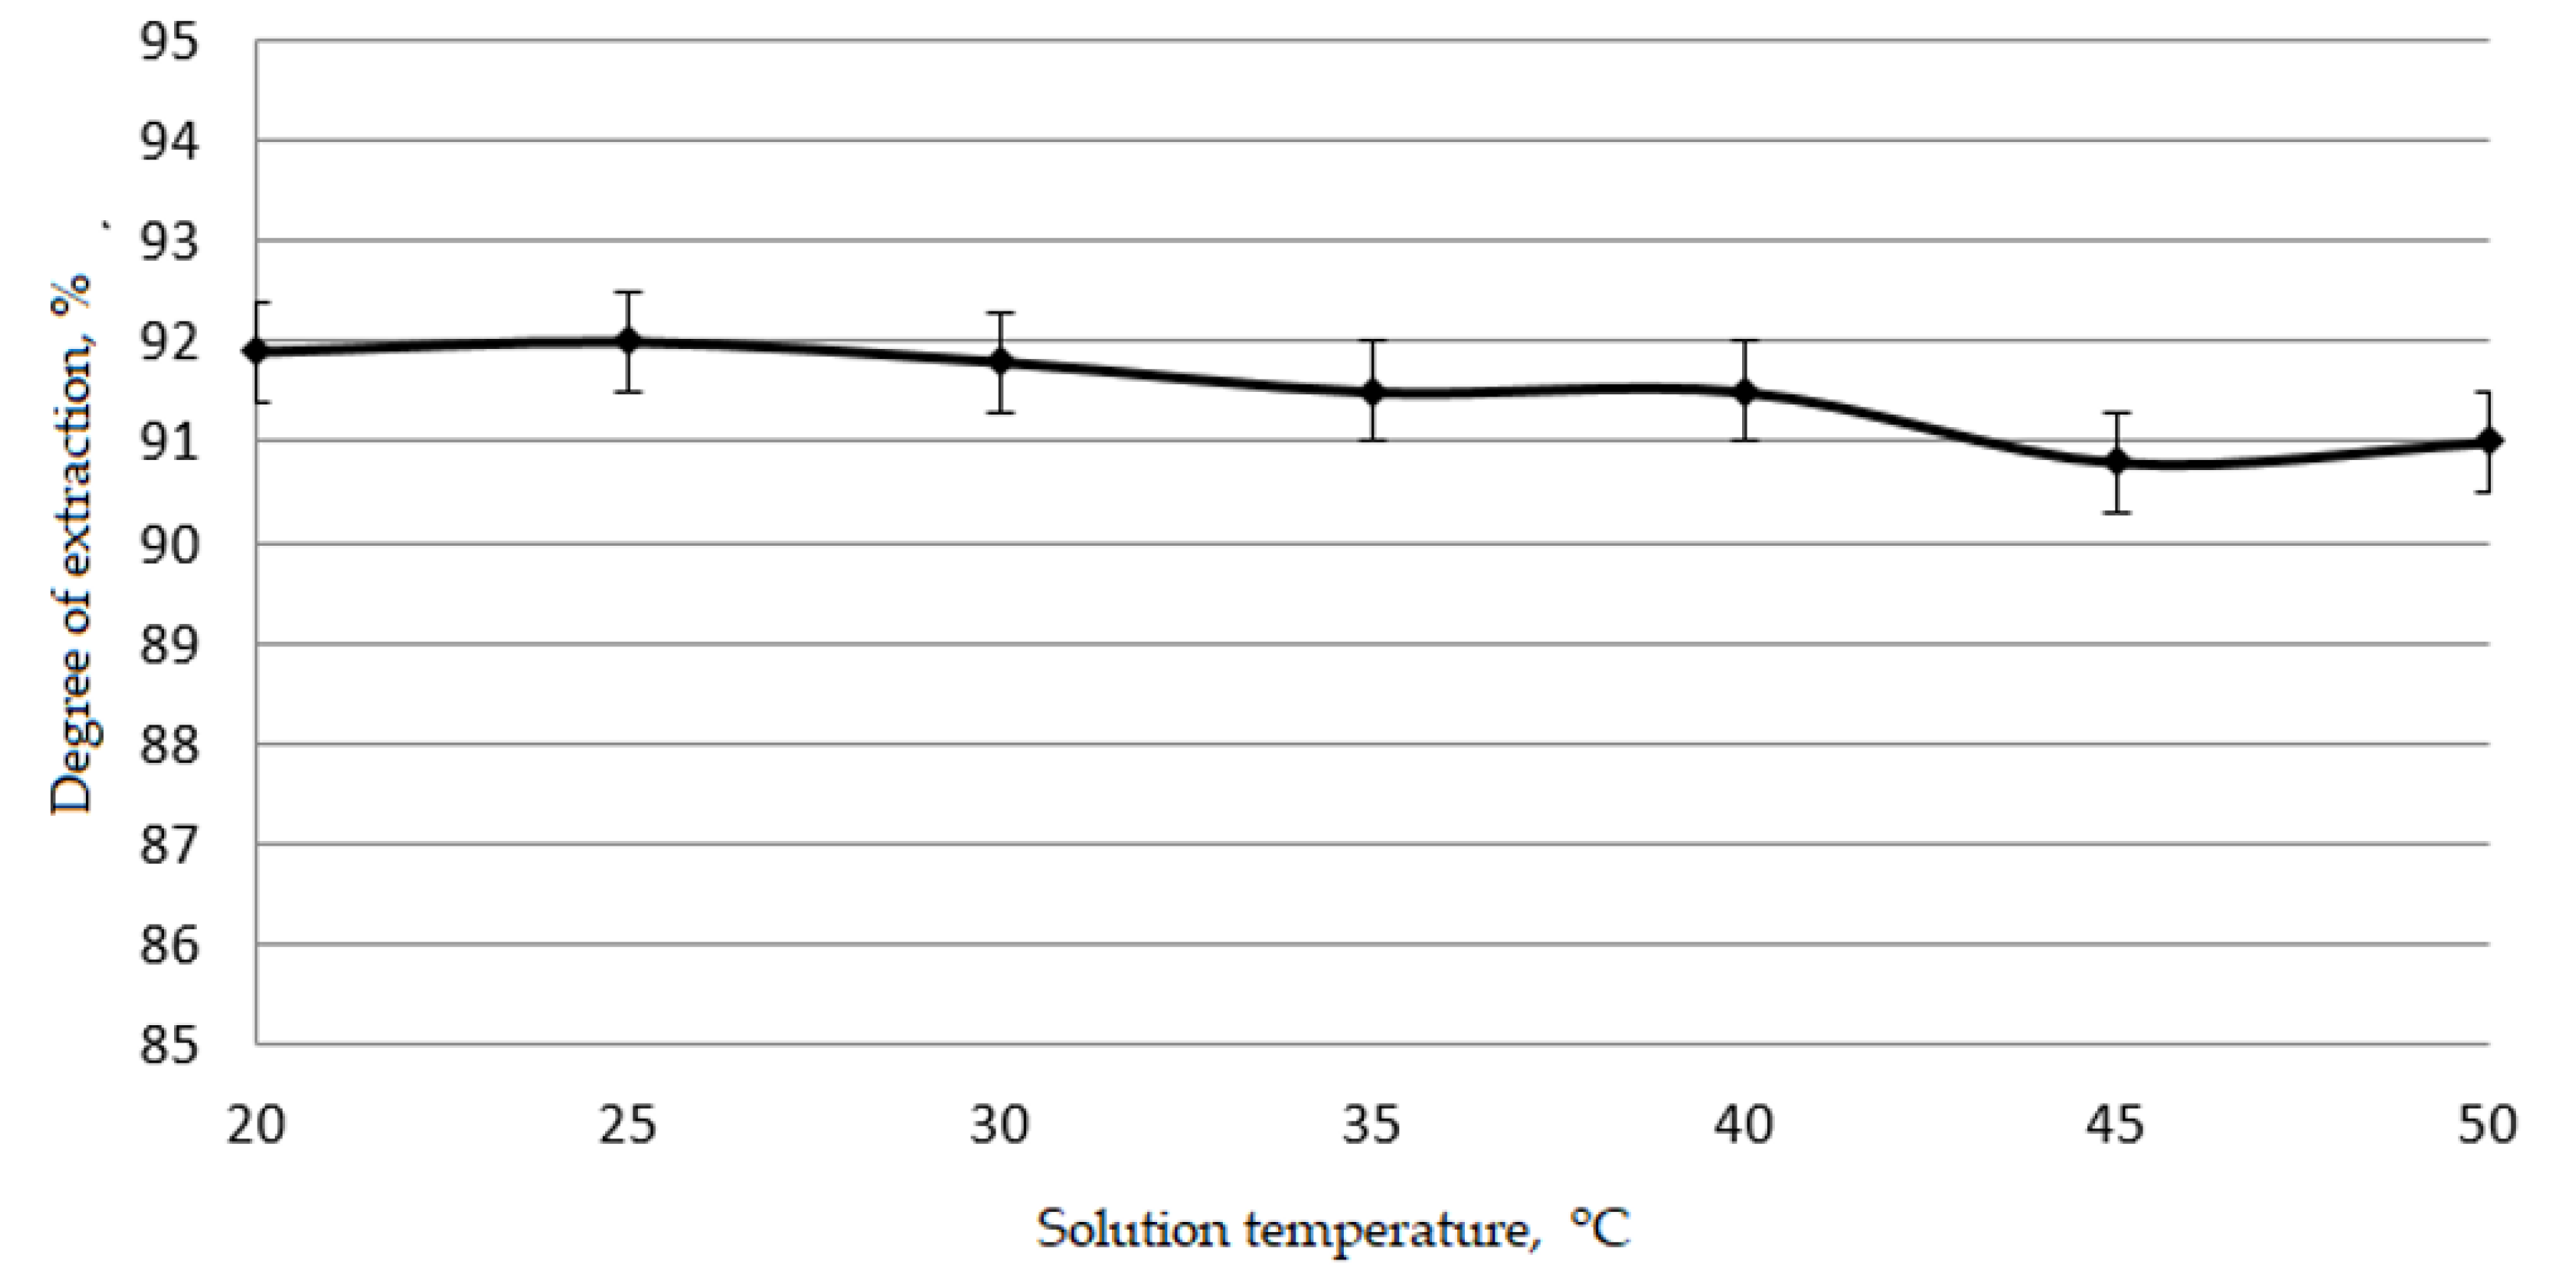
Figure 4 and
Figure 5 show the dependence of the degree of extraction of chickpea proteins and whey proteins from solutions on the temperature of the solution.
It is apparent from
Figure 4 and
Figure 5 that changing the temperature of solutions in the range of 20–50 °C does not significantly affect the yield of proteins. This can be explained by a small change in the electrical conductivity of protein solutions in the studied temperature range [
29,
30]. Therefore, all subsequent experiments were carried out at a temperature of 25 °C.
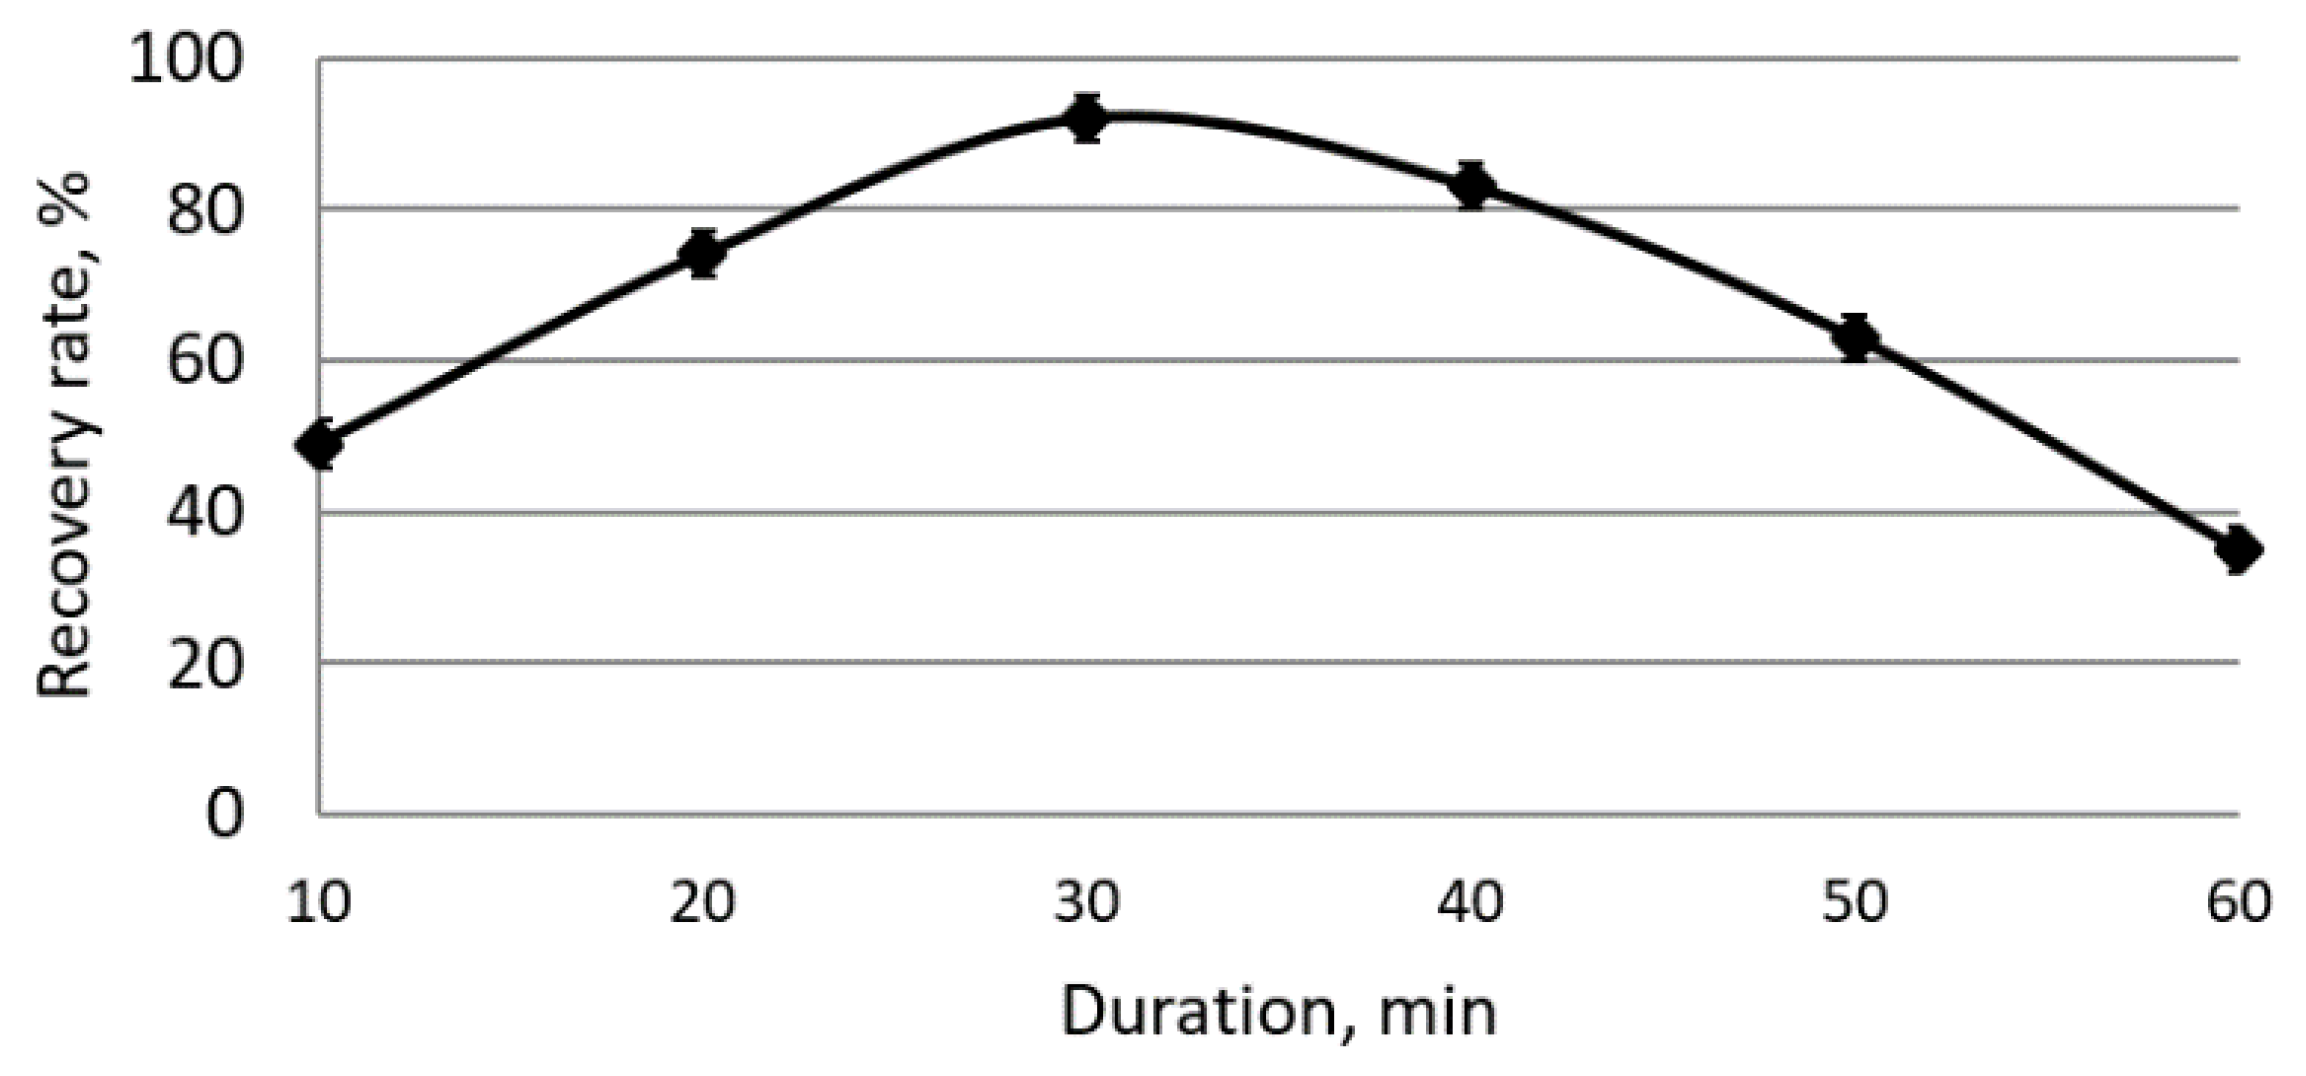
A study of the duration of electroflotocoagulation at the exit of proteins (
Figure 6 and
Figure 7) showed that the maximum degree of withdrawal from chickpea solutions, as well as from curd whey, appears after 30 min.
With a longer duration of the process, the degree of extraction begins to decrease, which can be explained by an increase in ohmic polarization on the electrodes due to the accumulation of products of accompanying processes and a change in the interface’s state. The study of the effect of the initial concentration of proteins in solutions was carried out at a current density that provides, with a process duration of 30 min, the highest degree of protein extraction.
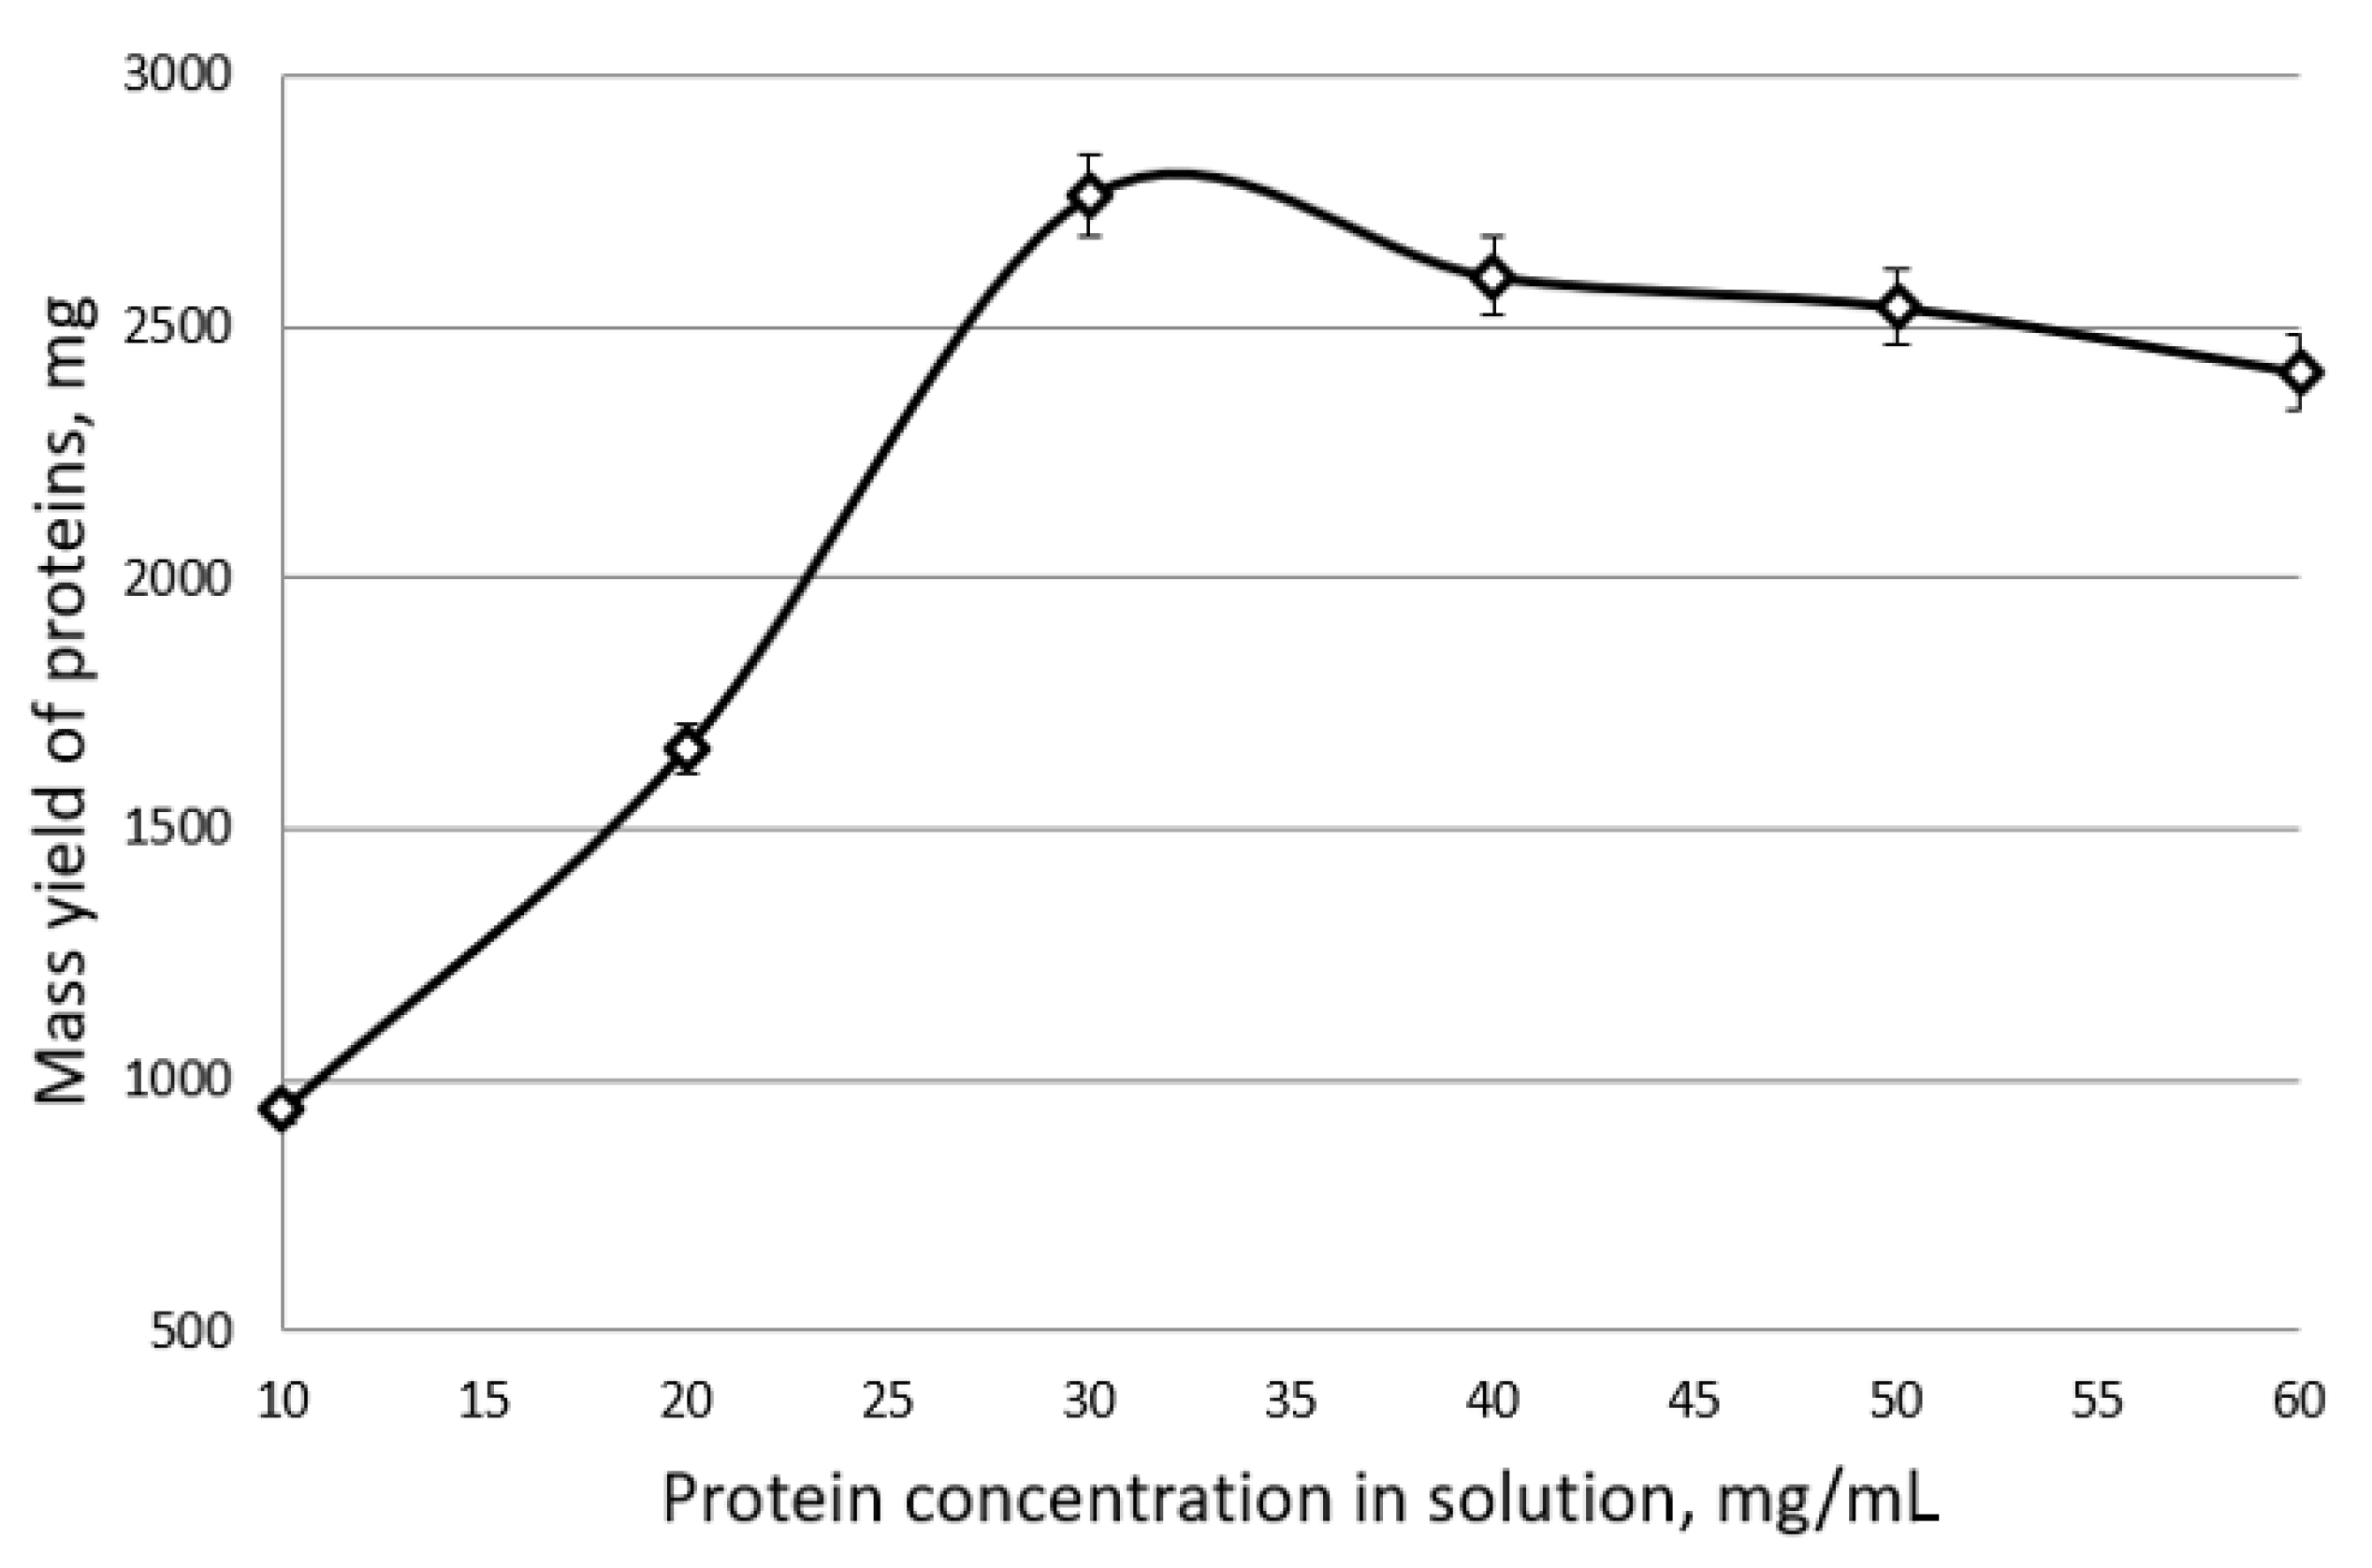
The results of the experiments are shown in
Figure 8 and
Figure 9. As the experimental data show, in a solution of chickpea proteins, the process of electroflocoagulation proceeds most efficiently at an initial concentration of 15 mg/mL. At the same time, the absolute mass yield of chickpea proteins was 1130 mg, and the degree of their extraction was 82%.
For curd whey (
Figure 9), the optimal initial protein concentration was found to be 30 mg/mL. In this case, the maximum mass yield of proteins was achieved and a high degree of their extraction (up to 92%) was ensured without re-processing the solution in an electroflotocoagulator.
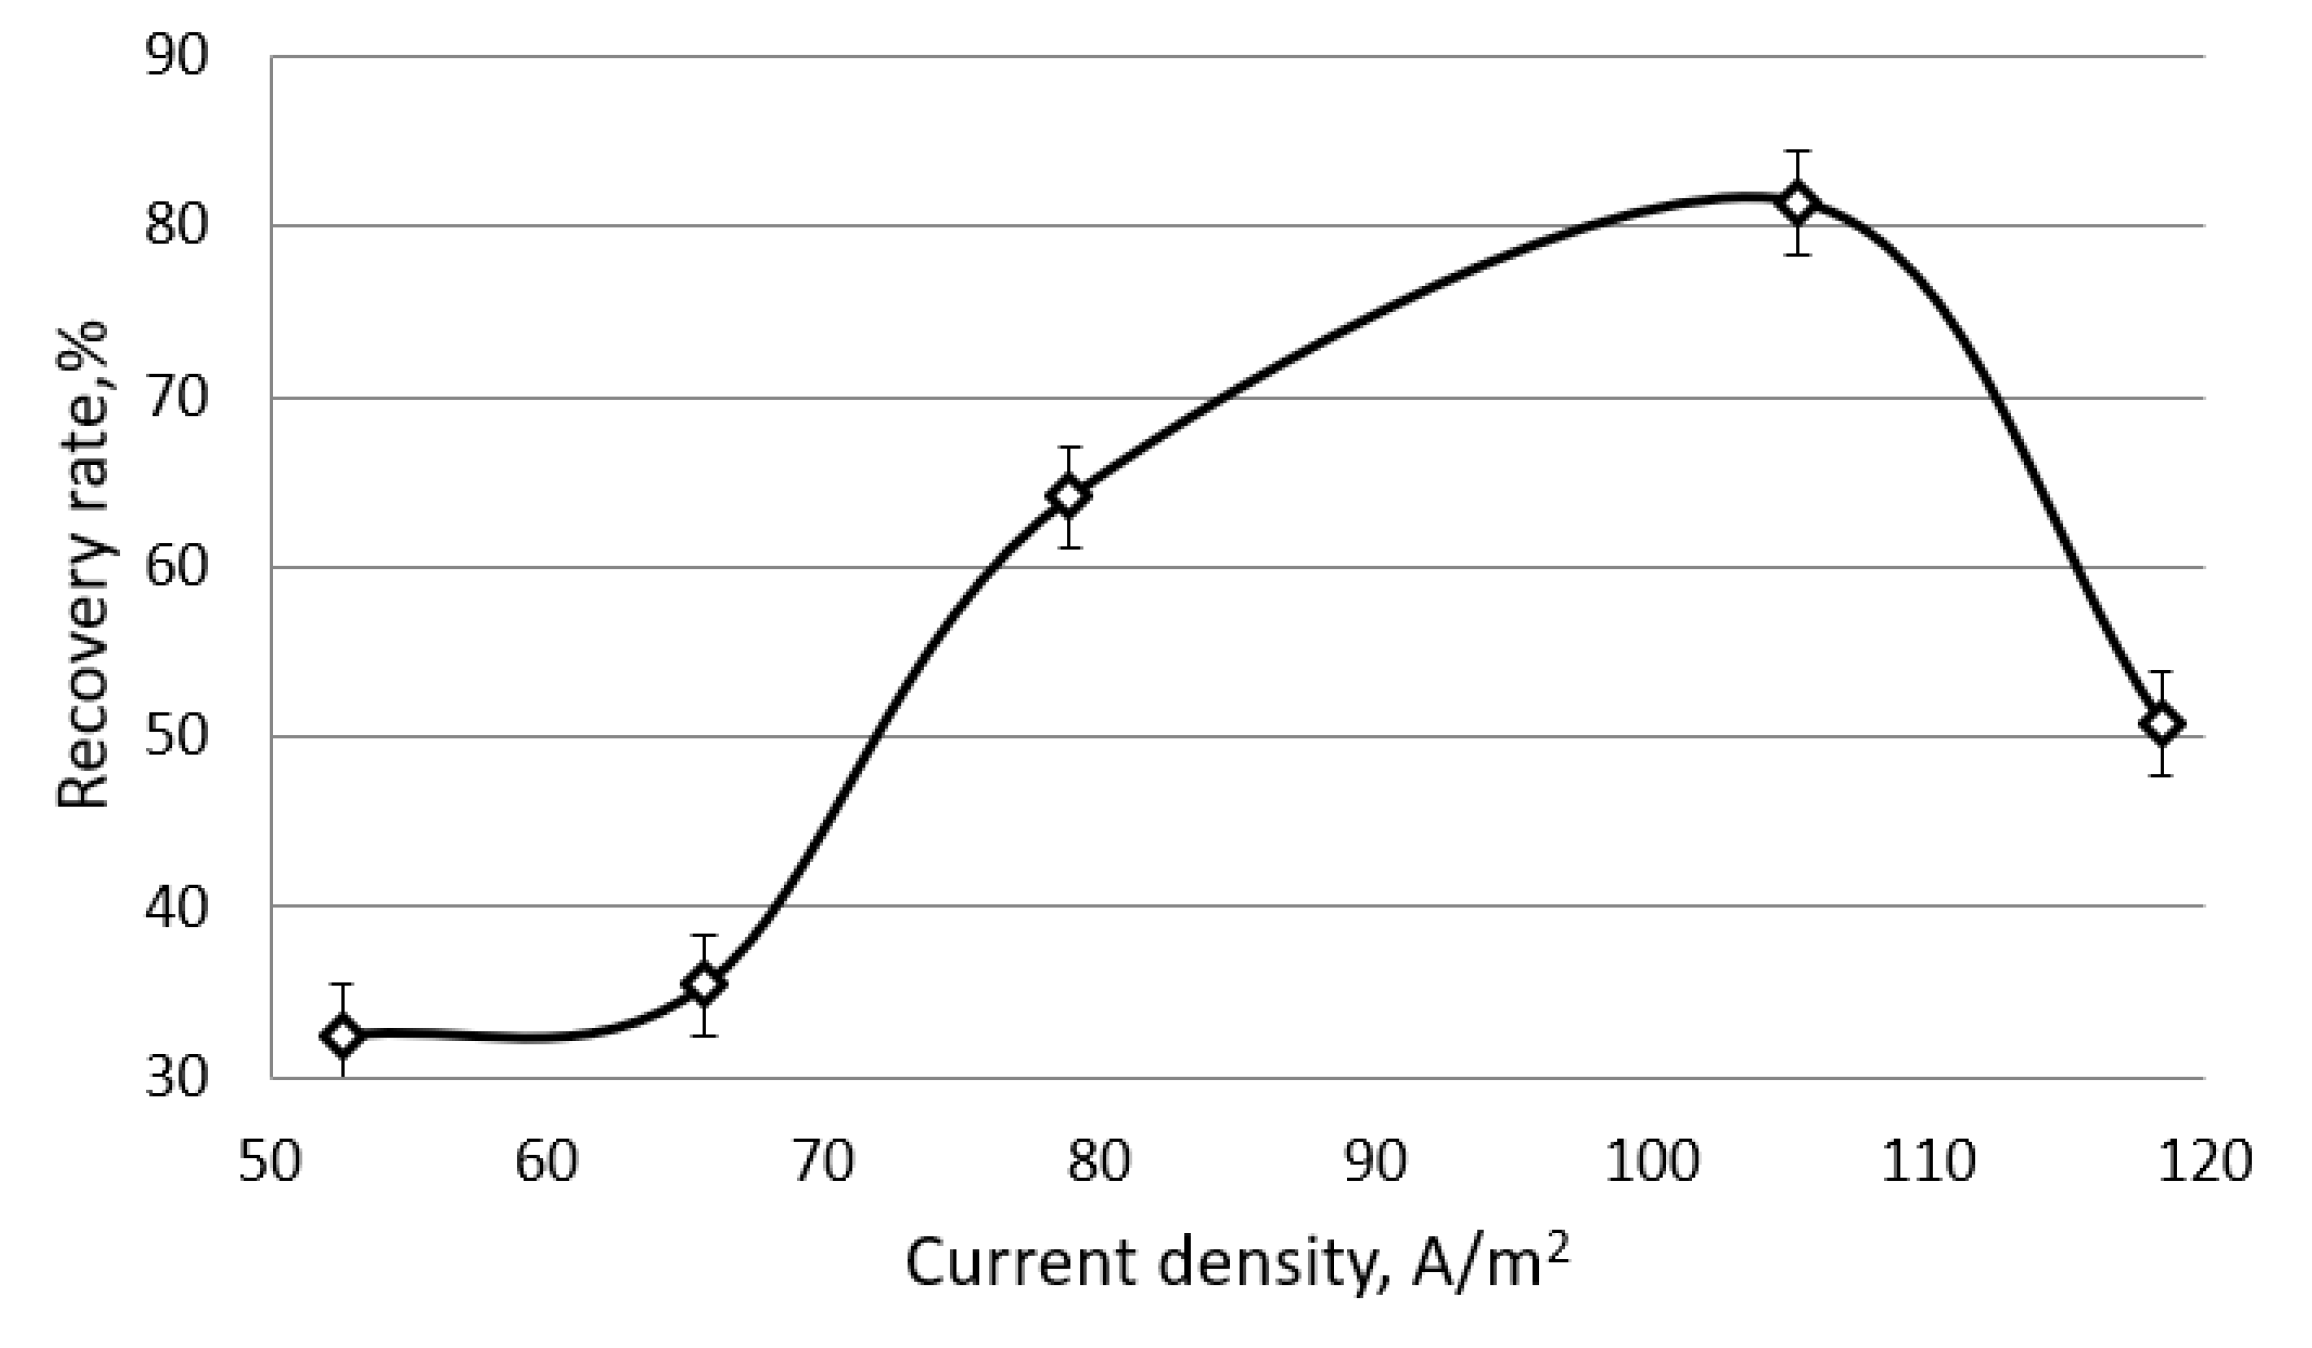
Figure 10 and
Figure 11 show the dependence of the degree of protein extraction from solutions of chickpea and curd whey on the current density at the optimal initial concentration of proteins in the solution (15 mg/mL for chickpea, 30 mg/mL for curd whey) and electrolysis time of 30 min. The analysis of the presented results shows that with an equal electrolysis time (30 min) in a three-electrode cell, the maximum yield of whey proteins reaches 92% at current densities of 180–230 A/m
2. In the case of a solution of chickpea proteins, the maximum yield reaches 82% at a lower current density ≈ of 105 A/m
2. In both cases, at lower current densities (for a chickpea protein solution, lower 70 A/m
2, for curd whey—below 100 A/m
2), there is an induction period when the degree of protein extraction does not exceed 20%. The manifestation of the induction effect can be explained by the slowness of protonation and the processes of protein adsorption on electrodes at low current loads [
23,
24,
25,
26,
27,
28,
29,
30].
At current densities higher than optimal values, the process of electrolysis of water molecules and the accumulation of adsorbed hydrogen on the electrode surface are accelerated. As a result, the fraction of the free surface available for adsorption of proteins decreases, and the yield of proteins decreases.
An increase in the degree of protein extraction with an increase in the current density to optimal values can be explained by the determining influence of an increase in the concentration of the protonated form of proteins, due to an increase in the rate of water decomposition during electrolysis.
The experimental data obtained indicate the high efficiency of the electroflotocoagulation method for extracting proteins in a three-electrode cell as applied to both chickpea protein solutions and curd whey. This allows us to speak about the universality of the studied technology, its applicability to the extraction of proteins of plant and dairy origin.
3.3. Determination of the Kinetic Regularities of the Electroflotocoagulation Process of Extracting Plant and Whey Proteins from Solutions
The development and study of the process of the electroflotocoagulation regime, which provides the highest degree of protein extraction from chickpea and curd whey solutions, required an in-depth study of the electrochemical behavior of proteins [
28,
29,
30,
31,
32,
33,
34]. For this, the method of cyclic voltammetry was used. Platinum, graphite foil, and glassy carbon electrodes were used as working electrodes. Cyclic voltammograms (cyclic potentiodynamic curves of CPC) filmed in the potential range from −2 to +2 V at a sweep rate of 10, 20, 40, 100 mV/s.
3.4. Regularities of the Adsorption-Electrochemical Behavior of Plant Proteins When the Cell Is Operating in the Electroflotocoagulation Mode
CPC solutions of chickpea proteins and their analysis are presented in
Figure 12,
Figure 13 and
Figure 14 [
35]. In the region of potentials more negative than 0.0 V up to ≈ −1.0 V, both in the cathodic and in the anodic directions of the current, current maxima are recorded on the CPC. The position of the potentials at the maximum point on the cathode branch shifts to the negative side as the sweep speed
vp increases, and to the side of less negative potentials on the anode branch. In this case, the value of the current density (
ia) at the maximum point is almost an order of magnitude higher than (
iк).
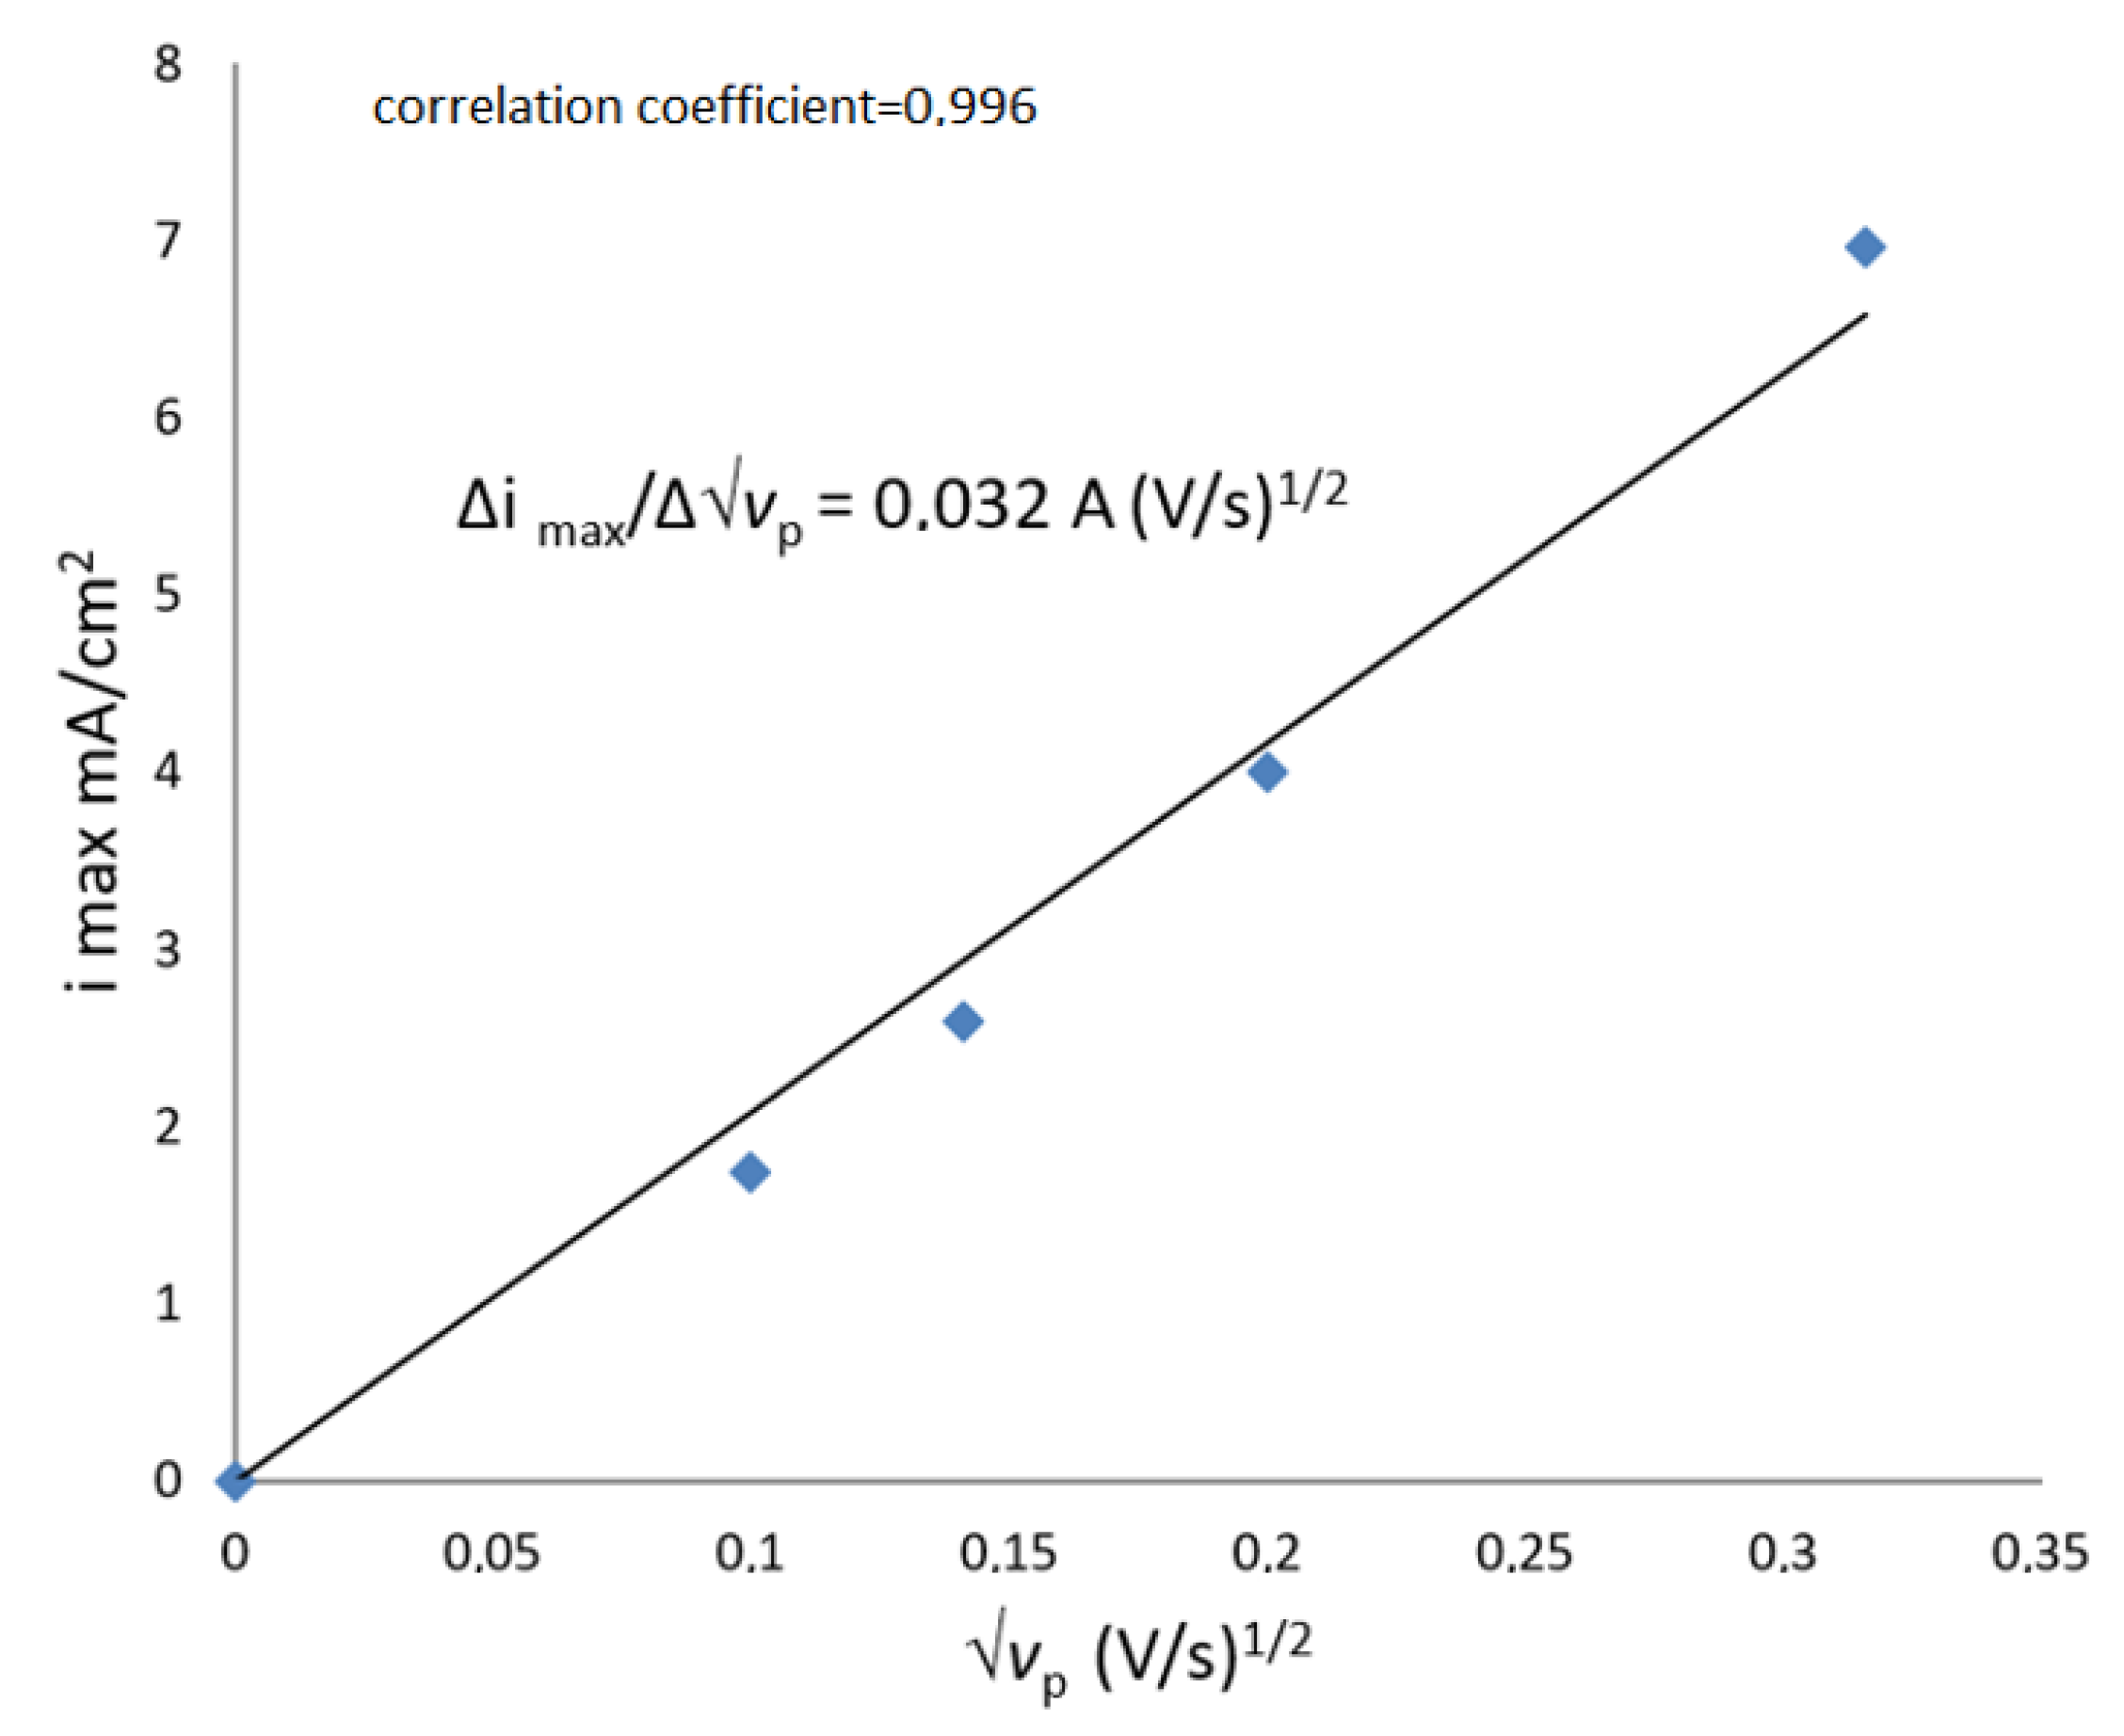
Dependencies of quantities
iк and
ia on the potential sweep speed in coordinates
imax −
√vp and potential at the maximum point CPP in coordinates
Emax −
lg vp have the form of straight lines, which are shown in
Figure 13 and
Figure 14.
Analysis of the CPC stroke (
Figure 12) shows that at the cathodic direction of the current (from
Encb = 0.06 V to
E = −2 V), the current density at the maximum point decreases according to the series: 0.94; 0.45; 0.28; 0.25 mA/cm
2 as the potential sweep speed decreases
vp: 100, 40, 20 и 10 мV/c. When the direction of the current changes (after reaching the potential −2 V) an almost linear decrease in the cathodic current density is observed (for example, at
vp = 100 mV/s from ≈14 mA/cm
2 (E = −2 V) to zero (E = −0.94 V)), and the transition of the process to the anodic region, where the maximum cathodic current corresponds to the maximum at the CPC of the anodic stroke
imax ≈ 5.5 mA/cm
2 at
E ≈ −0.4 V and current delay (in the area
E ≈ −0.1 V current density reaches
i ≈ 2 mA/cm
2 and goes down to ≈0.9 ± 0.1 mA/cm
2 in capacities from +0.35 to 1 V). Then a new practically linear increase in the anode current density begins with the coefficient (∆
i/∆
E) = 2.5 мA/(V⋅cm
2) (at
vp = 100 мV/s).
Potential reversal upon reaching
E = +2 V on the electrode starting with E =≈ +1.4 V, a passive state is established: the current density remains close to zero up to the initial
Encb = 0.06 V. A similar nature of the CPC remains on the working electrode at all potential sweep rates (
Figure 12).
The value
imax in the anodic region decreases as the potential sweep rate decreases
vp, and the potential at the maximum point shifts to the region of more negative values. The dependence of
imax and
Emax on the value of
vp is presented in
Figure 13 and
Figure 14 in coordinates, respectively,
imax − √
vp and
Emax −
lg vp and have the form of straight lines.
In a solution with a protein concentration of 15 mg/mL, the slope coefficients are, respectively, equal:
For processes controlled by diffusion mass transfer,
At solution temperature t = 25 °C
By the slope of the straight line Δ
imax − Δ(√
vp), the value of the mass transfer coefficient of potential-determining protein particles (
c√
D) can be determined from the expression:
The potential difference
Emax/2 −
Emax can be calculated by the equation:
where
Emax—current potential at the maximum point, V; a
Emax/2—corresponds to the potential at which the current reaches the value 1/2
imax.
At solution temperature
t = 25 °C expression (6) takes the form:
For electrochemical processes during the electrolysis of protein solutions, knowledge of the value (
Emax −
Emax/2) allows one to determine the apparent transfer coefficient (
αnα):
The value αnα can be determined from the slope of the graphical dependence of Emax or Emax/2 on lg vp.
From expression (18), one can determine the rate constant
ks:
From the graphical processing of the experimental data, it was found that:
Substituting into the Formula (6) the value from Formula (20), we obtain that = 1.16. It follows from this that only one electron is involved in the process of charge transfer from the electrode to the solution.
3.5. Regularities of the Adsorption-Electrochemical Behavior of Curd Whey Proteins When the Cell Is Operating in the Electroflotocoagulation Mode
Cyclic voltammograms of solutions of curd whey proteins and the results of their analysis are presented in
Figure 15,
Figure 16 and
Figure 17.
It is seen that for the cathodic direction of the current (from
Encb = 0.1 V to
E = −2 V) on a CPC with a Pt electrode (
Figure 15) in a solution of curd whey in the potential range from ≈−0.5 V to ≈−1.0 V, a maximum is recorded. Accordingly, the decreasing potential sweep rate
vp: 100, 40, 20, 10 mV/s, the current density at the maximum point also decreases and amounts to 7.5; 4.9; 3.0; 2.2 mA/cm
2.
When the direction of the current changes at the reversal point (E = −2 V), there is an almost linear decrease in the current density from ≈28 mA/cm2 at the point (E = −2 V) at vp = 100 mV/s to zero at the point (E = −0.10 V) and the process passes into the anodic region, where the current maxima are less pronounced, and the current density is an order of magnitude lower in magnitude (imax ≈ 0.75 mA/cm2 at E ≈ −0.76 V and vp = 10 mV/s and reaches i ≈ 2.94 mA/cm2 at vp = 100 mV/s). In the potential region more positive than 1 V, an almost linear increase in the anode current density is characterized by the coefficient (∆i/∆E) = 11.7 mA/(V⋅cm2) (at vp =100 mV/s).
Potential reversal at point
E = +2 V decrease in current density to values at the electrode, starting from
E ≈ +0.95 V, close to zero, indicates the establishment of a passive state. A similar character of CPC is retained on the
Pt—electrode in the investigated solutions at all potential sweep rates (
Figure 15).
The value of imax in the anodic region decreases as the potential sweep rate vp decreases, and the potential at the maximum point shifts to the region of more negative values.
The dependence of
imax and
Emax on the value of
vp is shown in
Figure 16 and
Figure 17 in coordinates, respectively,
imax − √
vp and
Emax −
lg vp and have the form of straight lines.
In a solution with a whey protein concentration of 30 mg/mL, the slope coefficients are, respectively, equal to:
For both the chickpea protein solution and the curd whey solution, the characteristic quantity is
Emax and
Emax/2:
Considering that for a reversible process limited by the rate of mass transfer (Formula (7)) (Emax/2 − Emax c ≥ 60 mV), as noted above, we can conclude that one electron should participate in the charge transfer stage.
Analysis of the potential difference between the four peaks on the forward and backward CPC, as in the case of chickpea proteins, shows that its value increases as the unwinding rate decreases, which indicates an increase in the protein adsorption energy on the electrode.
3.6. Regularities of the Adsorption-Electrochemical Behavior of a Mixture of Solutions of Plant and Whey Proteins at Their Various Volumetric Ratios
Figure 18,
Figure 19 and
Figure 20 show the CPC on the Pt-electrode for a mixture of solutions of chickpea proteins and curd whey at different ratios (4/1, 3/2, 1/1, 2/3, 1/4).
Analysis of the obtained voltammograms showed that the most intense adsorption of proteins on the electrode surface occurs at the ratios 4/1 and 1/4.
So, with a ratio of 4/1 in the potential range from ≈−1 V to ≈0.5 V, in the series of growth of the potential sweep rate vp: 10, 20, 40, 100 mV/s, peak current density imax increases by almost 4-6 times in the indicated row vp: 1.37; 1.83; 3.39; 6.96 mA/cm2.
With a ratio of 1: 4, imax takes on the value:1,05; 1,55; 3,17; 4,60 mA/cm2 with an increase in the potential sweep speed in the series: 10, 20, 40, 100 mV/s.
In both cases, when the direction changes after the potential reversal at the point E = −2 V, there is an almost linear decrease in the cathodic current density. For example, for vp = 100 mV/s current density falls from 29.2 mA/cm2 (E = −2 V) to zero (E = −0.61 V) (for volumetric ratio 4/1) and, respectively, with 18.8 mA/cm2 (E = −2 V) to zero (E = −0.77 V) (for volumetric ratio 1/4).
At a ratio of 1/4, before the transition to the region of anode potentials, the limiting cathodic current corresponds to the following values of the maxima on the CPC: at E ≈ −0.31 V − imax ≈ 6.96 mA/cm2, at E ≈ −0.48 V − imax ≈ 4.6 mA/cm2. Upon reaching the potential E ≈ 0.5 V current density reaches I ≈ 1.9 mA/cm2 and goes down to ≈1.2 ± 0.1 mA/cm2 at E = 0.98 V.
At a ratio of 4/1 at E = 0.15 V, the current density reaches the value i ≈ 3.6 mA/cm2 and goes down to ≈1.4 mA/cm2 at E ≈ 0.98 V.
In both cases, upon reaching a potential of 0.98 V, an almost linear increase in the anode current density begins again with a slope coefficient (∆i/∆E) = 10.1 мA/(V⋅cm2) (at vp = 100 mV/s) (for the ratio 4/1) and with (∆i/∆E) = 7.3 мA/(V⋅cm2) (for the ratio 1/4). With potential reversal at point E = +2 V the value of the current at the electrode decreases, and upon reaching E ≈ +1.0 V, a passive state is established on the electrode. The current density remains close to zero up to the initial = 0.31 V (for the ratio 4/1) and to = 0.22 V (for the ratio 1/4). This allows us to assert that the rate of the electrochemical process in the considered potential region is limited by the stage of diffusion in the adsorption layer of protein molecules.
It is apparent from
Figure 21,
Figure 22 and
Figure 23 that the value of
i max in the anodic region decreases as the potential sweep speed
vp decreases, and the potential at the maximum point shifts to the region of more negative values.
In
Figure 21,
Figure 22 and
Figure 23, the dependence of
imax и
Emax on the value of
vp is presented in coordinates, respectively,
imax − √
vp and
Emax −
lg vp and have the form of straight lines.
The values of the slopes of these straight lines, obtained in experiments with a
Pt—electrode on solutions of chickpea proteins and curd whey at various ratios of their volumes, are presented in
Table 6.
It should also be noted that in the series of studied volumetric ratios of solutions of two proteins (4/1, 3/2, 1/1, 2/3, 1/4), the concentration of total proteins extracted from the solution increases.
The analysis of the results given in
Table 6 shows that for all the studied protein solutions there are different values of the characteristic coefficients. This indicates a different intensity of the processes of electroflotocoagulation in different protein solutions.
The high value of the coefficient in all cases indicates that the process of interaction of proteins with the electrode proceeds according to the adsorption mechanism and is limited by the diffusion of hydrogen in the solid phase.
The data obtained are in good agreement with the fact that protonation (deprotonation with a change in the current direction) of amino acid fragments of protein molecules occurs during electrolysis, accompanied by changes in the structure of protein molecules, their agglomeration. As a result of protein agglomeration, the free surface of the electrode opens, the adhesion of protein agglomerates to the surface weakens, the rate of hydrogen evolution increases, and, accordingly, the flotation activity of gas bubbles increases. From this standpoint, the nature of the electrode material and the degree of defectiveness of its structure should play an important role.
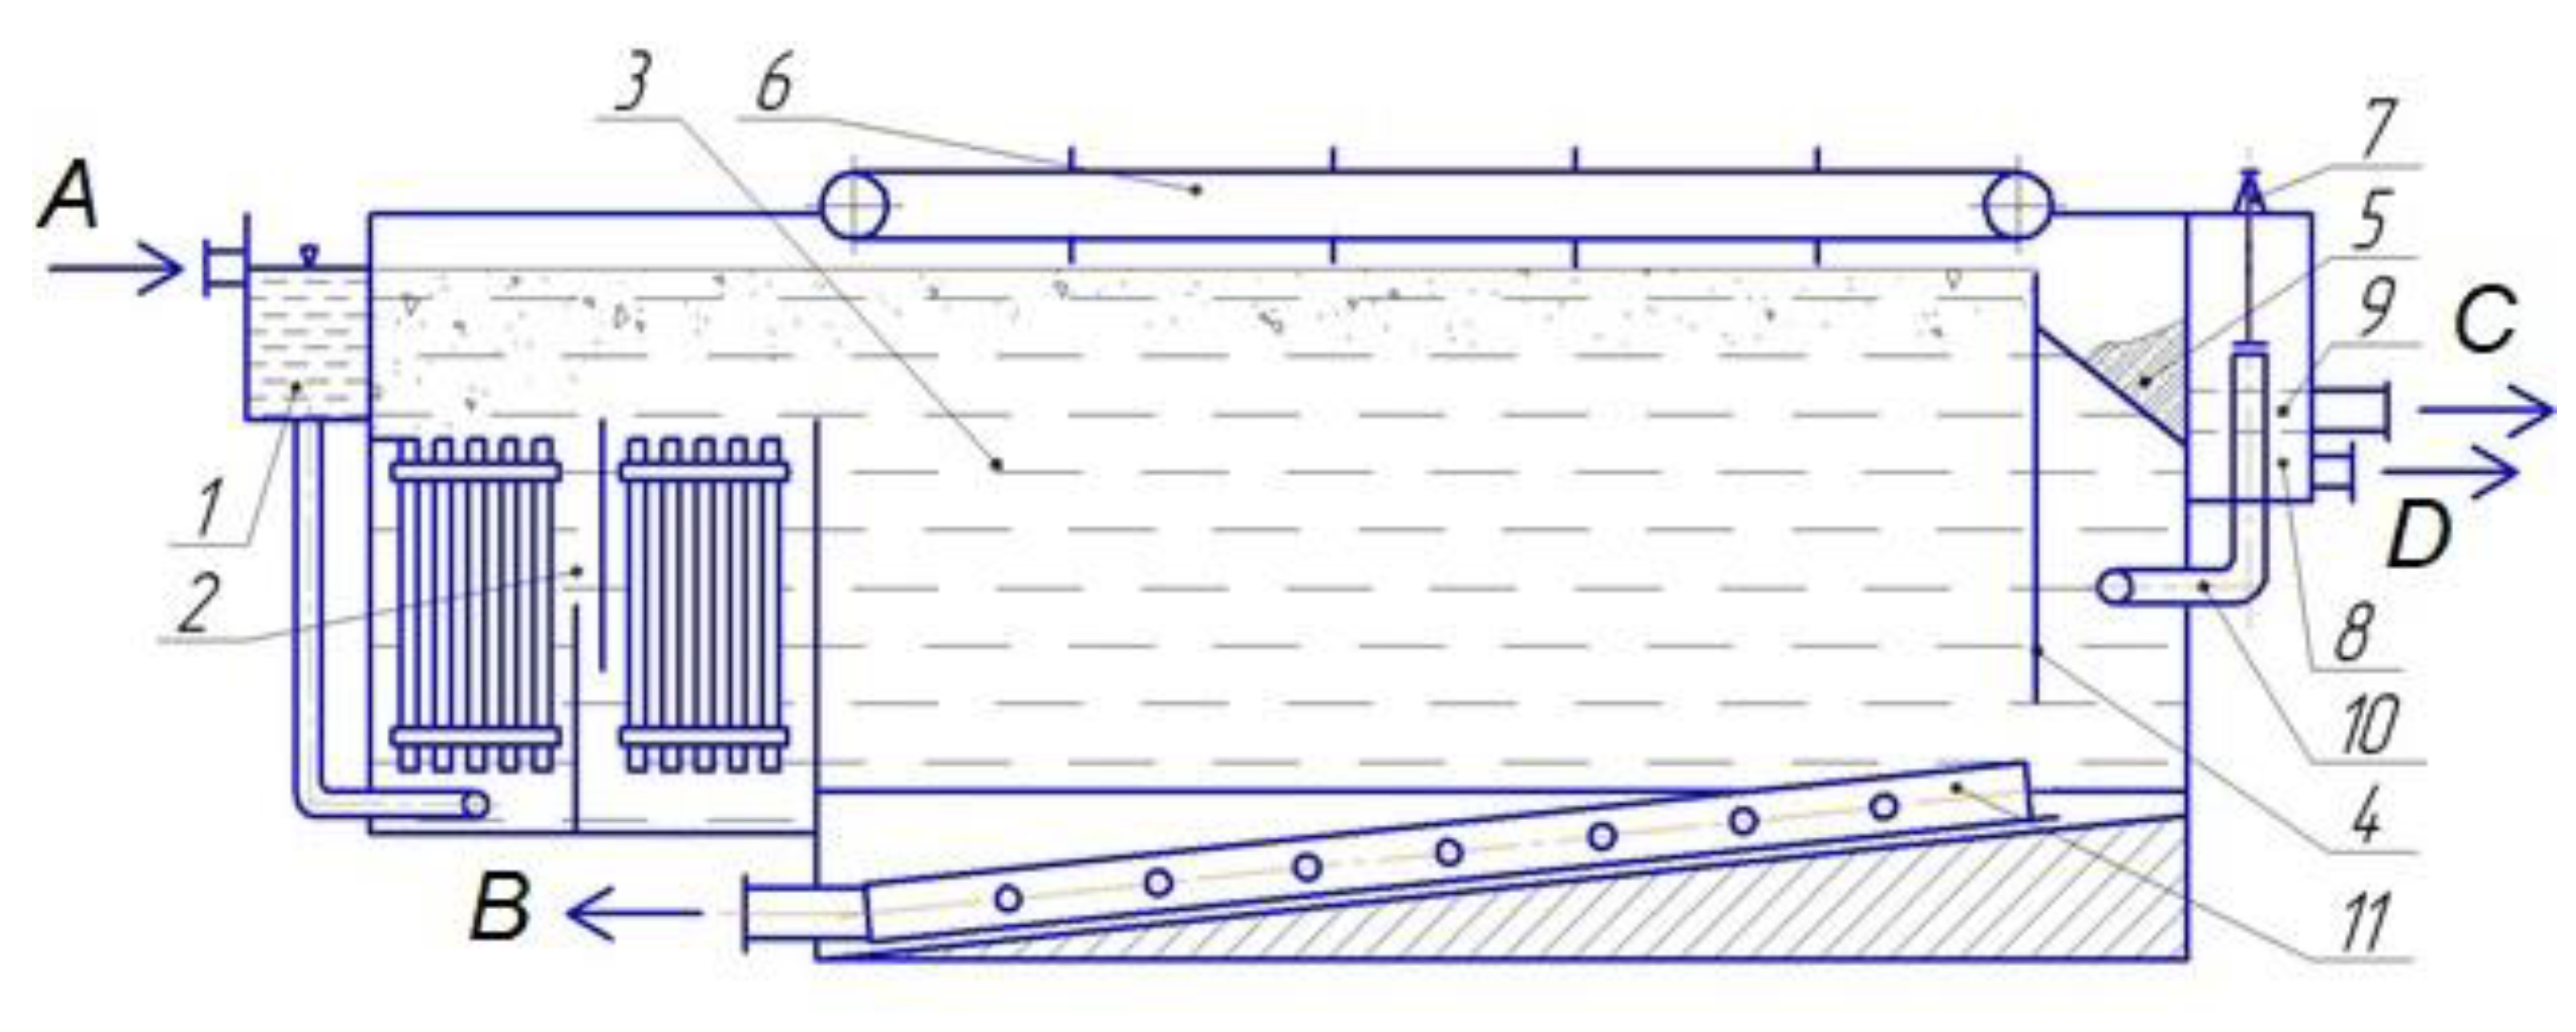
3.7. Development of an Electroflotation Coagulation Unit for Protein Extraction from Solutions
To implement the electroflotocoagulation method for extracting proteins from their solutions, an installation was developed [
33], the scheme of which is shown in
Figure 24.
The supply of the protein solution is carried out through the distribution system 1, from which the solution is fed into a two-chamber electrolyzer with electrodes 2. The electrolyzer chambers are separated by a partition to lengthen the solution movement path. In the process of electrolysis, protein flakes rising to the surface of the liquid are transported by a scraper mechanism 6 to the collection system of protein flakes 5. The liquid, in the process of moving through the flotation separation chamber 3, transfers the coagulated protein from the electrolyzer 2 to the lower part of the flotation separation chamber 3. The proteins settle in the flotation separation chamber and are discharged using the collection system 11. The clarified solution, crossing the semi-submerged partition 4, through the collection system 10 enters chamber 9, where the pressure and liquid level are controlled by device 7.
In the proposed design, due to implementing the upward and downward movement of the solution, as well as the multi-chamber design of the electrolyzer, a deeper extraction of proteins from the solution is achieved.
The main compartment that ensures high efficiency of protein extraction is a multi-chamber electrolyzer 2. Experiments have shown that the proposed design allows two processes to be carried out simultaneously: a change in the dispersed state of proteins as a result of coagulation under the action of an electric current and the fixation of electrolytic gas bubbles on the surface of coagulated protein particles, which ensures their subsequent flotation [
35].
The joint flow of two processes is achieved because of the cascade arrangement of vertical electrodes in blocks of two cathodes and one anode located strictly in the center between the cathodes. The electrodes are made in the form of glassy carbon plates.
In the electrode block (
Figure 25) there are three electrodes (two cathodes 2 and one anode 1 strictly in the center between the cathodes) with a strictly specified vertical arrangement. The electrodes are made in the form of glassy carbon plates with geometric characteristics: working height H1, width H2 and ratio H1:H2 = 1.5:1, electrode thickness δ and interelectrode gaps B = 2–2.5·δ.
The installation of an additional cathode makes it possible to increase the working area of the plates and the current load, which significantly affects the efficiency of the extraction of the dispersed phase and contributes to an increase in the yield of proteins, while reducing the destructive effect on the electrodes.
The electrodes are attached to the upper part of the chamber by means of a dielectric grid 3. The upper ends of the electrodes protrude beyond the grid and are provided with contacts 4 for connection to the electric circuit.
3.8. Technology for Obtaining Chickpea Protein Isolate and Whey Protein Concentrate Using an Electroflotation Coagulation Unit
For the purpose of industrial implementation of the results obtained, we present a technological scheme for the production of chickpea protein isolate and whey protein concentrate using an electroflotation coagulation unit [
23,
24,
25,
26,
27,
28].
Figure 26 shows a technological scheme for the production of chickpea protein isolate using an electroflotation coagulation unit [
23,
24,
25,
26,
27,
28,
29,
30,
31,
34,
35].
In accordance with the proposed technological scheme, chickpea beans (feedstock) coming from the hopper, shown at 1, are cleaned of large and small impurities on a vibrating separator, shown at 2. The sieve body of the separator has two tiers of sieves: sorting and undersowing. The sieves are cleaned with rubber balls during operation. Vibration of the body is carried out by electric vibrators. Further, the final cleaning of the beans is carried out on a pneumosorting machine, shown at 3. Cleaning is carried out by air flow and is based on the difference in the soaring speeds of the beans of the main crop and impurities. Chickpeas cleaned of impurities are fed into the hopper, shown at 4. Then, the beans are sent to the hammer crusher, shown at 5, where they are crushed by blows of hammers hinged on a rapidly rotating rotor. Chickpea grist is fed into the cyclone, shown at 8, by a pneumatic transport system and enters the dosing hopper, shown at 7. Then the grist is sent for extraction.
Extraction of chickpea oil with a solvent is carried out in a rotary extractor, shown at 6, with a vertical axis of rotation, in which the grains are in contact with the solvent. Diethyl ether is used for extraction. After the extraction process, the solvent is separated from the oil micelle in a tubular film distiller, shown at 10, heated with steam. The resulting oil is sent for further processing, and the solvent is removed for regeneration and further use as an extractant. Pro-extracted (defatted) chickpea meal may contain some ether when leaving the extractor, so it must be removed.
The distillation of the solvent from the meal is carried out in a screw evaporator, shown at 11, which has eight screws. The meal moistened with the solvent is fed from the extractor to the upper evaporator screw; during this process, it is heated through the wall of the steam jacket with deaf steam. As a result, part of the solvent and moisture evaporates and is discharged into the first meal trap, where, due to a drop in the steam flow rate, the meal particles are precipitated, then carried away by vapor from the evaporation screws. Having passed the first section of the evaporator, the meal enters the second section, where, with the help of dull and sharp steam supplied inside the screws, the solvent evaporates completely. The ether and water vapors from this section leave through the second sieve trap. The finished meal is sent through a sluice gate to the conveyor and from there to conditioning (in terms of humidity and temperature).
Next, the defatted meal is crushed on a 12 disc crusher. The defatted chickpea flour is fed into the cyclone, shown at 8, by a pneumatic transport system and enters the dosing hopper, shown at 7. The gear pump, shown at 15, pumps the resulting suspension into a precipitating horizontal centrifuge, shown at 16, where the suspension is separated into an extract of proteins and an insoluble residue. The meal (insoluble residue) is removed from the centrifuge and can be sent for further processing.
The protein extract is fed by the pump, shown at 15, to electroflotation coagulator, shown at 17, where proteins are deposited at the isoelectric point and extracted from the extract by electroflotation coagulation. Waste water (purified solution) is removed and sent for treatment. The protein precipitate is sent to the roller dryer, shown at 19, by the screw pump, shown at 18. By means of special rollers, the product is applied to the outer surface of the drum in a thin layer. After each revolution of the drum, the dried product is removed in the form of a film with the help of knives. Then, the finished product passes through the disc crusher, shown at 12, and cyclone, shown at 8, and accumulates in the packing batcher bunker, shown at 20, which packs the finished chickpea protein isolate into 20 kg bags. The packaged product is sent to the warehouse.
4. Conclusions
Currently, the search for more efficient ways of processing raw materials is relevant, allowing the introduction of resource-energy-saving, environmentally friendly technologies and a new generation of mathematical models into production processes.
These are, first of all, electrophysical and electrochemical methods of processing liquid media, among which methods of electroflotation and electrocoagulation can be distinguished. This article presents the development of a design for a three-electrode electrolyzer for extracting vegetable and milk proteins from solutions using a complex method of electroflotation coagulation. The main regularities have been studied and the fundamental possibility of highly efficient extraction of vegetable and milk proteins by the complex method of electroflotation coagulation has been experimentally proved.
The optimal parameters of the electroflotocoagulation process for solutions of chickpea proteins and curd whey have been revealed. It was found that the maximum efficiency of protein extraction is achieved at a current density ~105A/m2 (for chickpea protein solutions) and ~210 A/m2 (for whey protein solutions) and process duration of 30 min. It has been shown that a change in the temperature of protein solutions in the range of 20–50 °C does not significantly affect the efficiency of protein extraction.
A continuous operation unit for the extraction of proteins from food solutions has been developed, in which the method of electroflotation coagulation with reagent-free pH adjustment of the medium is implemented.
The results obtained evaluate useful information, not only for food producers, but also for legume producers for selection with parameters.
The expediency and prospects of using chickpea protein isolates obtained by electroflotation coagulation, which can be used in the technology for the production of sausages and vegetable canned goods with a low gluten content and reduced calorie content, are shown.
In the future, it is planned to conduct a number of studies and field experiments to improve the technology of highly efficient extraction of vegetable and milk proteins by a complex method of electroflotation coagulation. It is also planned to develop technological recommendations for the introduction of protein isolates in the formulation of gluten-free food products based on the results obtained.


 ,
, 


