
CAC: A Learning Context Recognition Model Based on AI for Handwritten Mathematical Symbols in e-Learning Systems


Abstract
:1. Introduction
2. Related Work
2.1. Handwritten Mathematical Expression Recognition
- Geometric convex hull constraint, A-star completion estimate, book-keeping [7]
- Simultaneous segmentation and recognition through hidden Markov model (HMM) approach [8]
- Simultaneous segmentation and recognition through probabilistic context-free grammar [9]
- Gaussian mixture model, bidirectional long short-term memory (BLSTM) and recurrent neural network (RNN), two-dimensional probabilistic context-free grammars [10]
- BLSTM, Cocke–Younger–Kasami algorithm (CYK) [11]
2.2. Pre-Existing Handwritten Mathematical Expression Recognition Models
3. LC Data
3.1. Composition of Learning Contents
3.2. Extracted Symbol and Input Position
3.3. LC Data from e-Learning System
- is the learning topic that the learner is studying when is input.
- is the question that the learner is solving when is input.
- is the solving process of the question that the learner is solving when is input.
- is the correct answer of the question that the learner is solving when is input.
- The input position is the value indicating which type of learning part is input in.
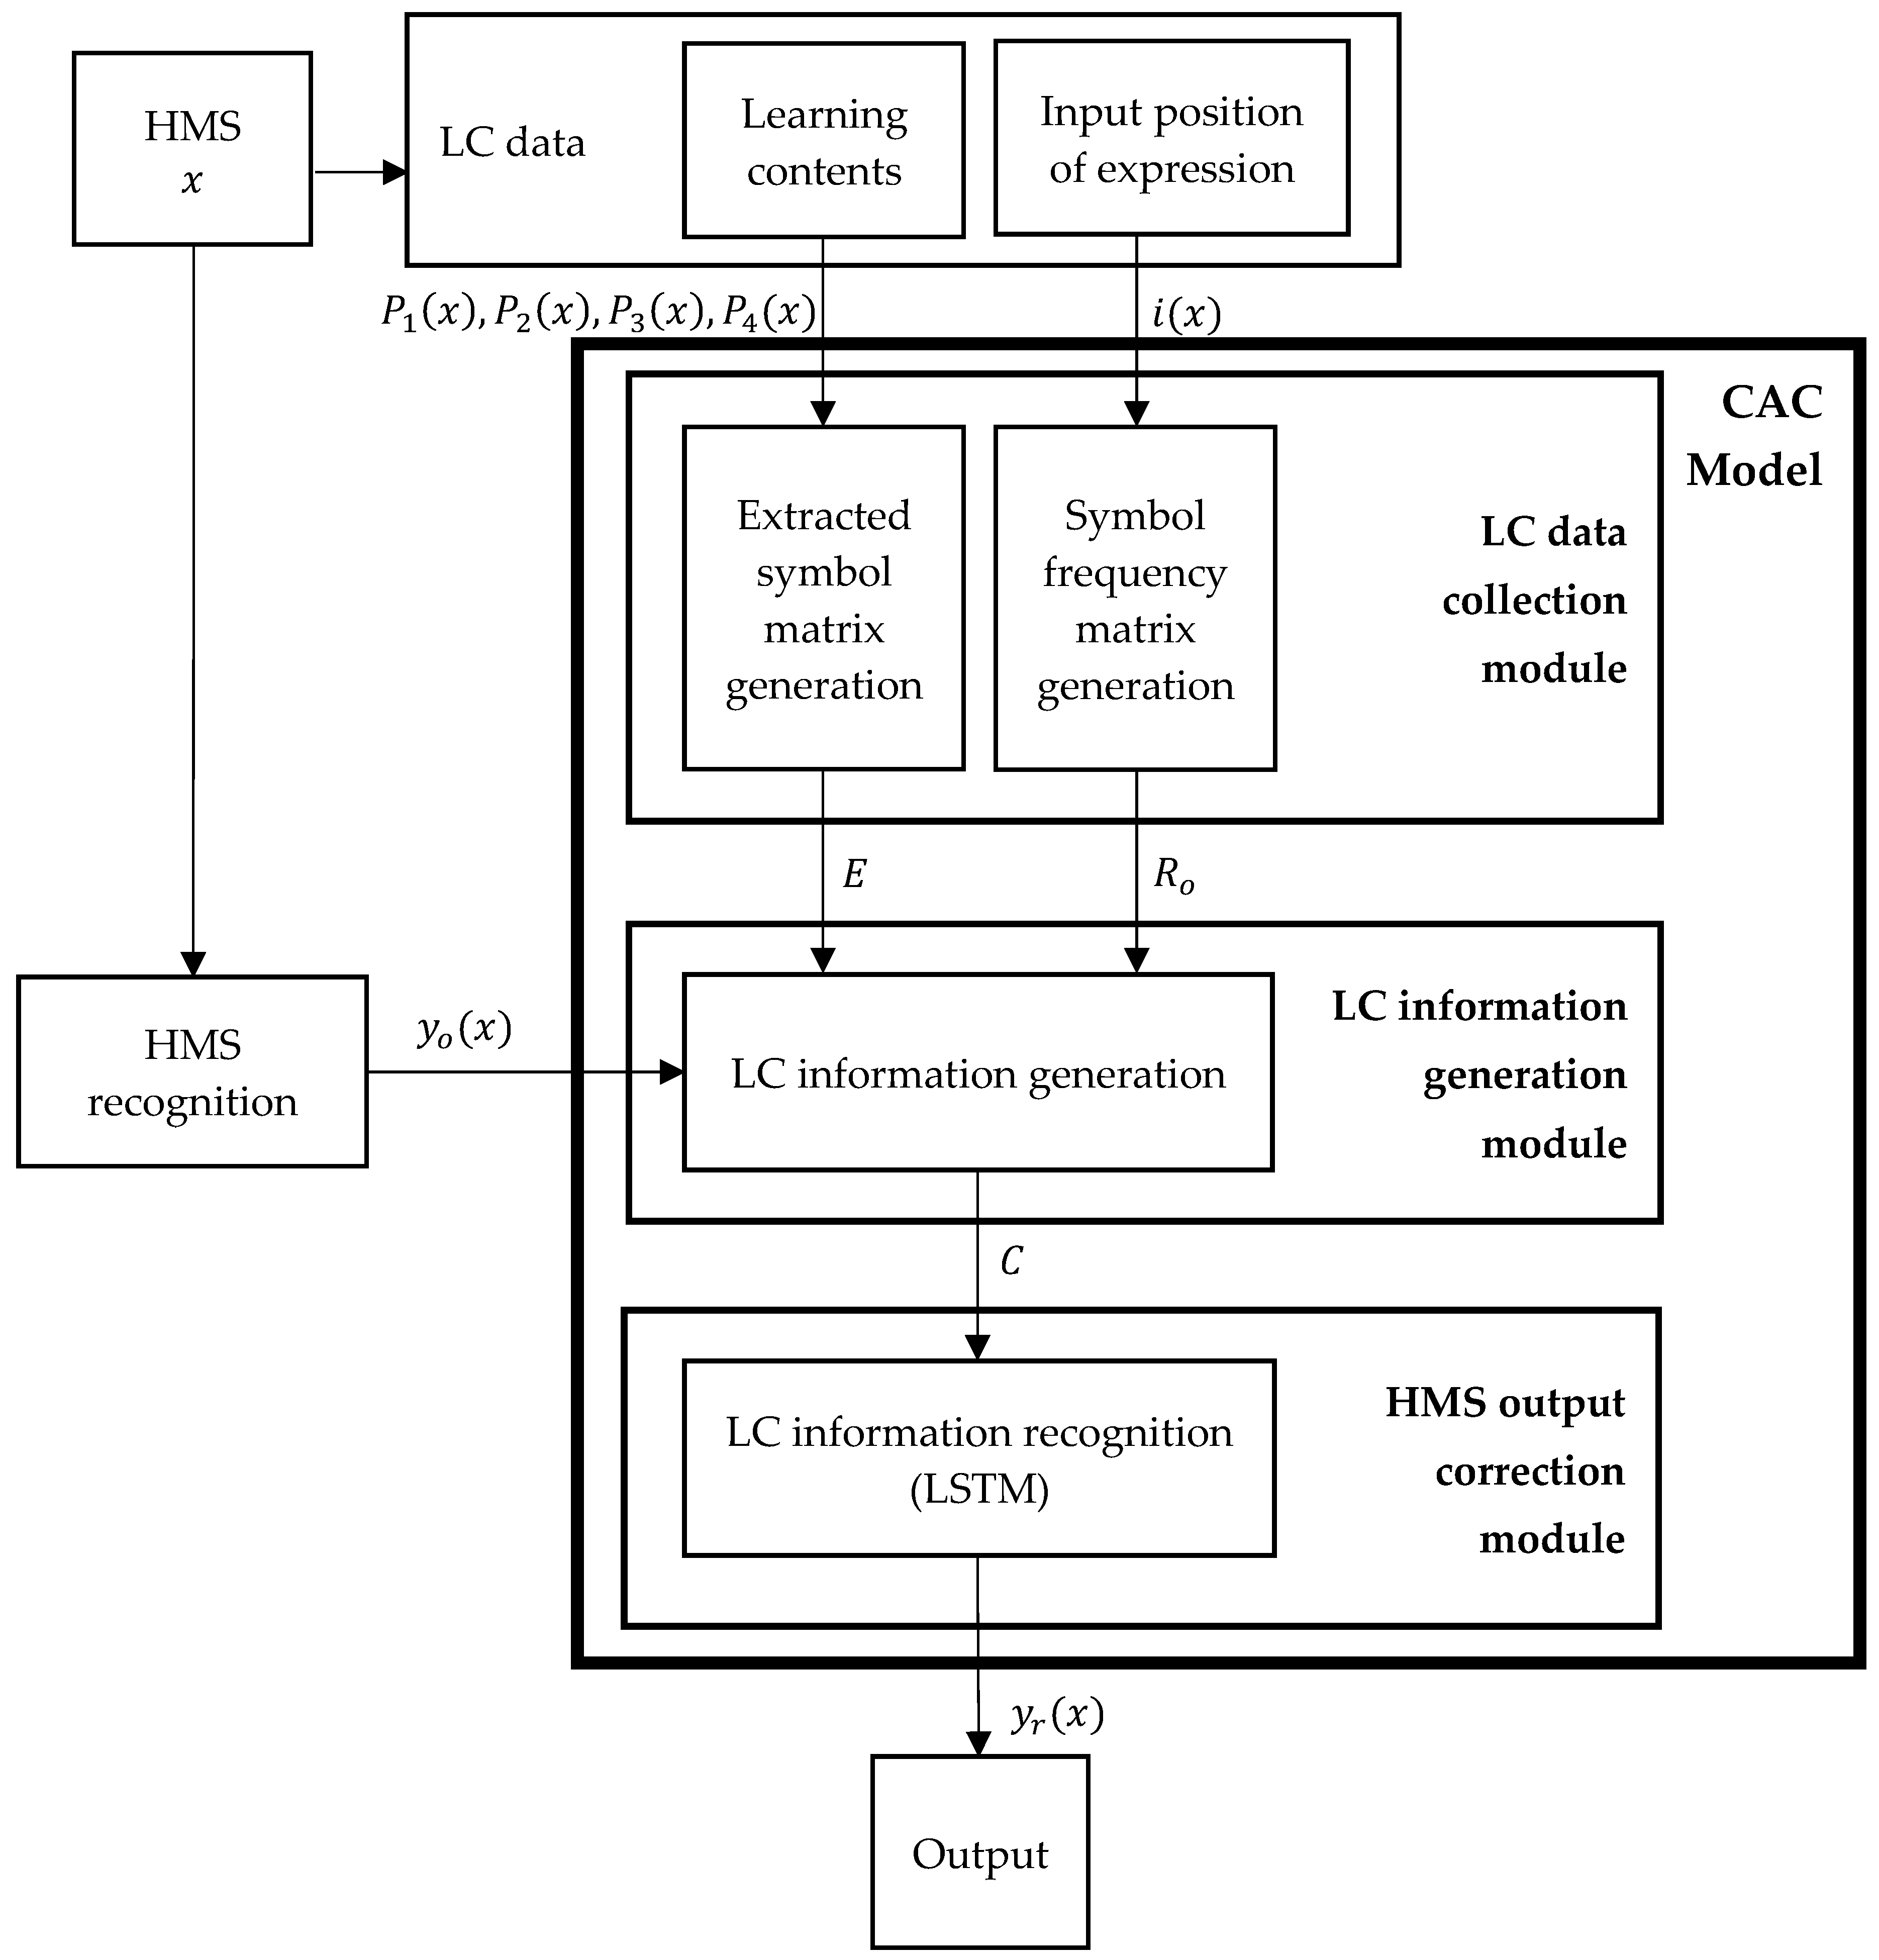
4. CAC Model
4.1. Composition of CAC Model
4.2. LC Data Collection Module
4.2.1. Extracted Symbol Matrix Generation
4.2.2. Symbol Frequency Matrix Generation
4.3. LC Information Generation Module
4.4. HMS Output Correction Module and Output
5. Experiment
5.1. Experiment Environment
- Input position: 16,821 data points of the training set and 1714 data points of the test set, randomly selected according to the ratio of pre-investigated statistics, were set to the symbols of the expression in the answer parts; that is, their input positions were set to answer parts. The others’ input positions were set to solving processes.
- Extracted symbols: As shown in Table 5, for a given symbol, there are 16 cases (00 to 15) of a method of designating extracted symbols of the four learning parts, depending on which learning part contains the symbol for data where the symbol is the correct one. Similarly, there are 16 cases for data where the symbol is not the correct one as well. Therefore, all data can be divided into 32 cases for each symbol. For each symbol, we randomly portioned the entire CROHME dataset according to the 32 ratios calculated from the number of symbols in the learning contents to make the setting similar to the actual learning environment. As can be seen in Table 6, which compares the ratio of extracted symbols for symbol ‘2’, in all cases in Table 5, we matched the ratios of extracted symbols assigned to the CROHME dataset to the ratios of the symbols in the learning contents. As a result, the symbol frequency rates of the CROHME dataset became the same as the symbol frequency rates of the learning contents.
5.2. Training and Testing
5.3. Results and Discussion
6. Conclusions
Author Contributions
Funding
Institutional Review Board Statement
Informed Consent Statement
Data Availability Statement
Conflicts of Interest
Appendix A

| Section | Symbol/ Function | Definition | Equation |
|---|---|---|---|
| Section 3.1 | the universal set of learning parts in the e-learning system | (1) | |
| the set of all learning topics | (2) | ||
| the set of all questions | (3) | ||
| the set of all solving process | (4) | ||
| the set of all correct answers | (5) | ||
| (6) | |||
| (7) | |||
| (8) | |||
| (9) | |||
| (10) | |||
| Section 3.2 | (11) | ||
| (12) | |||
| Section 3.3 | is input | ||
| is input | |||
| is input | |||
| is input | |||
| is input | (13) | ||
| the ordered list of all symbols used as an output of the HMS recognition | |||
Appendix B
| Section | Symbol/ Function | Definition | Equation |
|---|---|---|---|
| Section 4.2 | (14) | ||
| the matrix containing information about the symbols included in the expressions of each learning part | (15) | ||
| (16) | |||
| (17) | |||
| (18) | |||
| (19) | |||
| the matrix that represents symbol frequency rates of symbols in the solving process when they are used in the learning topics, the questions, the solving processes, and the correct answers | (20) | ||
| the matrix that represents symbol frequency rates of symbols in the correct answer when they are used in the learning topics, the questions, the solving processes, and the correct answers | (21) | ||
| of the expression | (22) | ||
| Section 4.3 | (23) | ||
| Section 4.4 | (24) | ||
Appendix C
| Extracted Symbols of Learning Topics | Symbol Frequency Rate | Extracted Symbols of Learning Topics | Symbol Frequency Rate | ||||
|---|---|---|---|---|---|---|---|
| Solving Process | Correct Answer | Solving Process | Correct Answer | ||||
| Numbers | 133/243 (55%) | 51/100 (51%) | Signs | 682/1326 (51%) | 223/554 (40%) | ||
| 145/243 (60%) | 41/100 (41%) | ―(fraction) | 423/1326 (32%) | 123/554 (22%) | |||
| 126/243 (52%) | 39/100 (39%) | 388/1083 (36%) | 10/454 (2%) | ||||
| 84/243 (35%) | 35/100 (35%) | 388/1083 (36%) | 10/454 (2%) | ||||
| ⋮ | ⋮ | ⋮ | |||||
Appendix D
| Extracted Symbols of Questions | Symbol Frequency Rate | Extracted Symbols of Questions | Symbol Frequency Rate | ||||
|---|---|---|---|---|---|---|---|
| Solving Process | Correct Answer | Solving Process | Correct Answer | ||||
| Numbers | 816/1048 (78%) | 244/423 (58%) | Uppercases | 41/115 (36%) | 2/25 (8%) | ||
| 535/821 (65%) | 115/323 (36%) | 28/92 (30%) | 0/18 (0%) | ||||
| 406/606 (67%) | 98/216 (45%) | C | 21/48 (44%) | 2/9 (22%) | |||
| 279/517 (54%) | 53/195 (27%) | S | 29/40 (73%) | 13/16 (81%) | |||
| ⋮ | ⋮ | ⋮ | ⋮ | ⋮ | ⋮ | ||
| Lowercases | 474/667 (71%) | 169/253 (67%) | Signs | − | 553/718 (77%) | 200/290 (69%) | |
| a | 331/436 (76%) | 132/177 (75%) | ( | 265/664 (40%) | 7/295 (2%) | ||
| 257/394 (65%) | 94/156 (60%) | 265/661 (40%) | 7/294 (2%) | ||||
| 214/314 (68%) | 89/120 (74%) | 424/644 (66%) | 98/231 (42%) | ||||
| ⋮ | ⋮ | ⋮ | ⋮ | ⋮ | ⋮ | ||
Appendix E
| Extracted Symbols of Solving Processes | Symbol Frequency Rate | Extracted Symbols of Solving Processes | Symbol Frequency Rate | ||||
|---|---|---|---|---|---|---|---|
| Solving Process 1 | Correct Answer | Solving Process 1 | Correct Answer | ||||
| Numbers | 1744/2367 (74%) | 514/914 (56%) | Uppercases | 270/488 (55%) | 2/105 (2%) | ||
| 980/1638 (60%) | 267/555 (48%) | 96/259 (37%) | 0/49 (0%) | ||||
| 928/1542 (60%) | 224/602 (37%) | 46/137 (34%) | 4/25 (16%) | ||||
| 492/1011 (49%) | 120/396 (30%) | 68/82 (83%) | 26/30 (87%) | ||||
| ⋮ | ⋮ | ⋮ | ⋮ | ⋮ | ⋮ | ||
| Lowercases | 886/1297 (68%) | 313/524 (60%) | Signs | 2972/3269 (91%) | 73/1189 (6%) | ||
| 560/786 (71%) | 232/337 (69%) | 1350/1750 (77%) | 413/679 (61%) | ||||
| 390/620 (63%) | 146/224 (65%) | 878/1391 (63%) | 223/529 (42%) | ||||
| 318/558 (57%) | 155/260 (60%) | ―(fraction) | 710/1097 (65%) | 175/422 (41%) | |||
| ⋮ | ⋮ | ⋮ | ⋮ | ⋮ | ⋮ | ||
Appendix F
| Extracted Symbols of Correct Answers | Symbol Frequency Rate | Extracted Symbols of Correct Answers | Symbol Frequency Rate | ||||
|---|---|---|---|---|---|---|---|
| Solving Process | Correct Answer | Solving Process | Correct Answer | ||||
| Numbers | 514/659 (78%) | 303/303 (100%) | Uppercases | 26/33 (79%) | 13/13 (100%) | ||
| 267/494 (54%) | 196/196 (100%) | 2/6 (33%) | 2/2 (100%) | ||||
| 224/391 (57%) | 160/160 (100%) | 4/6 (67%) | 3/3 (100%) | ||||
| 120/287 (42%) | 128/128 (100%) | 4/4 (100%) | 2/2 (100%) | ||||
| ⋮ | ⋮ | ⋮ | ⋮ | ⋮ | ⋮ | ||
| Lowercases | 313/350 (89%) | 173/173 (100%) | Signs | 413/498 (83%) | 223/223 (100%) | ||
| 232/257 (90%) | 134/134 (100%) | ―(fraction) | 175/279 (63%) | 123/123 (100%) | |||
| 155/178 (87%) | 96/96 (100%) | 223/261 (85%) | 133/133 (100%) | ||||
| 146/172 (85%) | 91/91 (100%) | 73/79 (92%) | 33/33 (100%) | ||||
| ⋮ | ⋮ | ⋮ | ⋮ | ⋮ | ⋮ | ||
References
- Babli, M.; Rincon, J.A.; Onaindia, E.; Carrascosa, C.; Julian, V. Deliberative context-aware ambient intelligence system for assisted living homes. Hum.-Cent. Comput. Inf. Sci. 2021, 11, 19. [Google Scholar] [CrossRef]
- Khowaja, S.A.; Yahya, B.N.; Lee, S.L. CAPHAR: Context-aware personalized human activity recognition using associative learning in smart environments. Hum.-Cent. Comput. Inf. Sci. 2020, 10, 35. [Google Scholar] [CrossRef]
- Chan, K.; Yeung, D. Mathematical expression recognition: A survey. Int. J. Doc. Anal. Recogn. 2000, 3, 3–15. [Google Scholar] [CrossRef]
- Chan, C.K. Stroke extraction for offline handwritten mathematical expression recognition. IEEE Access 2020, 8, 61565–61575. [Google Scholar] [CrossRef]
- Zhang, T. New architectures for handwritten mathematical expressions recognition. In Image Processing; Université de Nantes: Nantes, France, 2017. [Google Scholar]
- Zhang, J.; Du, J.; Zhang, S.; Liu, D.; Hu, Y.; Hu, J.; Wei, S.; Dai, L. Watch, attend and parse: An end-to-end neural network based approach to handwritten mathematical expression recognition. Pattern Recognit. 2017, 71, 196–206. [Google Scholar] [CrossRef]
- Miller, E.G.; Viola, P.A. Ambiguity and constraint in mathematical expression recognition. Am. Assoc. Artif. Intell. 1998, 784–791. [Google Scholar] [CrossRef]
- Kosmala, A.; Rigoll, G. On-line handwritten formula recognition using statistical methods. Fourteenth Int. Conf. Pattern Recognit. 1998, 2, 1306–1308. [Google Scholar] [CrossRef] [Green Version]
- Chou, P.A. Recognition of Equations Using a Two-Dimensional Stochastic Context-Free Grammar. Vis. Commun. Image Process. IV 1989, 1199, 852–863. [Google Scholar] [CrossRef]
- Álvaro, F.; Sánchez, J.A.; Benedí, J.M. An integrated grammar-based approach for mathematical expression recognition. Pattern Recognit. 2016, 51, 135–147. [Google Scholar] [CrossRef] [Green Version]
- Zhelezniakov, D.; Zaytsev, V.; Radyvonenko, O. Acceleration of Online Recognition of 2D Sequences using Deep Bidirectional LSTM and Dynamic Programming. Adv. Comput. Intell. 2019, 11507, 438–449. [Google Scholar] [CrossRef]
- Naik, S.A.; Metkewar, P.S.; Mapari, S.A. Recognition of ambiguous mathematical characters within mathematical expressions. Symbiosis Institute of Computer Studies and Research. In Proceedings of the 2017 International Conference on Electrical Computer and Communication Technologies, Coimbatore, India, 22–24 February 2017; pp. 1–4. [Google Scholar] [CrossRef]
- Álvaro, F.; Sánchez, J.A.; Benedí, J.M. Offline Features for Classifying Handwritten Math Symbols with Recurrent Neural Networks. In Proceedings of the 2014 22nd International Conference on Pattern Recognition, Stockholm, Sweden, 24–28 August 2014; pp. 2944–2949. [Google Scholar] [CrossRef] [Green Version]
- Mahdavi, M.; Zanibbi, R.; Mouch`ere, H.; Viard-Gaudin, C.; Garain, U. ICDAR 2019 CROHME + TFD: Competition on recognition of handwritten mathematical expressions and typeset formula detection. In Proceedings of the 2019 International Conference on Document Analysis and Recognition, Sydney, NSW, Australia, 20–25 September 2019. [Google Scholar] [CrossRef]
- Zhang, J.; Du, J.; Dai, L. Track, attend and parse (TAP): An end-to-end framework for online handwritten mathematical expression recognition. IEEE Trans. Multimed. 2019, 21, 221–233. [Google Scholar] [CrossRef]
- Degtyarenko, I.; Radyvonenko, O.; Bokhan, K.; Khomenko, V. Text/shape classifier for mobile applications with handwriting input. Int. J. Doc. Anal. Recogn. 2016, 19, 369–379. [Google Scholar] [CrossRef]
- Wu, J.; Yin, F.; Zhang, Y.; Zhang, X.; Liu, C. Image-to-markup generation via paired adversarial learning. In Machine Learning and Knowledge Discovery in Databases; Springer International Publishing: Cham, Switzerland, 2019; pp. 18–34. [Google Scholar]
- Le, A.; Nakagawa, M. A system for recognizing online handwritten mathematical expressions by using improved structural analysis. Int. J. Doc. Anal. Recog. 2016, 19, 305–319. [Google Scholar] [CrossRef]
- Kim, H.C.; Lee, S.W. Document summarization model based on general context in RNN. J. Inf. Process. Syst. 2019, 15, 1378–1391. [Google Scholar] [CrossRef]
- Om, K.; Boukoros, S.; Nugaliyadde, A.; McGill, T.; Dixon, M.; Koutsakis, P.; Wong, K. Modelling email traffic workloads with RNN and LSTM models. Hum.-Cent. Comput. Inf. Sci. 2020, 10, 1–16. [Google Scholar] [CrossRef]
- Hochreiter, S.; Schmidhuber, J. Long short-term memory. Neural Comput. 1997, 9, 1735–1780. [Google Scholar] [CrossRef] [PubMed]
- Olah, C. Understanding LSTM Networks. 2015. Available online: https://colah.github.io/posts/2015-08-Understanding-LSTMs (accessed on 17 January 2022).
- Yang, T. Concept Plus Type Middle School Mathematics 2-1; Concept Volume; Visang Education: Seoul, Korea, 2011. [Google Scholar]
- Krizhevsky, A.; Sutskever, I.; Hinton, G.E. ImageNet classification with deep convolutional neural networks. Commun. ACM 2017, 60, 84–90. [Google Scholar] [CrossRef]
- Wood, T. Softmax Function. 2019. Available online: https://deepai.org/machine-learning-glossary-and-terms/softmax-layer (accessed on 17 January 2022).


| No | Team | Model (Based Method) | Recognition Data | Accuracy | |
|---|---|---|---|---|---|
| Structure + Symbol Labels | Structure | ||||
| 1 | USTC-iFLYTEK | TAP (RNN 1) [15] | Online data | 80.73% | 91.49% |
| 2 | Samsung R&D 1 | PCFG (RNN 1, PCFG 2) [11] | Online data | 79.82% | 89.32% |
| 3 | MyScript | MyScript Math recognizer (BLSTM 3, LSTM 4) [14] | Online data | 79.15% | 90.66% |
| 4 | Sun Yat-Sen U. | MyScript Interactive Ink [4] | Online data extracted from images | 77.40% | 88.82% |
| 5 | Samsung R&D 2 | Text/shape classifier (SVM 5) [16] | Online data | 65.97% | 82.82% |
| 6 | PAL-v2 | PAL-v2 (LSTM 4) [17] | Images converted from online data | 62.55% | 79.15% |
| 7 | MathType | MathType (LSTM 4) [14] | Images converted from online data | 60.13% | 79.15% |
| 8 | TUAT | body box (LSTM 4, PCFG 3, SVM 5) [18] | Online data and offline data (converted from online data) | 39.95% | 58.22% |
| Learning Part | Learning Contents | Expressions | Extracted Symbols |
|---|---|---|---|
| Learning topic | <Linear Inequality> When the terms on the right side of the inequality are transposed to the left side, the inequality that appears in either (Linear Expression) < 0, (Linear Expression) > 0, (Linear Expression) ≤ 0, and (Linear Expression) ≥ 0 is called the linear inequality. | (Linear Expression) < 0 | <, 0 |
| (Linear Expression) > 0 | >, 0 | ||
| (Linear Expression) ≤ 0 | ≤, 0 | ||
| (Linear Expression) ≥ 0 | ≥, 0 | ||
| Question | Find the range of values of the constant when the root of equation is not greater than 1. | ||
| Solving process | , | ||
| Correct answer |
| Index | Symbol | Latex | Index | Symbol | Latex | Index | Symbol | Latex |
|---|---|---|---|---|---|---|---|---|
| 1 | 7 | 18 | b | 35 | c | |||
| 2 | 1 | 19 | a | 36 | A | |||
| 3 | \times | 20 | F | 37 | B | |||
| 4 | t | 21 | C | 38 | [ | |||
| 5 | - | 22 | 5 | 39 | ] | |||
| 6 | 2 | 23 | 9 | 40 | \lt | |||
| 7 | x | x | 24 | 8 | 41 | L | ||
| 8 | = | 25 | \pi | 42 | h | |||
| 9 | n | 26 | d | 43 | E | E | ||
| 10 | y | 27 | \div | 44 | V | |||
| 11 | z | z | 28 | 0 | 45 | s | ||
| 12 | ) | 29 | g | 46 | q | |||
| 13 | ( | 30 | p | 47 | l | |||
| 14 | + | 31 | r | 48 | v | |||
| 15 | 6 | 32 | m | 49 | M | |||
| 16 | 3 | 33 | \leq | 50 | I | |||
| 17 | 4 | 34 | . | |||||
| Purpose | Training Set (HMS Recognition and LC Information Recognition) | Testing Set | Total |
|---|---|---|---|
| Number of data points | 81,265 | 8212 | 89,477 |
| Learning Part | Whether to Include the Symbol (Case 00 to 15) 1 | |||||||||||||||
|---|---|---|---|---|---|---|---|---|---|---|---|---|---|---|---|---|
| 00 | 01 | 02 | 03 | 04 | 05 | 06 | 07 | 08 | 09 | 10 | 11 | 12 | 13 | 14 | 15 | |
| Learning topic | × | × | × | × | × | × | × | × | ○ | ○ | ○ | ○ | ○ | ○ | ○ | ○ |
| Question | × | × | × | × | ○ | ○ | ○ | ○ | × | × | × | × | ○ | ○ | ○ | ○ |
| Solving process | × | × | ○ | ○ | × | × | ○ | ○ | × | × | ○ | ○ | × | × | ○ | ○ |
| Answer | × | ○ | × | ○ | × | ○ | × | ○ | × | ○ | × | ○ | × | ○ | × | ○ |
| Case | ||||||
|---|---|---|---|---|---|---|
| Workbook | Train Dataset | Test Dataset | Workbook | Train Dataset | Test Dataset | |
| 00 | 58 (1.8%) | 95 (1.8%) | 10 (1.9%) | 183 (10.4%) | 6150 (10.4%) | 620 (10.4%) |
| 01 | 41 (1.2%) | 66 (1.2%) | 7 (1.3%) | 62 (3.5%) | 2084 (3.5%) | 210 (3.5%) |
| 02 | 136 (4.1%) | 219 (4.1%) | 22 (4.1%) | 58 (3.3%) | 1949 (3.3%) | 196 (3.3%) |
| 03 | 111 (3.4%) | 179 (3.4%) | 18 (3.4%) | 41 (2.3%) | 1378 (2.3%) | 139 (2.3%) |
| 04 | 244 (7.4%) | 394 (7.4%) | 40 (7.4%) | 324 (18.4%) | 10,888 (18.4%) | 1097 (18.4%) |
| 05 | 157 (4.8%) | 253 (4.8%) | 26 (4.8%) | 179 (10.2%) | 6015 (10.2%) | 606 (10.2%) |
| 06 | 980 (29.8%) | 1581 (29.8%) | 160 (29.8%) | 244 (13.9%) | 8200 (13.9%) | 826 (13.9%) |
| 07 | 1042 (31.7%) | 1681 (31.7%) | 170 (31.7%) | 157 (8.9%) | 5276 (8.9%) | 532 (8.9%) |
| 08 | 13 (0.4%) | 21 (0.4%) | 2 (0.4%) | 227 (12.9%) | 7628 (12.9%) | 769 (12.9%) |
| 09 | 4 (0.1%) | 6 (0.1%) | 1 (0.2%) | 47 (2.7%) | 1579 (2.7%) | 159 (2.7%) |
| 10 | 11 (0.3%) | 18 (0.3%) | 2 (0.4%) | 13 (0.7%) | 437 (0.7%) | 44 (0.7%) |
| 11 | 9 (0.3%) | 15 (0.3%) | 1 (0.2%) | 4 (0.2%) | 134 (0.2%) | 14 (0.2%) |
| 12 | 58 (1.8%) | 94 (1.8%) | 9 (1.7%) | 56 (3.2%) | 1882 (3.2%) | 190 (3.2%) |
| 13 | 48 (1.5%) | 77 (1.5%) | 8 (1.5%) | 59 (3.4%) | 1983 (3.4%) | 200 (3.4%) |
| 14 | 194 (5.9%) | 313 (5.9%) | 32 (6.0%) | 58 (3.3%) | 1949 (3.3%) | 196 (3.3%) |
| 15 | 178 (5.4%) | 287 (5.4%) | 29 (5.4%) | 48 (2.7%) | 1613 (2.7%) | 163 (2.7%) |
| Total | 3284 | 5299 | 537 | 1760 | 59,145 | 5961 |
| CROME Dataset | LC Data | |||||
|---|---|---|---|---|---|---|
| HMS | Correct Symbol | Extracted Symbols | Input Position | |||
| Learning Topic | Question | Solving Process | Correct Answer | |||
 | Solving process | |||||
 | Solving process | |||||
| No. | Layer | Setting |
|---|---|---|
| 1 | LSTM | Output dimension = 50 |
| 2 | Dropout | Rate = 0.5 |
| 3 | Fully connected (dense) | Output dimension = 50 |
| 4 | Softmax | Output dimension = 50 |
| Experimental Group | Dataset (81,265 Data Points) | Artificial Neural Network to Train | |
|---|---|---|---|
| Training Set | Validation Set | ||
| I | HMS (81,265 data points) | - | TAP |
| II | HMS output data obtained using the model of experimental group I after training (56,886 data points) | 24,379 data points (30%) | CAC |
| LC data (56,886 data points) | |||
| Experimental Group | Model | Test Subject | Accuracy (Number of Symbols) | ||
|---|---|---|---|---|---|
| Solving Processes (6498) | Answers (1714) | Solving Process + Answers (8212) | |||
| I | TAP | Recognition of HMS | 93.20% (6056) | 93.29% (1599) | 93.22% (7655) |
| II | TAP + CAC | Recognition of HMS outputs and LC data | 96.48% (6269) | 99.71% (1709) | 97.15% (7978) |
| Recognition Result | Number of Data | Symbols with Recognition Results | ||
|---|---|---|---|---|
| TAP | TAP + CAC | Output of TAP → Output of CAC (Number of Data) | HMS | |
| Error | Correct | 404 (4.92%) | (47) |  … … |
| (20) |  … … | |||
| (17) |  … … | |||
| (15) |  … … | |||
| ⋮ | ⋮ | |||
| Correct | Error | 81 (0.99%) | (22) |  … … |
| (5) |  | |||
| (4) |  | |||
| (4) |  | |||
| ⋮ | ⋮ | |||
Publisher’s Note: MDPI stays neutral with regard to jurisdictional claims in published maps and institutional affiliations. |
© 2022 by the authors. Licensee MDPI, Basel, Switzerland. This article is an open access article distributed under the terms and conditions of the Creative Commons Attribution (CC BY) license (https://creativecommons.org/licenses/by/4.0/).
Share and Cite
Baek, S.-B.; Shon, J.-G.; Park, J.-S. CAC: A Learning Context Recognition Model Based on AI for Handwritten Mathematical Symbols in e-Learning Systems. Mathematics 2022, 10, 1277. https://doi.org/10.3390/math10081277
Baek S-B, Shon J-G, Park J-S. CAC: A Learning Context Recognition Model Based on AI for Handwritten Mathematical Symbols in e-Learning Systems. Mathematics. 2022; 10(8):1277. https://doi.org/10.3390/math10081277
Chicago/Turabian StyleBaek, Sung-Bum, Jin-Gon Shon, and Ji-Su Park. 2022. "CAC: A Learning Context Recognition Model Based on AI for Handwritten Mathematical Symbols in e-Learning Systems" Mathematics 10, no. 8: 1277. https://doi.org/10.3390/math10081277
APA StyleBaek, S.-B., Shon, J.-G., & Park, J.-S. (2022). CAC: A Learning Context Recognition Model Based on AI for Handwritten Mathematical Symbols in e-Learning Systems. Mathematics, 10(8), 1277. https://doi.org/10.3390/math10081277