Abstract
The rapid growth of electric vehicles in India necessitates more power to energize such vehicles. Furthermore, the transport industry emits greenhouse gases, particularly SO2, CO2. The national grid has to supply an enormous amount of power on a daily basis due to the surplus power required to charge these electric vehicles. This paper presents the various hybrid energy system configurations to meet the power requirements of the electric vehicle charging station (EVCS) situated in the northwest region of Delhi, India. The three configurations are: (a) solar photovoltaic/diesel generator/battery-based EVCS, (b) solar photovoltaic/battery-based EVCS, and (c) grid-and-solar photovoltaic-based EVCS. The meta-heuristic techniques are implemented to analyze the technological, financial, and environmental feasibility of the three possible configurations. The optimization algorithm intends to reduce the total net present cost and levelized cost of energy while keeping the value of lack of power supply probability within limits. To confirm the solution quality obtained using modified salp swarm algorithm (MSSA), the popularly used HOMER software, salp swarm algorithm (SSA), and the gray wolf optimization are applied to the same problem, and their outcomes are equated to those attained by the MSSA. MSSA exhibits superior accuracy and robustness based on simulation outcomes. The MSSA performs much better in terms of computation time followed by the SSA and gray wolf optimization. MSSA results in reduced levelized cost of energy values in all three configurations, i.e., USD 0.482/kWh, USD 0.684/kWh, and USD 0.119/kWh in configurations 1, 2, and 3, respectively. Our findings will be useful for researchers in determining the best method for the sizing of energy system components.
1. Introduction
Energy is a critical component of long-term development and poverty eradication. In India, electricity is accessible to 97.2 percent of the population. Natural gas and coal are the most common fuels used in the electricity sector. India has a total power generation capacity of 388.134 GW (including off-grid renewable energy), with renewable energy (RE) accounting for 21.26 percent [1]. The scarcity of natural gas and coal reserves could pose a serious threat to electricity production. To meet the country’s rising electricity consumption, the Indian government has announced plans to install 275 GW of sustainable power by 2027. The government has a strategy to satisfy demand with 356.681 GW (Ministry of power, Delhi, India) of electricity generation from coal and nuclear power plants, yet these methods are not eco-friendly and are eroding our environment. RE-based power generation, which emits fewer greenhouse gases (GHGs) than other traditional power generation systems, is required in this framework. India, as a developing country, must provide quality and reliable energy for all of its citizens to achieve its long-term development goals. As per the information revealed by World Resources Institute, India is responsible for emitting 7.1 percent of worldwide emissions and has total emissions of 2.47 tCO2e compared to a global average of 6.45 tCO2e. According to World Bank data, per capita consumption of electricity in India has grown from 920 kWh in 2012–2013 to 1210 kWh in 2019–2020.
The transportation sector of India contributes significantly to GHGs emissions. CO2 accounts for the majority of these GHGs emissions. Furthermore, the energy and agriculture industries are hastening CO2 emissions. The rapid growth in the number of vehicles needed to serve the country’s massive population is a worrisome symptom of pollution and fuel consumption. Aside from these circumstances, the use of electric vehicles (EVs) such as e-rickshaws is increasing regularly. These EVs emit fewer pollutants and no exhausts. The Ministry of Road Transport and Highways does not have any data on these EVs. Some of these EVs are certified, and data reveal that there are 517,322 registered EVs out of a total of 295,800,000 automobiles. However, the rapid expansion of these EVs necessitates a massive quantity of electricity every day from India’s national grid. EVs are now charged in residential neighborhoods, with residential customers paying the electric bills. In such circumstances, charging those EVs does not generate any revenue for the electricity sector. Meanwhile, these EVs are creating a lot of stress on the grid network of India. A profitable strategy to generate electrical energy is needed to relieve the strain on the national system. However, to the best of the authors’ knowledge, there are no endeavors in India to establish a hybrid-energy-based electric vehicle charging station (EVCS), which prompted us to conduct this study described here.
India has various sources of RE, which include solar photovoltaic (SPV), wind turbines (WT), biogas generators, and biomass. As a result, power might be generated using existing resources. The use of renewables can reduce harmful emissions while also lowering operating costs and maintaining cleanliness. In these systems, paying a bill every month is not an option. EV charging with RE resources enhances commercial profitability, reduces air pollution, and decreases noise in metropolitan regions.
Due to the enormous solar energy availability, it is the finest alternative for generating electrical energy to serve EVs. The solar-powered EVCS at Karna Lake Resort in Karnal is one of Bharat Heavy Electricals Limited’s (BHEL) 20 such stations along the Delhi-Chandigarh expressway. It has chargers for all models of electric cars already on the road in the country, including AC001 (33.3 kW), DC001 (15 kW), and 72 kW (50 kW DC + 22 kW AC).
Solar irradiation is missing during rainy days and in foggy surroundings, and with fluctuations in wind energy, no energy is generated at that time. As a result, relying solely on solar and wind energy may compromise system stability and cause a project to fail. Hence, diesel generators (DGs), which can be a decent substitute for generating power even though solar and wind power are unavailable, are required.
1.1. Present Scenario of EVs and EVCS
In the early phases, companies put forward hybrid EV technology as the most reliable and eco-friendly technology. Even though this technology has made major developments, it still mixes traditional fuel practice with an electric engine, which is used when applications require minimal power capacity. Later, technological innovations and more effective battery storage led to the establishment of improved EV systems that completely rely on electrical energy for supply. These devices started to run using electrical energy provided by RE sources, such as SPV and WT. Some research was carried out for enhancing energy efficiency. For example, in Ref. [2], a complete investigation for the forecasting of effective charging profile for EVs by using multiple run-out of charging conditions is provided. Artificial neural networks to build algorithms that perform the optimized energy management of EVs are used [3]. The authors demonstrated how to use a smart nano grid system and plug-in electric automobiles to manage the optimized integration of hybrid SPV systems [4].
According to annual surveys, the number of EVs and charging stations has increased exponentially over the last decade. Battery-based EVs were first started in India in 2001. Now, these are running in nearly every part of the region. There are three varieties of EVs comprising electric rickshaws, which carry between four and five passengers, auto-rickshaw for three passengers, and electric vans for delivering products. A fully charged electric rickshaw can go about 80–110 km and costs roughly one lakh seventy-five thousand rupees in the market, whereas auto-rickshaws and electric vans have a range of 50–80 km and cost around one lakh rupees. These were formerly imported from China, but today they are made in the country itself. An EV that is completely recharged can travel 80–110 km a day while consuming 8–12 kWh. The cost of power per unit is Rs. 6.90 on the commercial tariff, hence the cost incurred per km run is around Rs. 75.9. One of the e-rickshaw charging stations installed in Delhi is shown in Figure 1.
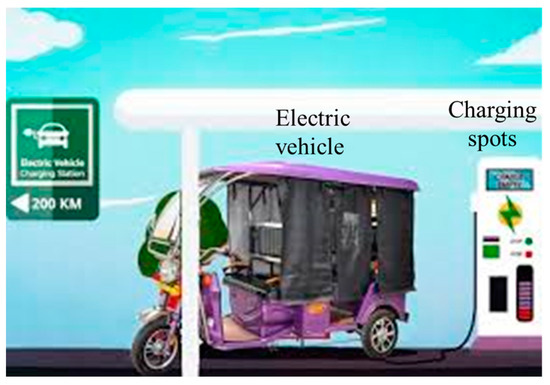
Figure 1.
Electric vehicle charging station in Delhi.
The features of e-rickshaw in India are shown in Table 1. This mode of transportation is beneficial to the environment, emitting nearly no fumes and creating significantly fewer CO2 emissions. It has brought a cultural shift to the transportation industry, becoming well known for its lower fares when related to other means of road transit, thus enhancing the satisfaction of low-income individuals, including vehicle drivers [5]. Some private ventures have launched electric-based Easy Bikes and Auto-rickshaw, which have gained traction in village areas and near metropolitan zones. Such EVs consume a significant amount of grid energy; however, there are a lot of measures underway to relieve the strain on the system. However, because power rickshaws are said to utilize a significant quantity of electricity from grid networks, the changes have yet to be widely implemented.

Table 1.
Specification of EVs (e-rickshaw) in Delhi. Data from Ref. [6].
The authors performed a survey in Delhi’s northwestern city for this study. Every day, more than 200 different varieties of electric rickshaws run here. There were just 20 manually operated rickshaws recorded. The majority of electric rickshaws are powered using electricity installed at home, which is not permitted by the Indian government. Additionally, power outages occur very often in the neighborhood. Therefore, charging EVs during that time is challenging.
It would be easier for those individuals to drive their battery-powered EVs under these conditions if services were created to charge EV batteries using other trustworthy energy sources in the surrounding part. EVs have had a seismic impact on road transport, particularly in rural and sub-urban regions, despite significant charging issues.
1.2. Literature Review
EVs adoption rate is rapidly increasing all over the world, promoting this energy usage industry as a potential area of research. This subsection focuses on the existing EV charging infrastructure, hybrid renewable power production technologies for EV charging, costs of electricity generation, and the reduction in GHG emissions by the charging system. The power and transport industries account for the majority of carbon footprints on the planet. RE can help to reduce harmful emissions in the electrical sector, while grid-powered EVs can greatly decrease pollution in the transportation sector. When RE sources and EVs are combined, they have a lot of potential to solve ecological and financial issues. EVs and RE sources have been discussed in terms of the operation of the system in several kinds of literature.
Optimal systems of various hybrid combinations, such as SPV/wind/diesel/battery systems, have been documented in several articles. On the other hand, SPV systems are less expensive and more applicable than WT [7]. Since the growth and deployment of hybrid RE systems have increased dramatically in the past few years [8], the proper design of these systems is critical for achieving a high degree of reliability at low prices. Under-sizing the system can result in operational limits and energy shortages, while over-sizing the system can lead to high expenses. Hence, sophisticated optimization methods are essential to tackle the optimal sizing problem. The components of the hybrid power system must be designed and integrated as part of the sizing technique to anticipate their efficiency based on meteorological conditions; this comprises predicting the energy output of renewable sources and the battery charge state.
A range of sizing strategies has been reported in the literature, which includes recursive approaches [9] and software applications, such as HOMER [10]. The use of traditional procedures based on recursive, quantitative, or statistical methods has fallen dramatically [11], whilst approaches utilizing optimization algorithms have attracted a lot of attention. Heuristic algorithms are quite efficient and have a lot of potential when it comes to handling optimization challenges. Several types of research have been performed to apply such algorithms to the challenge of sizing RE plants [12]. The practical limits of the EV market in China are investigated, and the influence of incentives on an auto manufacturer’s optimal production and pricing decisions is analyzed [13]. A feasibility assessment for a solar-energy-based EVCS in Shenzhen, China, is evaluated using the HOMER software tool. This anticipated strategy addresses the grid power-related issues by incorporating SPV, as well as achieving the expected demand for EVs [14]. There is no other option for generating electricity on wet or foggy days. Another feasibility analysis based on solar-powered EVCS was undertaken in Bulgaria [15]. Many studies envision the incorporation of RE sources, such as a PV system, into charging stations, as the best solution for maximizing the financial and environmental advantages of EVs while also promoting the idea of a smart grid [16]. In Ref. [17], authors have described multiple aspects of the problem formulation, including the choice of design variables and the definition of a probability distribution function to improve efficacy and effectiveness. In Ref. [18], the authors investigated an operational strategy for EVs that employs sustainable RE sources, such as SPV, and gives an optimization method for charging park energy management. The radial distribution network is affected by the uncertainty of the charging load of the EVCS and SPV unit. A study used a hybrid of genetic algorithm (GA)- and particle swarm optimization (PSO)-based optimum scheduling of EV load to minimize system losses, variations in voltage, cost of charging, and battery costs of EV [19]. The elastic demand was developed using either feedback from crowded travel and congested stations on route selections or the presumption that charging demand between origin and destination pairs follows a nonlinear inverse cost function without taking into account pre-generating pathways and charging configurations [20]. Authors envisioned a PSO for the optimal sizing of SPV and battery energy storage system (BESS) in a grid-connected EVCS, with a financial model as the goal [21]. In Ref. [22], authors suggested a hybrid solar and wind charging station that was deployed in Tangshan, China, and proposed an LPSP technique to evaluate the component capabilities. In Ref. [23], a cost-effective EV charging station is developed by comparing a standalone EV charging station to a grid-connected charging station while taking emissions into account. However, there was no cost evaluation for the hybrid system. The authors utilized linear programing to determine the optimum integration of CS, restricting the search area under the assumption that CSs can only be positioned in parking areas and service stations. The optimization technique considers the accessibility of CS within a reasonable driving range [24]. In Ref. [25], a charging station based on solar- and grid-connected stations for a worksite in the Netherlands is presented. Various charging possibilities for EVs were proposed. However, the work did not contain an economic analysis. The demand response systems and EV charging is investigated by integrating them into radial distribution network buses [26]. Particle swarm optimization is being used to resolve the issue of charging station placement [27]. A comprehensive design of an EVCS is proposed, in which EVCS are integrated with renewable sources of energy and a BESS to ease the burden on the utility grid. To optimize the design, a new technique is proposed, which is a hybrid of the crow search algorithm and PSO [28]. Another study was conducted at the University of Palermo in Italy to build a long-term recharging facility for EVs. It results in a low levelized cost of energy, implying that energy storage systems will require a significant amount of initial capital [29]. The GA is used to optimize the adoption of CS. The authors of this study specify some settlements in the urban environment. Settlements are intended to be the locations where EVs are parked for the majority of the time. GA defines CS positions by minimizing distances to settlements [30]. Based on local resource allocation, the author combined SPV and biogas-based resources with EV load in Bangladesh [5]. SPV energy is widely available because PV units can be easily installed on the rooftop. In Ref. [31], the author provides an optimization strategy for grid-connected SPV/BESS/EVCS to scale SPV, BESS, and establish the charging and discharging characteristics of BESS. This problem is implemented using the multi-agent PSO technique, which integrates the multi-agent system (MAS) and the PSO mechanism. The authors of Ref. [32] consider charging station implementation, taking into account the repercussions on travelers, cab drivers, electricity retail outlets, transport and distribution networks, and electricity consumers. A multi-objective optimization was suggested to handle the developed framework. A hybrid SPV and wind-based EVCS are designed and simulated in HOMER software [33]. An eco-friendly alternative for EV charging based on two RE sources, namely SPV and biogas, is presented. The HOMER package is used to assess the effectiveness and features of SPV and biogas-based EVCS. An SPV system, two biogas generators, and a bi-directional converter with BESS are all part of the proposed system. HOMER software analyzes the alteration of various costs, such as net present value, fixed cost, and energy cost for various SPV configurations [6]. The authors of Ref. [34] presented an enhanced version of chicken swarm optimization (CSO) to optimally locate the EVCS in an IEEE 33 node test distribution network. They first evaluated the network impact of projected EV charging load at the EVCSs in terms of voltage levels, average voltage deviation index, voltage stability index, and power loss, and then, using a feed-forward neural network, they investigated the solar power required to energize the EVCSs. In Ref. [35], the author presented a grid-integrated solar- and wind-based energy system to meet the power requirements of a shopping mall, as well as EVCS load. The components are sized to attain the lowest electricity cost while lessening the deficiency of power supply probability, using artificial colony bee and PSO. The optimum strategy and operation of a renewable-powered EVCS will be presented in this study, to lower cost and emissions. The proposed hybrid system comprises SPV, WT, biogas, batteries, and DG units [36]. In Ref. [37], the authors evaluate the technical viability of implementing a standalone fast charging station in the State of Qatar, which includes WT, SPV system, and a bio-generator as RE source, as well as multiple storage devices. The envisaged design is constructed, modeled, and simulated using the HOMER software to determine the best techno-economic configuration for fast charging 50 EVs on a daily basis. Space constraints, the deterministic nature of EV demand, and metrological conditions of the considered site are all taken into account. The goal of the research undertaken is to use HOMER pro software to deliver SPV power to EVs and feed excess power to the grid network. The author used GA to develop a modeling framework for an SPV/wind/battery for a deserted landmass [38]. A multi-objective PSO to size and analyze a PV/wind/hydroelectric power station with a pumped-storage connected energy system is suggested [39]. The authors investigated a probabilistic modeling approach of an EVCS with SPV, battery, and transformer, with an emphasis on charging demand and SPV power generation complexities. To begin, a detailed EV charging requirement model is developed by projecting the coupling between the EV dynamic charging pattern, charger specifications, and EV charging assignment model. The planning model is then developed to minimize the total cost of the charging station, with the uncertainties associated with EV charging being acknowledged through various limits [40]. A multi-objective moth flame optimization (MFO) that was used to optimize a hybrid microgrid system with SPV/wind/BESS/DG is designed [41]. In Ref. [42], the author focuses on a hybrid energy system that includes an SPV, WT, a biogas generator, and BESS for providing reliable electricity to a deserted island in Bangladesh called Saint Martin. The energy system’s component is sized in accordance with energy cost and life cycle emissions under a certain level of reliability. The objectives are optimized by considering two well-known multi-objective optimization methods: non-dominated sorting GA-II and infeasibility-driven evolutionary algorithm. In Ref. [43], the authors presented the technical economic viability of solar- and wind-based EVCS at five different areas in the southern region of Tamil Nadu. The locations are selected such that wind and solar possibilities are of contrary nature in the required places. In Ref. [44], a comprehensive quantitative model is designed to identify the suitable SPV/WT/BESS sizes for distant locations. The suggested method is tested at Ras-Shaitan, a rural area in Egypt-Sinai. The goal of the optimization method is to accommodate power requirements by lowering the cost of energy under various power supply failure scenarios. To get the optimum objective value, the gray wolf optimizer is used to determine the SPV, WT, and BESS units.
Several heuristic methodologies for tackling the sizing issue of various system components have been suggested in the research publications. Because of their excellent ability to tackle difficult optimization issues, researchers are increasingly looking into these strategies. However, the efficiency of each optimization technique, when used for evaluating the optimal size, may vary in terms of precision and convergence rate. Although there is a range of sizing methodologies available, academics working on this problem are constantly looking for a robust and highly precise approach with a small implementation time. This is in order to develop and formulate energy systems that are both reliable and cost effective.
The control and power management of EVs in grid-connected systems are the primary focus of researchers. However, one of the important aspects that must be addressed is an economic analysis that takes into account the power exchange with the grid. The fast adoption of EVs poses both constraints and opportunities for the current electricity system. A small grid-connected SPV and DG-based hybrid system with EVs are presented in this article for a charging station in the northwest region of Delhi, India. The main objective is to formulate a statistical model of a solar and diesel generator-based hybrid system with EVs and a backup grid. Furthermore, the purpose of this research is to reduce power interchange with the grid. The salp swarm algorithm (SSA) and the modified salp swarm algorithm (MSSA) have never been introduced before for satisfying the EV load requirement using hybrid SPV and DG with utility grid as a backup. To our knowledge, no previous study has compared the performance of so many different sizing methodologies on a single energy system. Hence, the assessment described in this article will be a useful guide for researchers looking to select a technique for their sizing concern.
1.3. Contribution
A solar PV module, diesel generator, battery storage, and backup grid are all part of the hybrid energy system being investigated. The system is designed as a simple micro grid to test the algorithms’ performance against a conventional framework. The system’s total net present cost (TNPC) is minimized, while the lack of power supply probability (LPSP) is taken into account as a reliability restriction. In addition, the levelized cost of energy cost (LCOE) is used to evaluate the hybrid energy system. The optimization technique is based on real-time solar irradiation and ambient temperature data collected over one year.
In light of the preceding discussions, the following are the key objectives of this paper:
- Identify the optimal EVCS design using realistic inputs on physical, operating, and economic features of RE sources, such as SPV and DG, with the utility grid.
- To create a novel idea that combines a photovoltaic module with DG to provide electricity for charging plug-in electric vehicles.
- To assess the technological, financial, and ecological viability of the proposed model.
- Two novel methods, SSA and MSSA, are discussed and employed in the sizing problem of the system component for the first time. The efficacy of such methods is assessed and equated in terms of consistency, convergence cycle, and processing time.
The rest of this article is laid out as follows. The modeling of the various components of a hybrid energy system is performed in Section 2. The problem formulation is elaborated in Section 3. The proposed optimization methodology is discussed in Section 4. The results are thoroughly discussed in Section 5. Future challenges and opportunities are presented in Section 6. Finally, conclusions are stated in Section 7.
2. Hybrid System Components and Their Mathematical Modeling
The mathematical modeling of the hybrid energy system to meet the charging demand of EVs is described in this section. An SPV panel, DG, battery, inverter, and backup grid are all part of the hybrid energy system under consideration. To enhance load supply reliability, the battery is utilized to control the variation of RE generation. A graphical representation of the proposed SPV/DG/battery storage system is shown in Figure 2. The methodology for conducting this research work is shown in Figure 3.
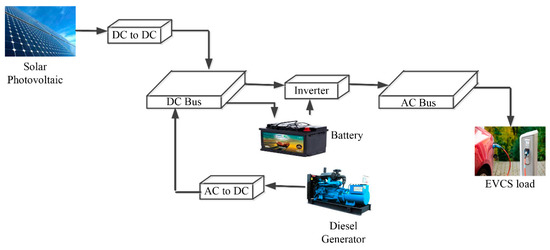
Figure 2.
Schematic representation of the proposed hybrid energy system.
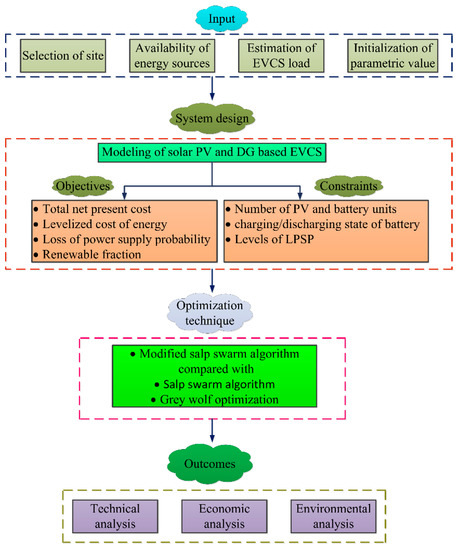
Figure 3.
A schematic representation of the system analysis and design procedure.
2.1. SPV Panel Output
Solar radiation is the most prevalent component on the planet, as well as being the most robust RE source. It is comparatively simple to execute and can be made affordable in all remote areas of the country. Concerning the maximum output pattern of SPV, modules are widely used to estimate the quality of an SPV generation system to its peak power. SPV panels are used to generate electricity by collecting solar energy. Only a small portion of the solar radiation that penetrates the SPV panels is transformed to electricity, with the remainder being converted to heat. Several factors can influence the quality of the SPV power output. The power output obtained from SPV is dependent on the area of the panel, solar irradiance incident on the surface of the panel, temperature of the SPV cells, and geographical parameters, i.e., latitude and longitude of the panel location, using Equation (1):
where is the efficiency of solar panels, represents the surface area of the solar panel, denotes the hourly solar irradiance falling on the surface of the solar panel, and is the temperature of the cell. The parameters taken for the selected PV panel are tabulated in Table 2.
The temperature of the cell and the fluctuation of power as a function of temperature are given by
where is the ambient temperature.
The rated maximum power output of solar panel can be expressed as
where denotes the maximum value of voltage, and represents the maximum current, respectively.
The overall power generated using SPV modules can be estimated by
where is the number of the installed solar PV panels.
2.2. Diesel Generator (DG)
The quantity of energy storage necessary for isolated villages and rural enterprises can be lowered by using DGs, resulting in a profitable and reliable solution. In the event of battery degradation during peak loads, diesel can be used as a backup source of energy.
The DG’s efficiency and hourly fuel usage should be accounted for when planning a hybrid system and may be represented using the equation below [34]:
where u(t) is the fuel consumption in liters per hour, is produced power in kW, is the rated power, a (0.246) and b (0.08415) are constant parameters in liter per kW, which characterize the coefficients of fuel consumption.
The efficiency of DG can be computed by
where is the overall efficiency of DG, whereas represents the brake thermal efficiency of DG.
2.3. Modeling of Battery Energy Storage System (BESS)
Due to the erratic nature of SPV output, optimum battery sizing is essential to meet the load demand. The existing state of charge (SOC) is the most important decision variable for monitoring the charging/discharging states of the battery. Overcharging of the battery takes place when the hybrid model generates too much power or when the load demand is too low. When the battery’s SOC reaches its maximum value, i.e., SOC (max), the control system gets involved and stops the charging mechanism, whereas when it acquires its minimum value, i.e., SOC (min), the control system disables the load to avoid the battery from being drained [45].
There are instances when the state of the battery varies depending on the power output and load demand. The battery performs an important role in the system’s energy management by adjusting power demands and power supply. The battery is said to be charging when the generated power is higher than the required energy, and the charging state of the battery at time t is given by [45]
On the other hand, when RE sources are unable to create enough power to meet demand, the battery is employed as a backup to feed the load system and operate in discharging state. The discharging state of the battery at time t is given by
where are the SOC of battery at an instant () and , is the self-discharge rate of the battery, is the efficiency of bi-directional inverter used, are the power output of SPV and DG, respectively, and is the round trip efficiency of the battery. The round-trip efficiency of the battery can be expressed using Equation (9):
where represents the charging efficiency of the battery, whereas denotes the discharging efficiency of the battery. The round-trip efficiency of the battery bank is reported to be 92.2 percent. Furthermore, charging/discharging efficiencies are assumed to be 85/100 percent, respectively. round-trip efficiency of the battery is the maximum value of SOC and is equivalent to the total energy of the battery bank (Ampere hour), as follows:
where is the energy of a single battery, represents the total number of batteries, and represents the number of batteries connected in series. The battery bank is only allowed to discharge to a certain minimal level, known as . This restriction can be used as a system constraint depending on how the battery bank is utilized. Batteries are arranged in series to get the desired bus voltage. The number of batteries in a series can be computed using the formula
where is the voltage level of a single battery.
The maximum charge/discharge power at any given time is another important consideration in battery modeling. It is determined by the maximum charging current and may be computed using the equation below:
where is the maximum charging current drawn by the battery in amperes, and is the maximum input/output power of the battery.
2.4. Bi-Directional Inverter Modeling
The bi-directional inverter performs the function of conversion of DC to AC power and vice versa. Solar panels provide DC electricity to EVs at the charging station. Hence, the bi-directional inverter is required to transform the DC power of SPV. The output of the bi-directional inverter can be computed as follows:
The proposed system takes into account a bi-directional inverter efficiency of 97 percent.
2.5. Utility Grid
In the first phase, when the demand exceeds the generated power from the different energy sources and BESS capacity, the energy shortage can be fulfilled by borrowing the energy from the grid network and may be represented using Equation (14):
where represents the energy to be borrowed from the grid in kWh, and denotes the minimum SOC of battery.
In the second phase, when the demand is less than the generated power from the different energy sources, and the battery is wholly charged, the extra energy is sold to the utility grid and may be represented using Equation (15):
where represents the extra energy to be sold to the grid in kWh, and denotes the maximum SOC of the battery.
2.6. Modeling of EVCS Load
The main components of EVCS are dual converter, charging ports, and EVs. The charging station is coupled to a regulator, which facilitates controlling the direction of the power flow at a specific time. The charging of EV takes place based on its current SOC. SOC is defined as the ratio of available charging state to the maximum charging state, i.e., when the battery is fully charged. Hence, it describes how much battery needs to be charged.
The amount of power consumed by an EV is determined by the distance traveled, battery capacity, and driving mode. An EV uses power, which may be estimated using the equation
where is the number of kilometers traveled, the power needed per kilometer is , and T is the time to recharge the battery. T is the difference between the time of arrival and departure. T is determined by the SOC of the vehicle’s battery. The power requirement of an EV can be illustrated using the capacity of battery, SOC, and time of charging:
where represents the capacity of the EV battery, and are the maximum and minimum limit of SOC, and T denotes the duration of charging.
Therefore, the total power required for charging the N number of EVs is given as follows:
The technical features of different components of a hybrid energy system are summarized in Table 2.
Table 2.
Technical and economic parameters of different hybrid system components.
Table 2.
Technical and economic parameters of different hybrid system components.
| Components | Characteristics | Values |
|---|---|---|
| Solar PV panel (Canadian Solar Max Power CS6X-325P) [6] | Rated power | 325 W |
| Normal operating cell temperature | 45 ± 2 °C | |
| 45.5 Volts | ||
| ) | 9.34 Amps | |
| Module efficiency: | 16.94% | |
| Dimensions | 76.90 × 38.70 × 1.57 inches | |
| Power tolerance | 0/+5 W | |
| Initial cost | USD 950/kW | |
| Replacement cost | USD 900/kW | |
| Operation and maintenance cost | USD 10/kW | |
| Life span | 25 years | |
| Derating factor | 80% | |
| Diesel generator (Generic 10 kW fixed capacity genset) [46] | Minimum load ratio | 50% |
| Heat recovery ratio | 10% | |
| Operating time | 15,000 h | |
| Fuel price | USD 1.21/L | |
| Density | 820 Kg/m3 | |
| Initial capital cost | USD 500/kW | |
| Replacement cost | USD 500/kW | |
| Operation and maintenance cost | USD 10 | |
| Battery (Generic 1 kWh lead acid) [47] | Battery material | Lead acid |
| Nominal voltage | 12 V | |
| Nominal capacity | 81–100 Ampere hour | |
| Lifetime | 5–8 years | |
| Initial capital cost | USD 235/kW | |
| Replacement cost | USD 190/kW | |
| Operation and maintenance cost | USD 2/kW/year | |
| Bi-directional converter [47] | Rated power | 100 kW |
| Initial capital cost | USD 171/kW | |
| Replacement cost | USD 171/kW | |
| Operation and maintenance cost | USD 4/kW/year | |
| Utility grid [36] | Grid purchase price | USD 0.12/kWh |
| Grid sell back price | USD 0.08/kWh | |
| Others [47] | Nominal interest rate | 3.75% |
| Inflation rate | 1.75% | |
| Lifetime of project | 25 years | |
| 0.95 | ||
| 0.35 | ||
| Inverter efficiency (%) | 0.95 | |
| Rectifier efficiency (%) | 0.95 |
3. Problem Formulation
In this paper, the problem formulation deals with the optimization of different configurations of energy system for satisfying the load demand of EVCS installed in the northwest region of Delhi, India, with real annual data of solar irradiance, temperature, and EV load. These configurations are stated as follows: (a) SPV/DG/battery-based EVCS, (b) SPV/battery-based EVCS, and (c) grid-and-SPV-based EVCS. The hybrid energy system is constructed with a maximum load of 25.45 kW, and the yearly average energy requirement is 257 kWh/day. The goal of optimization is to minimize the total net present cost (TNPC), keeping the reliability constraint in terms of loss of power supply probability within specified limits. Moreover, another parameter for analyzing the performance of the hybrid energy system is the levelized cost of energy (LCOE). The MSSA is implemented to improve its searching potential based on Levy flight distribution (LFD), enabling individuals to move to new locations and individual spiraling around the optimum solution to improve the exploitation phase. In this work, the energy management of the hybrid system is based on load following strategy (LFS). The numbers of SPV panels and batteries are chosen as the optimization variables, which are determined optimally using the MSSA. The primary goal of this research work is to perform a cost-effective analysis for all selected configurations with lowest TNPC, LCOE, and best reliability. The MSSA performance in the optimization of hybrid energy system is compared to conventional SSA and GWO. The objective functions, i.e., TNPC and LCOE and constraints, are coded in MATLAB environment considering the energy management strategy reported in Figure 4 and Figure 5 for SPV/DG/battery-based EVCS and grid-and-SPV-based EVCS, respectively.
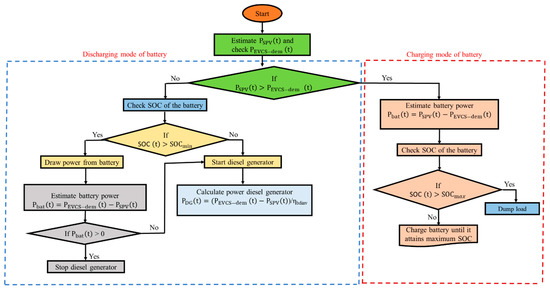
Figure 4.
Flow chart of the energy management strategy of the SPV/DG/battery system.
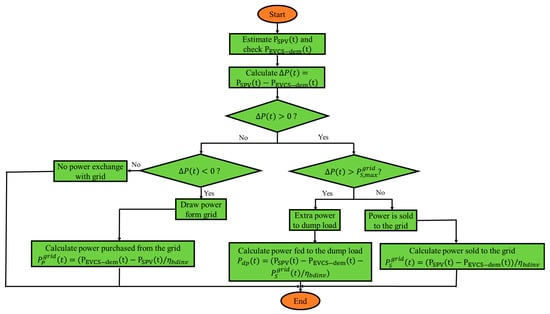
Figure 5.
Flow chart of the energy management strategy in grid-and-solar PV-based EVCS.
3.1. Assumptions
- Charging stations operate for the whole day.
- Different number of EVs arrive at charging station on a daily basis.
- Only one charging station is considered.
- Limited output power of battery is taken into account.
- Load following strategy (LFS) is considered.
- Diesel generator is allowed to operate only when no power output from SPV is available.
- Cost of EV charger is around USD 50.
3.2. Objective Functions
The optimal number of solar panels, i.e., and batteries, i.e., , must be determined to ensure that the system formulated in different configurations meets the charging demand of EVs. The objective function is formulated using the total net present cost (TNPC), levelized cost of energy (LCOE), and reliability in terms of loss of power supply probability (LPSP).
3.2.1. Total Net Present Cost (TNPC)
The total cost of a hybrid energy system is represented by the total net present cost (TNPC). It includes all costs and revenues incurred during the life cycle of the system, including system component capital costs, replacement costs incurred during the system’s operation, and maintenance expenses. The numbers of SPV panels and batteries are chosen as the two primary decision variables for the optimum configuration. Hence, mathematical equations for the NPC of various system components are derived as follows:
Solar PV
The project lifetime is set to be equivalent to the lifetime of PV panels in this study. Furthermore, solar irradiance is used as a free fuel to generate power. Therefore, there will be no fuel costs. There, NPC of solar PV () consists of capital cost , replacement cost , operation and maintenance cost , and salvage cost and can be given as follows
The capital cost of solar PV panels can be computed as
where denote the initial cost and power rating of each SPV panel, respectively.
Replacement cost, i.e., of SPV panel, can be determined using the following equation:
where denotes the cost of replacing the SPV panel, denotes the rate of interest, indicates the life span of the project in years, and represents the lifetime of the SPV panel.
Further, operation and maintenance cost can be computed as follows:
where is the OM cost of each panel, and is the escalation rate.
Salvage value is the cost of the component’s remaining life after the project is completed. The salvage cost of the SPV panel can be defined as
where denotes the resale price of the solar panel after completing its life, and is the inflation rate.
Battery
The NPC of battery storage system, i.e., , involves capital cost , replacement cost , operation and maintenance cost , and salvage cost and can be given as follows
where is the cost of one battery in USD. and indicate annual OM cost in USD/year and escalation rate (0.075) of batteries, respectively. denotes the resale value of one battery in USD.
The battery life () has been considered to be 5 years in this study, which is shorter than the project lifetime of 25 years. Hence, the battery must be replaced every 5 years. The number of battery replacements (NBR) is determined as
The replacement cost of the battery can be determined as
Bi-Directional Inverter
The NPC of the bi-directional inverter can be calculated as
where represent the initial capital cost, replacement cost, operation and maintenance cost, and salvage cost of the bi-directional inverter, respectively.
The inverter’s assumed lifetime is 10 years, which is shorter than the project’s lifespan (25 years). As a result, the net present value of the replacement cost of the inverter is expressed as follows:
Sale and Purchase Capacity with Utility Grid
In an on-grid system, the NPC of selling electricity to the grid or purchasing electricity from the grid can be evaluated as follows:
where and indicate the cost for unit sale and of purchase of electricity to and from the utility grid, respectively. It is defined in USD per kWh.
Hence, one of the objectives of this research work is to minimize the TNPC of the system, which is described as follows:
3.2.2. Levelized Cost of Energy (LCOE)
Levelized cost of energy may be defined as the average cost incurred per kW of energy production by the system. LCOE is computed by dividing the annualized cost of energy generation by the total energy production per year. It can be computed with the help of capital recovery factor (CRF), using the following Equation (38) [10]:
CRF can be evaluated using Equation (39), as follows:
LCOE depends on numerous features, such as capital cost, solar radiation, lifetime, operation and maintenance cost, CRF and degradation of the SPV panels used, etc.
3.2.3. Renewable Fraction
The renewable fraction (RF) is an important criterion to consider when designing an energy system. The total energy produced via RE sources is divided by the total power drawn by the load to calculate the RF. RF can be calculated using Equation (40):
3.3. Decision Variables and Constraints
To optimize the hybrid system, a compromise must be made between the cost-based objectives and various technical constraints. However, the proposed optimization approach should be used to obtain the optimal decision variables. The decision variable of the suggested optimization procedure is subject to specific limits: the minimum limit put on the number of SPVs and battery, and the = 1000, = 600.
- The following are the limits associated with the maximum and minimum sizes of decision variables:
- The charging state of the battery should be preserved using Equation (44). At any given time, the amount of energy stored in the battery is limited by the maximum and minimum quantities and as follows:
takes the value of the theoretical capacity of the battery . The maximum depth of discharge, i.e., DOD and theoretical capacity is used to calculate , as expressed in Equation (45):
DOD is assumed to be 50%.
- The maximum permissible lack of power supply should be considered for a reliable system:
3.4. Operational Strategy
3.4.1. Solar PV and Diesel Generator-Based EVCS
To attain the reliability of the system in any hybrid energy system, optimal energy management is required. In this system, the DG is kept at the bottom of that list, which means it only needs to operate when the solar and battery systems are unable to supply the load requirement. The steps for the simplest implementation strategy for SPV/DG/battery system are as follows:
- If the total power generated by SPV panels is sufficient, demand can be met solely by solar power. After the load has been satisfied, excess electricity can be supplied to the BESS and is provided as follows:
- In the preceding case, if is greater than the maximum permissible capacity of the BESS, i.e., , then additional energy can be dumped or directed to deferrable loads. Excess or dump energy can be given as
- If the SPV panels do not generate sufficient power, the battery can provide the remaining power, which can be calculated as
- If solar power is insufficient and batteries are unable to generate the required power to meet the power requirements, DG is used to energize the load. There are two ways to use DG.
- (a)
- First, it employs a load-following strategy, which means that whenever it performs, it produces only the power necessary to satisfy the primary load requirements. The diesel generator’s power output is calculated as
- (b)
- In the second strategy, it runs at maximum capacity or minimum load ratio. When the DG is fully operational, the surplus energy is used to charge batteries and is expressed as follows:
The operational strategy of the SPV/DG/battery system can be understood with the help of the flow chart depicted in Figure 4.
3.4.2. Grid-and-Solar PV-Based EVCS
In this scenario, it is assumed that SPV is the only source to satisfy the load demand of EVs. The difference between power obtained by SPV and power demand by EVs can be determined as
If solar panels are unable to fulfill the power requirements of EV load, the extra power is purchased from the grid network () to meet the requirements.
Furthermore, if more power is available from the SPV after meeting the requirements, it is sold to the grid (). Nevertheless, there are some limitations on selling and purchasing power to and from the grid, which are defined as maximum purchase capacity of grid () and maximum selling capacity of grid (). Beyond these limits, power cannot be purchased from or sold to the grid. The following cases are formed depending on the .
- When SPVs alone fulfill the power requirement of EV load, i.e., , the extra power is sold to the grid network, which can be determined as
- When SPV power output is high enough, which fulfills the power requirement of EV load, as well as exceeds the maximum selling capacity of grid (), i.e., and , the extra power is fed to the dump load, which can be determined as
- ▪
- When SPV power is unable to satisfy the charging demand of EVs, i.e., , power is purchased from the grid which can be computed as
- If , there is no exchange of power from grid, and SPV power fulfills the load requirement.
- When both SPV and grid are unable to satisfy the load demand, deficiency of power takes place, which can be given as
must be zero to make sure the total power requirement of EV load demand is served in a reliable manner when minimizing the LPSP.
The LPSP can be kept within a specific tolerance band to solve the optimization problem. In this paper, the maximum limit of LPSP, i.e., is assumed to be 1%. The energy management strategy for grid-and-solar PV-based EVCS can be demonstrated with the help of the flow chart shown in Figure 5.
4. Proposed Modified Salp Swarm Algorithm for Sizing of Hybrid Energy System
A brief discussion of the SSA and MSSA algorithms is presented in this section because they have yet to be examined for the application of optimal sizing of different energy sources for the designing of EVCS load in the northwest region of Delhi, India.
It is worth noting that the SSA is a robust heuristic algorithm that has been used to solve a variety of problems. However, it is susceptible to local optima in some instances and suffers from stagnation. To render and combat the shortcomings of the conventional SSA, an MSSA is presented. The suggested MSSA employs two different searching procedures to improve its searching potential. The first technique is to use Levy flight distribution (LFD) to improve the searching process, enabling individuals to move to new locations. The second technique relies on the individual spiraling around the optimum solution to improve the exploitation phase. Algorithm 1 [48] and Algorithm 2 [49] contain the pseudocode for the traditional SSA and the modified MSSA, respectively, whereas Figure 6 depicts the graphical representation of MSSA for SPV/DG/battery system optimization.
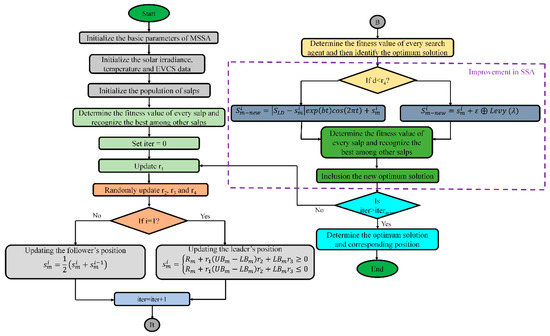
Figure 6.
Graphical representation of MSSA for SPV/DG/battery system optimization.
4.1. Salp Swarm Algorithm (SSA)
In 2017, S. Mirjalili presented an individual-based algorithm known as salp swarm algorithm [48]. SSA models the mechanism of swarm salps, which will be scavenged in oceans. The salp at the front of the chain will be the leader, while the other salps will be considered followers in the ocean.
Like that of other meta-heuristic algorithms, the position of salp can be defined in n dimensions, where n is the number of variables for a specific problem. Hence, the positions of all salps are maintained in a two-dimensional matrix known as s. For example, it is assumed that the food source (R) is available in search space and considered as the target of all salps in a swarm. So, the describing equations of SSA are given as follows:
where indicates the position of leader, while represents the position of the food source. and denote the upper and lower bound in m-th dimension of search space.
The coefficient plays a vital role in SSA because it maintains a proper balance between exploration and exploitation capability and can be expressed as follows:
where denotes the current iteration, while represents the maximum iterations.
The parameters and are uniformly produced random values, which lie in the range of 0 and 1. They specify whether the next point in the m-th dimension should be toward positive or negative infinity, as well as the step size.
The positions of the follower salps are updated in accordance with the newton second law of motion, which is stated as follows:
where and depict the position of i-th follower salp in m-th dimension, denotes the initial velocity, and , where .
The simulation time is determined by the number of iterations, and if the conflict between iterations is equal to 1, and assuming , this equation will be as follows:
The salp chains can be modeled with the help of Equations (57)–(60).
| Algorithm 1: Pseudocode of conventional SSA method | |
| Start SSA | |
| Step 1: Fix the basic parameters of SSA algorithm, such as maximum iterations (P), population number, the upper and lower limits of the decision variables | |
| Step 2: Randomly initialize the population of salps individuals | |
| Step 3: Calculate the fitness function for each salp | |
| Step 4: Set iteration = 1 | |
| Step 5: according to Equation (58) | |
| Step 6: For every member of salps, if i == 1, update the position of leading salp by Equation (57) Otherwise, update the position of follower salp by Equation (60) ) if there is a superior solution Increment t to 1 is satisfied | |
| Step 7:) | |
| End SSA | |
4.2. Modified Salp Swarm Algorithm (MSSA)
The MSSA is intended to address the shortcomings of the traditional SSA, such as its proclivity to local optima and stagnation in some circumstances [49]. To improve the capability of the traditional SSA, two search techniques are described. The first adjustment is used to speed up the exploration process by changing the positions of salps using the Levy flight distribution (LFD) to help the population find new places and break the cycle of stagnation. The second change entails changing and updating the locations of salps in the spiral path around the optimum solution to improve its exploitation. The first change, which is based on the LFD, is written as follows:
where ε denotes a step size parameter that is set as follows:
where and can be obtained as follows:
where indicates the standard gamma function. The second modification is based on modifying the locations of salps in the spiral path around the best solution, which can be expressed as follows:
The second adjustment is to change the salp locations in the spiral path around the optimum solution, which may be represented as follows:
where b is a number used to characterize the shape of a logarithmic spiral. The adaptive operator d is used to perform the job of balancing the exploration and exploitation processes:
where and are the maximum and minimum values of adaptive operator d. Lastly, the MSSA’s exploring potential is enhanced by improving the exploration ability with the LFD by applying Equation (59) at the first iteration when the value of is small, and the exploitation capability can be enhanced with the variable bandwidth transition by applying Equation (63) at the last iteration when the value of is large.
| Algorithm 2: Pseudocode of modified SSA method | |
| Start MSSA | |
| Step 1: Fix the basic parameters of SSA algorithm, such as maximum iterations (), population number, the upper and lower limits of the decision variables | |
| Step 2: Randomly initialize the population of salps individuals | |
| Step 3: Calculate the fitness function for each salp | |
| Step 4: Set iteration = 1 | |
| Step 5: Update according to Equation (58) | |
| Step 6: For every member of salps, if i == 1, update the position of leading salp by Equation (57) Otherwise, update the position of follower salp by Equation (60) Fitness calculation of every salp: Update (), if there is a superior solution Increment t to 1 Repeat steps 5 to 7 until is satisfied | |
| Step 7: Arranging the salp according to their fitness values | |
| Step 8: Update the d value according to Equation (67) | |
| Step 9: Compare the value of d with a random value If the value of d is less than Update the salp positions based on the spiral orientation according to Equation (66) Else Update the salp positions based on Levy distribution according to Equation (61) End | |
| Step 10: Calculate the fitness function of the updated salps. Then, include the new solutions if these solutions are better than the solutions of the previous steps Increment t to 1 Repeat steps 5 to 7 until () is satisfied | |
| Step 11: Return the best solution () and its fitness value F () | |
| End MSSA | |
5. Results and Discussion
5.1. Components and Methods
This section contains the important components, such as the place of the study area, resources available, and the load demand of the developed framework.
5.1.1. Area under Study
The proposed study is conducted in the northwest region of Delhi, India. The geographical coordinates of the studied area are 28.7408° N (latitude), 77.1126° E (longitude). Figure 7 depicts the study area from a geographical standpoint. The population of Rohini sector-17 is 21,460 individuals. Because the majority of citizens in this area are cultured and working, EVs are employed as a mode of transportation to get to their destinations on a day-to-day basis. This area has nearly 120–150 EVs, and there are 15 facilities in which these vehicles are kept and provided with electricity. As per the owner of different facilities, the amount required to charge the EVs is significantly high because these vehicles are charged using the grid.
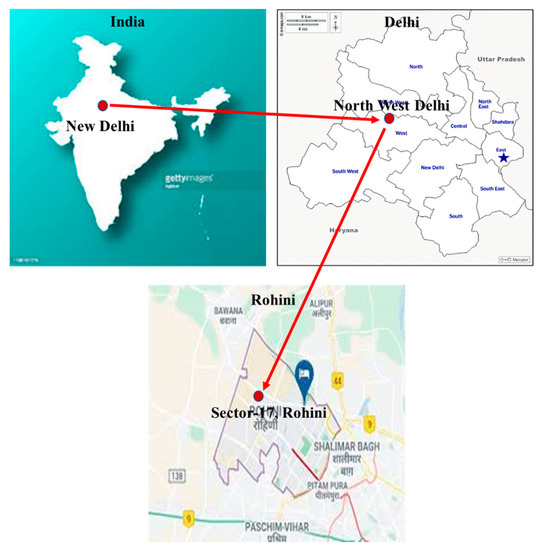
Figure 7.
The geographical view of the study area.
5.1.2. Assessment of the Available Energy Sources
Solar radiation in Delhi is at its highest from March to October. It is available during the wintertime, but not at its high point. Additionally, it is regarded as an outstanding source of energy due to its practical features. Figure 8 shows the annual variation of irradiance at the chosen area. Figure 8 also depicts the clearness index, which is the percentage of solar radiation that is reflected by the atmosphere. It can also be defined as the ratio of surface irradiance and extraterrestrial irradiance. Figure 9 portrays the annual fluctuation of temperature for the study site. The DG is also incorporated as one of the energy providers in the proposed research work. Energy generation from DG is comparatively easy and cost effective as well. Thus, DG is used for charging EVs, especially during peak hours.
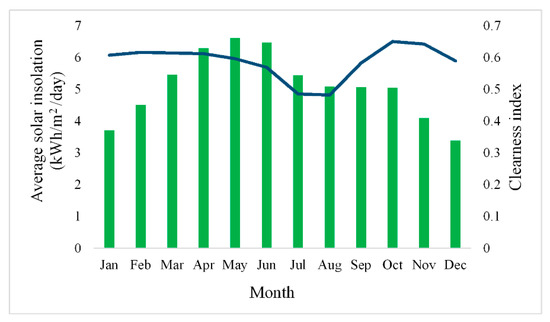
Figure 8.
Annual variation of solar insolation and clearness index of the selected area.
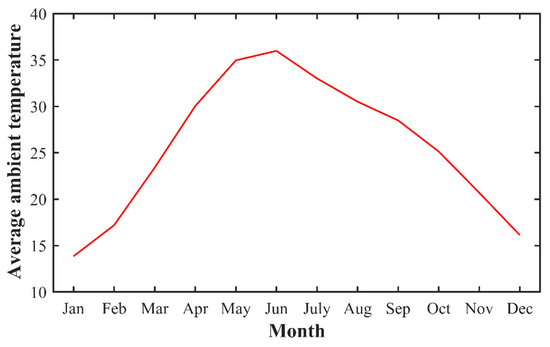
Figure 9.
Annual variation of the mean temperature of the selected area.
5.1.3. Assessment of the EVCS Load in the Selected Area
The research study considers three-wheeler EVs, i.e., e-rickshaw, to be the system’s load. Four 12-Volt lead-acid batteries with capacities of 160 to 180 Ampere hour are used in a three-wheeler. The theoretical battery energy is 2.2 kWh when the 12 V and 180 Ampere hour battery is considered. Generally, a 12 V battery is recharged to 90% of its design capacity. As a result, the battery’s energy would be 1.94 kWh. The total energy consumption for four 12 V battery vehicles, such as e-rickshaws, would be 7.8 kWh. Taking the system’s 15% system losses into account, the energy consumed is determined to be 9 kWh. Thus, the energy consumed by every e-rickshaw per day is 9 kWh. According to the research findings, the yearly average energy is 257 kWh/day, the average power is 10.71 kW, and the maximum load is 25.45 kW. A graphical representation of the EVCS load on an hourly and daily basis is shown in Figure 10 and Figure 11, respectively.
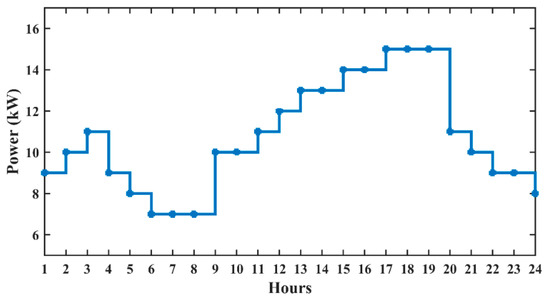
Figure 10.
EVCS load profile on a daily basis.
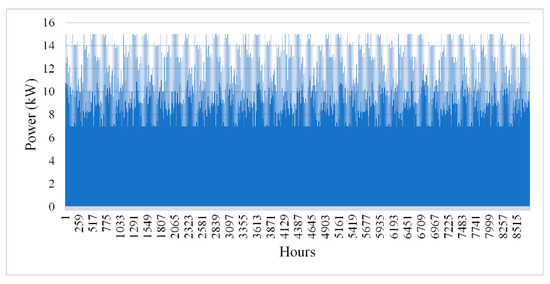
Figure 11.
EVCS load profile on an hourly basis.
5.2. Implementation of Proposed MSSA Technique on Benchmark Functions
This section explores the application of the proposed MSSA technique on standard benchmark functions. Table 3 contains comprehensive descriptions of these functions. The proposed optimization strategy outperforms SSA and GWO in terms of maximum iterations and optimal solution of seven mathematical benchmark functions for 30 independent runs. MSSA adheres to a globally optimal solution without becoming stuck in a local optimal solution, resulting in faster convergence. Table 4 displays the numerical outcomes in terms of optimum solution and number of iterations.
Table 3.
Standard benchmark functions.
Table 4.
Numerical results obtained using MSSA and their comparison with SSA and GWO.
5.3. Simulation Outcomes and Main Findings
This section evaluates the technical and economic parameters for three different scenarios using HOMER software and the proposed MSSA technique. These scenarios are SPV- and DG-based EVCS, only SPV-based EVCS, and grid-and-SPV-based EVCS. The objective is to achieve the best EVCS design by reducing the total net present cost, levelized cost of energy while keeping the lack of power supply probability within limits, accounting for environmental emissions, and different energy supply options. The outcomes are estimated in terms of TNPC, LCOE, SPV energy, the contribution of DG, battery and converter capacity, additional electricity generation, and the proportion of renewables utilized. The study then compares a hybrid energy system with a grid connection to a standalone system. The analysis of the obtained results for different scenarios is summarized in the latter part of this section. Furthermore, to demonstrate the efficacy of meta-heuristic techniques, different algorithms are used to analyze the results and are compared and contrasted with HOMER results. The three different scenarios considered are as follows:
- Scenario 1: Solar PV and diesel generator–based EVCS
This scenario addresses “range anxiety,” a prevalent consideration among EV users about the vehicle’s range. EV users can schedule long trips with greater certainty if an EVCS is as easily accessible as a petrol pump. Hence, the layout of an EVCS on roadways with SPV, DG, and a BESS with the different electricity providers is investigated and considered as Scenario 1. The goal is to reduce the capital, operation and maintenance, replacement, and fuel cost of every component associated with the system. The size and number of the SPV, DG, battery, and converter are considered to be the decision variable of the optimization problem.
- Scenario 2: Only Solar PV–based EVCS
In some countries, such as Saudi Arabia, the DG acts as a primary source of energy. In such cases, the diesel option is a good example. On the other hand, DG units are prohibitively expensive due to the high costs of maintenance, fuel supply, and fuel transport. Furthermore, DGs emit a lot of pollution. Hence, SPV- and battery-based EVCS are also being investigated and considered as Scenario 2. In this scenario, the size and number of solar PVs and batteries are the only decision variables.
- Scenario 3: Grid-and-solar PV–based EVCS
In this scenario, the EVCS is supposed to be grid-connected, and solar PV, battery, and grid are the various energy supply sources. Because EVCS is grid connected, it can purchase/sell power from/to the grid network, and the design is improved to account for the EVCS’s net costs. The price of electricity provided in the Feed-in Tariff program of New Delhi, India, is taken into account for drawing/selling power from/to the utility grid. Feed-in Tariffs are the rates charged to RE providers for the energy provided by their power plants. The evaluating model is distinguished by project length and technology method and offers a profitable return on investment. The Feed-in-Tariff is a standard rate for the buying and selling of power from and to the grid network throughout the agreement, whereas the Time-of-Use Tariff is only pertinent to buyers, in contrast to Feed-in Tariffs, and varies throughout the day over time. In this work, Feed-in Tariffs are considered.
5.3.1. Techno–Economic Analysis of Different Scenarios Using HOMER Software
HOMER is used to model the hybrid energy system to meet the load demand. HOMER defines weather information, different parametric values of components used, and EVCS load profile. Many different assumptions are made to attain the optimal plan that decreases the TNPC, LCOE, while maintaining restrictions, such as supply continuity. It is worth noting that the information related to cost is indicated in USD.
Table 5 shows the results obtained for Scenario 1, i.e., SPV/DG/battery system. SPV makes a significant contribution of 122,864 kWh per year and operates for 4369 h per year, while the DG constitutes 2767 kWh per year and functions for 364 h per year. To operate optimally, this system makes use of 590 batteries and a 12.1 kW bi-directional converter. The obtained system has a TNPC of USD 638,917.29, an initial capital cost of USD 375,855, and an operating cost of USD 16,144.69. The LCOE for this configuration is calculated to be USD 0.6328/kWh. Furthermore, the NPC of SPV and diesel generator is 42.8 percent and 11.1 percent of TNPC, respectively, whereas the NPC of the bi-directional converter is only 0.58 percent of TNPC.
Table 5.
Results attained using HOMER software for Scenario 1.
Similarly, Table 6 and Table 7 display the outcomes of Scenarios 2 and 3, respectively. When the only energy-producing source is an SPV and a battery, the LCOE is USD 0.7318/kWh, the TNPC is USD 875,481.24. In Scenario 3, when the grid is used to meet load demand, the LCOE is USD 0.587/kWh, and the TNPC is USD 275,349. In this scenario, the energy produced by SPV is 126,811 kWh per year, accounting for 71.3 percent of total energy production, while energy purchased from the grid is 51,155 kWh per year, accounting for 28.7 percent of total energy generation.
Table 6.
Results attained using HOMER software for Scenario 2.
Table 7.
Results attained using HOMER software for Scenario 3.
5.3.2. Techno-Economic Analysis of Different Scenarios Using Meta-Heuristic Algorithms
This section contains a summary of the optimization results obtained using various meta-heuristic techniques, as well as a comparison of those results for the various scenarios. The MSSA, SSA, and GWO are used in 30 separate runs with a population size of 50 and a maximum iteration of 100, with the best results cropped. The basic parameters used in the optimization problem are tabulated in Table 8. The three considered algorithms are executed for each scenario.
Table 8.
Parameters used in MSSA.
- Techno–economic analysis for Scenario 1 (solar PV and diesel generator-based EVCS)
Table 9 shows a comparison of results for Scenario 1 using MSSA, SSA, and GWO in terms of LCOE, TNPC, and computational time. According to Table 9, MSSA has the lowest TNPC, LCOE, and computational time with USD 584,566.44, USD 0.4822/kWh, and 27,615.716 s, respectively, due to its lower capital, replacement, and operation and maintenance costs. MSSA takes less time than other compared techniques and gives minimum TNPC and LCOE as well. SSA comes in the second place, with high TNPC, LCOE, and taking more time to compute the results as compared to MSSA, whereas GWO gives a high value of TNPC, LCOE, and is slowest in comparison to the previous two meta-heuristic techniques. This system necessitates 232 SPV panels with 325 W energy, 3284 kWh of energy production per year from a diesel generator rated at 10 kW, 650 battery units, and 9 bi-directional converters rated at 100 kW. The maximum energy flow from the DC bus to the AC bus or vice versa determines the energy of a bi-directional converter.
Table 9.
Comparative study of achieved outcomes using meta-heuristic techniques for Scenario 1.
Figure 12 depicts hourly information about power generation for a three-day sample (1–3 October). It is observed that maximum EVs are charged during night hours, and there is no solar output available during that time. Hence, the energy requirement is fulfilled by DG and BESS using energy flow through the converter, as indicated in Figure 12. When PV power generates more than the load demand during the day, surplus electricity is used to charge the battery (Figure 12). Despite having a higher SPV energy, the converter energy is much lower in this context of system sizing. The amount of excess electricity produced in this scenario is 25,053 kWh per year, which is 19.2 % of total generated energy. It is worth noting that, despite the fact that the maximum energy shortage was set to zero, there was only a 23.7 kWh unmet load throughout the simulation model, accounting for 0.02 percent of the total load.
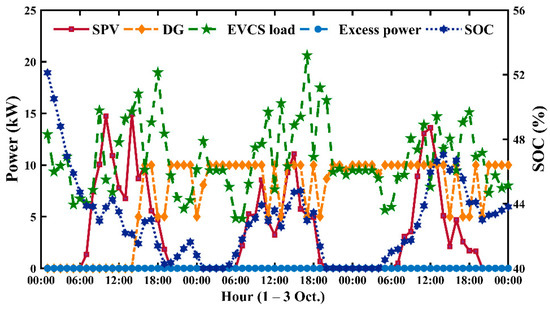
Figure 12.
Power analysis on an hourly basis of SPV/DG/battery system.
Figure 13 depicts a cost description of various system components for the SPV/DG/battery system. The SPV module and battery entail the most capital investment. Despite the fact that the BESS has a high cost of replacement over the project’s lifespan, the resource cost is significantly more than the investment. As a result, this hybrid energy system needs constant economic infusion to keep the system running properly.
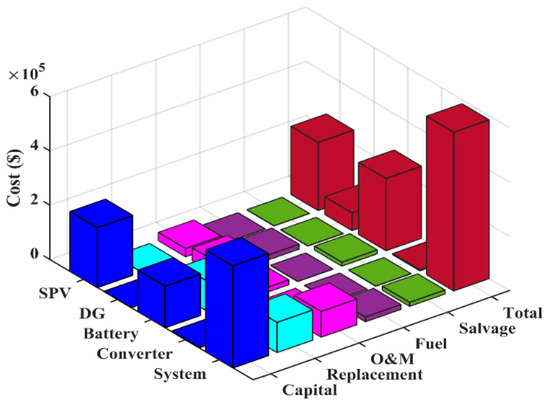
Figure 13.
Cost description of the various system components for the SPV/DG/battery system.
As shown in Figure 14, the DG contributes significantly when the load demand is high. The monthly average power production from the SPV module is lesser in summer weather in comparison to winter because of continuous rain and clouds in the summertime. Further, the effectiveness of the proposed algorithm, i.e., MSSA, can be proved using Figure 15. It has better convergence than other algorithms and results in a lower LCOE value.
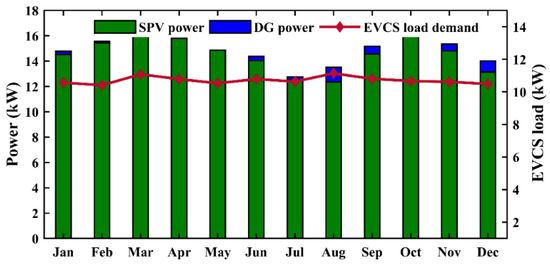
Figure 14.
Monthly average power share for satisfying EVCS load demand in SPV/DG/battery system.
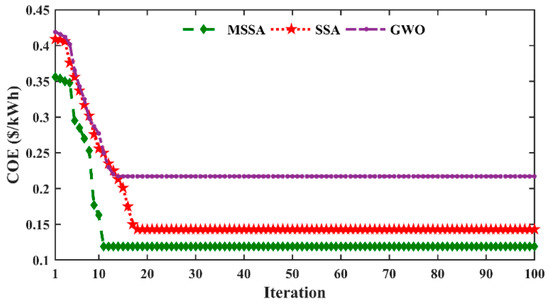
Figure 15.
Convergence curves of different optimizers.
- Techno–economic analysis for Scenario 2 (only solar PV/battery-based EVCS)
In Scenario 2, diesel generator is not available, and solar PV is the only energy source available to meet the EVCS load requirement. This PV/battery system has the greatest LCOE and TNPC because it uses a larger PV module and battery storage to meet power demands, which increases the cost and produces more surplus power (194,140 kWh per year). Table 10 provides the different technical and economic parameters optimized by various algorithms for SPV/battery system.
Table 10.
Comparative study of achieved outcomes using meta-heuristic techniques for Scenario 2.
As in Scenario 1, computation time taken by MSSA is less as compared to other techniques. This system requires 545 solar PV panels with 325 W energy, 548 battery units, and 12 bi-directional converters rated at 100 kW. MSSA gives better results when equated with other techniques and, hence, proved its efficacy to solve various optimization problems. The hourly information about power generation for a three-day sample for SPV/battery system is depicted in Figure 16. The cost description of the various system components for the SPV/battery system is shown in Figure 17.
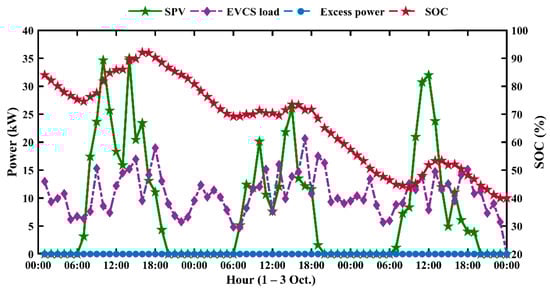
Figure 16.
Power analysis on an hourly basis of SPV/battery system.
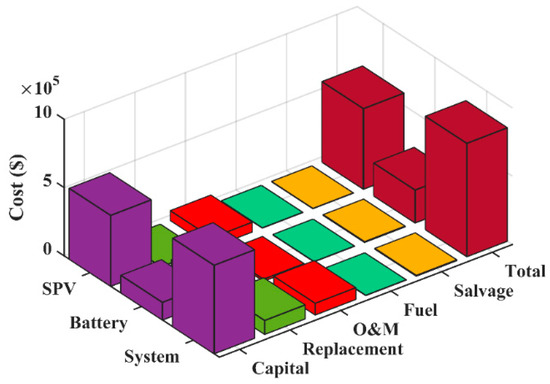
Figure 17.
Cost description of the various system components for the SPV/battery system.
- Techno–economic analysis for Scenario 3 (grid-and-solar PV-based EVCS)
This scenario looks at the technological, economic, and environmental concerns of hybrid energy systems connected to the grid. In this strategy, electricity is purchased from the grid to meet power requirements when solar PV is unable to fulfill them. Excess power is sold back to the grid, requiring a small storage capacity while leveraging the monumental amount of additional energy dumped in hybrid energy options. In this respect, a fixed grid power price is chosen to be USD 0.12/kWh and a fixed grid sell back price is selected to be USD 0.08/kWh. According to the results in Table 11, the grid-connected solar PV-based EVCS has a significantly lower LCOE (0.119/kWh) than the solar PV and diesel generator-based EVCS (USD 0.482/kWh) and solar PV/battery-based EVCS (USD 0.684/kWh). The hybrid energy system in Scenarios 1 and 2 requires more resources and battery storage than the grid-connected system. whereas in the grid-connected system, net grid purchase is zero, i.e., the amount of energy purchased from the grid is equal to the amount of energy sold to the grid, and no battery storage is required. Despite having a 232 PV module of 325 W energy and a 49.4 kW bi-directional converter, the grid-connected hybrid system needs no battery storage and has insubstantial energy costs due to a significantly lower LCOE (USD 0.119/kWh) compared to a solar PV and diesel generator-based EVCS (USD 0.482/kWh) and solar PV/battery-based EVCS (USD 0.684/kWh). It is also worth noting that MSSA has a lower TNPC (USD 263377) and LCOE (USD 0.119/kWh) than SSA and GWO. More prominently, the extra electricity in the grid-connected system (408 kWh/year) is considerably lower than in the solar PV and diesel generator-based EVCS (25,053 kWh/year) and solar PV/battery-based EVCS (194,140 kWh/year). This is because a large portion of excess energy is sold back to the grid, and only a few storage devices are needed to meet the requirement when solar power is not available.
Table 11.
Comparative study of achieved outcomes using meta-heuristic techniques for Scenario 3.
When solar power is not accessible, grid power meets the load requirements. According to Figure 18, the spring season necessitates a high amount of energy to be purchased from the grid due to higher power requirements. India, as a tropical country, has nearly equal solar exposure all year. Even though the summer season is supposed to generate more electricity from solar PV, rainy days lead to decreasing SPV production than the rest of the regular time of year.
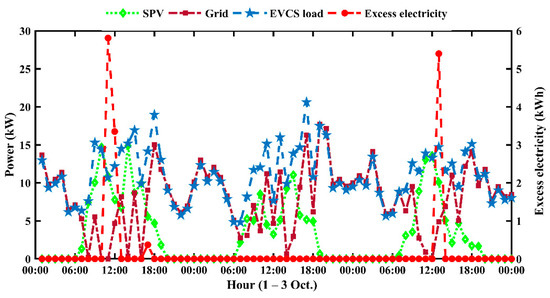
Figure 18.
Power analysis on an hourly basis for grid-and-solar PV-based EVCS.
Solar energy accounts for approximately 71.3 percent of total energy demand, with grid power accounting for the remaining 28.7 percent. Figure 19 depicts the time series data for various components used to satisfy the load demand. The cost description of the various system components for the grid-and-solar PV-based EVCS is shown in Figure 20. The monthly average energy purchased/sold from/to the grid is portrayed in Figure 21.
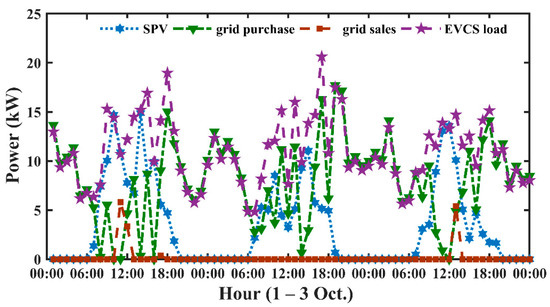
Figure 19.
Time series data for various components used to satisfy the load demand.
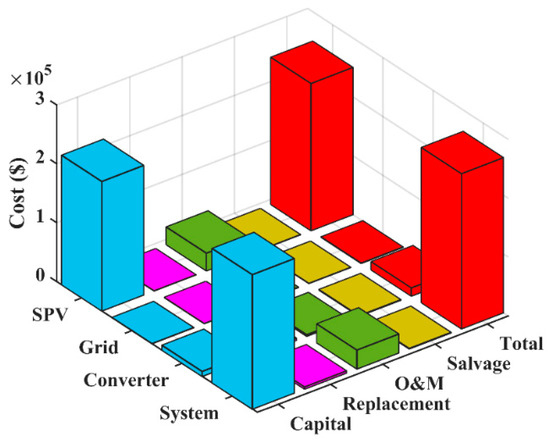
Figure 20.
The cost-wise breakup of different components in grid-and-solar PV-based EVCS.
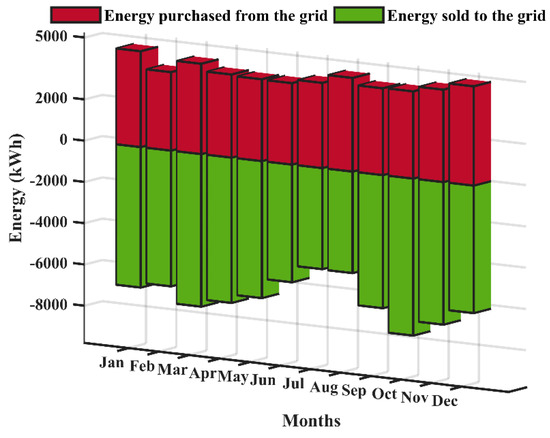
Figure 21.
Monthly average energy purchased from the grid and sold to the grid.
- Impact of grid purchase and grid sales on LCOE
The implications of energy buying from grid infrastructure and the quantity of energy being sold to the grid on the LCOE are outlined and discussed in this section. A net grid procurement of 0% indicates that the quantity of energy buying from and sold back to the grid is the same. The value of LCOE increases more with increasing purchases from the grid than with increasing grid sell-back, as shown in Figure 22. According to Figure 22, an increase in grid energy to fulfill load demand leads to an increase in LCOE. For example, a 50% increase in grid energy purchase versus selling back to the grid results in a 36% increase in LCOE.
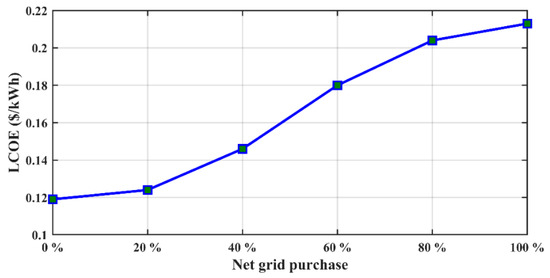
Figure 22.
Impact of net grid purchase on LCOE.
5.3.3. Analysis of the Environmental Emissions in Different Scenarios
As previously stated, one of the primary goals of this work is to lower emissions by utilizing renewable technologies. The results displayed in Table 12 show that SPV/battery-based EVCS (Scenario 2) reduces the overall emissions by a significant amount when equated to all other cases. However, while the SPV/DG/battery-based EVCS (Scenario 1) produces higher emissions than SPV/battery-based EVCS, it will be far more ecologically friendly than the grid-and-SPV-based EVCS.
Table 12.
Scenario-wise comparison of environmental emissions.
6. Future Challenges and Opportunities
Along with industrial and organizational advancement to promote RE set up in India, identifying the potential obstacles to project implementation is important. The hybrid energy system’s infrastructure and maintenance costs have hampered significant advances in RE technologies by increasing the COE. As a developing nation, most of the public are not able to avail high LCOE in comparison to traditional grid purchases. Financial constraints, such as ineffective economic pathways, intense competition with fossil fuels, a scarcity of shareholders, and very few public subsidies, all had a substantial influence on the growth of hybrid energy systems [50]. Furthermore, less economic investment and funding constraints as a result of the low lending charges and longer repayment time make RE investment dangerous. Although economic inflation and growing population necessarily dictate electricity requirements, substituting the current infrastructure with 100 percent renewable use is neither technically nor economically feasible due to ambiguity in energy price in the future [51]. There are still technical intricacies, such as specifications, indicators, processes, instructions, and power management systems for hybrid energy systems. In the meantime, research efforts to overcome such technological challenges are critical and must be taken into consideration when planning a hybrid energy system [52].
Despite their multiple issues, the hybrid energy systems provide lots of opportunities in the area of natural, cultural, financial, and energy security concerns. The hybrid energy system will reduce greenhouse gas emissions and protect the natural environment from deterioration. The steep decline in PV and wind prices will hasten the implementation of a hybrid energy system with a massive decrease in original investment. The International Renewable Energy Agency (IRENA) forecasted a 74% and a 24% decline in SPV and WT prices by 2020, respectively. Furthermore, continuing research and rapid technological advancements encourage RE systems to start competing with traditional energy sources. Effective hybrid technology selection, taking into account geographical region and environmental consequences, will broaden the existing energy resources and minimize reliance on non-renewable resources. Furthermore, these schemes will have an impact on employment options, the standard of living, business growth, health problems, economic status, women’s rights, and economic development. RE is among the most basic needs for human progress, and it can help to generate earnings, improve healthcare and education performance, and poverty eradication. India is geologically favored for the spread of solar energy. Despite the numerous advantages of RE sources, the bulk of people are unwilling to accept the advanced technologies. The lack of knowledge shared among stakeholders is needed for the implementation of the RE-based hybridized micro-grid. In this respect, the government of India can introduce such projects through a public–private partnership framework, in which a group of developers, with support from the government, will participate in putting such projects in place.
7. Conclusions
Hybrid energy systems can deliver energy to the grid and off-grid sites cost effectively and reliably. The efficiency of the system improves when RE components are implemented with the grid. In this article, the complete mathematical modeling is presented for the diverse configurations of the hybrid energy system to meet the load requirements of EVCS situated in the northwest region of Delhi, India. The financial, technological, and ecologic implications of different configurations are also carefully investigated. The use of meta-heuristic methods, which include MSSA, SSA, and GWO, is carried out to optimize the objective functions. The obtained results using MSSA are compared with HOMER software and other techniques. According to comparisons, MSSA gives a more efficient solution than HOMER. Furthermore, the MSSA offers a robust framework, which aids model development. In all three configurations, the MSSA results in reduced LCOE values of USD 0.482/kWh, USD 0.684/kWh, and USD 0.119/kWh, respectively. According to the analysis, the grid-connected solar PV-based EVCS offers significant cost savings over the other two configurations. In addition, a hybrid energy system with equal grid purchase and sell-back can be a profitable choice. More significantly, the LCOE associated with the grid selling back schemes is lower than the grid purchase price. The results show that a 60% increase in grid sell-back price leads to a 46% decrease in LCOE.
Permitting tax-free imports can reduce the cost of hardware devices, lowering the COE. The government of India must enable full cooperation in research and technology by generating opportunities for cooperation and entrepreneurship communication between societies. Even though the hybrid micro-grid alternative is a lucrative, consistent, and long-term remedy, people in rural areas cannot accommodate it due to the increased investment. As a result, more alternative financial assistance from government and non-governmental organizations can address the underlying intricacy of the issue.
The feasibility analysis discussed in this work can be used to guide the development and operation of hybrid energy system applications in distant regions where grid utility is not accessible, as well as hybrid grid-connected systems in India. Future research is needed to investigate the impacts of charging/discharging cycles of a battery on its lifespan and cost of energy.
Author Contributions
Conceptualization, M.B. and I.A.; formal analysis, M.B., I.A., M.A. and F.M.A.; funding acquisition, I.A., M.A. and F.M.A.; investigation, M.B. and M.R.; methodology, M.B., I.A., M.A. and F.M.A.; project administration, M.R. and I.A.; supervision, M.R.; writing—original draft, M.B.; writing—review and editing, M.B., M.R., I.A., M.A. and F.M.A. All authors have read and agreed to the published version of the manuscript.
Funding
The research work is funded by the Chair of Prince Faisal for Artificial intelligence research (CPFAI) through project number QU-CPFAI-2-9-5.
Institutional Review Board Statement
Not applicable.
Informed Consent Statement
Not applicable.
Data Availability Statement
Not applicable.
Acknowledgments
The authors would like to thank the Chair of Prince Faisal for Artificial intelligence research (CPFAI) for funding this research work through project number QU-CPFAI-2-9-5. Additionally, the authors would like to extend their appreciation to the Deputyship for Research & Innovation, Ministry of Education, and the Deanship of Scientific Research, Qassim University for their support for this research.
Conflicts of Interest
The authors declare no conflict of interest.
Nomenclature
| EV | Electric Vehicle |
| EVCS | Electric Vehicle Charging Station |
| SPV | Solar Photovoltaic |
| DG | Diesel Generator |
| HOMER | Hybrid Optimization of Multiple Energy Resources |
| GWO | Gray Wolf Optimization |
| SSA | Salp Swarm Algorithm |
| MSSA | Modified Salp Swarm Algorithm |
| RE | Renewable Energy |
| GHG | Green House Gases |
| WT | Wind Turbine |
| NBR | Number of Battery Replacements |
| RF | Renewable Fraction |
| GA | Genetic Algorithm |
| PSO | Particle Swarm Optimization |
| BESS | Battery Energy Storage System |
| NPC | Net Present Cost |
| TNPC | Total Net Present Cost |
| LCOE | Levelized Cost of Energy |
| LPSP | Lack of Power Supply Probability |
| MAS | Multi Agent System |
| MFO | Moth Flame Optimization |
| SOC | State of Charge |
| NOCT | Nominal Operating Cell Temperature |
| CRF | Capital Recovery Factor |
| DOD | Depth of Discharge |
| List of symbols | |
| Solar photovoltaic power output | |
| Efficiency of solar panel | |
| Surface area of the solar panel | |
| Hourly solar irradiance falling on the surface of solar panel | |
| Temperature of cell | |
| Ambient temperature | |
| Maximum power output of solar panel | |
| Maximum value of voltage | |
| Maximum value of current | |
| Number of installed solar PV panel | |
| Fuel consumption in litres per hour | |
| Power output of diesel generator in kW | |
| Rated power of diesel generator | |
| Constant value (0.246) | |
| Constant value (0.08415) | |
| Overall efficiency of DG | |
| Brake thermal efficiency of DG | |
| Self-discharge rate of battery | |
| Efficiency of bi-directional inverter | |
| Round trip efficiency of the battery | |
| Charging efficiency of battery | |
| Discharging efficiency of battery | |
| Total capacity of battery bank | |
| Total number of batteries | |
| Number of batteries connected in series | |
| Capacity of a single battery | |
| Net present cost of battery | |
| Capital cost of battery | |
| Replacement cost of battery | |
| Operation and maintenance cost of battery | |
| Salvage cost of battery | |
| Cost of one battery in USD | |
| OM cost of battery | |
| Escalation rate of battery | |
| Resale value of one battery in USD | |
| Replacement cost of battery | |
| Net present cost of battery | |
| Capital cost of bi-directional inverter | |
| Extra energy to be sold to the grid in kWh | |
| Minimum SOC of battery | |
| Maximum SOC of battery | |
| Number of kilometers traveled | |
| Energy needed per kilometer | |
| T | Duration of charging |
| Capacity of EV battery | |
| Number of solar panels | |
| Voltage level of bus | |
| Voltage level of single battery | |
| Maximum input/output power of battery. | |
| Energy to be borrowed from the grid in kWh | |
| Energy demand of EV | |
| Power demand of EVCS | |
| Net present cost of solar panel | |
| Capital cost of solar panel | |
| Replacement cost of solar panel | |
| Operation and maintenance cost of solar panel | |
| Salvage cost of solar panel | |
| Initial cost and of each SPV panel | |
| Power rating of each SPV panel | |
| Cost of replacing the SPV panel | |
| Rate of interest | |
| Life span of project in years | |
| OM cost of each panel | |
| Escalation rate | |
| Resale price solar panel after completing their life | |
| Inflation rate | |
| Resale value of bi-directional inverter in USD | |
| Replacement cost of bi-directional inverter | |
| Cost for unit sale of electricity to the utility grid | |
| Cost for unit purchase of electricity from the utility grid | |
| Cost of purchasing electricity from the grid | |
| Cost of selling electricity to the grid | |
| Total power generated by energy components | |
| Minimum energy of battery bank | |
| Maximum energy of battery bank | |
| Deferrable load | |
References
- Available online: https://mnre.gov.in/ (accessed on 2 January 2022).
- Ashtari, A.; Bibeau, E.; Shahidinejad, S.; Molinski, T. PEV Charging Profile Prediction and Analysis Based on Vehicle Usage Data. IEEE Trans. Smart Grid 2012, 3, 341–350. [Google Scholar] [CrossRef]
- Martinez, C.M.; Hu, X.; Cao, D.; Velenis, E.; Gao, B.; Wellers, M. Energy Management in Plug-in Hybrid Electric Vehicles: Recent Progress and a Connected Vehicles Perspective. IEEE Trans. Veh. Technol. 2017, 66, 4534–4549. [Google Scholar] [CrossRef] [Green Version]
- Wu, X.; Hu, X.; Teng, Y.; Qian, S.; Cheng, R. Optimal integration of a hybrid solar-battery power source into smart home nanogrid with plug-in electric vehicle. J. Power Sources 2017, 363, 277–283. [Google Scholar] [CrossRef] [Green Version]
- Karmaker, A.K.; Ahmed, M.R.; Hossain, M.A.; Sikder, M.M. Feasibility assessment & design of hybrid renewable energy based electric vehicle charging station in Bangladesh. Sustain. Cities Soc. 2018, 39, 189–202. [Google Scholar] [CrossRef]
- Podder, A.K.; Supti, S.A.; Islam, S.; Malvoni, M.; Jayakumar, A.; Deb, S.; Kumar, N.M. Feasibility Assessment of Hybrid Solar Photovoltaic-Biogas Generator Based Charging Station: A Case of Easy Bike and Auto Rickshaw Scenario in a Developing Nation. Sustainability 2021, 14, 166. [Google Scholar] [CrossRef]
- Fares, D.; Fathi, M.; Mekhilef, S. Performance evaluation of metaheuristic techniques for optimal sizing of a stand-alone hybrid PV/wind/battery system. Appl. Energy 2022, 305, 117823. [Google Scholar] [CrossRef]
- Bernal-Agustín, J.L.; Dufo-López, R. Techno-economical optimization of the production of hydrogen from PV-Wind systems connected to the electrical grid. Renew. Energy 2010, 35, 747–758. [Google Scholar] [CrossRef]
- Giallanza, A.; Porretto, M.; Puma, G.L.; Marannano, G. A sizing approach for stand-alone hybrid photovoltaic-wind-battery systems: A Sicilian case study. J. Clean. Prod. 2018, 199, 817–830. [Google Scholar] [CrossRef]
- Halabi, L.M.; Mekhilef, S.; Olatomiwa, L.; Hazelton, J. Performance analysis of hybrid PV/diesel/battery system using HOMER: A case study Sabah, Malaysia. Energy Convers. Manag. 2017, 144, 322–339. [Google Scholar] [CrossRef]
- Lian, J.; Zhang, Y.; Ma, C.; Yang, Y.; Chaima, E. A review on recent sizing methodologies of hybrid renewable energy systems. Energy Convers. Manag. 2019, 199, 112027. [Google Scholar] [CrossRef]
- Al Busaidi, A.S.; Kazem, H.A.; Al-Badi, A.H.; Farooq Khan, M. A review of optimum sizing of hybrid PV–Wind renewable energy systems in oman. Renew. Sustain. Energy Rev. 2016, 53, 185–193. [Google Scholar] [CrossRef]
- Zheng, X.; Lin, H.; Liu, Z.; Li, D.; Llopis-Albert, C.; Zeng, S. Manufacturing Decisions and Government Subsidies for Electric Vehicles in China: A Maximal Social Welfare Perspective. Sustainability 2018, 10, 672. [Google Scholar] [CrossRef] [Green Version]
- Ye, B.; Jiang, J.; Miao, L.; Yang, P.; Li, J.; Shen, B. Feasibility Study of a Solar-Powered Electric Vehicle Charging Station Model. Energies 2015, 8, 13265–13283. [Google Scholar] [CrossRef] [Green Version]
- Ilieva, L.M.; Iliev, S.P. Feasibility assessment of a solar-powered charging station for electric vehicles in the North Central region of Bulgaria. Renew. Energy Environ. Sustain. 2016, 1, 12. [Google Scholar] [CrossRef]
- Filote, C.; Felseghi, R.; Raboaca, M.S.; Aşchilean, I. Environmental impact assessment of green energy systems for power supply of electric vehicle charging station. Int. J. Energy Res. 2020, 44, 10471–10494. [Google Scholar] [CrossRef]
- Niccolai, A.; Bettini, L.; Zich, R. Optimization of electric vehicles charging station deployment by means of evolutionary algorithms. Int. J. Intell. Syst. 2021, 36, 5359–5383. [Google Scholar] [CrossRef]
- Mohamed, A.; Salehi, V.; Ma, T.; Mohammed, O. Real-Time Energy Management Algorithm for Plug-In Hybrid Electric Vehicle Charging Parks Involving Sustainable Energy. IEEE Trans. Sustain. Energy 2014, 5, 577–586. [Google Scholar] [CrossRef]
- Mozafar, M.R.; Moradi, M.H.; Amini, M.H. A simultaneous approach for optimal allocation of renewable energy sources and electric vehicle charging stations in smart grids based on improved GA-PSO algorithm. Sustain. Cities Soc. 2017, 32, 627–637. [Google Scholar] [CrossRef]
- Xu, M.; Meng, Q. Optimal deployment of charging stations considering path deviation and nonlinear elastic demand. Transp. Res. Part B Methodol. 2020, 135, 120–142. [Google Scholar] [CrossRef]
- Bhatti, A.R.; Salam, Z.; Sultana, B.; Rasheed, N.; Awan, A.B.; Sultana, U.; Younas, M. Optimized sizing of photovoltaic grid-connected electric vehicle charging system using particle swarm optimization. Int. J. Energy Res. 2019, 43, 500–522. [Google Scholar] [CrossRef]
- Li, H.; Liu, H.; Ji, A.; Li, F.; Jia, Y. Design of a hybrid solar-wind powered charging station for electric vehicles. In Proceedings of the 2013 International Conference on Materials for Renewable Energy and Environment, Chengdu, China, 19–21 August 2013; IEEE: New York, NY, USA, 2013; pp. 977–981. [Google Scholar]
- Hafez, O.; Bhattacharya, K. Optimal design of electric vehicle charging stations considering various energy resources. Renew. Energy 2017, 107, 576–589. [Google Scholar] [CrossRef]
- Bouguerra, S.; Bhar Layeb, S. Determining optimal deployment of electric vehicles charging stations: Case of Tunis City, Tunisia. Case Stud. Transp. Policy 2019, 7, 628–642. [Google Scholar] [CrossRef]
- Chandra Mouli, G.R.; Bauer, P.; Zeman, M. System design for a solar powered electric vehicle charging station for workplaces. Appl. Energy 2016, 168, 434–443. [Google Scholar] [CrossRef] [Green Version]
- Sadeghian, O.; Nazari-Heris, M.; Abapour, M.; Taheri, S.S.; Zare, K. Improving reliability of distribution networks using plug-in electric vehicles and demand response. J. Mod. Power Syst. Clean Energy 2019, 7, 1189–1199. [Google Scholar] [CrossRef] [Green Version]
- Zhang, Y.; Zhang, Q.; Farnoosh, A.; Chen, S.; Li, Y. GIS-Based Multi-Objective Particle Swarm Optimization of charging stations for electric vehicles. Energy 2019, 169, 844–853. [Google Scholar] [CrossRef]
- Ray, P.; Bhattacharjee, C.; Dhenuvakonda, K.R. Swarm intelligence-based energy management of electric vehicle charging station integrated with renewable energy sources. Int. J. Energy Res. 2021. [Google Scholar] [CrossRef]
- Miceli, R.; Viola, F. Designing a Sustainable University Recharge Area for Electric Vehicles: Technical and Economic Analysis. Energies 2017, 10, 1604. [Google Scholar] [CrossRef] [Green Version]
- Akbari, M.; Brenna, M.; Longo, M. Optimal Locating of Electric Vehicle Charging Stations by Application of Genetic Algorithm. Sustainability 2018, 10, 1076. [Google Scholar] [CrossRef] [Green Version]
- Dai, Q.; Liu, J.; Wei, Q. Optimal Photovoltaic/Battery Energy Storage/Electric Vehicle Charging Station Design Based on Multi-Agent Particle Swarm Optimization Algorithm. Sustainability 2019, 11, 1973. [Google Scholar] [CrossRef] [Green Version]
- Pan, A.; Zhao, T.; Yu, H.; Zhang, Y. Deploying Public Charging Stations for Electric Taxis: A Charging Demand Simulation Embedded Approach. IEEE Access 2019, 7, 17412–17424. [Google Scholar] [CrossRef]
- Ekren, O.; Hakan Canbaz, C.; Güvel, Ç.B. Sizing of a solar-wind hybrid electric vehicle charging station by using HOMER software. J. Clean. Prod. 2021, 279, 123615. [Google Scholar] [CrossRef]
- Ahmad, F.; Khalid, M.; Panigrahi, B.K. An enhanced approach to optimally place the solar powered electric vehicle charging station in distribution network. J. Energy Storage 2021, 42, 103090. [Google Scholar] [CrossRef]
- Singh, S.; Chauhan, P.; Jap Singh, N. Feasibility of Grid-connected Solar-wind Hybrid System with Electric Vehicle Charging Station. J. Mod. Power Syst. Clean Energy 2021, 9, 295–306. [Google Scholar] [CrossRef]
- Aldhanhani, T.; Al-Durra, A.; El-Saadany, E.F. Optimal design of electric vehicle charging stations integrated with renewable DG. In Proceedings of the 2017 IEEE Innovative Smart Grid Technologies-Asia (ISGT-Asia), Auckland, New Zealand, 4–7 December 2017; IEEE: New York, NY, USA, 2017; pp. 1–6. [Google Scholar]
- Al Wahedi, A.; Bicer, Y. Techno-economic assessment of a renewable energy-based electric vehicle fast-charging station in Qatar. Comput. Aided Chem. Eng. 2021, 50, 1629–1634. [Google Scholar]
- Abdelkader, A.; Rabeh, A.; Mohamed Ali, D.; Mohamed, J. Multi-objective genetic algorithm based sizing optimization of a stand-alone wind/PV power supply system with enhanced battery/supercapacitor hybrid energy storage. Energy 2018, 163, 351–363. [Google Scholar] [CrossRef]
- Xu, X.; Hu, W.; Cao, D.; Huang, Q.; Chen, C.; Chen, Z. Optimized sizing of a standalone PV-wind-hydropower station with pumped-storage installation hybrid energy system. Renew. Energy 2020, 147, 1418–1431. [Google Scholar] [CrossRef]
- Yan, D.; Ma, C. Stochastic planning of electric vehicle charging station integrated with photovoltaic and battery systems. IET Gener. Transm. Distrib. 2020, 14, 4217–4224. [Google Scholar] [CrossRef]
- Bandopadhyay, J.; Roy, P.K. Application of hybrid multi-objective moth flame optimization technique for optimal performance of hybrid micro-grid system. Appl. Soft Comput. 2020, 95, 106487. [Google Scholar] [CrossRef]
- Das, B.K.; Hassan, R.; Tushar, M.S.H.K.; Zaman, F.; Hasan, M.; Das, P. Techno-economic and environmental assessment of a hybrid renewable energy system using multi-objective genetic algorithm: A case study for remote Island in Bangladesh. Energy Convers. Manag. 2021, 230, 113823. [Google Scholar] [CrossRef]
- Nishanthy, J.; Charles Raja, S.; Praveen, T.; Jeslin Drusila Nesamalar, J.; Venkatesh, P. Techno-economic analysis of a hybrid solar wind electric vehicle charging station in highway roads. Int. J. Energy Res. 2022. [Google Scholar] [CrossRef]
- Emad, D.; El-Hameed, M.A.; El-Fergany, A.A. Optimal techno-economic design of hybrid PV/wind system comprising battery energy storage: Case study for a remote area. Energy Convers. Manag. 2021, 249, 114847. [Google Scholar] [CrossRef]
- Geleta, D.K.; Manshahia, M.S.; Vasant, P.; Banik, A. Grey wolf optimizer for optimal sizing of hybrid wind and solar renewable energy system. Comput. Intell. 2020, 158, 941–951. [Google Scholar] [CrossRef]
- Borhanazad, H.; Mekhilef, S.; Gounder Ganapathy, V.; Modiri-Delshad, M.; Mirtaheri, A. Optimization of micro-grid system using MOPSO. Renew. Energy 2014, 71, 295–306. [Google Scholar] [CrossRef]
- Kumar, A.; Rizwan, M.; Nangia, U. A new approach to design and optimize sizing of hybrid microgrid in deregulated electricity environment. CSEE J. Power Energy Syst. 2020, 1–11. [Google Scholar] [CrossRef]
- Mirjalili, S.; Gandomi, A.H.; Mirjalili, S.Z.; Saremi, S.; Faris, H.; Mirjalili, S.M. Salp Swarm Algorithm: A bio-inspired optimizer for engineering design problems. Adv. Eng. Softw. 2017, 114, 163–191. [Google Scholar] [CrossRef]
- Khan, N.H.; Wang, Y.; Tian, D.; Jamal, R.; Kamel, S.; Ebeed, M. Optimal Siting and Sizing of SSSC Using Modified Salp Swarm Algorithm Considering Optimal Reactive Power Dispatch Problem. IEEE Access 2021, 9, 49249–49266. [Google Scholar] [CrossRef]
- Nanaki, E.A.; Xydis, G.A. Deployment of Renewable Energy Systems: Barriers, Challenges, and Opportunities. In Advances in Renewable Energies and Power Technologies; Elsevier: Amsterdam, The Netherlands, 2018; pp. 207–229. [Google Scholar]
- Sen, S.; Ganguly, S. Opportunities, barriers and issues with renewable energy development—A discussion. Renew. Sustain. Energy Rev. 2017, 69, 1170–1181. [Google Scholar] [CrossRef]
- Dominković, D.F.; Bačeković, I.; Pedersen, A.S.; Krajačić, G. The future of transportation in sustainable energy systems: Opportunities and barriers in a clean energy transition. Renew. Sustain. Energy Rev. 2018, 82, 1823–1838. [Google Scholar] [CrossRef]
Publisher’s Note: MDPI stays neutral with regard to jurisdictional claims in published maps and institutional affiliations. |
© 2022 by the authors. Licensee MDPI, Basel, Switzerland. This article is an open access article distributed under the terms and conditions of the Creative Commons Attribution (CC BY) license (https://creativecommons.org/licenses/by/4.0/).