
Fuzzy Win-Win: A Novel Approach to Quantify Win-Win Using Fuzzy Logic

 ,
,  ,
,  ,
,
Abstract
:1. Introduction
- Covey defines win–win as “a frame of mind and heart that constantly seeks mutual benefit in business and personal transactions” [29].
- Nalis et al. define win–win solutions as “outcomes of interpersonal behavior that exceed the outcomes that each participant could achieve alone” [30].
- Fujita et al. define win–win as “ideas that might give both parties most of what they want” [31].
- Thompson and Gonzales regard a “win–win outcome to be one that is efficient—meaning that there is no other outcome parties could reach that at least one party would prefer without reducing the other party’s utility” [32].
- Brooks defines win–win as “success in two or more of the outcomes measured (ecological, economic, social) and “tradeoffs” are defined as some combination of success, limited success, or failure” [33].
- Bottos, and Coleman define a win–win outcome in any negotiation as “the outcome that makes both parties feel as though they have benefited from the discussion” [34].
- Carbonara et al. concluded that win–win refers to the capacity to meet the diverse interests of the parties involved by assuring their profit demands while also fairly allocating risk among them [35].
- Ekermo defines win–win as “the theoretical possibility of finding mutually beneficial solutions for economy and environment” [36].
- Smith et al. define win–win as “the idea that one person’s success is not achieved at the expense or exclusion of the success of others” [37].
- Engler defines win–win as “a fair distribution of the efforts of the collaboration and the results” [38]
- Moon and Dathe-Douglass defines win–win as “the only rational way for a leader to think” [39].
- Willing et al. define win–win as “the approach that seeks a mutually beneficial outcome, resulting in mutual cooperation and joint commitment in its implementation” [40].
- Blount defines win–win as “the warm blanket of delusion where your commission check and your company’s profits curl up to die” [41].
- Dor defines win–win as “the art of winning while letting the other side think that they have won as well” [42].
- Recently, Zhang et al. defined win–win as “the realization of maximizing the interests of both sides, which is a harmonious development with mutual benefits” [43].
- Separating people from the problem;
- Focusing on interests, not positions;
- Inventing options for mutual gain; and
- Using objective criteria
- It is not an oxymoron; thus, it more accurately represents the desired situation.
- It is not a competitive metaphor because it emphasizes fulfilment instead of competitiveness.
- It is relational rather than transactional in nature.
- Because it depicts an emotion, it focuses on the process rather than an objective end.
- It signifies that the negotiating process is ongoing and does not come to an end in a specific circumstance.
Research Gap, Motivation and Objective
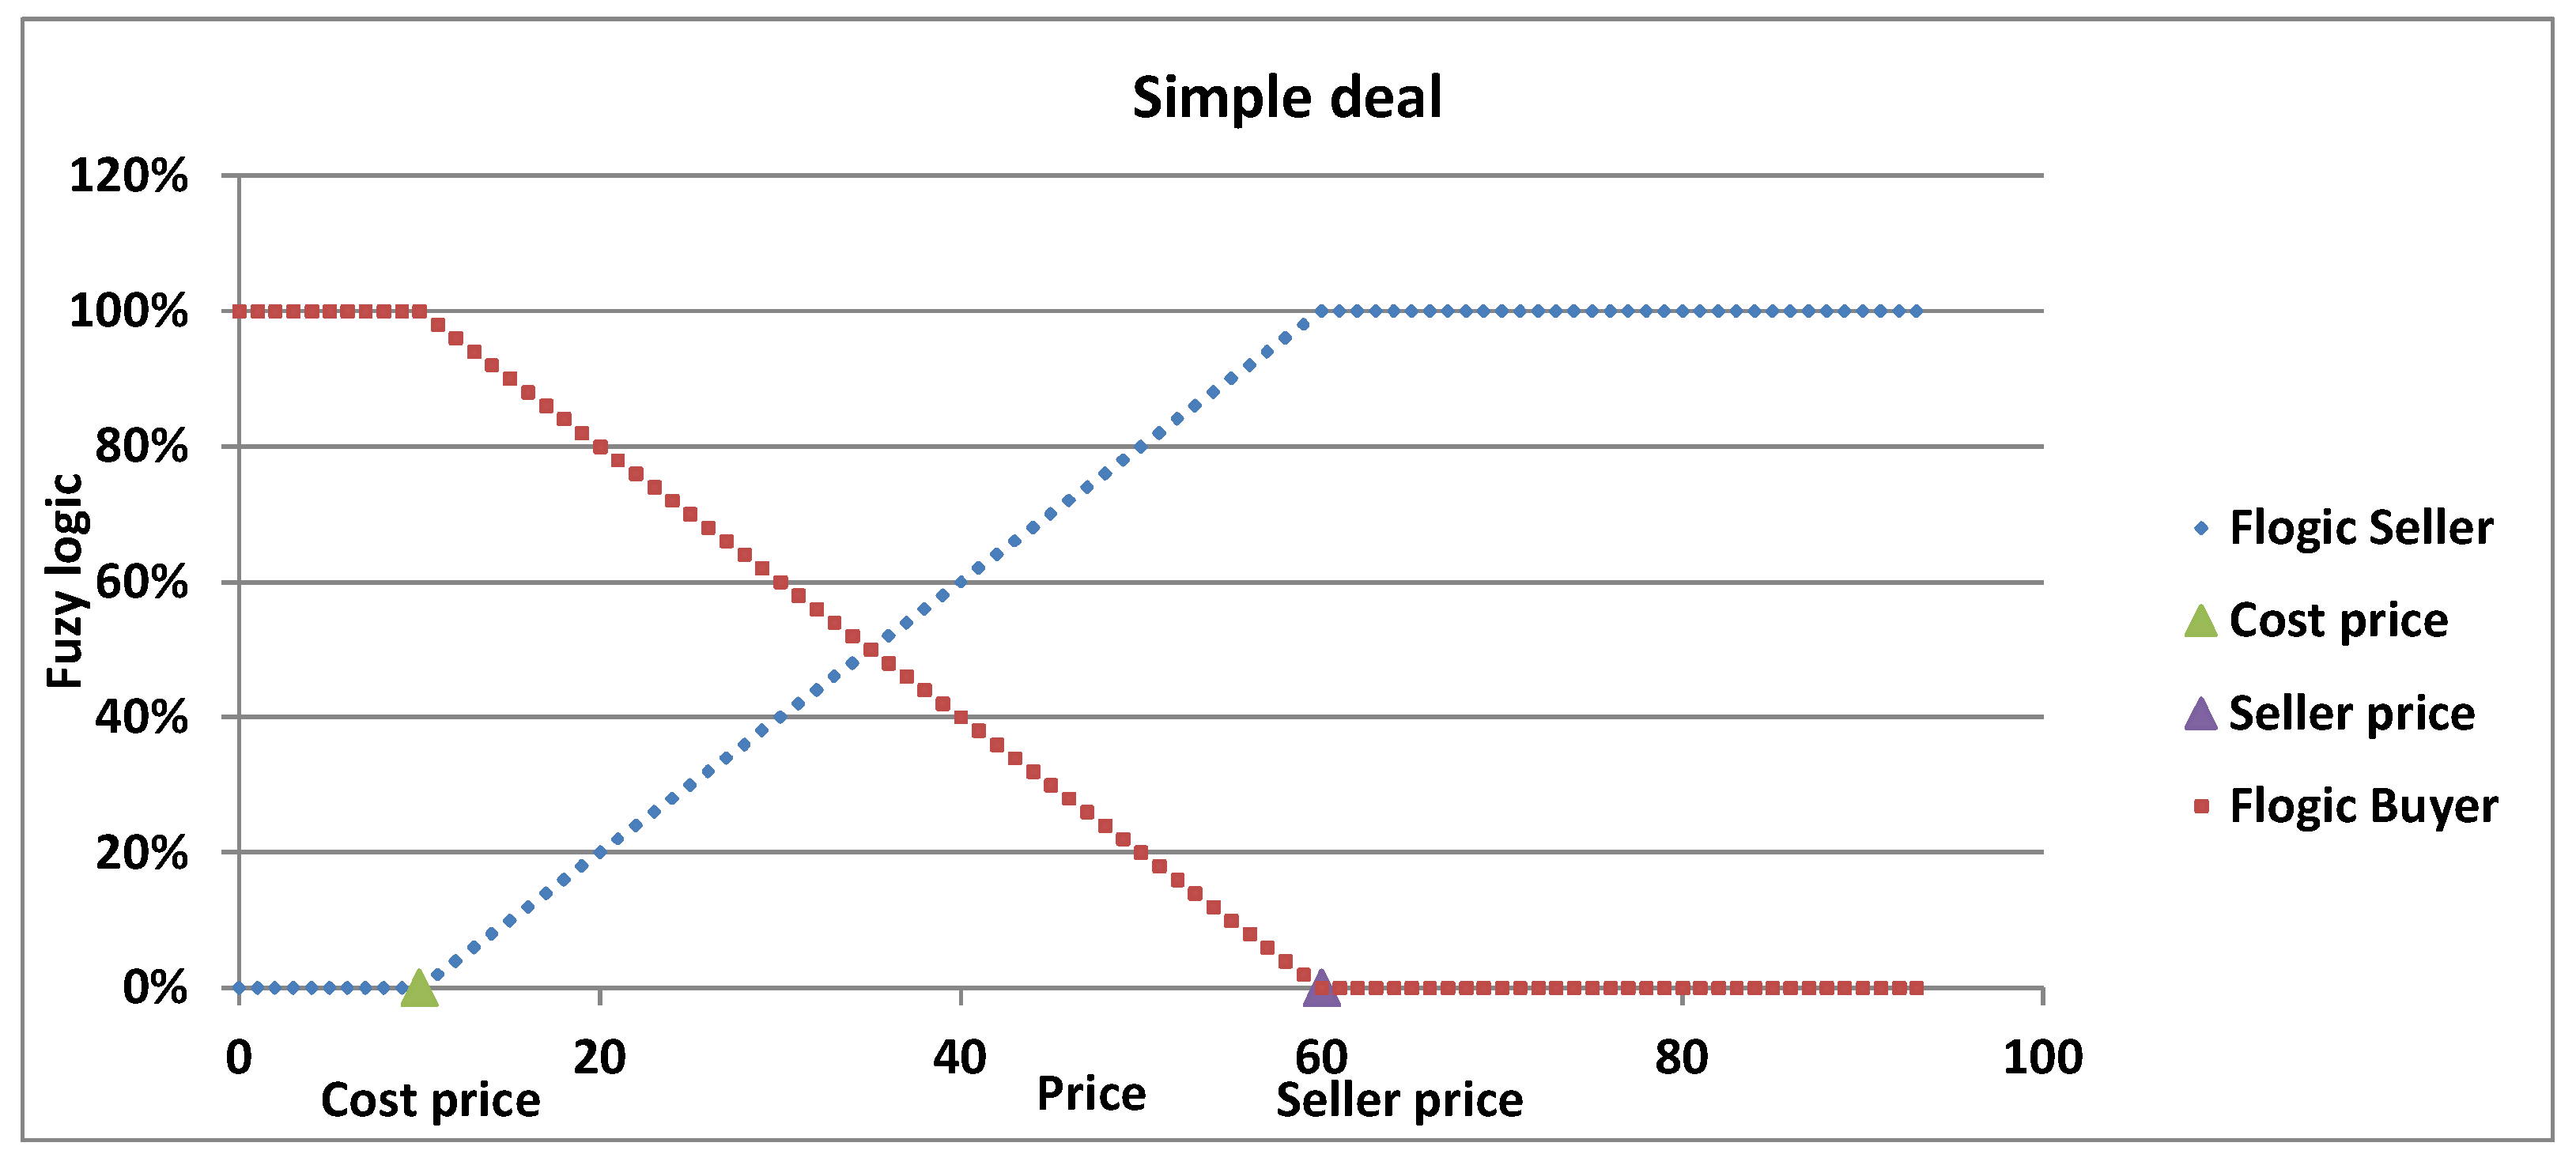
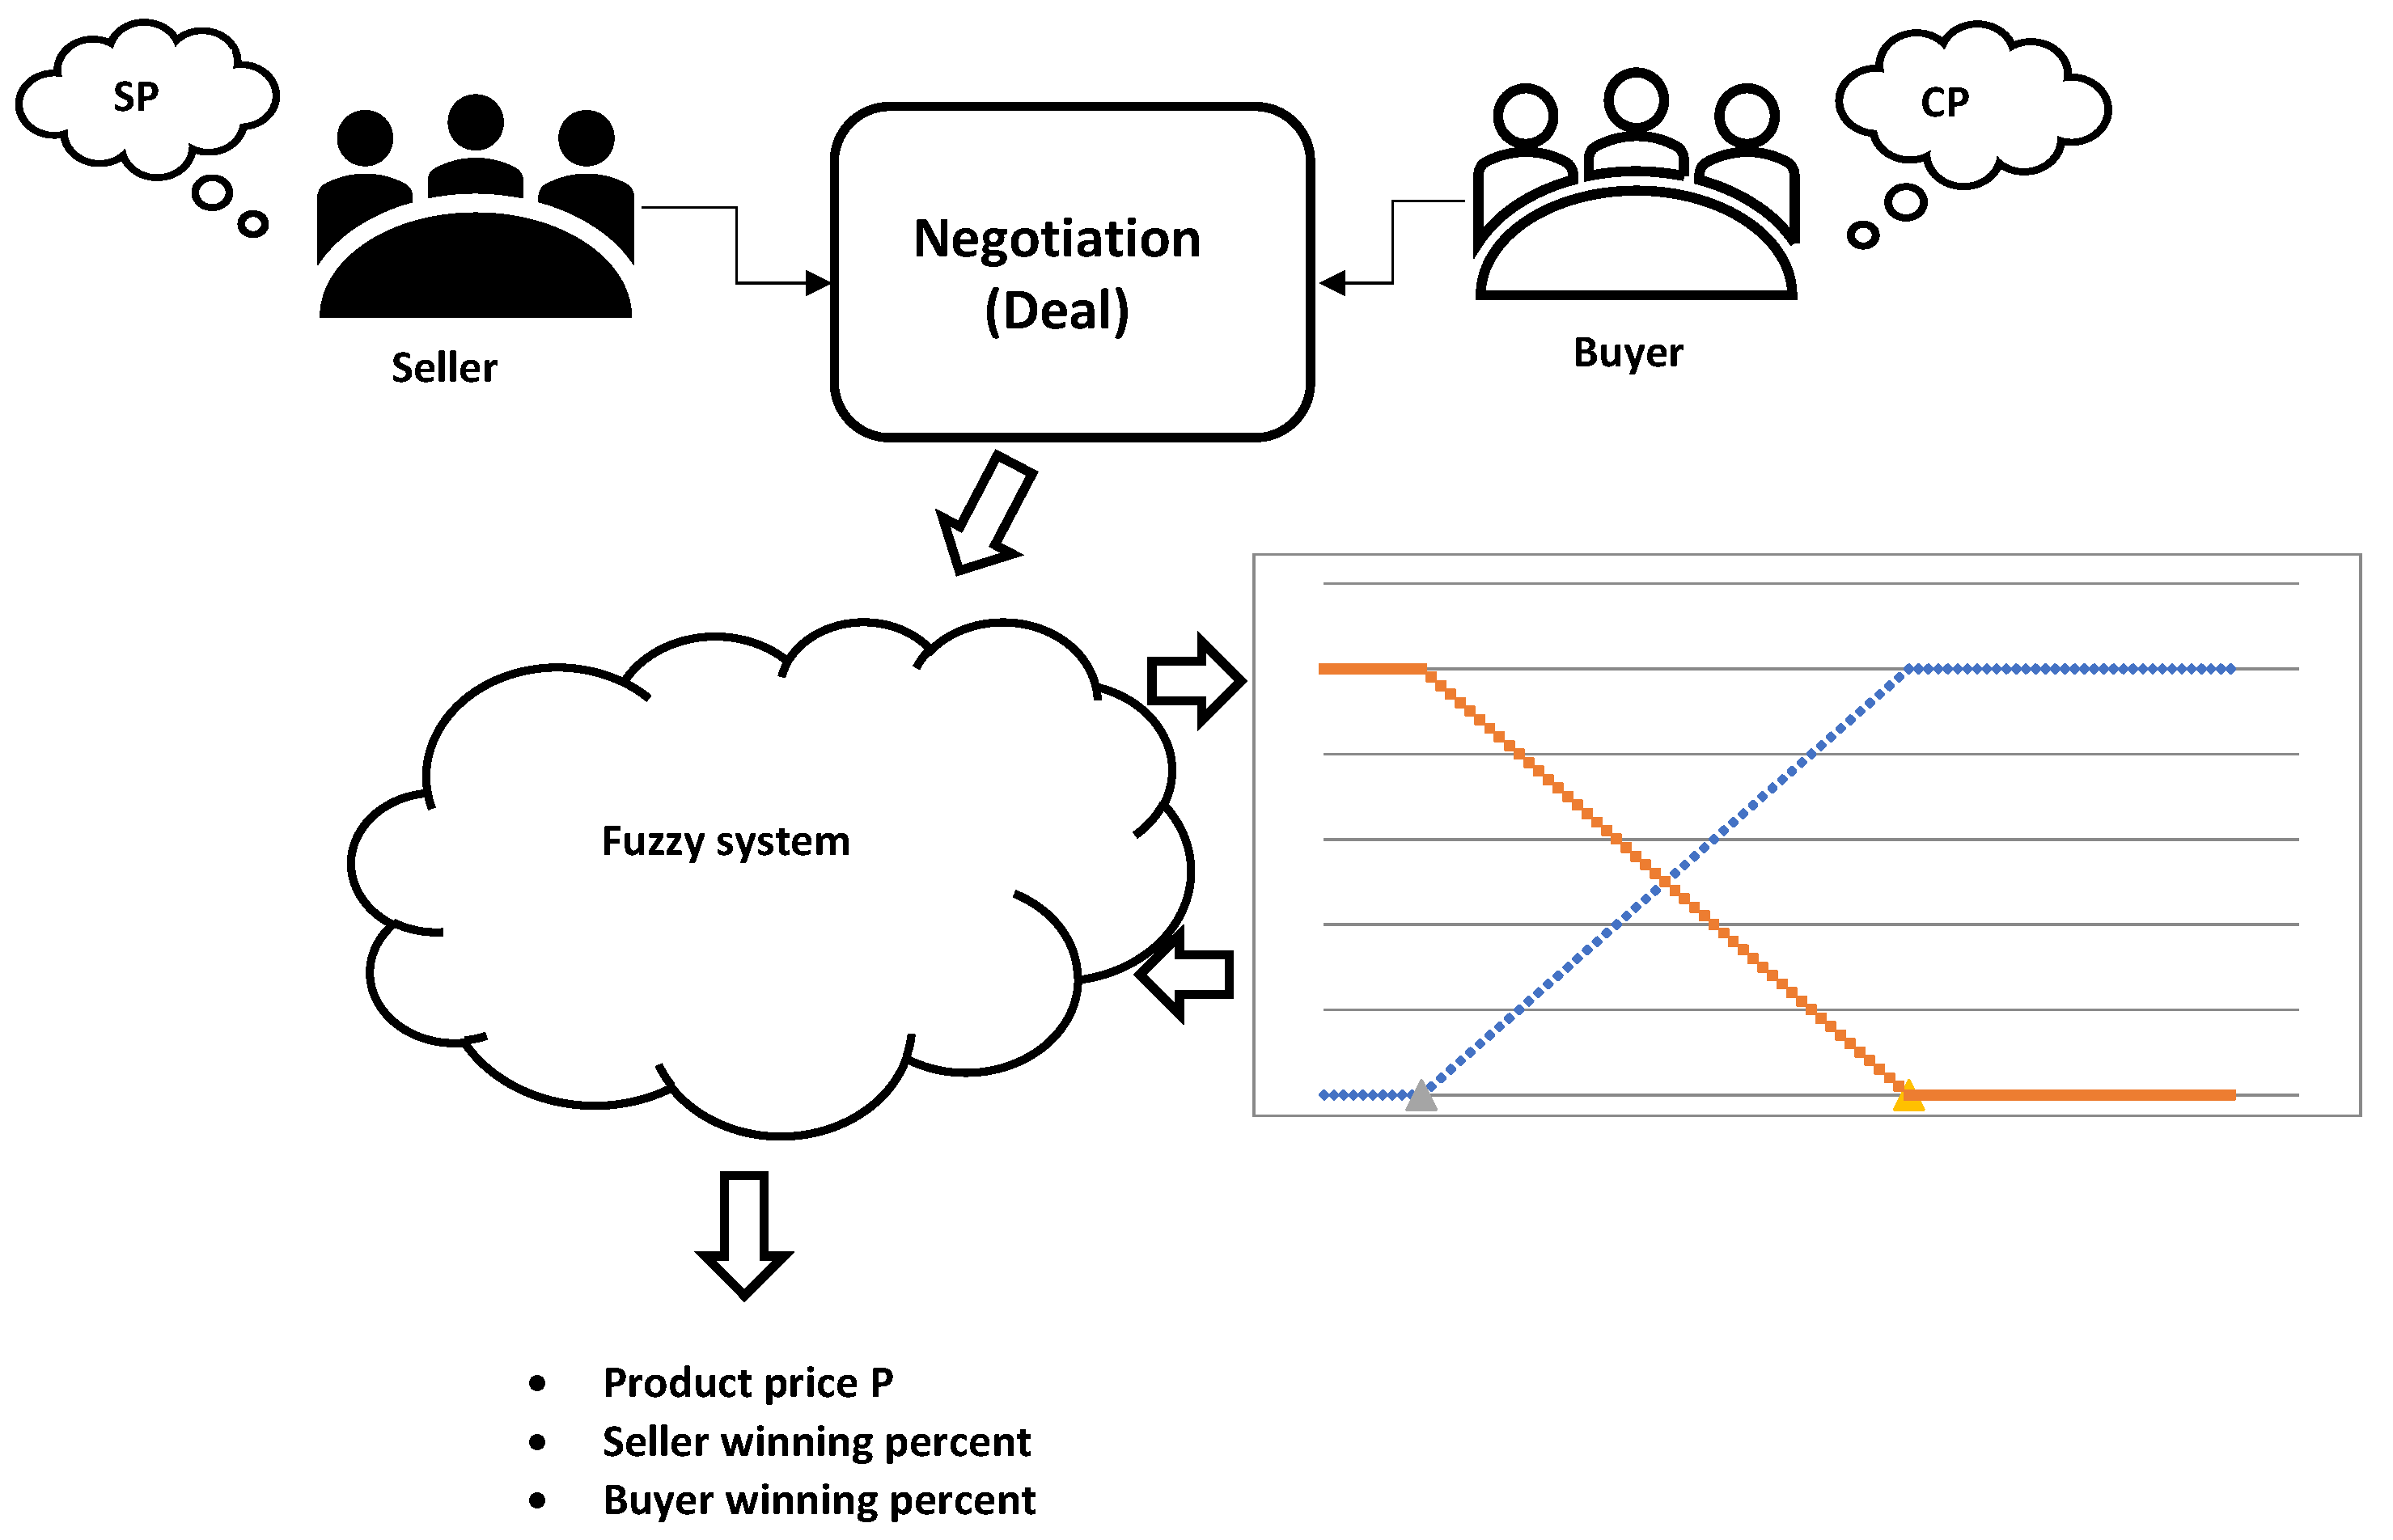
2. The Proposed Fuzzy Win–Win Model
- The product’s initial cost price ().
- The negotiation results in selling the product at price P, which is the selling price at which the deal is consummated.
- The seller’s wanted price, or simply the seller price ()—normally this price is the fair market price of the product measured at the same time of the negotiated deal.
- Lose-win situation, starting from until .
- Fuzzy win–win situation, starting from until , the so-called zone of possible agreement (ZOPA).
- Win-lose situation, starting from until .
3. Results and Discussion
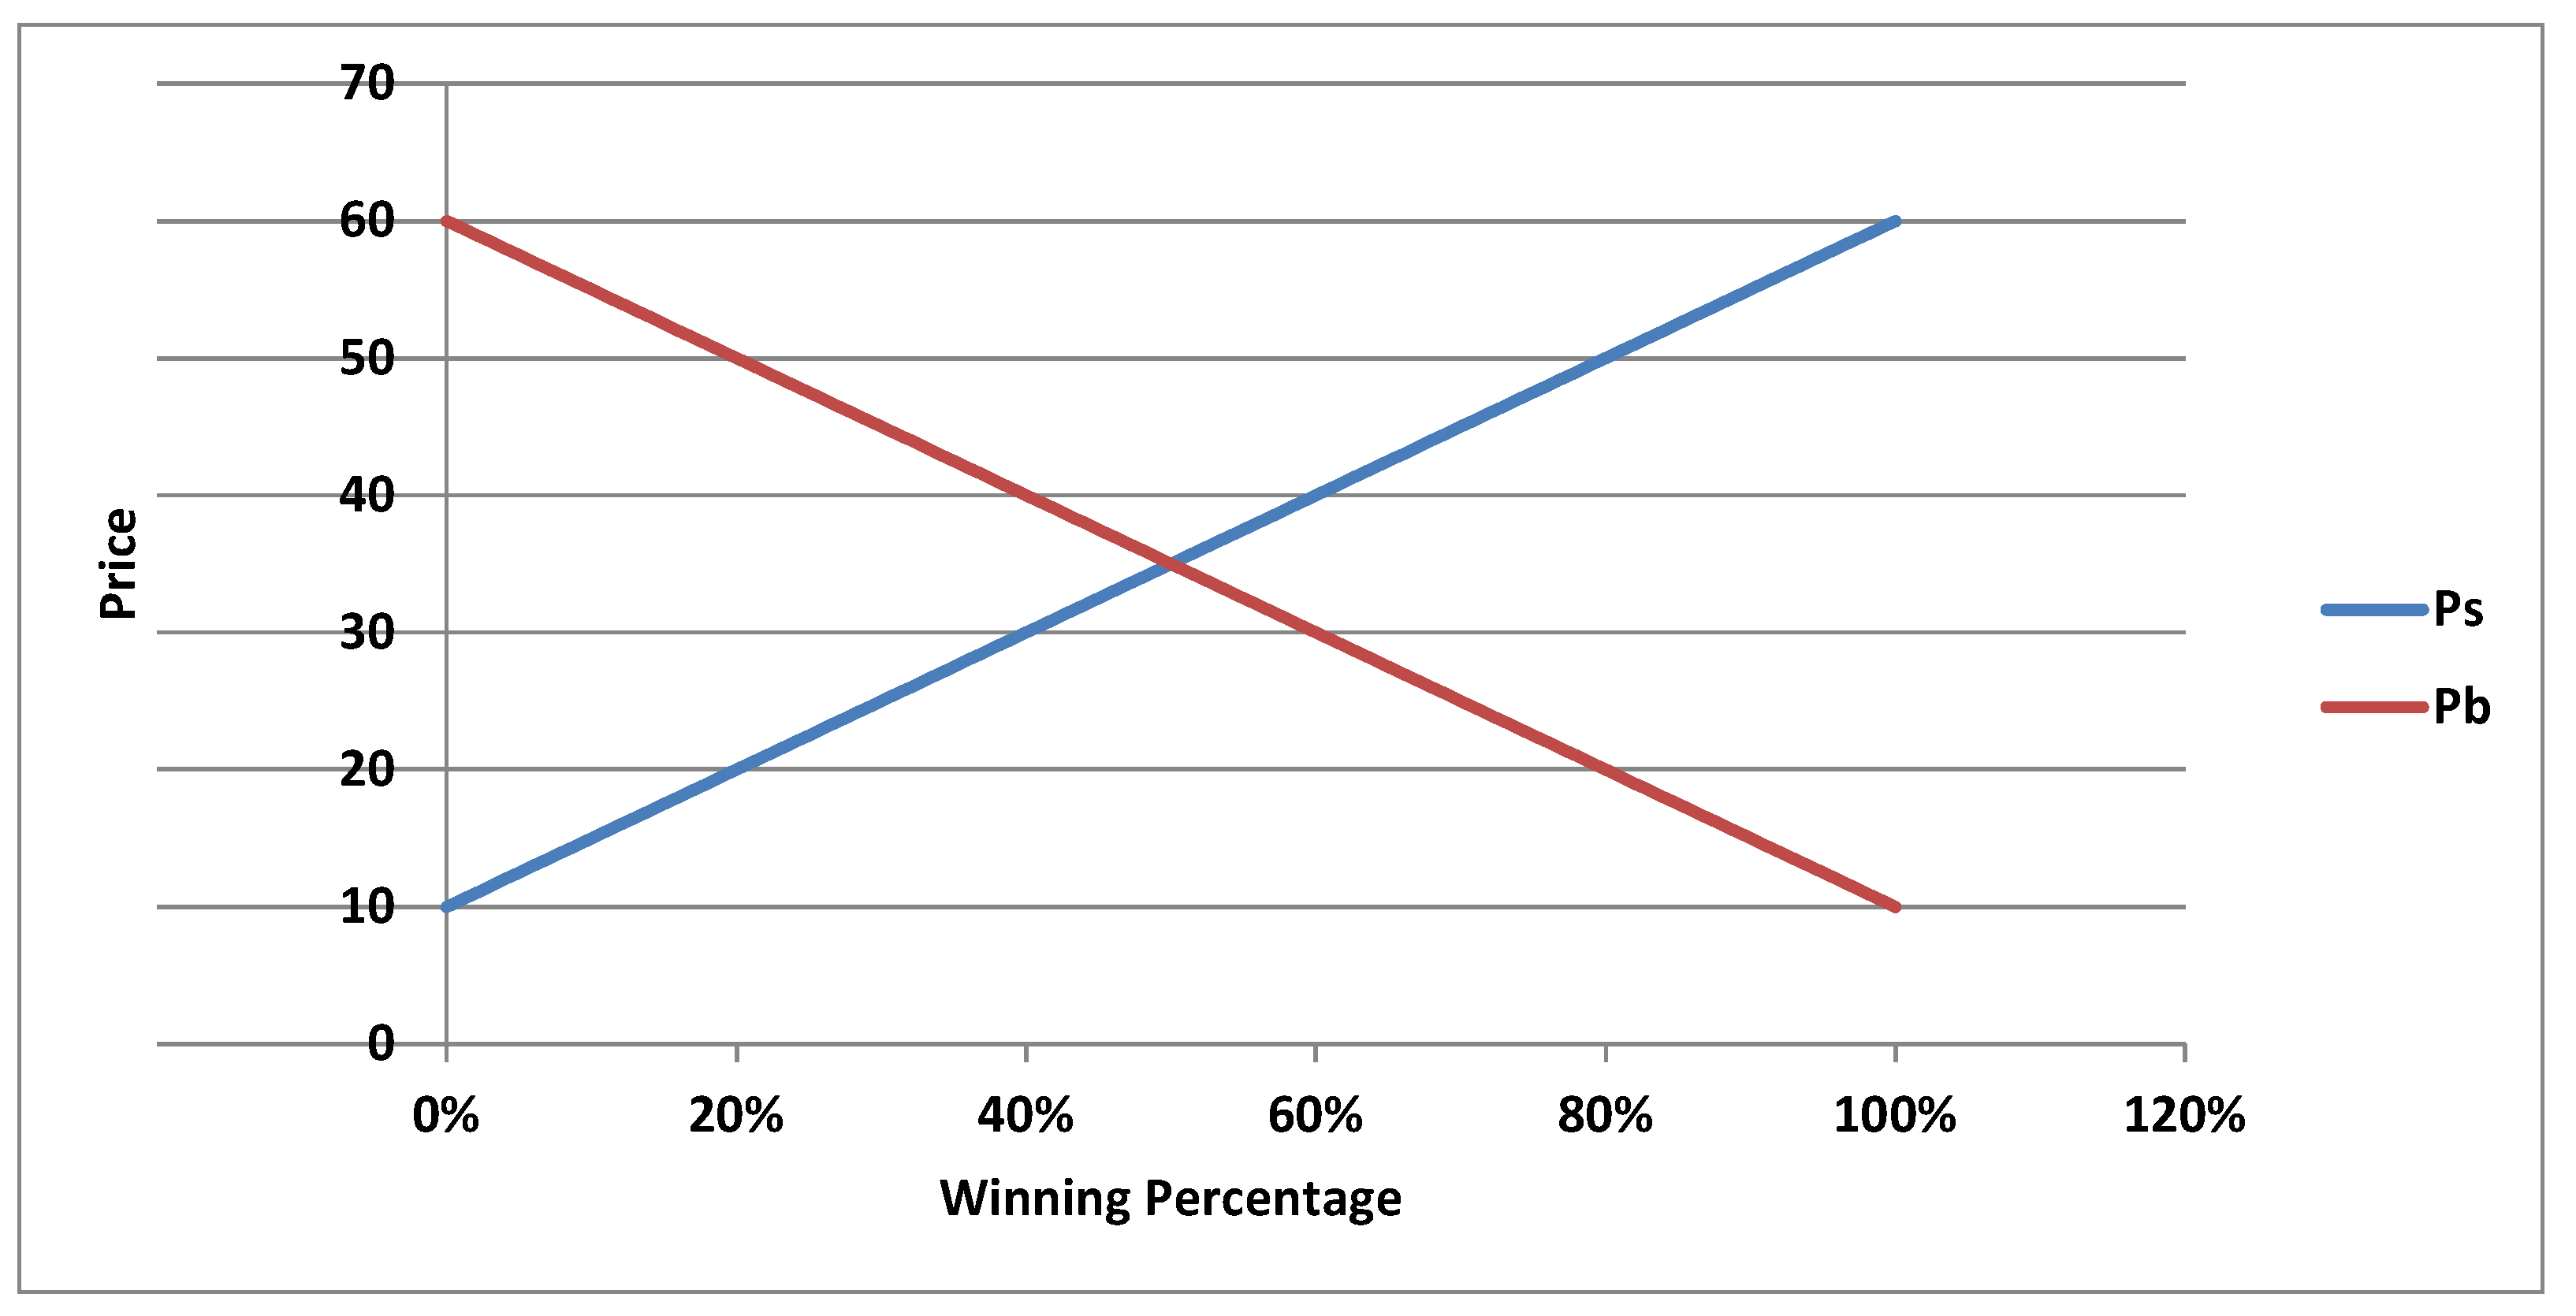
3.1. Toy Example
- (Q1)
- If the share is sold for P, what is the winning percentage for each of and ?
- (Q2)
- If the CEO of wants to achieve a specific winning percentage out of this deal, at what price should sell its shares?
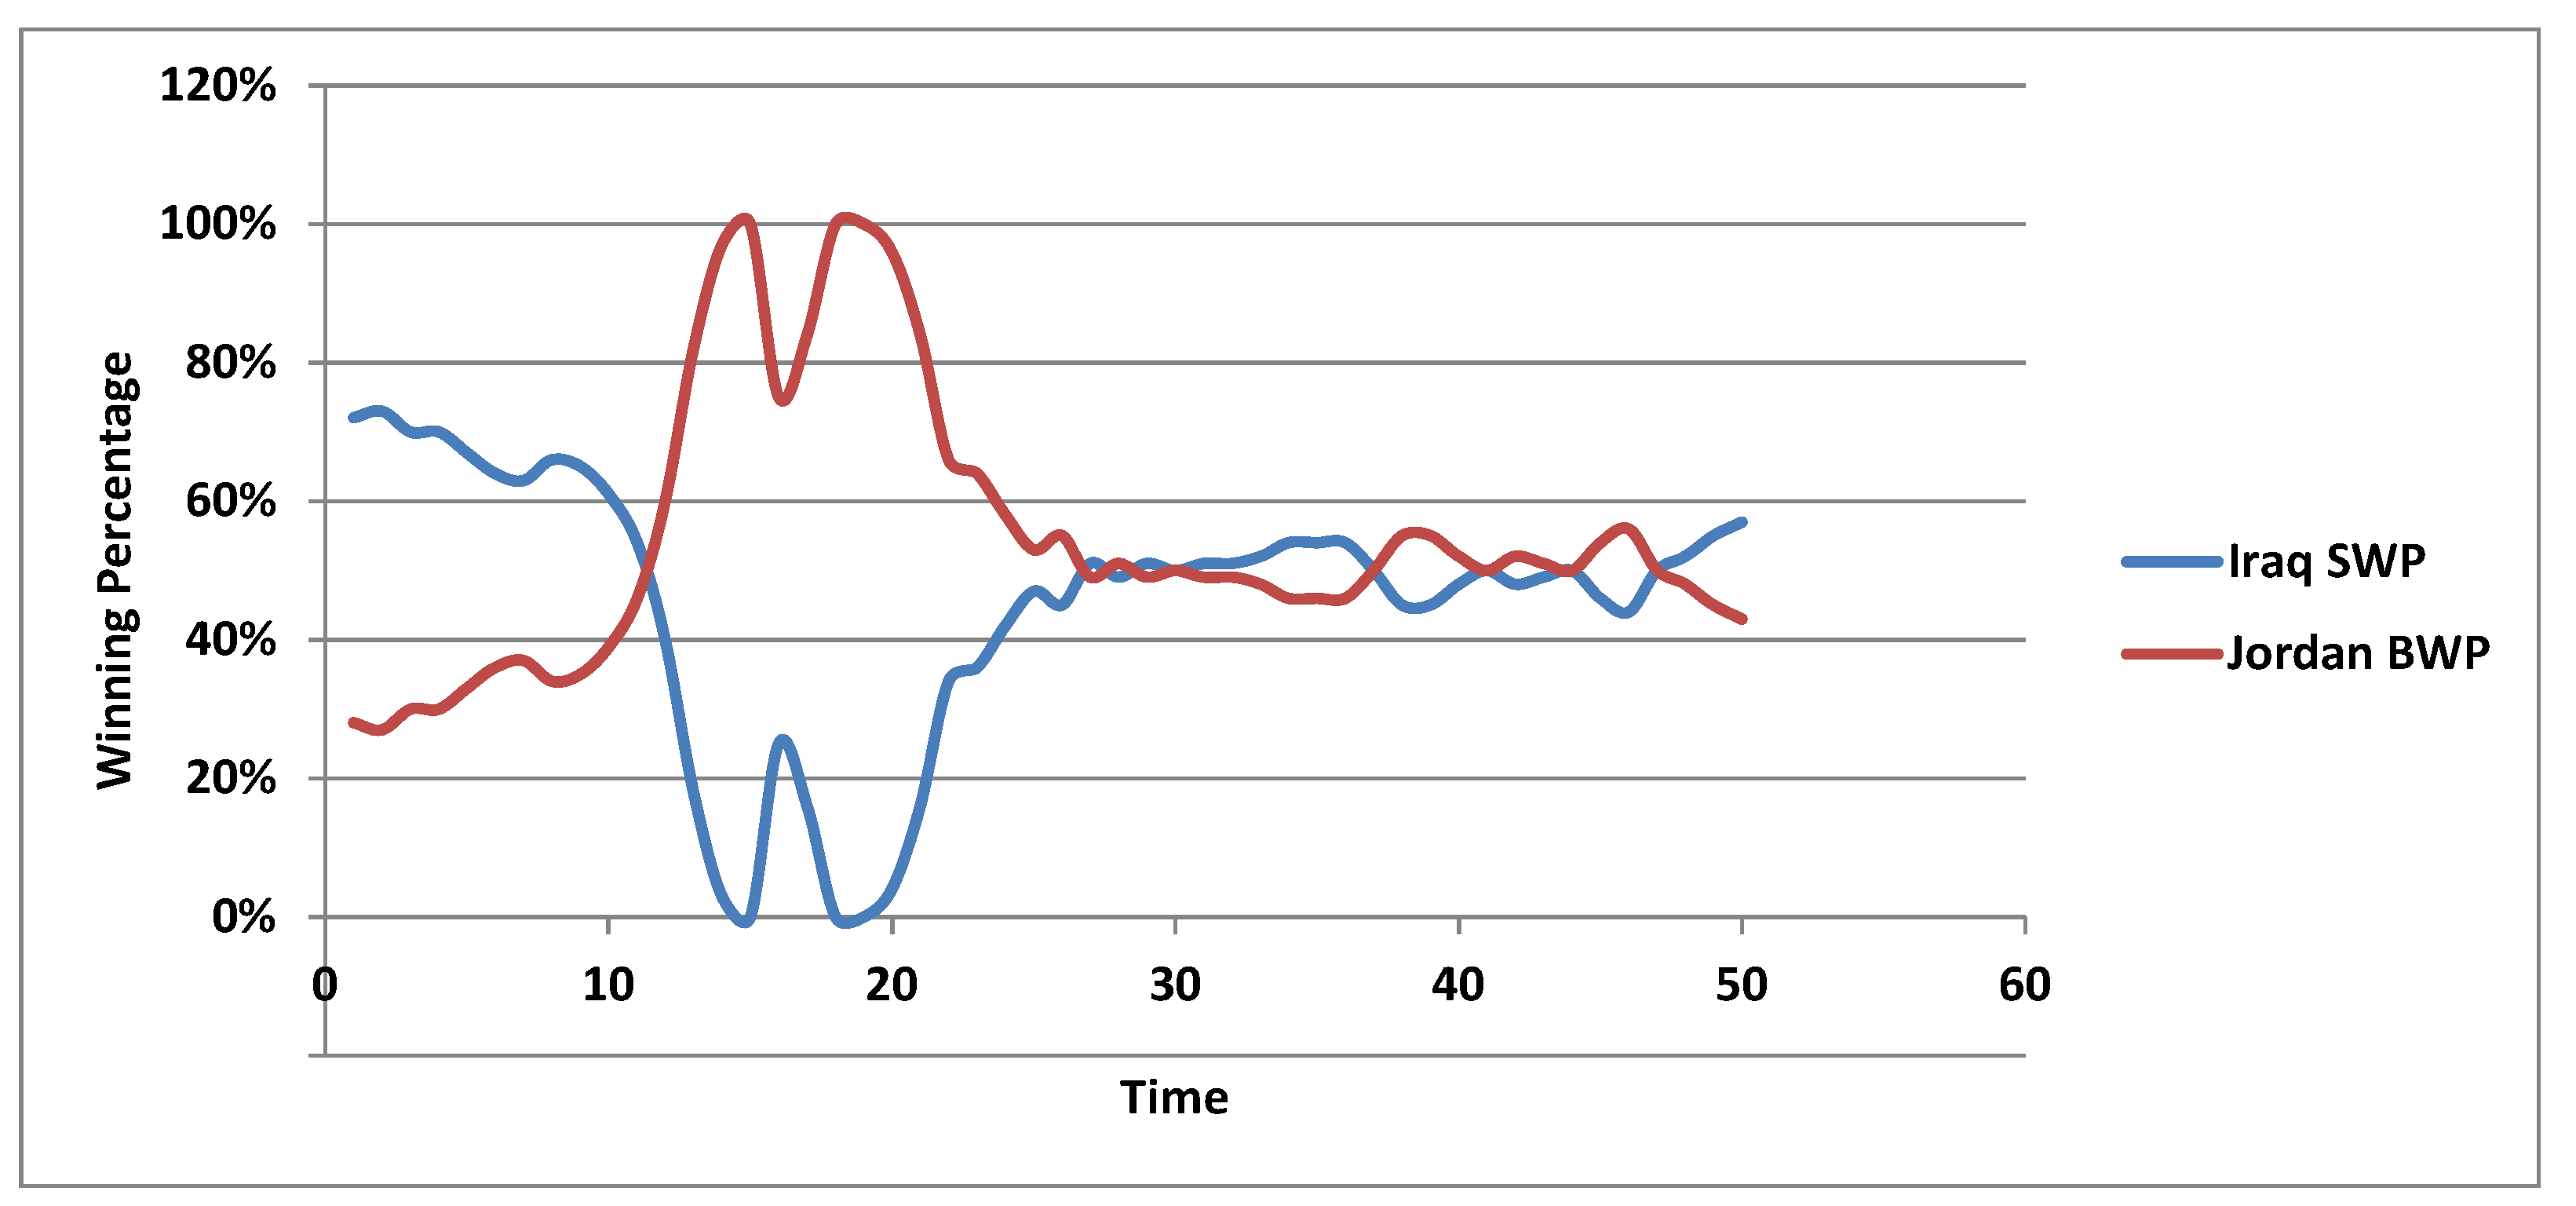
3.2. Real-World Case 1: Current Iraqi–Jordanian Oil Deal
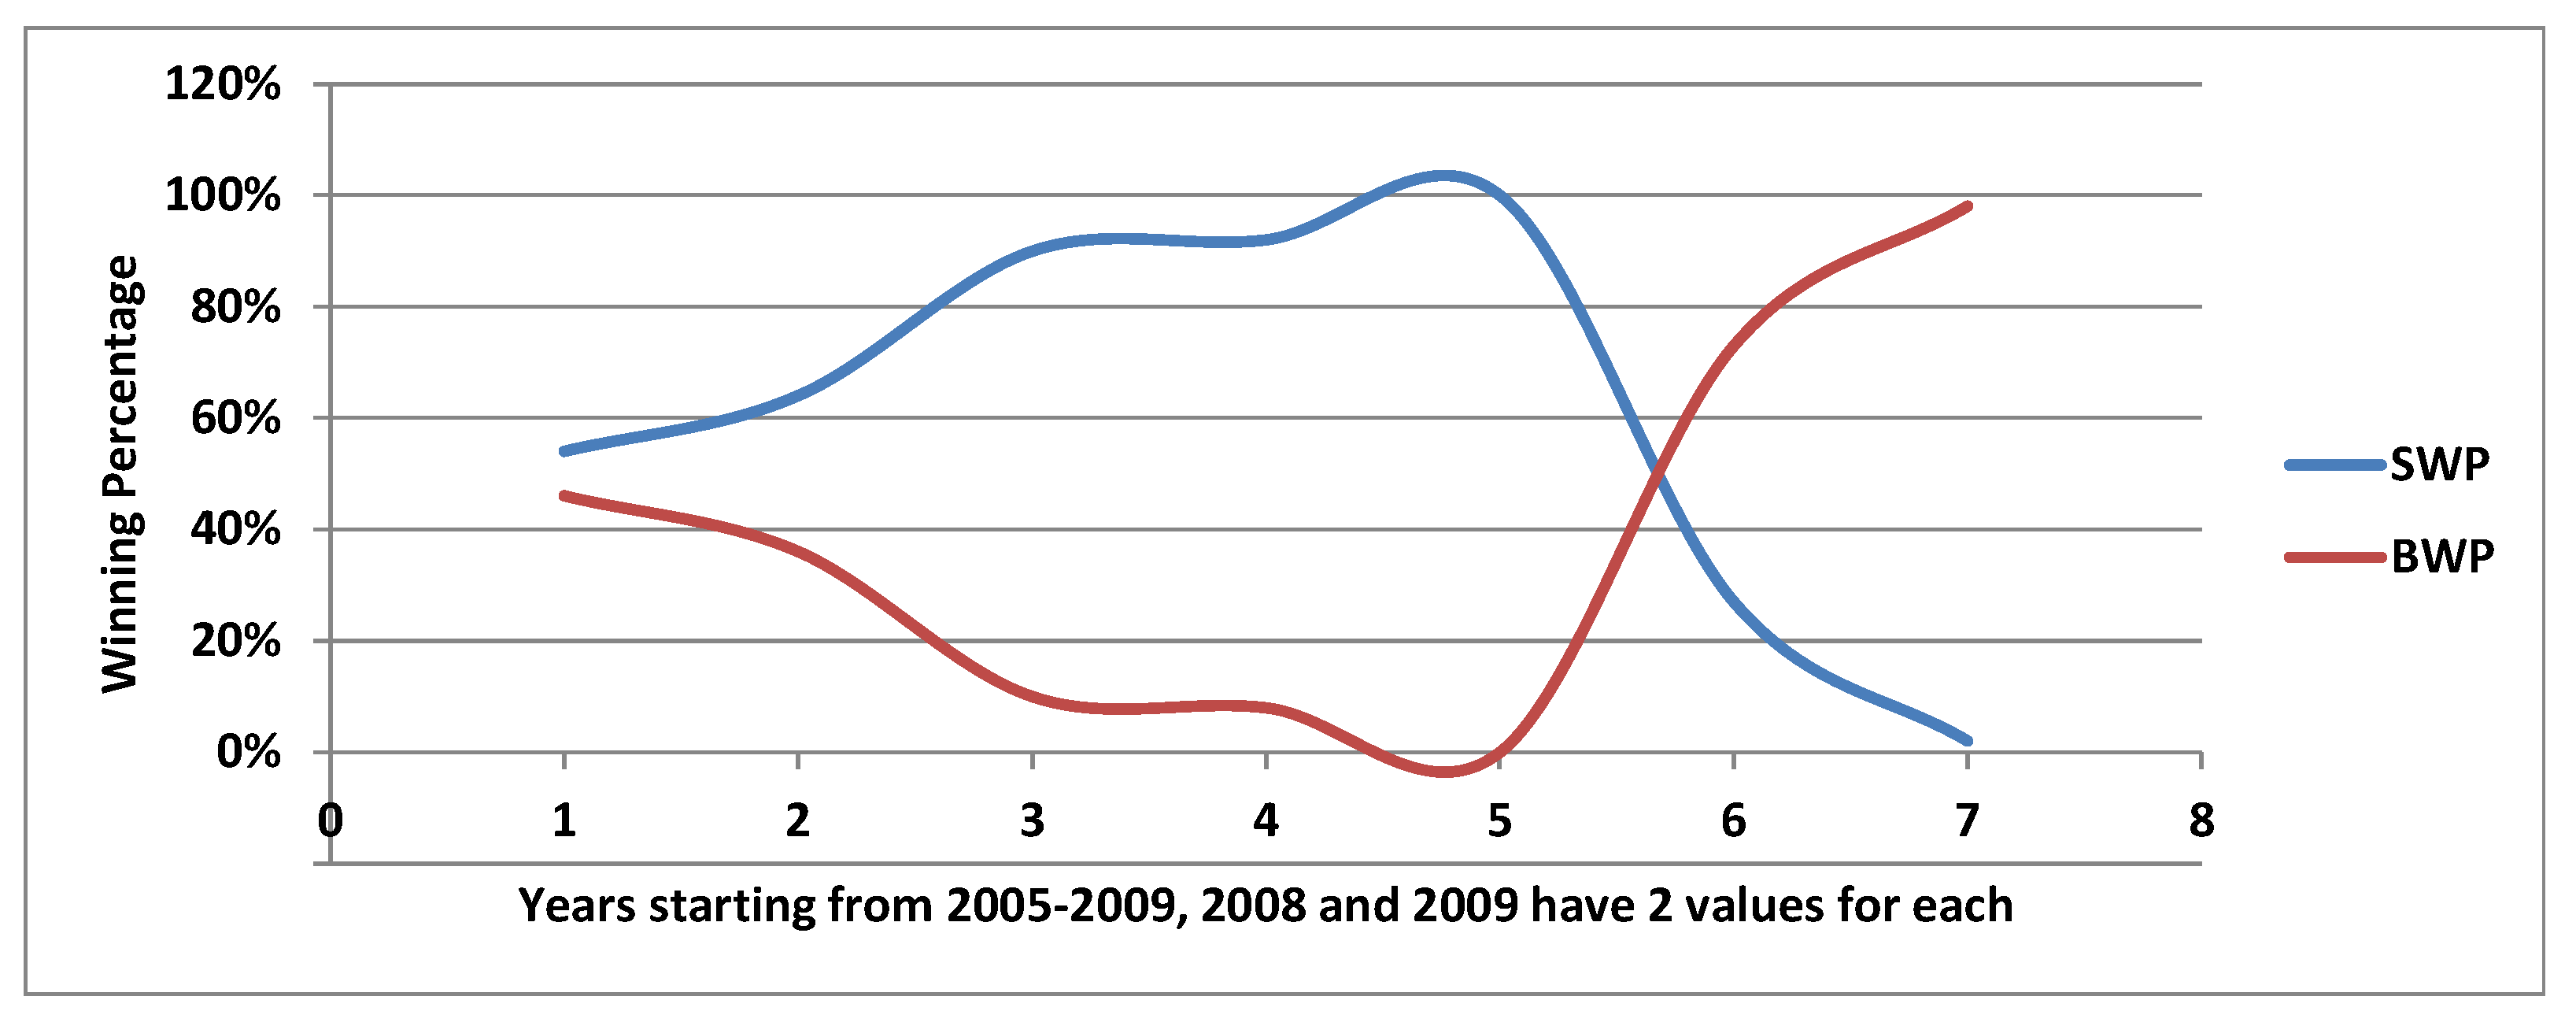
3.3. Real-World Case 2: International Iron Ore Negotiations (2005–2009)
- 2005 negotiations: price increase, SP = 90% price increase, and P = 71.5% price increase.
- 2006 negotiations: price increase, SP = 24% price increase, and P = 19% price increase.
- 2007 negotiations: price increase, SP = 10% price increase, and P = 9.5% price increase.
- 2008 negotiations: price increase (as we assumed that the buyers’ negotiator came with a 10% increase in mind, like that of the previous year), price increase, and price increase. For the other type of the ore; price increase.
- 2009 negotiations: price decrease (as we assumed that the seller’s negotiator came with a 0% decrease in mind, as they used to increase the price of the ore in the previous years), price decrease, and price decrease, and price decrease of the other type of ore.
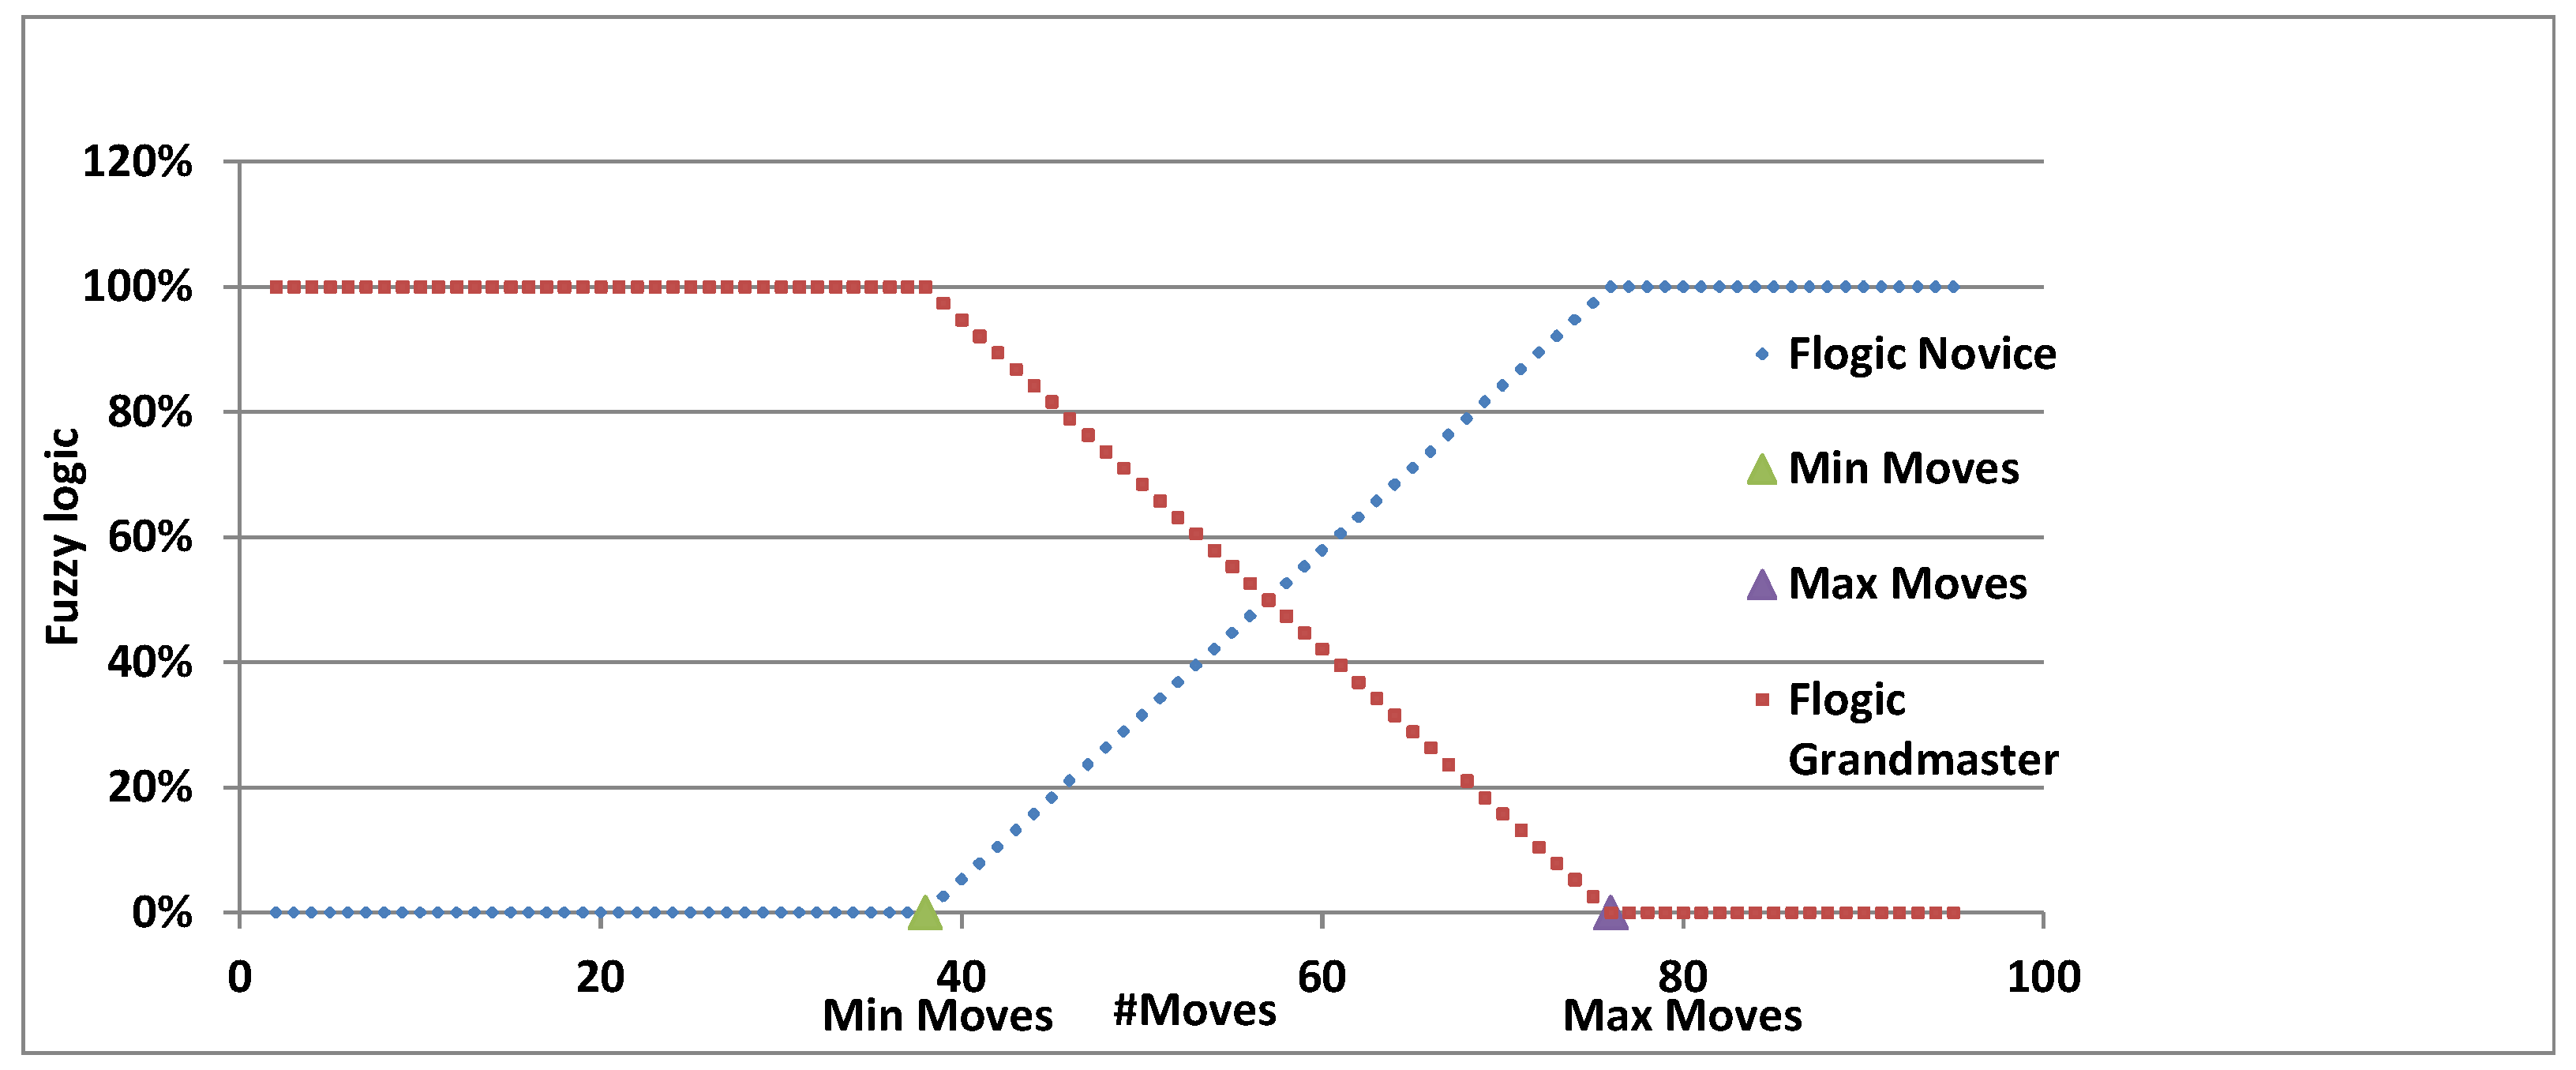
3.4. Game Theory
- (Q1) If the Game ended with 50 moves, what is the fuzzy win–win situation for each of the players? The model response: The novice’s win–win percentage is 32%, whereas the grandmaster’s win–win percentage is 68%.
- (Q2) If the novice player wants to achieve a 60% winning percentage out of his/her game, in what number of moves should he/she lose the game? The model response: the novice’s number of moves is 61.
- (Q3) If the grandmaster wants to achieve 60% wining out of his/her game, in what number of moves should he/she win the game? The model response: the grandmaster’s number of moves is 53.
3.5. Conceptual Comparison to the Traditional Win–Win Approach
4. Conclusions
Author Contributions
Funding
Institutional Review Board Statement
Informed Consent Statement
Data Availability Statement
Acknowledgments
Conflicts of Interest
References
- Åge, L.J.; Eklinder-Frick, J. Goal-oriented balancing: Happy–happy negotiations beyond win–win situations. J. Bus. Ind. Mark. 2017, 32, 525–534. [Google Scholar] [CrossRef]
- Newton, T. Practical idealism: An oxymoron? J. Manag. Stud. 2005, 42, 869–884. [Google Scholar] [CrossRef]
- Prasad, P.; Elmes, M. In the name of the practical: Unearthing the hegemony of pragmatics in the discourse of environmental management. J. Manag. Stud. 2005, 42, 845–867. [Google Scholar] [CrossRef]
- Isil, O.; Hernke, M.T. The triple bottom line: A critical review from a transdisciplinary perspective. Bus. Strategy Environ. 2017, 26, 1235–1251. [Google Scholar] [CrossRef]
- Seles, B.M.R.P.; de Sousa Jabbour, A.B.L.; Jabbour, C.J.C.; Latan, H.; Roubaud, D. Do environmental practices improve business performance even in an economic crisis? Extending the win–win perspective. Ecol. Econ. 2019, 163, 189–204. [Google Scholar] [CrossRef]
- Lau, R.S.M.; May, B.E. A win–win paradigm for quality of work life and business performance. Hum. Resour. Dev. Q. 1998, 9, 211–226. [Google Scholar] [CrossRef]
- Hassanat, A.B.; Altarawneh, G. Gambling-free lottery, a new Islamic lending ticket. J. Islam. Account. Bus. Res. 2015, 6, 42–54. [Google Scholar] [CrossRef]
- Brandenburger, A.M.; Nalebuff, B.J. The Right Game: Use Game Theory to Shape Strategy; Harvard Business Review: Chicago, IL, USA, 1995; Volume 76. [Google Scholar]
- Samsami, R.; Tavakolan, M. A game theoretic model for subcontractors’ partnership in construction: Win–win game. In Proceedings of the Construction Research Congress 2016, San Juan, Puerto Rico, 31 May–2 June 2016; pp. 597–606. [Google Scholar]
- Van der Byl, C.A.; Slawinski, N. Embracing tensions in corporate sustainability: A review of research from win–wins and trade-offs to paradoxes and beyond. Organ. Environ. 2015, 28, 54–79. [Google Scholar] [CrossRef]
- Struik, P.C.; Kuyper, T.W.; Brussaard, L.; Leeuwis, C. Deconstructing and unpacking scientific controversies in intensification and sustainability: Why the tensions in concepts and values? Curr. Opin. Environ. Sustain. 2014, 8, 80–88. [Google Scholar] [CrossRef]
- Lehmann, J. Biological carbon sequestration must and can be a win–win approach. Clim. Chang. 2009, 97, 459–463. [Google Scholar] [CrossRef]
- Fedak, M. Marine animals as platforms for oceanographic sampling: A win/win situation for biology and operational oceanography. Mem. Natl. Inst. Polar Res. 2004, 58, 133–147. [Google Scholar]
- Nagel, S.S. Win–win policy. Policy Stud. J. 1995, 23, 181–183. [Google Scholar] [CrossRef]
- Lajeunesse, A. Finding ‘Win-Win’–China’s Arctic Policy and What it Means for Canada. Sch. Public Policy Publ. 2018, 11, 1–11. [Google Scholar] [CrossRef]
- Tarjuelo, R.; Margalida, A.; Mougeot, F. Changing the fallow paradigm: A win–win strategy for the post-2020 Common Agricultural Policy to halt farmland bird declines. J. Appl. Ecol. 2020, 57, 642–649. [Google Scholar] [CrossRef]
- Wang, J.; Zhang, L.; Huang, J. How could we realize a win–win strategy on irrigation price policy? Evaluation of a pilot reform project in Hebei Province, China. J. Hydrol. 2016, 539, 379–391. [Google Scholar] [CrossRef]
- Ambasta, A.; Buonocore, J.J. Carbon pricing: A win–win environmental and public health policy. Can. J. Public Health 2018, 109, 779–781. [Google Scholar] [CrossRef]
- Hopkins, S.R.; Sokolow, S.H.; Buck, J.C.; De Leo, G.A.; Jones, I.J.; Kwong, L.H.; LeBoa, C.; Lund, A.J.; MacDonald, A.J.; Nova, N.; et al. How to identify win–win interventions that benefit human health and conservation. Nat. Sustain. 2021, 4, 298–304. [Google Scholar] [CrossRef]
- Zeyer, A. A win–win situation for health and science education: Seeing through the lens of a new framework model of health literacy. In Science|Environment|Health; Springer: Dordrecht, The Netherlands, 2012; pp. 147–173. [Google Scholar]
- Boehm, B.; Egyed, A.; Port, D.; Shah, A.; Kwan, J.; Madachy, R. A stakeholder win–win approach to software engineering education. Ann. Softw. Eng. 1998, 6, 295–321. [Google Scholar] [CrossRef]
- Rost, K.; Ehrmann, T. Reporting biases in empirical management research: The example of win–win corporate social responsibility. Bus. Soc. 2017, 56, 840–888. [Google Scholar] [CrossRef]
- Farrell, G.; Thirion, S. Social capital and rural development: From win-lose to win–win with the LEADER initiative. In Winning and Losing: The Changing Geography of Europe’s Rural Areas; Ashgate Publishing Ltd.: Aldershot, UK, 2005; pp. 281–298. [Google Scholar]
- Shet, S.M.; Thayallath, S.K.; Bisht, M.; Pereira, M.M.; Coutinho, J.A.; Sanna Kotrappanavar, N.; Mondal, D. Engineering Cytochrome C with Quantum Dots and Ionic Liquids: A Win-Win Strategy for Protein Packaging against Multiple Stresses. ACS Sustain. Chem. Eng. 2021, 9, 8327–8335. [Google Scholar] [CrossRef]
- Damas, C.; Lambeau, B.; Van Lamsweerde, A. Scenarios, goals, and state machines: A win–win partnership for model synthesis. In Proceedings of the 14th ACM SIGSOFT International Symposium on Foundations of Software Engineering, Portland, OR, USA, 5–11 November 2006; pp. 197–207. [Google Scholar]
- Rastvorova, M. Gastronomical Tourism of the Eastern Boykychina as An Example of Implementation of the Win-Win Approach in Tourism and Local Development. In Multidisciplinary Issues in Social Science Research; R.P. Publications: Delhi, India, 2021. [Google Scholar]
- Wilson, L. Finding the win–win: Providing supportive and enriching volunteer tourism experiences while promoting sustainable social change. Worldw. Hosp. Tour. Themes 2015, 7, 201–207. [Google Scholar] [CrossRef]
- Singer, J.D. Deterrence, Arms Control, and Disarmament; Ohio State University Press: Columbus, OH, USA, 1962. [Google Scholar]
- Covey, S.R. The 7 Habits of Highly Effective People: Powerful Lessons in Personal Change; Simon and Schuster: New York, NY, USA, 2004. [Google Scholar]
- Nalis, D.; Schütz, A.; Pastukhov, A. The Bamberg Trucking Game: A paradigm for assessing the detection of win–win solutions in a potential conflict scenario. Front. Psychol. 2018, 9, 138. [Google Scholar] [CrossRef] [PubMed] [Green Version]
- Fujita, K.; Ito, T.; Klein, M. Enabling Large Scale Deliberation using Ideation and Negotiation-Support Agents. In Proceedings of the 2017 IEEE 37th International Conference on Distributed Computing Systems Workshops (ICDCSW), Atlanta, GA, USA, 5–8 June 2017; pp. 360–363. [Google Scholar]
- Thompson, L.L.; Gonzales, R. Environmental disputes. In Environment, Ethics, and Behavior; The New Lexington Press: San Francisco, CA, USA, 1997; pp. 75–104. [Google Scholar]
- Brooks, J.S. Design features and project age contribute to joint success in social, ecological, and economic outcomes of community-based conservation projects. Conserv. Lett. 2017, 10, 23–32. [Google Scholar] [CrossRef] [Green Version]
- Wesner, B.S.; Smith, A.B. Salary negotiation: A role-play exercise to prepare for salary negotiation. Manag. Teach. Rev. 2019, 4, 14–26. [Google Scholar] [CrossRef]
- Carbonara, N.; Costantino, N.; Pellegrino, R. Concession period for PPPs: A win–win model for a fair risk sharing. Int. J. Proj. Manag. 2014, 32, 1223–1232. [Google Scholar] [CrossRef]
- Ekermo, G. The Struggle Within-Examining the Presence of ‘Win-Win’ Solutions in EU Environmental Legislation. Master’s Thesis, University of Gothenburg, Gothenburg, Sweden, 2013. [Google Scholar]
- Smith, D.P.; Rhoades, P.K.; Tolman, N.M. The seven personal habits of highly effective dieticians. J. Am. Diet. Assoc. 1994, 94, 377–380. [Google Scholar] [CrossRef]
- Engler, G. How to Scale Your CPFR-Pilot. In Collaborative Customer Relationship Management; Springer: Berlin/Heidelberg, Germany, 2004; pp. 199–214. [Google Scholar]
- Moon, S.D.; Dathe-Douglass, S. The Ultimate Competitive Advantage: Why Your People Make All the Difference and the 6 Practices You Need to Engage Them; BenBella Books, Inc.: Dallas, TX, USA, 2015. [Google Scholar]
- Willing, S.J.; Gunderman, R.B.; Cochran, P.L.; Saxton, T. The polity of academic medicine: A critical analysis of autocratic governance. J. Am. Coll. Radiol. 2004, 1, 972–980. [Google Scholar] [CrossRef]
- Blount, J. Inked: The Ultimate Guide to Powerful Closing and Sales Negotiation Tactics That Unlock Yes and Seal the Deal; John Wiley & Sons: Hoboken, NJ, USA, 2020. [Google Scholar]
- Dor, M.M.A. Probing Diplomacy on Resource Conflicts between Kenya and South Sudan. Ph.D. Thesis, University of Fort Hare, Alice, South Africa, 2011. [Google Scholar]
- Zhang, S.; Zang, X.; Zhang, F. Development and validation of the win–win scale. Front. Psychol. 2021, 12, 1475. [Google Scholar] [CrossRef]
- Bradford, W.D. Global capitalism and sustainable development. In Proceedings of the Conference on Global Ethos, Tokyo, Japan, 24–26 October 2000; pp. 1–12. [Google Scholar]
- Tóth, G. The Limitation of “CSR Tools”, Deep Social Responsibility and the Truly Responsible Enterprise. Corp. Soc. Responsib. Sustain. Manag. 2009, 1, 16. [Google Scholar]
- Yu, H.; Liu, Z.; Li, C.; Liu, R. Study on pricing mechanism of cooling, heating, and electricity considering demand response in the stage of park integrated energy system planning. Appl. Sci. 2020, 10, 1565. [Google Scholar] [CrossRef] [Green Version]
- Yildiz, D.; Yildiz, D.; Gunes, M.S. New Security Concept and Analytical-Transdisciplinary Approaches to Hydro Politics. Int. J. Sci. Eng. Res. 2016, 7, 402–407. [Google Scholar]
- Moore, S.A.; Mitchell, R.C. Transdisciplinary approaches to young people’s citizenship: From bystanders to action. In Politics, Participation & Power Relations; Brill: Leiden, The Netherlands, 2012; pp. 183–205. [Google Scholar]
- Zhou, L.; Chan, E.S. Motivations of tourism-induced mobility: Tourism development and the pursuit of the Chinese dream. Int. J. Tour. Res. 2019, 21, 824–838. [Google Scholar] [CrossRef]
- Paul, J.M. The Economics of Discontent: From Failing Elites to the Rise of Populism; Tomson: Toronto, ON, Canada, 2019. [Google Scholar]
- Roboam, M.; Fox, M.S. 17 Enterprise Management Network Architecture. In Artificial Intelligence Applications in Manufacturing; AAAI Press: Palo Alto, CA, USA, 1992; p. 401. [Google Scholar]
- Forstorp, P.A.; Mellström, U. Becoming an Exporter of Higher Education: Positioning Sweden as a Knowledge Nation. In Higher Education, Globalization and Eduscapes; Palgrave Macmillan: London, UK, 2018; pp. 195–241. [Google Scholar]
- Prothrow-Stith, D.B. Violence prevention in the schools. N. Engl. J. Public Policy 1994, 10, 11. [Google Scholar]
- Mbanefo, I.M.A. Role of Personality, Length of Service and Gender as Determinants of Conflict Resolution Style amongst Workers. Ph.D. Thesis, University of Nigeria, Nsukka, Nigeria, 2017. [Google Scholar]
- Hoffman, B. Win-Win Competitiveness Made in Canada: How to Be Competitive Using the Consensus Approach; Captus Press: Concord, ON, Canada, 1993. [Google Scholar]
- Eshun, B.T.B.; Chan, A.P.; Osei-Kyei, R. Conceptualizing a win–win scenario in public–private partnerships: Evidence from a systematic literature review. Eng. Constr. Archit. Manag. 2020, 28, 2712–2735. [Google Scholar] [CrossRef]
- Bazerman, M.H. Negotiator judgment: A critical look at the rationality assumption. Am. Behav. Sci. 1983, 27, 211–228. [Google Scholar] [CrossRef]
- De Dreu, C.K.; Koole, S.L.; Steinel, W. Unfixing the fixed pie: A motivated information-processing approach to integrative negotiation. J. Personal. Soc. Psychol. 2000, 79, 975. [Google Scholar] [CrossRef]
- Harinck, F.; De Dreu, C.K.; Van Vianen, A.E. The impact of conflict issues on fixed-pie perceptions, problem solving, and integrative outcomes in negotiation. Organ. Behav. Hum. Decis. Process. 2000, 81, 329–358. [Google Scholar] [CrossRef] [Green Version]
- Lute, B.E. Win/Win: The Art of Synergistic Communication; Trafford Publishing: Bloomington, IN, USA, 2002. [Google Scholar]
- Marken, G. Getting to Yes: Negotiating Agreement Without Giving In. Public Relations Q. 2002, 47, 6. [Google Scholar]
- Gruenbacher, P. Collaborative requirements negotiation with EasyWinWin. In Proceedings of the 11th International Workshop on Database and Expert Systems Applications, London, UK, 4–8 September 2000; pp. 954–958. [Google Scholar]
- Ruiz Cortés, A.; Durán Toro, A.; Corchuelo Gil, R.; Toro Bonilla, M. Using constraint programming for the automatic detection of conflicts in quality requirements. In Proceedings of the Workshop en Ingeniería de Requisitos, Valencia, Spain, 11–12 November 2002; pp. 300–308. [Google Scholar]
- Rodgers, W.H., Jr. The Myth of the Win-Win: Misdiagnosis in the Business of Reassembling Nature. Ariz. Law Rev. 2000, 42, 297. [Google Scholar]
- Brainard, A.J. The Importance of Teaching a Win-Win Philosophy. In Proceedings of the 6th Annual Audio-Tutorial System Conference, San Francisco, CA, USA, 6 November 1974; pp. 1–8. [Google Scholar]
- Wiesemann, E. From “win–win” to “lose-lose”: How neoliberalism undermines the sustainable city-a case study of Hamburg. In Master Thesis Series in Environmental Studies and Sustainability Science; LUCSUS: Lund, Sweden, 2014. [Google Scholar]
- Hao, W. A Study on Win lose Value and Win win Value: Two Ways of Thinking and Perception in Social Economic Activities. J. Beijing Adm. Coll. 2000, 1, 1–7. [Google Scholar]
- De Voogt, A.; Hassanat, A.B.; Alhasanat, M.B. The history and distribution of Tab: A survey of Petra’s gaming boards. J. Near East. Stud. 2017, 76, 93–101. [Google Scholar] [CrossRef]
- Mann, D. Systematic win–win problem solving in a business environment. Growth 2001, 88, 95. [Google Scholar]
- Hassanat, A.B.; Altarawneh, G.; Tarawneh, A.S.; Faris, H.; Alhasanat, M.B.; de Voogt, A.; Al-Rawashdeh, B.; Alshamaileh, M.; Prasath, S.V. On Computerizing the Ancient Game of Tab. Int. J. Gaming-Comput.-Mediat. Simul. (IJGCMS) 2018, 10, 20–40. [Google Scholar] [CrossRef] [Green Version]
- Kokkinen, L.; Freiler, A.; Muntaner, C.; Shankardass, K. How and why do win–win strategies work in engaging policy-makers to implement Health in All Policies? A multiple-case study of six state-and national-level governments. Health Res. Policy Syst. 2019, 17, 1–11. [Google Scholar] [CrossRef] [Green Version]
- Deleersnyder, B.; Dekimpe, M.G.; Steenkamp, J.B.E.; Koll, O. Win–win strategies at discount stores. J. Retail. Consum. Serv. 2007, 14, 309–318. [Google Scholar] [CrossRef]
- Daley, L.K.; Menke, E.; Kirkpatrick, B.; Sheets, D. Partners in practice: A win–win model for clinical education. J. Nurs. Educ. 2008, 47, 30–32. [Google Scholar] [CrossRef]
- Papakonstantinidis, L.A.; Vagena, A. The Win-Win-Win Papakonstantinidis Model in the Ultimatum Game. Economics 2021, 9, 87–103. [Google Scholar] [CrossRef]
- Burgin, S.; Hardiman, N. Eco-accreditation: Win–win for the environment and small business? Int. J. Bus. Stud. Publ. Fac. Bus. Adm. Ed. Cowan Univ. 2010, 18, 23–38. [Google Scholar]
- Belasen, A.T.; Belasen, A.M.; Belasen, A.R.; Belasen, A.R. A win–win for health care: Promoting co-leadership and increasing women’s representation at the top. Gend. Manag. Int. J. 2021, 36, 762–781. [Google Scholar] [CrossRef]
- Phelps, J.; Friess, D.A.; Webb, E.L. Win–win REDD+ approaches belie carbon–biodiversity trade-offs. Biol. Conserv. 2012, 154, 53–60. [Google Scholar] [CrossRef]
- Xu, Y.Y.; Sawadogo-Lewis, T.; King, S.E.; Mitchell, A.; Roberton, T. Integrating nutrition into the education sector in low-and middle-income countries: A framework for a win–win collaboration. Matern. Child Nutr. 2021, 17, e13156. [Google Scholar] [CrossRef] [PubMed]
- Luo, J.; Zhang, S.; Yang, H. Win–win search: Dual-agent stochastic game in session search. In Proceedings of the 37th International ACM SIGIR Conference on Research & Development in Information Retrieval, Gold Coast, QLD, Australia, 6–11 July 2014; pp. 587–596. [Google Scholar]
- Liu, Y.; Cao, C.; Wang, Q.; Zheng, W.; Shen, J.; Chen, Y.; Gu, F.; Han, M.; Rocchi, I. Utilization of bioethanol industry recycled waste for sustainable soil improvement: A win–win application. Eng. Geol. 2021, 289, 106192. [Google Scholar] [CrossRef]
- Zadeh, L.A. Fuzzy sets. In Fuzzy Sets, Fuzzy Logic, and Fuzzy Systems: Selected Papers by Lotfi A Zadeh; World Scientific: Singapore, 1996; pp. 394–432. [Google Scholar]
- Altarawneh, G. A fuzzy logic-based approach for progressive pricing of freshwater in Jordan. J. Revenue Pricing Manag. 2021, 20, 480–489. [Google Scholar] [CrossRef]
- Altarawneh, G.A. A fuzzy logic-based approach for pricing of electricity in Jordan. J. Revenue Pricing Manag. 2018, 17, 365–372. [Google Scholar] [CrossRef]
- Andriantiatsaholiniaina, L.A.; Kouikoglou, V.S.; Phillis, Y.A. Evaluating strategies for sustainable development: Fuzzy logic reasoning and sensitivity analysis. Ecol. Econ. 2004, 48, 149–172. [Google Scholar] [CrossRef]
- Merigo, J.M.; Casanovas, M. The fuzzy generalized OWA operator and its application in strategic decision making. Cybern. Syst. Int. J. 2010, 41, 359–370. [Google Scholar] [CrossRef]
- Alter, S.; Ginzberg, M. Managing uncertainty in MIS implementation. Sloan Manag. Rev. (pre-1986) 1978, 20, 23. [Google Scholar]
- Marzouk, M.; Amin, A. Predicting construction materials prices using fuzzy logic and neural networks. J. Constr. Eng. Manag. 2013, 139, 1190–1198. [Google Scholar] [CrossRef]
- Hassanat, A.B.; Prasath, V.S.; Al-Mahadeen, B.M.; Alhasanat, S.M.M. Classification and gender recognition from veiled-faces. Int. J. Biom. 2017, 9, 347–364. [Google Scholar] [CrossRef]
- Hassanat, A.B.; Alkasassbeh, M.; Al-awadi, M.; Esra’a, A. Colour-based lips segmentation method using artificial neural networks. In Proceedings of the 2015 6th International Conference on Information and Communication Systems (ICICS), Amman, Jordan, 7–9 April 2015; pp. 188–193. [Google Scholar]
- Tarawneh, A.S.; Hassanat, A.B.; Celik, C.; Chetverikov, D.; Rahman, M.S.; Verma, C. Deep face image retrieval: A comparative study with dictionary learning. In Proceedings of the 2019 10th International Conference on Information and Communication Systems (ICICS), Irbid, Jordan, 11–13 June 2019; pp. 185–192. [Google Scholar]
- Hassanat, A.B. On identifying terrorists using their victory signs. Data Sci. J. 2018, 17, 27. [Google Scholar] [CrossRef] [Green Version]
- Hassanat, A.B.; Prasath, V.S.; Al-kasassbeh, M.; Tarawneh, A.S.; Al-shamailh, A.J. Magnetic energy-based feature extraction for low-quality fingerprint images. Signal Image Video Process. 2018, 12, 1471–1478. [Google Scholar] [CrossRef]
- Tarawneh, A.S.; Celik, C.; Hassanat, A.B.; Chetverikov, D. Detailed investigation of deep features with sparse representation and dimensionality reduction in cbir: A comparative study. Intell. Data Anal. 2020, 24, 47–68. [Google Scholar] [CrossRef] [Green Version]
- Tarawneh, A.S.; Hassanat, A.B.; Almohammadi, K.; Chetverikov, D.; Bellinger, C. Smotefuna: Synthetic minority over-sampling technique based on furthest neighbour algorithm. IEEE Access 2020, 8, 59069–59082. [Google Scholar] [CrossRef]
- Hassanat, A.B. Two-point-based binary search trees for accelerating big data classification using KNN. PLoS ONE 2018, 13, e0207772. [Google Scholar] [CrossRef] [Green Version]
- Hassanat, A. Norm-based binary search trees for speeding up knn big data classification. Computers 2018, 7, 54. [Google Scholar] [CrossRef] [Green Version]
- Hassanat, A. Greedy Algorithms for Approximating the Diameter of Machine Learning Datasets in Multidimensional Euclidean Space: Experimental Results. ADCAIJ Adv. Distrib. Comput. Artif. Intell. J. 2018, 7, 15–30. [Google Scholar] [CrossRef] [Green Version]
- Hassanat, A.B. Furthest-pair-based binary search tree for speeding big data classification using k-nearest neighbors. Big Data 2018, 6, 225–235. [Google Scholar] [CrossRef]
- Hassanat, A. Furthest-pair-based decision trees: Experimental results on big data classification. Information 2018, 9, 284. [Google Scholar] [CrossRef] [Green Version]
- Jordan Imports Iraqi Oil with 16$ Discount on Brent Price per Barrel—Energy Minister. Available online: https://www.jordantimes.com/news/local/jordan-imports-iraqi-oil-16-discount-brent-price-barrel-%E2%80%94%C2%A0energy-minister. (accessed on 30 October 2021).
- Yao, J.; Ma, L.; Zhang, L. From Lab Experiments to Real Negotiations: An Investigation of International Iron Ore Negotiations. Negot. J. 2018, 34, 69–87. [Google Scholar] [CrossRef]
- Hsu, F.H. Large-Scale Parallelization of Alpha-Beta Search: An Algorithmic and Architectural Study with Computer Chess; Carnegie Mellon University: Pittsburgh, PA, USA, 1989. [Google Scholar]


| Publication Year | Reference | Research Field | Publication Year | Reference | Research Field |
|---|---|---|---|---|---|
| 1962 | [28] | Policy | 2014 | [66] | Sustainability |
| 1995 | [8] | Game Theory | 2015 | [10] | Sustainability |
| 1995 | [14] | Policy | 2015 | [27] | Tourism |
| 1998 | [6] | business | 2016 | [9] | Game Theory |
| 1998 | [21] | Education | 2016 | [17] | Agriculture |
| 2000 | [67] | Social science | 2017 | [1] | Economics |
| 2000 | [62] | Engineering | 2017 | [68] | Game Theory |
| 2001 | [69] | business | 2017 | [22] | Social Science |
| 2002 | [61] | Public Relations | 2018 | [70] | Game Theory |
| 2002 | [63] | Engineering | 2018 | [15] | Policy |
| 2004 | [13] | Biology | 2018 | [18] | Health |
| 2005 | [23] | Social science | 2019 | [5] | Economics |
| 2006 | [25] | Engineering | 2019 | [71] | Policy |
| 2007 | [72] | business | 2020 | [16] | Agriculture |
| 2008 | [73] | Education | 2021 | [74] | Game Theory |
| 2009 | [12] | Biology | 2021 | [19] | Health |
| 2010 | [75] | business | 2021 | [76] | Health |
| 2012 | [77] | Biology | 2021 | [78] | Education |
| 2012 | [20] | Education | 2021 | [24] | Engineering |
| 2014 | [79] | Game Theory | 2021 | [80] | Engineering |
| 2014 | [11] | Sustainability | 2021 | [26] | Tourism |
| Share Price | C2-SWP | C1-BWP | ||
|---|---|---|---|---|
| 33 | 0% | 100% | 33 | 33 |
| 35 | 6% | 94% | 35 | 35 |
| 37 | 12% | 88% | 37 | 37 |
| 39 | 18% | 82% | 39 | 39 |
| 41 | 24% | 76% | 41 | 41 |
| 43 | 30% | 70% | 43 | 43 |
| 45 | 36% | 64% | 45 | 45 |
| 47 | 42% | 58% | 47 | 47 |
| 49 | 48% | 52% | 49 | 49 |
| 51 | 55% | 45% | 51 | 51 |
| 53 | 61% | 39% | 53 | 53 |
| 55 | 67% | 33% | 55 | 55 |
| 57 | 73% | 27% | 57 | 57 |
| 59 | 79% | 21% | 59 | 59 |
| 61 | 85% | 15% | 61 | 61 |
| 63 | 91% | 9% | 63 | 63 |
| 65 | 97% | 3% | 65 | 65 |
| Date | Production Cost | Brent International Price | Jordan Buying Price | Iraq SWP | Jordan BWP | Iraq Wins More | Jordan Wins More |
|---|---|---|---|---|---|---|---|
| December 30 | 10.57 | 68.44 | 52.44 | 72% | 28% | 🗸 | |
| January 6 | 10.57 | 68.91 | 52.91 | 73% | 27% | 🗸 | |
| January 13 | 10.57 | 64.2 | 48.2 | 70% | 30% | 🗸 | |
| January 21 | 10.57 | 64.59 | 48.59 | 70% | 30% | 🗸 | |
| January 27 | 10.57 | 59.32 | 43.32 | 67% | 33% | 🗸 | |
| February 3 | 10.57 | 54.45 | 38.45 | 64% | 36% | 🗸 | |
| February 10 | 10.57 | 53.27 | 37.27 | 63% | 37% | 🗸 | |
| February 18 | 10.57 | 57.75 | 41.75 | 66% | 34% | 🗸 | |
| February 24 | 10.57 | 56.3 | 40.3 | 65% | 35% | 🗸 | |
| March 2 | 10.57 | 51.9 | 35.9 | 61% | 39% | 🗸 | |
| March 6 | 10.57 | 45.27 | 29.27 | 54% | 46% | 🗸 | |
| March 10 | 10.57 | 37.22 | 21.22 | 40% | 60% | 🗸 | |
| March 16 | 10.57 | 30.05 | 14.05 | 18% | 82% | 🗸 | |
| March 24 | 10.57 | 27.15 | 11.15 | 3% | 97% | 🗸 | |
| March 30 | 10.57 | 22.76 | 6.76 | 0% | 100% | 🗸 | |
| April 7 | 10.57 | 31.87 | 15.87 | 25% | 75% | 🗸 | |
| April 14 | 10.57 | 29.6 | 13.6 | 16% | 84% | 🗸 | |
| April 20 | 10.57 | 25.57 | 9.57 | 0% | 100% | 🗸 | |
| April 28 | 10.57 | 20.46 | 4.46 | 0% | 100% | 🗸 | |
| May 4 | 10.57 | 27.2 | 11.2 | 4% | 96% | 🗸 | |
| May 11 | 10.57 | 29.63 | 13.63 | 16% | 84% | 🗸 | |
| May 18 | 10.57 | 34.81 | 18.81 | 34% | 66% | 🗸 | |
| May 26 | 10.57 | 35.53 | 19.53 | 36% | 64% | 🗸 | |
| Jun 1 | 10.57 | 38.32 | 22.32 | 42% | 58% | 🗸 | |
| Jun 8 | 10.57 | 40.8 | 24.8 | 47% | 53% | 🗸 | |
| Jun 15 | 10.57 | 39.72 | 23.72 | 45% | 55% | 🗸 | |
| Jun 22 | 10.57 | 43.08 | 27.08 | 51% | 49% | 🗸 | |
| Jun 29 | 10.57 | 41.71 | 25.71 | 49% | 51% | 🗸 | |
| July 6 | 10.57 | 43.1 | 27.1 | 51% | 49% | 🗸 | |
| July 13 | 10.57 | 42.72 | 26.72 | 50% | 50% | 🗸 | 🗸 |
| July 20 | 10.57 | 43.28 | 27.28 | 51% | 49% | 🗸 | |
| July 27 | 10.57 | 43.41 | 27.41 | 51% | 49% | 🗸 | |
| August 3 | 10.57 | 44.15 | 28.15 | 52% | 48% | 🗸 | |
| August 10 | 10.57 | 44.99 | 28.99 | 54% | 46% | 🗸 | |
| August 17 | 10.57 | 45.37 | 29.37 | 54% | 46% | 🗸 | |
| August 24 | 10.57 | 45.13 | 29.13 | 54% | 46% | 🗸 | |
| August 31 | 10.57 | 42.61 | 26.61 | 50% | 50% | 🗸 | 🗸 |
| September 8 | 10.57 | 39.78 | 23.78 | 45% | 55% | 🗸 | |
| September 14 | 10.57 | 39.61 | 23.61 | 45% | 55% | 🗸 | |
| September 21 | 10.57 | 41.44 | 25.44 | 48% | 52% | 🗸 | |
| September 28 | 10.57 | 42.43 | 26.43 | 50% | 50% | 🗸 | 🗸 |
| October 5 | 10.57 | 41.29 | 25.29 | 48% | 52% | 🗸 | |
| October 12 | 10.57 | 41.72 | 25.72 | 49% | 51% | 🗸 | |
| October 19 | 10.57 | 42.62 | 26.62 | 50% | 50% | 🗸 | 🗸 |
| October 26 | 10.57 | 40.46 | 24.46 | 46% | 54% | 🗸 | |
| November 2 | 10.57 | 38.97 | 22.97 | 44% | 56% | 🗸 | |
| November 9 | 10.57 | 42.4 | 26.4 | 50% | 50% | 🗸 | 🗸 |
| November 16 | 10.57 | 43.62 | 27.62 | 52% | 48% | 🗸 | |
| November 23 | 10.57 | 46.06 | 30.06 | 55% | 45% | 🗸 | |
| November 30 | 10.57 | 47.59 | 31.59 | 57% | 43% | 🗸 | |
| Avg | 45% | 55% | 27 | 28 |
| Year | CP | SP | P | SWP | BWP | Sellers Win More | Buyers Win More |
|---|---|---|---|---|---|---|---|
| 2005 | 50% | 90% | 71.5% | 54% | 46% | 🗸 | |
| 2006 | 10% | 24% | 19.0% | 64% | 36% | 🗸 | |
| 2007 | 5% | 10% | 9.5% | 90% | 10% | 🗸 | |
| 2008 Southern ore | 10% | 70% | 65.0% | 92% | 8% | 🗸 | |
| 2008 Northern ore | 10% | 70% | 71.0% | 100% | 0% | 🗸 | |
| 2009 Southern ore | 0% | 45% | 33.0% | 27% | 73% | 🗸 | |
| 2009 Northern ore | 0% | 45% | 44.0% | 2% | 98% | 🗸 | |
| Average | 12% | 51% | 45% | 61% | 39% | 5 | 2 |
| Case | Fuzzy Win–Win Result | Traditional Win–Win Result |
|---|---|---|
| Iraqi–Jordanian current oil deal | Iraq is 45% winner Jordan is 55% winner | Both sides are winners |
| International Iron Ore Negotiations (2005–2008) | Sellers are 61% winners Buyers are 39% winners | Both sides are winners |
| International Iron Ore Negotiations (2009) | Sellers are 14.5% winners, Buyers are 85.5% winners | Both sides are winners |
| Chess Grandmaster wins against a novice after 50 moves | Grandmaster is 68% winner Novice is 32% winner | Both sides are winners |
| Chess Grandmaster wins against a novice after 75 moves | Grandmaster is 3% winner Novice is 97% winner | Both sides are winners |
Publisher’s Note: MDPI stays neutral with regard to jurisdictional claims in published maps and institutional affiliations. |
© 2022 by the authors. Licensee MDPI, Basel, Switzerland. This article is an open access article distributed under the terms and conditions of the Creative Commons Attribution (CC BY) license (https://creativecommons.org/licenses/by/4.0/).
Share and Cite
Altarawneh, G.A.; Hassanat, A.B.; Tarawneh, A.S.; Carfì, D.; Almuhaimeed, A. Fuzzy Win-Win: A Novel Approach to Quantify Win-Win Using Fuzzy Logic. Mathematics 2022, 10, 884. https://doi.org/10.3390/math10060884
Altarawneh GA, Hassanat AB, Tarawneh AS, Carfì D, Almuhaimeed A. Fuzzy Win-Win: A Novel Approach to Quantify Win-Win Using Fuzzy Logic. Mathematics. 2022; 10(6):884. https://doi.org/10.3390/math10060884
Chicago/Turabian StyleAltarawneh, Ghada A., Ahmad B. Hassanat, Ahmad S. Tarawneh, David Carfì, and Abdullah Almuhaimeed. 2022. "Fuzzy Win-Win: A Novel Approach to Quantify Win-Win Using Fuzzy Logic" Mathematics 10, no. 6: 884. https://doi.org/10.3390/math10060884
APA StyleAltarawneh, G. A., Hassanat, A. B., Tarawneh, A. S., Carfì, D., & Almuhaimeed, A. (2022). Fuzzy Win-Win: A Novel Approach to Quantify Win-Win Using Fuzzy Logic. Mathematics, 10(6), 884. https://doi.org/10.3390/math10060884