Article

Performance Degradation Based on Importance Change and Application in Dissimilar Redundancy Actuation System

1
School of Automation Science and Electrical Engineering, Beihang University, Beijing 100191, China
2
China Ningbo Institute of Technology, Beihang University, Ningbo 315800, China
3
Research Institute for Frontier Science, Beihang University, Beijing 100191, China
4
Energy Department, Politecnico di Milano, Via La Masa 34, 20156 Milano, Italy
5
Engineering Technology Department, Old Dominion University, Norfolk, VA 23529, USA
*
Author to whom correspondence should be addressed.
Mathematics 2022, 10(5), 843; https://doi.org/10.3390/math10050843
Submission received: 8 February 2022 / Revised: 2 March 2022 / Accepted: 3 March 2022 / Published: 7 March 2022

Abstract

:
The importance measure is a crucial method to identify and evaluate the system weak link. It is widely used in the optimization design and maintenance decision of aviation, aerospace, nuclear energy and other systems. The dissimilar redundancy actuation system (DRAS) is a key aircraft control subsystem which performs aircraft attitude and flight trajectory control. Its performance and reliability directly affect the aircraft flight quality and flight safety. This paper considers the influence of the Birnbaum importance measure (BIM) and integrated importance measure (IIM) on the reliability changes of key components in DRAS. The differences of physical fault characteristics of different components due to performance degradation and power mismatch, are first considered. The reliability of each component in the system is then estimated by assuming that the stochastic degradation process of the DRAS components follows an inverse Gaussian (IG) process. Finally, the weak links of the system are identified using BIM and IIM, so that the resources can be reasonably allocated to the weak links during the maintenance period. The proposed method can provide a technical support for personnel maintenance, in order to improve the system reliability with a minimal lifecycle cost.

1. Introduction

The aircraft hydraulic system provides energy for flight control, landing gear retracting and braking, etc. It has a complex structure and a severe working environment. Therefore, it is an airborne system having a high accident rate and high maintenance support cost. According to statistics, 30% of the mechanical failures in civil aviation aircrafts are caused by hydraulic system failures [1]. The actuator system, which controls the deflection force of the rudder surface required for flight, is the “muscle” of large aircrafts. It is a crucial control subsystem used to perform the flight attitude and trajectory control. Its performance and reliability directly affect the flight quality and aircraft safety. Increasing the reliability and service capacity of the actuator system and reducing the power consumption, are crucial challenges [2,3]. With the increasing requirements of reliability and economy of large aircrafts, DRAS has been widely used, since it can avoid some unknown common cause failures, and achieve high performance and reliability of flight control system. Therefore, DRAS can be considered as the development trend of large aircraft actuator systems [4].
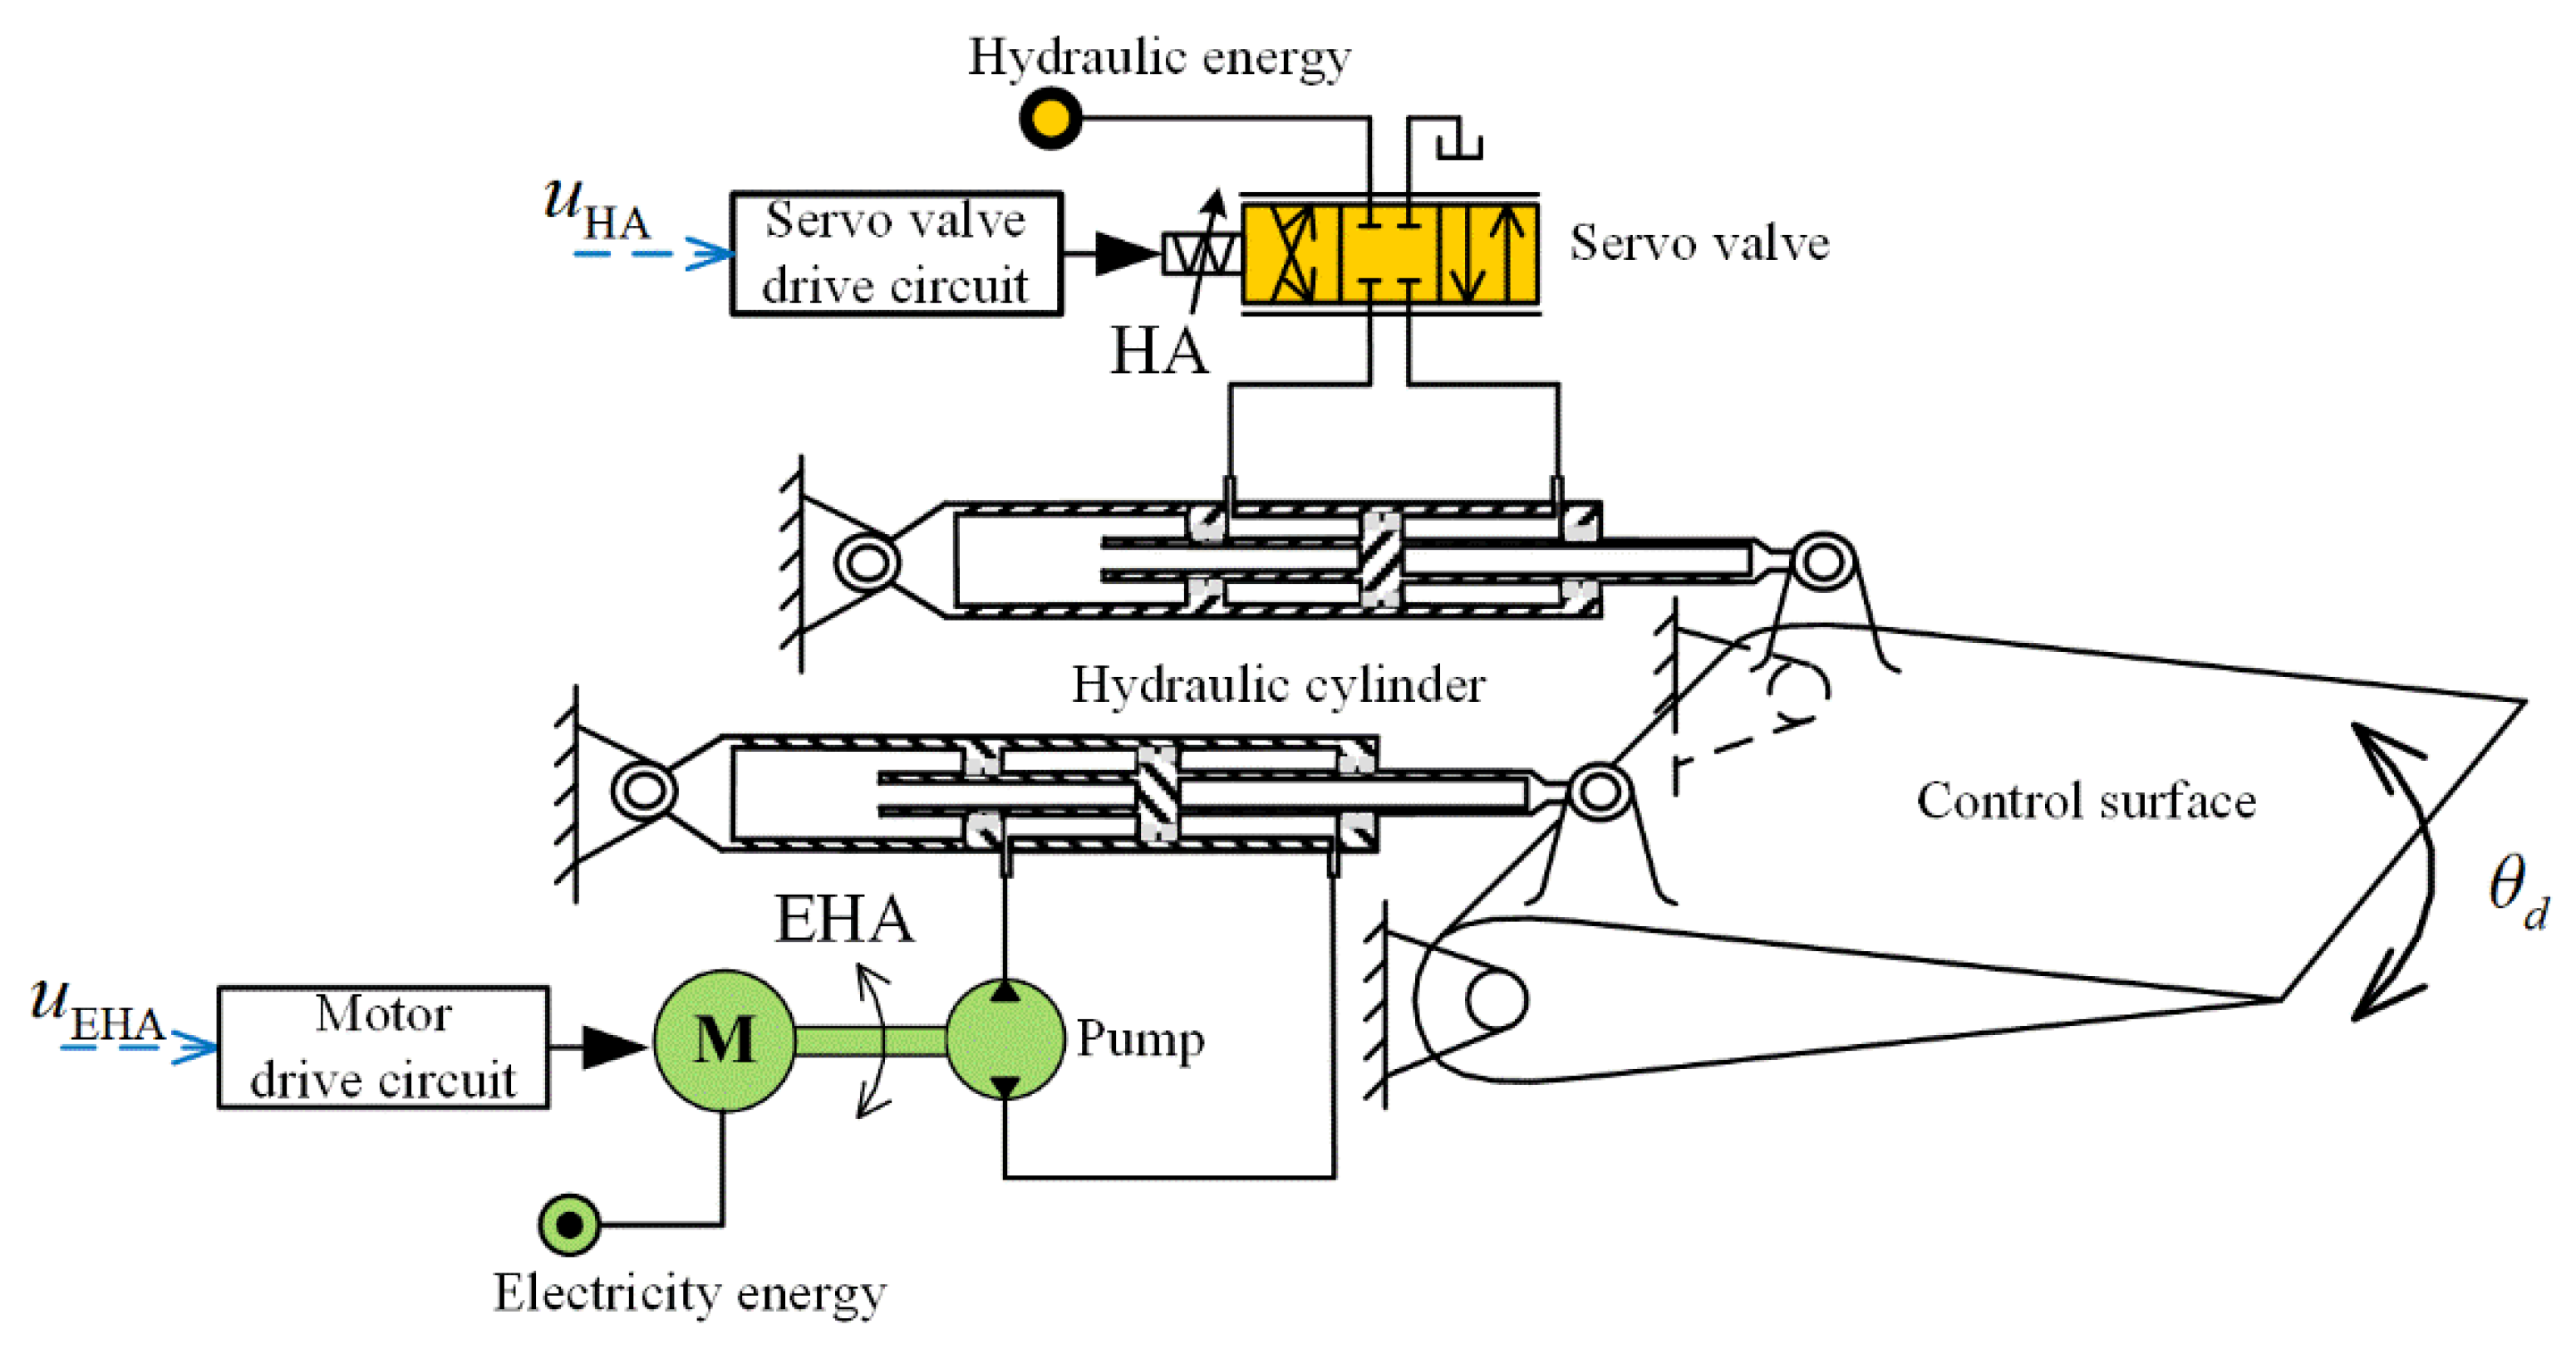
DRAS is mainly composed of a traditional hydraulic actuation system (HAS) and an electro-hydrostatic actuation system (EHAS), that together drive the control surface of the aircraft [5]. HAS is a widely used driving method on aircrafts. It has the advantages of high control accuracy, fast response speed and strong driving ability. EHAS has the advantages of light weight and high reliability. Therefore, DRAS has the advantages of fast dynamic response of HAS, as well as the advantage of high reliability of EHAS. It is the development direction of the aircraft actuation system [6,7,8]. For instance, Airbus 380 has an actuation system which uses dissimilar hydraulic power and electronic power to drive the control surface deflection, in order to avoid the serious consequences caused by common cause failure in the actuation system [9]. Once the failure of key components in the DRAS system occurs, the system performance inevitably decreases. A serious component failure may even lead to the collapse of the whole DRAS. Therefore, it is necessary to identify the key components of the system and determine the performance degradation mechanism, in order to prevent the occurrence of these events. Cai et al. [10,11] propose a method which applies the Bayesian networks to quantitatively assess operational risks in the offshore oil industry, and identify the order of importance of factors affecting the operation of the subsea oil hydraulic systems. In order to efficiently evaluate the reliability of the system, Zhu et al. [12,13] propose a random analysis framework. They obtain the reliability of the system by analyzing several benchmarks. This also provides a novel method for system reliability evaluation. In order to optimize the reliability design of hydraulic system with vibration, Zhang et al. [14] propose a reliability design method to efficiently solve the problem of reliability optimization design of hydraulic system with impact vibration. In addition, some researchers worked on the system availability and residual lifetime [15]. However, for a hydraulic system, the reliability of the components is the basis of the reliability of the hydraulic system. Therefore, when the hydraulic system is working, it is very important to determine the importance of each component in the hydraulic system, so that the weak parts can be found, and the preventive maintenance or replacement can be performed in time.
The importance measure is a crucial method to identify weak links in a system. It can evaluate the impact of the component reliability changes on the system. Therefore, it is widely used in the identification of key components and system reliability analysis [16,17,18]. Birnbaum [19] first proposes the concept of importance measure in 1968, and discusses the relationship between component reliability and system reliability in binary coherent systems. Griffith [20] extends the Birnbaum importance measure and uses its extension to study the impact of the component improvements on the system performance. Wu et al. [21] propose a novel utility importance measure of component state, which overcomes some shortcomings of the Griffith importance measure. They also discuss the contribution of a single component to the performance utility of a multi-state system. Si et al. [22] propose an integrated importance measure of performing preventive maintenance on multi-state repairable systems, in order to maximize the system performance. Dui et al. [23,24] extend the integrated importance measure to include semi-Markov processes, in order to analyze how the component state transitions affect the system performance. In addition, they propose a joint integrated importance measure to evaluate the impact of the maintenance between two related components on the system performance, in multiple states. Moreover, Dui et al. [25] also consider the cost of system maintenance. They propose a cost-based component maintenance importance measure in order to minimize the system maintenance costs. Zhang et al. [26] propose an importance-based maintenance priority model to guide the selection of preventive maintenance components, in order to minimize the expected maintenance cost of the system. These importance measure indicators are used in several fields, such as the electronics industry, aerospace and oil exploration [27,28,29], for example.
Although these studies have made some contributions to the reliability analysis and maintenance of the system, most of the studies on DRAS focus on the reliability analysis of each component, rather than analyzing the impact of the performance degradation of each component on the system reliability from the system level. Furthermore, due to the limitations of maintenance resources, the DRAS components cannot be simultaneously maintained. Therefore, it is necessary to determine the weak links of DRAS and pay attention to them in the maintenance process, in order to improve the reliability of the system during operation, and reduce the maintenance cost of the whole life cycle. These problems have not been solved in the existing studies of DRAS system. This paper first analyzes the performance degradation mechanism of the DRAS components. It then derives a component reliability calculation method based on performance degradation. Afterwards, it identifies the key components in the system. Finally, it proposes a system maintenance strategy based on importance measure.
The remainder of this paper is organized as follows. Section 2 introduces the performance degradation mechanism and reliability estimation method of the main components in the dissimilar redundancy actuation system. In Section 3, two importance measures based on reliability variations are introduced, and the relationship between them is derived. In Section 4, the importance measure index related to performance is used in the dissimilar redundancy actuation system, and the corresponding component maintenance priority strategy is proposed. Finally, the conclusions are drawn in Section 5.

2. Performance Degradation and Reliability Estimation

2.1. Analysis of the Causes of Component Performance Degradation

This section considers the DRAS composed of hydraulic actuator (HA) and electro-hydrostatic actuator (EHA) (cf. Figure 1). HA is composed of an electro-hydraulic servo valve and a hydraulic cylinder. The EHA consists of a motor, pump and hydraulic cylinder. The failure of motor winding, pump friction pair, valve core and actuator cylinder degrade the performance of the actuator system. Afterwards, the performance degradation causes and degradation indicators of the key components of DRAS, are analyzed.
(1)
Electro-hydraulic servo valve
The electro-hydraulic servo valve is very sensitive to oil pollution, because of its high precision. When the servo valve is constantly affected by the pollution particles in the high-pressure oil, the working edge of the valve core will be eroded and worn. In addition, the radial clearance of the spool and the valve sleeve will be subjected to friction and wear of particles having the same size as the radial clearance. Therefore, both edge wear and radial clearance wear lead to an increase in internal leakage and a decrease in pressure gain [30]. The pollution and wear of the oil have a high impact on the two performance indexes of internal leakage and pressure gain. Therefore, the internal leakage or pressure gain can be considered as performance degradation parameters of the electro-hydraulic servo valve pollution wear.
(2)
Hydraulic cylinder
Leakage is the main reason of hydraulic cylinder performance degradation. The friction and wear of reciprocating seal are the main reasons of leakage. Its internal failure mechanism is that under certain conditions, the corrosive components in the oil may react with the sealing material, which results in corrosive wear. Under the action of friction and reciprocating motion, the products of chemical reaction then fall off, which forms fine particles falling into the oil, and results in abrasive wear. Reciprocating seal friction and deformation produced by the oil extrusion, under the action of long-time reciprocating motion, will lead to fatigue wear. Simultaneously, under the action of reciprocating speed and friction, the temperature between the sealing pair increases, which leads to the bonding effect of the sealing material and the bonding wear. The wear of hydraulic reciprocating seal leads to the damage of the sealing part and the change of the sealing state, so that the performance of the reciprocating seal decreases, which has a negative effect on the normal function of the whole hydraulic cylinder [31]. Therefore, the leakage amount can be considered as the performance degradation parameter of the hydraulic cylinder.
(3)
Hydraulic pump
The wear type is the main failure mode and failure mechanism of hydraulic pump. The key friction pairs that affect the service life of the hydraulic pump are cylinder and oil pan friction pairs, plunger and cylinder hole friction pairs. The failure mechanism is that, when the hydraulic pump is working, the torque coefficient between the friction pairs increases, which makes the friction of the paired pair under the working load spectrum increases, and therefore the oil film between the friction pairs becomes thinner. Under the repeated action of this stress, the surface of a component between the hydraulic pump friction pair is worn off. This increases the movement gap of the hydraulic pump, and reduces the volumetric efficiency [32]. The external characteristics of the performance are mainly the pressure drop, exit flow reduction and return flow increase. Therefore, the pressure or flow rate can be considered as the performance degradation parameters of the hydraulic pump.
(4)
Motor
The main reason for motor performance degradation is the thermal aging of materials. The main reason for the latter is the effect of the temperature on motor windings. Due to the sudden change of temperature in a short time or long-term process, under high temperature environment, the insulation material of the motor winding has chemical changes. Therefore, the overall performance of the motor winding decreases. Thermal aging makes the fiber structure change and grain grow, and therefore the hardness, ductility and toughness of the material decrease. In addition, the wear of the rotor also leads to the vibration of the motor, which results in the degeneration and failure of the motor [33]. Therefore, the aging of motor winding insulation material and rotor wear, are the two main factors that affect the motor performance.

2.2. Reliability Estimation Based on IG Process

Based on performance degradation, the reliability evaluation of the system key components is performed in order to identify the weak links in the actuator system, so as to provide support for the reliability improvement and optimal design of the whole system. Afterwards, the reliability estimation method of each component of DRAS is introduced.
Assuming that the degradation process of each DRAS component follows the inverse Gaussian (IG) process, the probability density function (PDF) following the IG distribution can be expressed as:
f ( y | μ , σ ) = σ 2 π y 3 exp [ σ ( y μ ) 2 2 μ 2 y ] , y > 0 ,
where μ , σ are the two parameters of the IG distribution.
The cumulative density function (CDF) is then given by:
F ( y | μ , σ ) = Φ [ σ y ( y μ 1 ) ] + exp ( 2 σ μ ) Φ [ σ y ( y μ + 1 ) ] ,
where Φ ( ) is the CDF of the standard Gaussian distribution.
Assuming that Y i ( t ) represents the degradation path of component i, the IG process based on performance degradation has the following characteristics:
(1)
The degradation of component i at the initial time is given by Y i ( t ) = 0 ;
(2)
Y i ( t ) has independent increments;
(3)
The increment Δ Y i ( t ) = Y i ( t + Δ t ) Y i ( t ) follows the IG distribution.
When a linear degradation process is considered, the increment of component i can be expressed as:
Δ Y i ( t ) ~ I G ( μ i t , σ i t 2 ) .
Therefore, the PDF of the degradation path of component i is given by:
f i ( y i ( t ) | μ i t , σ i t 2 ) = σ i t 2 2 π y i 3 ( t ) exp [ σ i ( y i ( t ) μ i t ) 2 2 μ i 2 y i ( t ) ] .
Given the predetermined failure threshold D i of component i, the reliability of component i can be expressed as:
R i ( t | μ i t , σ i t 2 ) = Φ [ σ i D i ( D i μ i t ) ] + exp ( 2 σ i t μ i ) Φ [ σ i D i ( D i μ i + t ) ] .
The maximum likelihood estimation method is used to obtain the estimated values μ i and σ i of parameters μ i and σ i , respectively. The increment of degradation quantity follows Δ Y i ( t ) ~ I G ( μ i Δ t , σ i Δ t 2 ) , while the product degradation data is given by { y i j ; i = 1 , 2 , , n ; j = 1 , 2 , , m } . The likelihood function of the degradation model is then computed as:
L ( y i | μ i , σ i ) = i = 1 n j = 1 m σ i ( Δ t ) 2 2 π y i j i 3 exp [ σ i ( y i j i μ i Δ t ) 2 2 μ i 2 y i j i ] .
By considering the partial derivatives of the likelihood function L ( y i | μ i , σ i ) with respect to μ i and σ i and maximizing them, the likelihood equation can be obtained:
{ ln L ( y i | μ i , σ i ) μ i = 0 ln L ( y i | μ i , σ i ) σ i = 0 .
By solving the likelihood equation, the maximum likelihood estimators of μ i and σ i in the IG degradation model can be obtained:
μ i = 1 m n i = 1 n j = 1 m y i j i Δ t ,
σ i = 1 ( Δ t ) 2 m n i = 1 n j = 1 m ( 1 y i j i 1 μ i Δ t ) .
Therefore, the reliability of component i, whose performance degradation follows the IG process, varies with time:
R i ( t | μ i t , σ i t 2 ) = Φ [ σ i D i ( D i μ i t ) ] + exp ( 2 σ i t μ i ) Φ [ σ i D i ( D i μ i + t ) ] .

3. Analysis of Component Importance Change of DRAS

When DRAS has been operating for a certain period of time, it is important to consider the maintenance, which is performed throughout the life cycle of the system. The importance measure refers to the impact of the failure or state change of one or more components on the system reliability. This is a function of component reliability parameters and system structure. In the system maintenance phase, the importance measure is used to help the maintenance personnel identify the key components of the system, rationally allocate resources to the weak links, and improve the system reliability with the minimum life-cycle cost.
In this section, BIM and IIM of system reliability are introduced into the DRAS, so as to identify the system key components when the system performance decreases, determine the weak links of the system and pay more attention to them during maintenance, in order to improve the reliability of the whole life cycle of the system.

3.1. Introduction to BIM and IIM

BIM [19] is the foundation achievement of reliability importance measure theory. It defines the influence degree of component reliability change on system reliability change:
I ( B I M ) i ( t ) = R ( t ) R i ( t ) = P r ( ϕ ( X ( t ) ) = 1 ) P r ( X i ( t ) = 1 ) ,
where ϕ ( X ( t ) ) is the structure function of the system such that ϕ ( X ( t ) ) = ϕ ( X 1 ( t ) , X 2 ( t ) , , X n ( t ) ) , X i ( t ) represents the state of component i at time t, R ( t ) = P r ( ϕ ( X ( t ) ) = 1 ) denotes the reliability of the system at time t, and R i ( t ) = P r ( X i ( t ) = 1 ) is the reliability of component i at time t.
The IIM [22] considers the influence degree of component state distribution probability and state transition rate on system reliability. It can quantitatively analyze the influence degree of component reliability change with state transition on system reliability. The IIM of component i is given by:
I ( I I M ) i ( t ) = R ( t ) R i ( t ) R i ( t ) λ i ( t ) ,
where λ i ( t ) is the failure rate of component i at time t.
The IIM of component i represents the change of system reliability per unit time when component i fails. This is proved in the sequel.
Assuming that the system is composed of n components, the variation of system reliability per unit time is given by:
d R ( t ) d t = i = 1 n R ( t ) R i ( t ) d R i ( t ) d t ,
The change of reliability per unit time of component i is expressed as:
d R i ( t ) d t = d ( 1 F i ( t ) ) d t = d F i ( t ) d t = f i ( t ) ,
Therefore:
d R ( t ) d t = i = 1 n R ( t ) R i ( t ) d R i ( t ) d t = i = 1 n I ( B I M ) i ( t ) f i ( t ) ,
and:
λ i ( t ) = f i ( t ) R i ( t ) ,
Thus:
d R ( t ) d t = i = 1 n I ( B I M ) i ( t ) f i ( t ) = i = 1 n I ( I I M ) i ( t ) .
According to Equation (13), the change of system reliability in unit time is equal to the sum of IIM of n components at time t. By computing the relative values of BIM and IIM of each component in the system at a certain time, the ranking of the impact of each component on the system reliability can be obtained. This can provide a theoretical guidance for maintenance personnel.

3.2. Changes in BIM and IIM of Components in a Binary System

This section deals with the representation of BIM and IIM in a binary system. The binary representation of BIM is deduced as follows. When the system is running, that is, ϕ ( X ) = 1 , the BIM of component i is expressed as:
I r B I M ( i ; p ) = Pr { ϕ ( X ) = 1 | X i = 1 } Pr { ϕ ( X ) = 1 } ,
where p is the component reliability vector, ϕ ( X ) represents the system structure function, and X i denotes the state vector of component i.
When the system fails, that is, ϕ ( X ) = 0 , the BIM of component i is given by:
I f B I M ( i ; p ) = Pr { ϕ ( X ) = 0 | X i = 0 } Pr { ϕ ( X ) = 0 } ,
Therefore, the BIM of component i is defined as:
I B I M ( i ; p ) = I r B I M ( i ; p ) + I f B I M ( i ; p ) = Pr { ϕ ( X ) = 0 | X i = 0 } Pr { ϕ ( X ) = 0 | X i = 1 } , = Pr { ϕ ( X ) = 1 | X i = 1 } Pr { ϕ ( X ) = 1 | X i = 0 }
where I r B I M ( i ; p ) represents the maximum potential for system reliability improvement by improving the reliability of component i, and I f B I M ( i ; p ) denotes the importance of component i failure to system failure.
For n independent components, BIM can be expressed as the expectation of system performance changes before and after the failure of component i [18]:
I B I M ( i ; p ) = E ( ϕ ( 1 i , X ) ϕ ( 0 i , X ) ) = Pr { ϕ ( 1 i , X ) > ϕ ( 0 i , X ) } . = R ( 1 i , p ) R ( 0 i , p ) .
It is clear that 0 < I B I M ( i ; p ) < 1 for a coherent system with i = 1 , 2 , , n , and the reliability of each component is (0, 1). It can be seen from Equation (17) that the importance of component i to system reliability is determined by the increase of system reliability as component i improves.
The IIM of a binary system can be expressed as:
I i I I M = { R ( p = 1 | X i = 1 ) R ( p = 1 | X i = 0 ) } R ( X i = 1 ) λ i ,
Equation (18) expresses the mathematical expectation that changes in the reliability of component i lead to system reliability changes. The proof is given by:
R ( p = 1 ) = R ( X i = 1 ) R ( p = 1 | X i = 1 ) + R ( X i = 0 ) R ( p = 1 | X i = 0 ) = R ( X i = 1 ) R ( p = 1 | X i = 1 ) + ( 1 R ( X i = 1 ) ) R ( p = 1 | X i = 0 ) = R ( X i = 1 ) R ( p = 1 | X i = 1 ) R ( X i = 1 ) ) R ( p = 1 | X i = 0 ) + R ( p = 1 | X i = 0 )
The derivation of the reliability of component i can then be obtained:
R ( p = 1 ) R ( X i = 1 ) = R ( p = 1 | X i = 1 ) R ( p = 1 | X i = 0 ) ,
The reliability and failure rate of component i are R ( X i = 1 ) and λ i .
Therefore:
I i I I M = { R ( p = 1 | X i = 1 ) R ( p = 1 | X i = 0 ) } R ( X i = 1 ) λ i = { R ( 1 i , p ) R ( 0 i , p ) } R i λ i
It can be deduced from Equations (17) and (20) that BIM and IIM in a binary system, have the following relationship:
I i I I M = I i B I M R i λ i .
It can be seen from Equation (21) that IIM not only considers the influence of the component state distribution probability and component state transition probability on the system reliability, but also considers the reliability and failure rate of the component itself, which is an improvement of BIM.
By comparing BIM and IIM, the two importance measures can be applied to DRAS, in order to identify the weak links and pay attention to them in the maintenance process. This improves the reliability of the system’s life cycle.

4. Case Study for DRAS

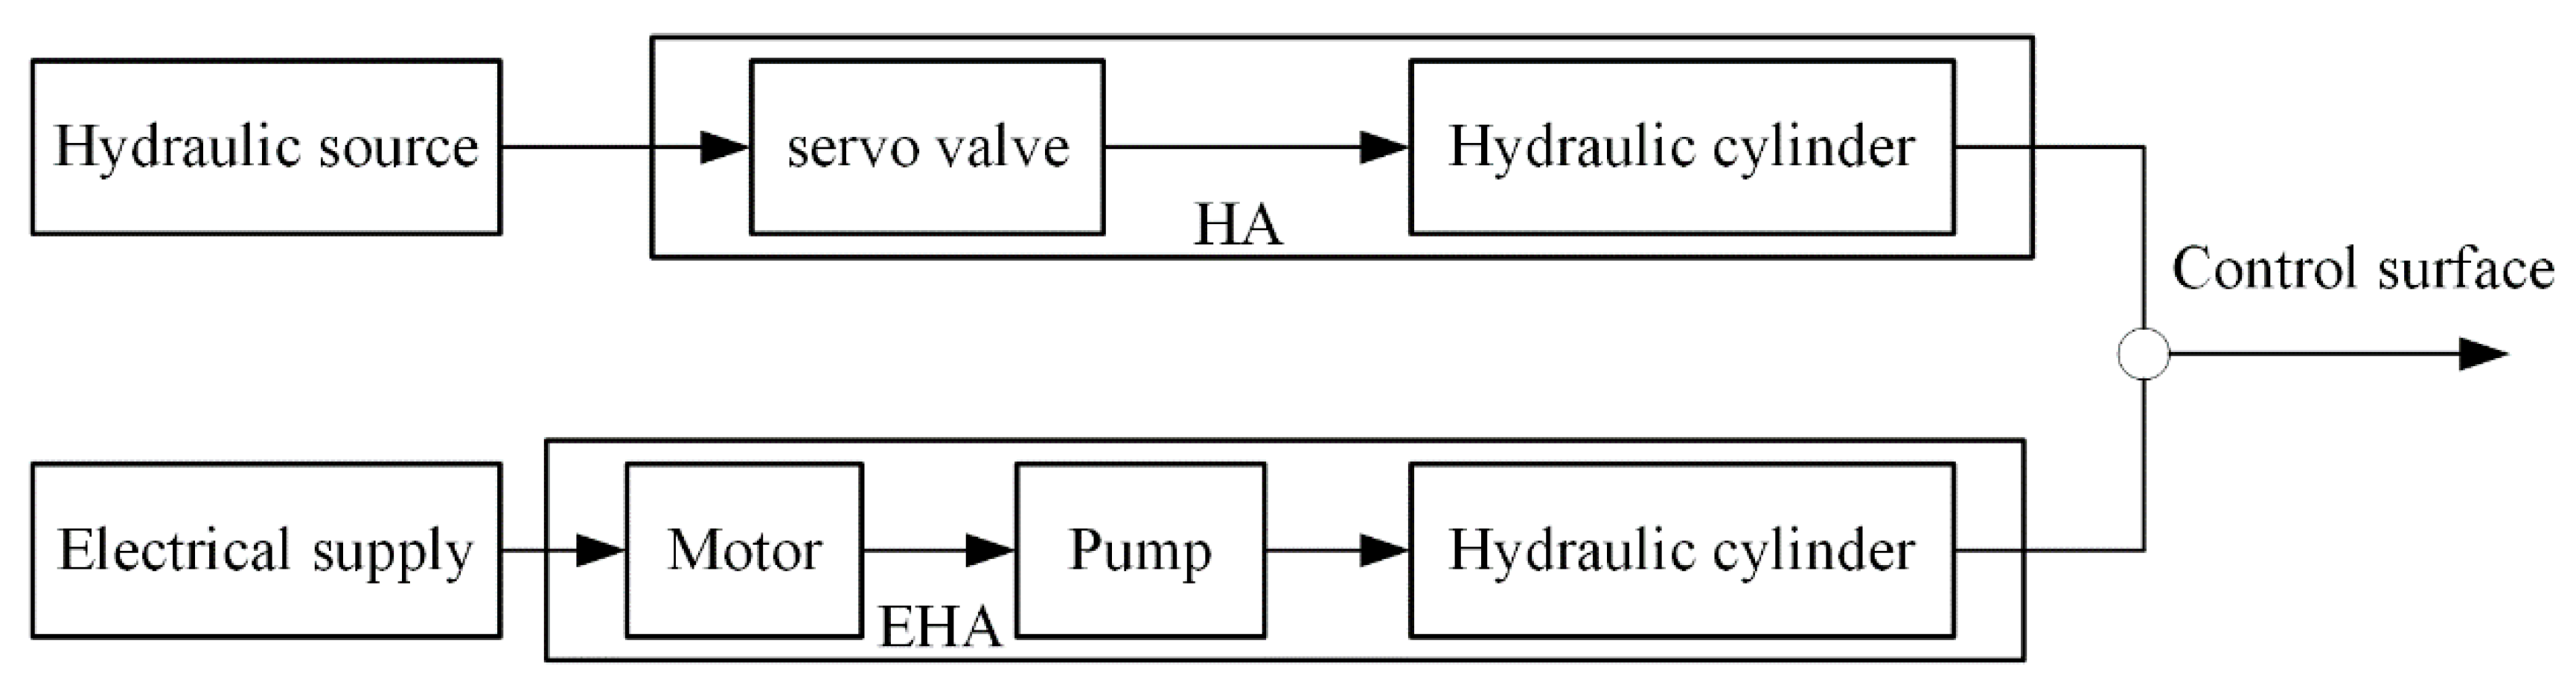
In this section, BIM and IIM are applied to DRAS. DRAS consists of a hydraulic actuation system (HAS) and an electro-hydrostatic actuation system (EHAS). The HAS uses a hydraulic source (HS) to move the control surface, while the EHAS uses an electrical supply (ES) to provide the motion force. The HAS is mainly composed of a servo valve and a hydraulic cylinder, while the main components of the EHAS are a motor, pump and hydraulic cylinder. The reliability of these components together determines the reliability of DRAS. The logic block diagram of DRAS is illustrated in Figure 2.
Fatigue and wear are inevitable due to the long time running of the components. They lead to the degradation of the performance of the components. It is assumed that the performance degradation of these components follows an IG process. It can be seen from Section 2 that the reliability of each component with time is affected by the drift parameter ( μ i ) and the variance coefficient ( σ i ). The degradation parameters and failure thresholds of the key components in DRAS are presented in Table 1, where some parameters are adopted from references [30,31,32,33] and others are based on typical and engineering experience values.
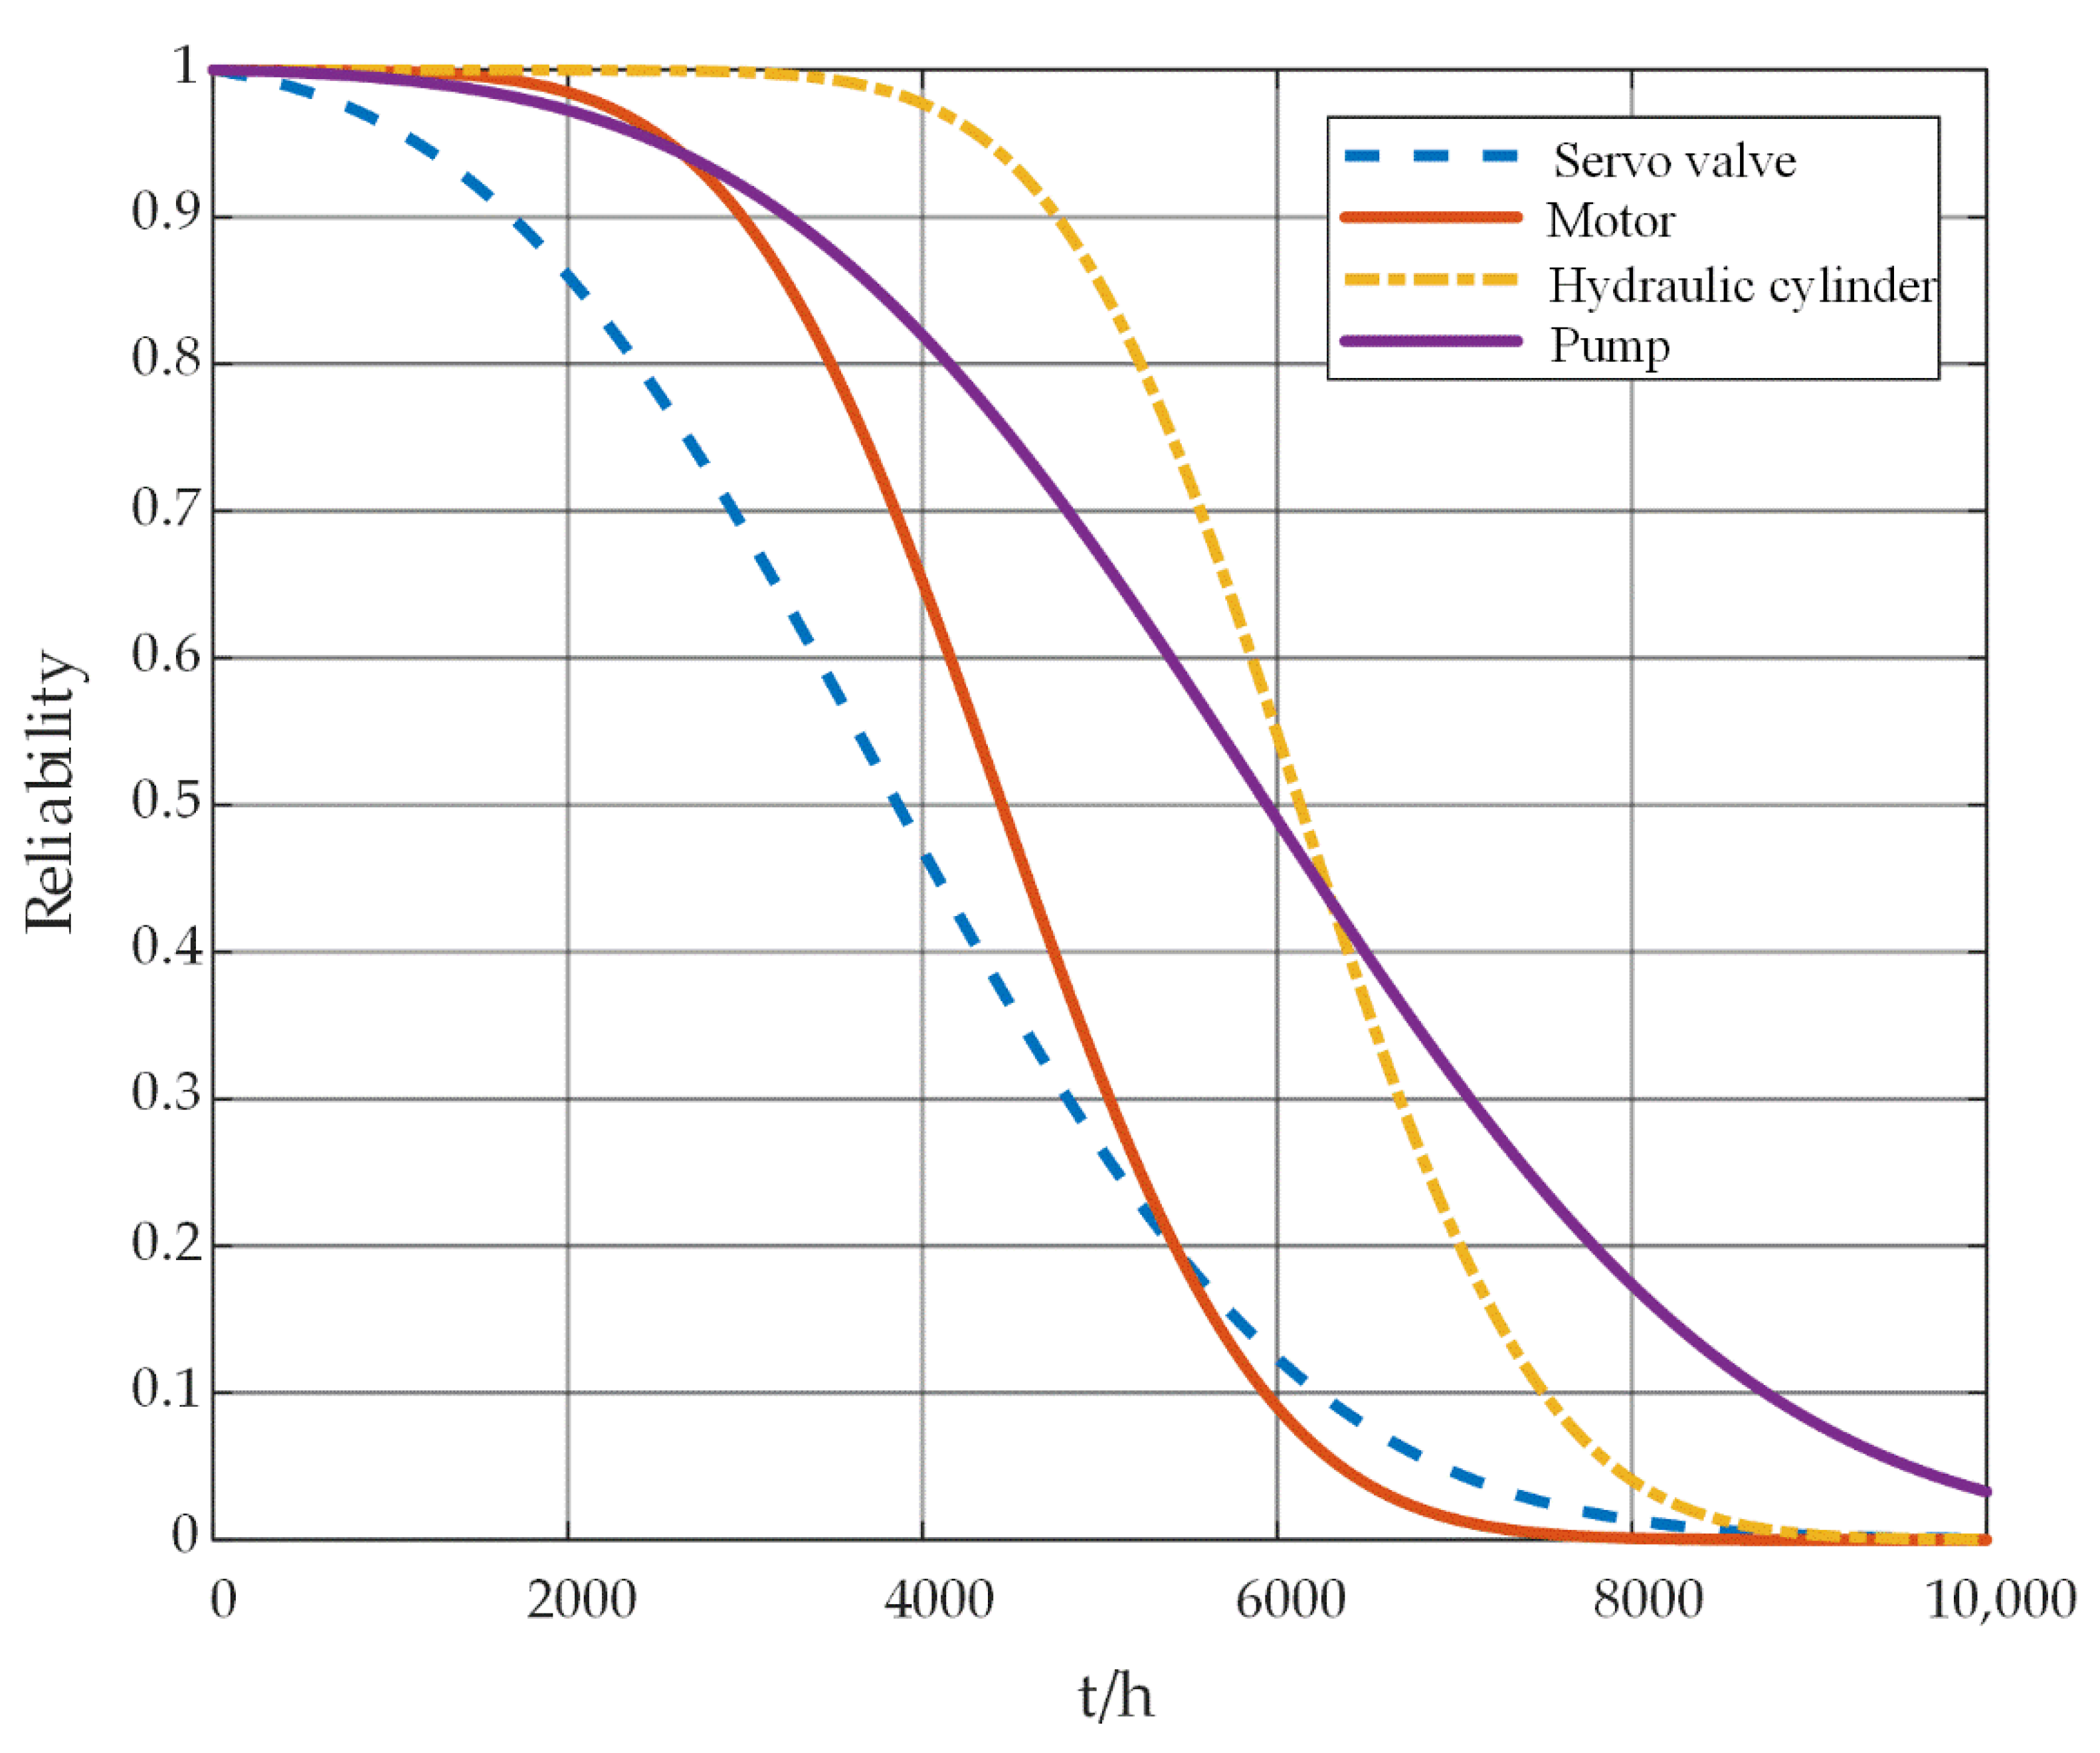
Through this analysis, the reliability of the key components in DRAS is obtained over time (cf. Figure 3).
Figure 3 presents the reliability of the key components in DRAS over time. It can be seen that the reliability of each component is very high at the beginning. However, after a certain time of operation, the reliability of each component gradually decreases, and it is basically 0 at almost 8000 h. In addition, it can be deduced that the reliability of the servo valve is relatively low, while that of the hydraulic cylinder is relatively high. In general, when the reliability of a component is in the range of 0.55 to 0.65, it indicates that the component has a higher risk of failure. However, the maintenance of the DRAS is a decision made by comprehensively considering the conditions of each key component, so the maintenance time of the system is not simply determined by the reliability safety value of a certain component. Based on the derivation process of BIM and IIM in Section 3, the BIM and IIM calculation equations of each component can be obtained. According to the logic block diagram in Figure 2, the reliability function of the system is given by:
R S ( t ) = 1 ( 1 R A ( t ) R C ( t ) ) ( 1 R B ( t ) R D ( t ) R C ( t ) ) = R A ( t ) R C ( t ) + R B ( t ) R D ( t ) R C ( t ) R A ( t ) R B ( t ) R D ( t ) R C 2 ( t )
Therefore, the BIM of each component is expressed:
I ( B I M ) A ( t ) = R S ( t ) R A ( t ) = R C ( t ) ( 1 R B ( t ) R D ( t ) R C ( t ) ) , I ( B I M ) B ( t ) = R S ( t ) R B ( t ) = R D ( t ) R C ( t ) ( 1 R A ( t ) R C ( t ) ) , I ( B I M ) C ( t ) = R S ( t ) R C ( t ) = R A ( t ) + R B ( t ) R D ( t ) 2 R A ( t ) R B ( t ) R C ( t ) R D ( t ) , I ( B I M ) D ( t ) = R S ( t ) R D ( t ) = R B ( t ) R C ( t ) ( 1 R A ( t ) R C ( t ) ) .
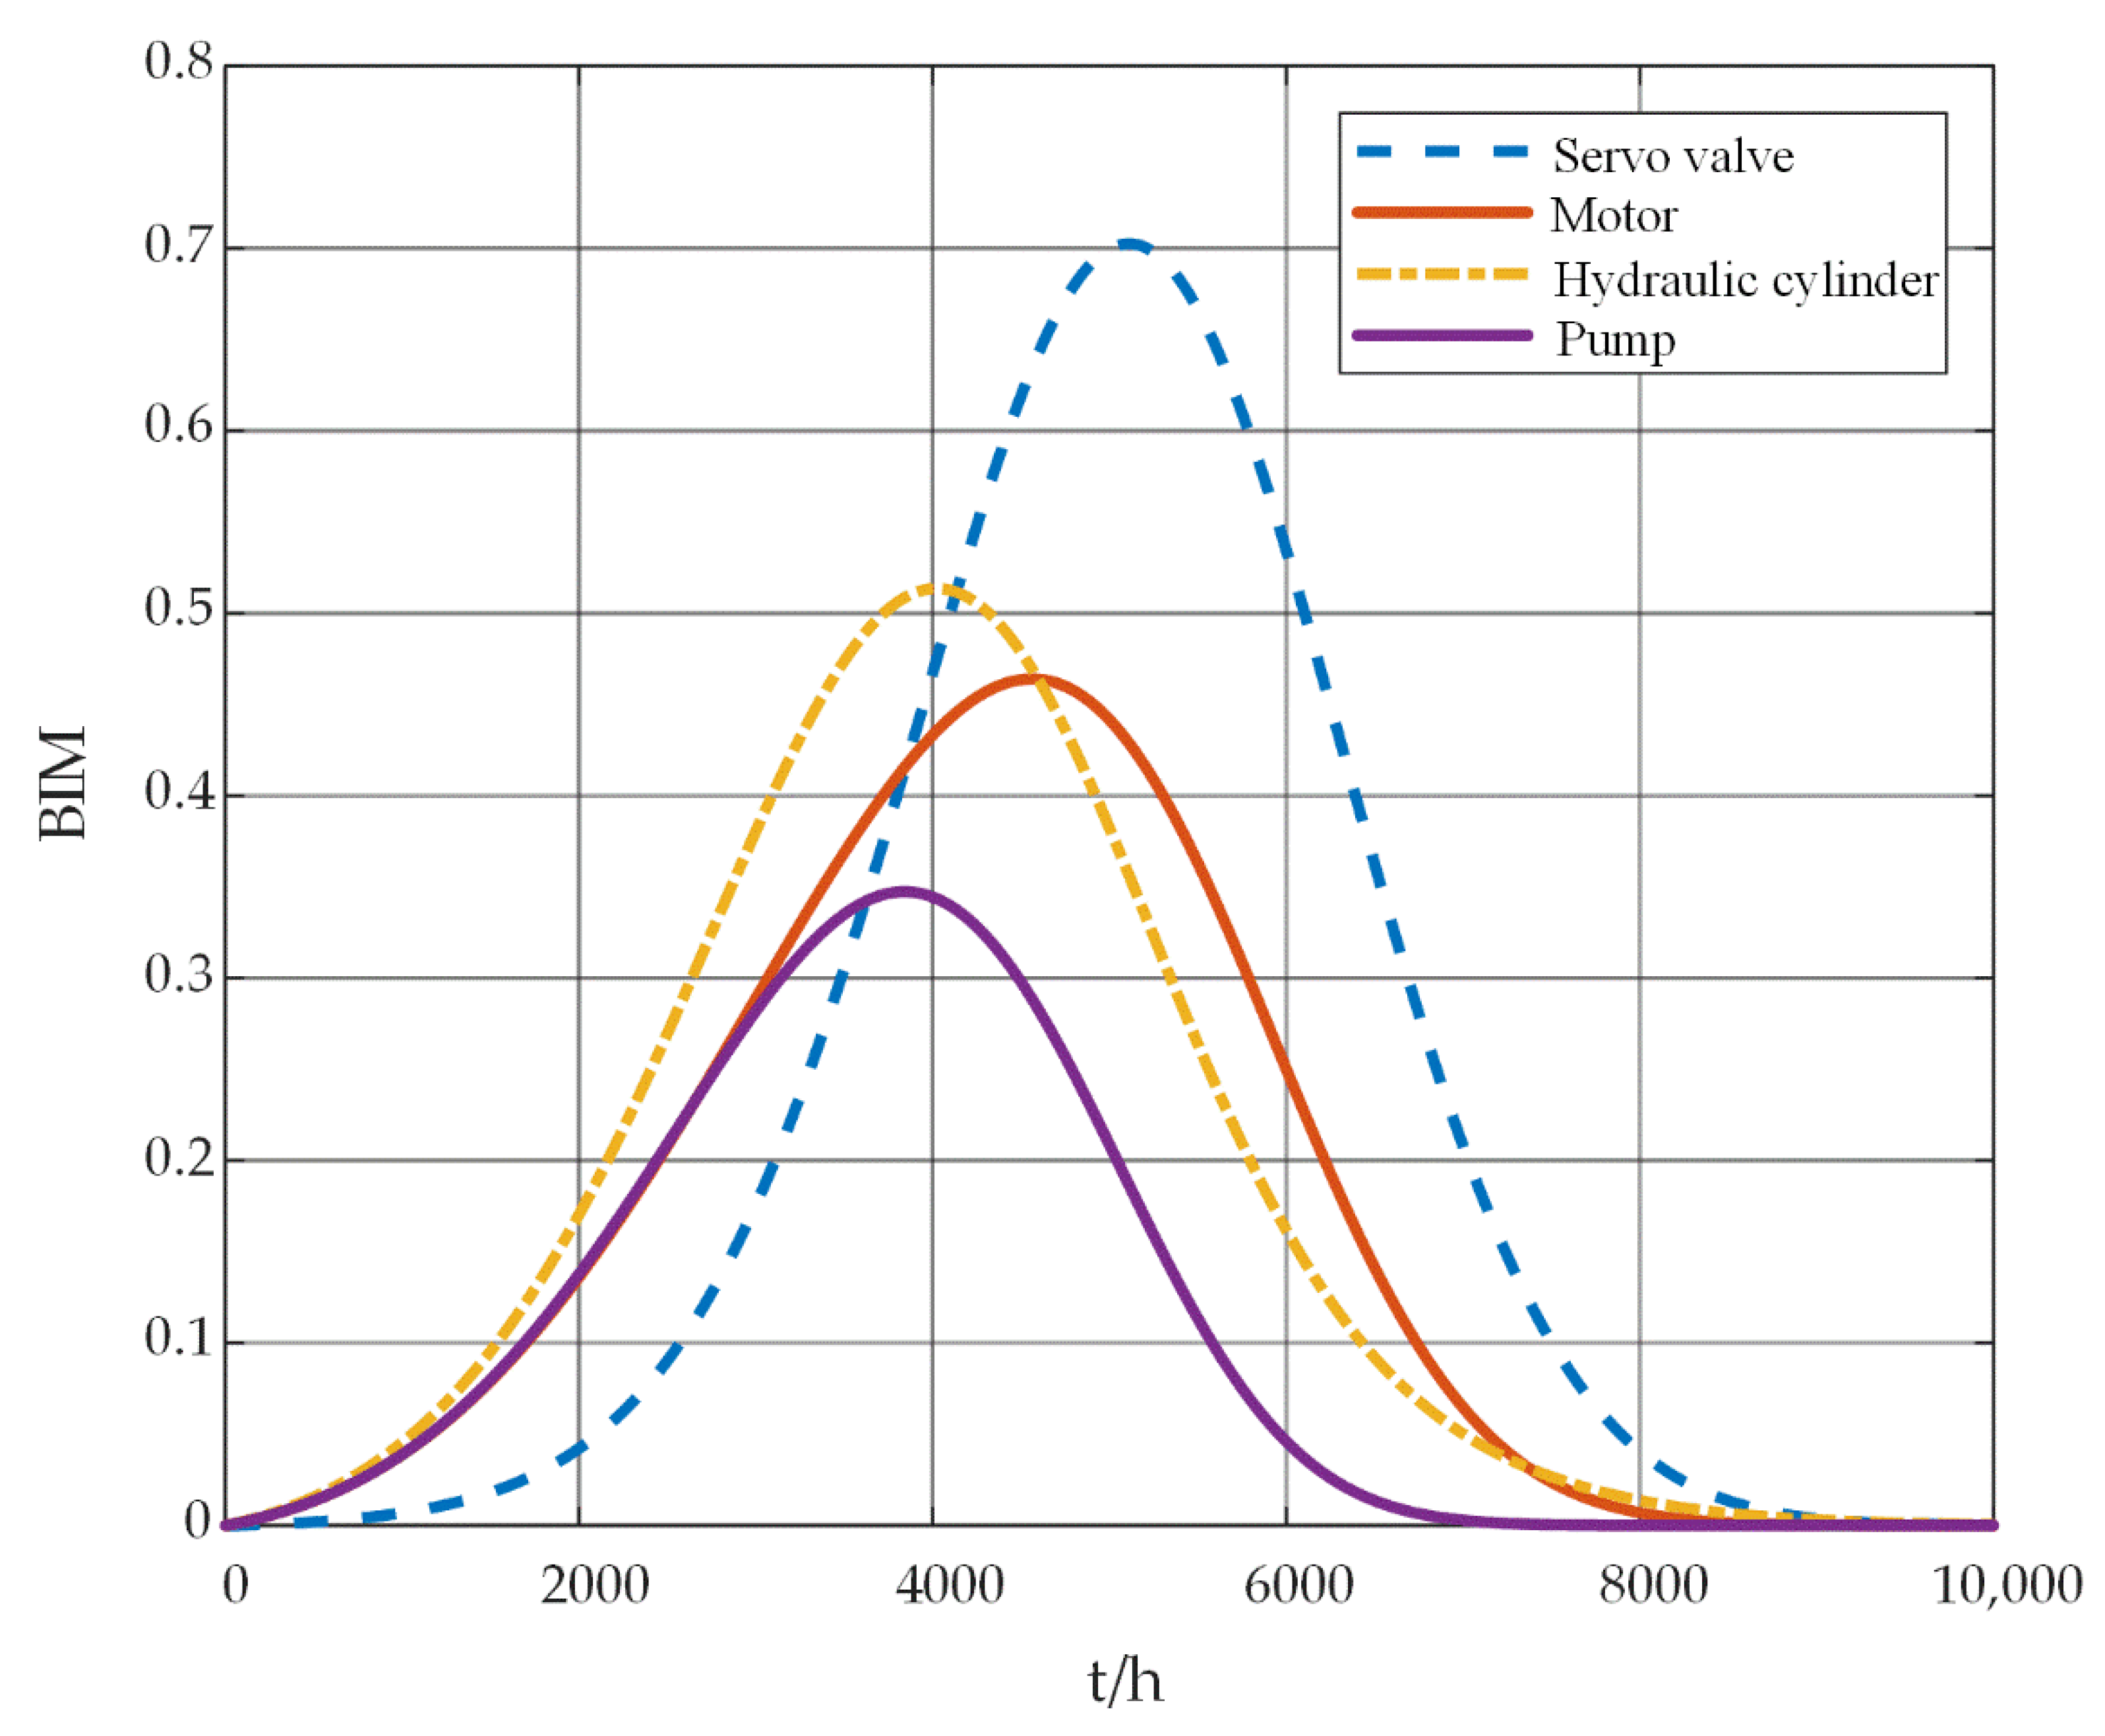
Based on these formulas, the change of BIM value of each component with time can be obtained (cf. Figure 4).
Figure 4 presents how the BIM values of each component change over time. It can be seen that the BIM value of the components increases first, and then decreases with time. This is because the reliability of each component is too high in the beginning, which means that the importance measure of each component is low. As the system runs, the performance of each component decreases, its reliability decreases, and its importance gradually increases. In the later stage, the reliability of each component is very low. Consequently, the change rate of reliability of each component tends to 0. Therefore, the BIM value also tends to 0. It can be seen from Figure 4 that BIM for the four components are hydraulic cylinders, servo valve, motor and pump, when the system is running for 4000 h. The BIM value of hydraulic cylinder is large due to the fact that hydraulic cylinders exist in both HAS and EHAS. When the hydraulic cylinder fails, the dissimilar redundancy driving control surface is affected, which results in DRAS failure. Therefore, the BIM value of the hydraulic cylinder is high. The reason for the higher BIM value of the servo valve is that the reliability of the servo valve is relatively low compared with other components (cf. Figure 3). Thus, the importance of the servo valve is relatively high. Therefore, the hydraulic cylinder and servo valve have relatively large BIM values.
The IIM calculation of each component in the DRAS is given by:
I ( I I M ) A ( t ) = [ R C ( t ) ( 1 R B ( t ) R D ( t ) R C ( t ) ) ] R A ( t ) λ A ( t ) , I ( I I M ) B ( t ) = [ R D ( t ) R C ( t ) ( 1 R A ( t ) R C ( t ) ) ] R B ( t ) λ B ( t ) , I ( I I M ) C ( t ) = [ R A ( t ) + R B ( t ) R D ( t ) 2 R A ( t ) R B ( t ) R C ( t ) R D ( t ) ] R C ( t ) λ C ( t ) , I ( I I M ) D ( t ) = [ R B ( t ) R C ( t ) ( 1 R A ( t ) R C ( t ) ) ] R D ( t ) λ D ( t ) ,
And the failure rate of component i is expressed as:
λ i ( t ) = d F i ( t ) / d t R i ( t ) = d ( 1 R i ( t ) ) / d t R i ( t ) ,
Therefore, the IIM value of each component changes over time, as shown in Figure 5.
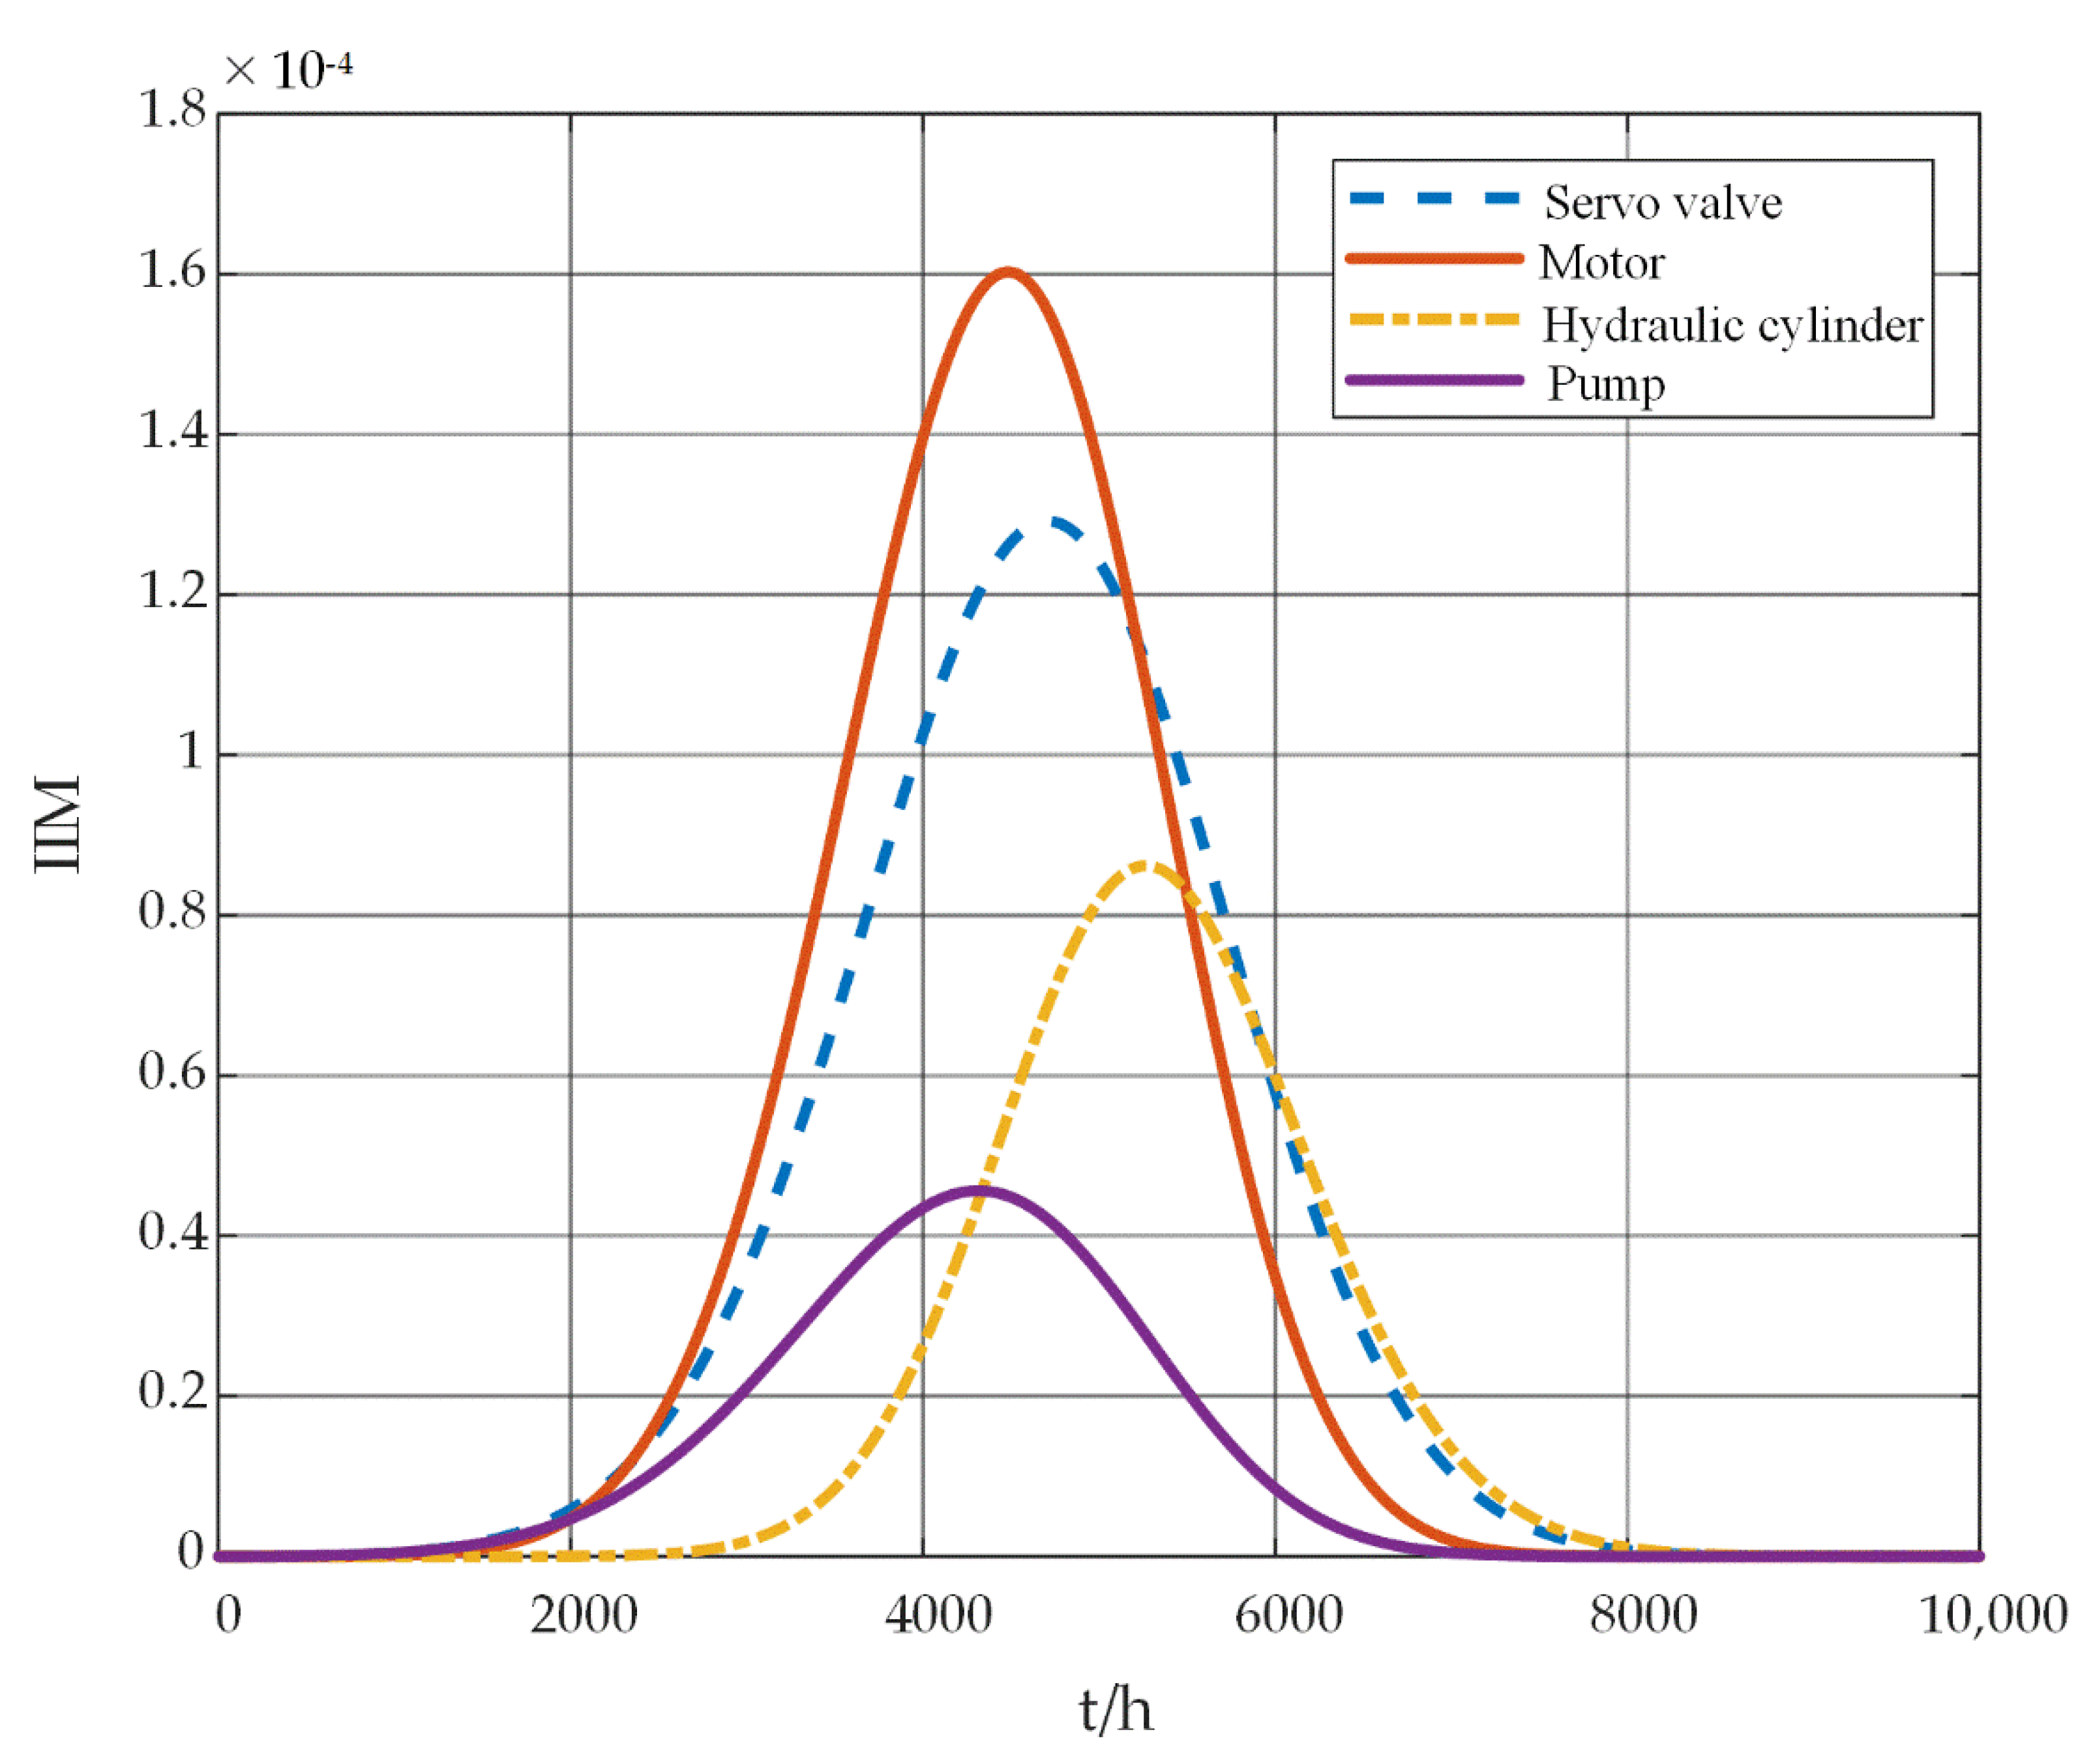
Figure 5 presents the change of IIM value of each component with time. It can be seen that the IIM value of each component first increases, and then decreases with time. This is because the reliability of each component is high, and the failure rate is low at the beginning. With the operation of the system, the reliability of each component decreases and the failure rate increases, and therefore the importance of each component increases. In the final period, the change rate of the reliability of each component tends to 0, and the importance of each component also tends to 0 after almost 8000 h. It can be seen from Figure 5 that after 4000 h of operation, the IIM of each component is in order of motor, servo valve, pump and hydraulic cylinder. The reason for the large IIM value of the motor is that IIM considers the failure rate of each component. Therefore, the high IIM value of the motor may be due to the fact that the failure rate of the motor is higher than that of other hydraulic components, and therefore the IIM of the motor is larger. The IIM value of the hydraulic cylinder is lower at 4000 h, because the IIM is also related to the reliability of the component at the corresponding moment. It can be seen from Figure 3 that the reliability of the hydraulic cylinder is relatively high compared to other components. Therefore, the reliability change rate of the hydraulic cylinder is relatively low compared to the system, and thus its IIM value is low. The criticality of the components at a certain moment can be determined by sorting the IIM value of each component, which provides a theoretical support for the maintenance strategy of the DRAS.
The sequence of component IIM values are selected when the system is running for 4500 h and 5500 h. They are then compared with BIM.
Table 2 presents the ranking and comparison of BIM and IIM values of each component in 4500 h. It can be seen that at 4500 h, the BIM value components are in the order of importance of the servo valve, hydraulic cylinder, motor and pump, while the IIM value components are in the order of importance of motor, servo valve, hydraulic cylinder and pump. It can also be deduced that IIM considers the failure rate of each component, because the failure rate of the motor is higher than that of other hydraulic components. Therefore, the motor ranks first in the ranking of IIM values. The order of the other components is similar to that of the BIM value.
Table 3 presents the ranking and comparison of BIM and IIM values of each component in 5500 h. It can be seen that the importance of BIM value components at 5500 h is the servo valve, motor, hydraulic cylinder and pump. The importance of the IIM value components is the servo valve, hydraulic cylinder, motor and pump. It can be seen that the IIM values of the motor and the hydraulic cylinder are very close at 5500 h. Therefore, it is mainly similar to the order of the components in the BIM value. BIM and IIM are two different importance measures. Therefore, they have different priorities and consider different physical quantities. Consequently, it is understandable that the order of the other moments is not the same.
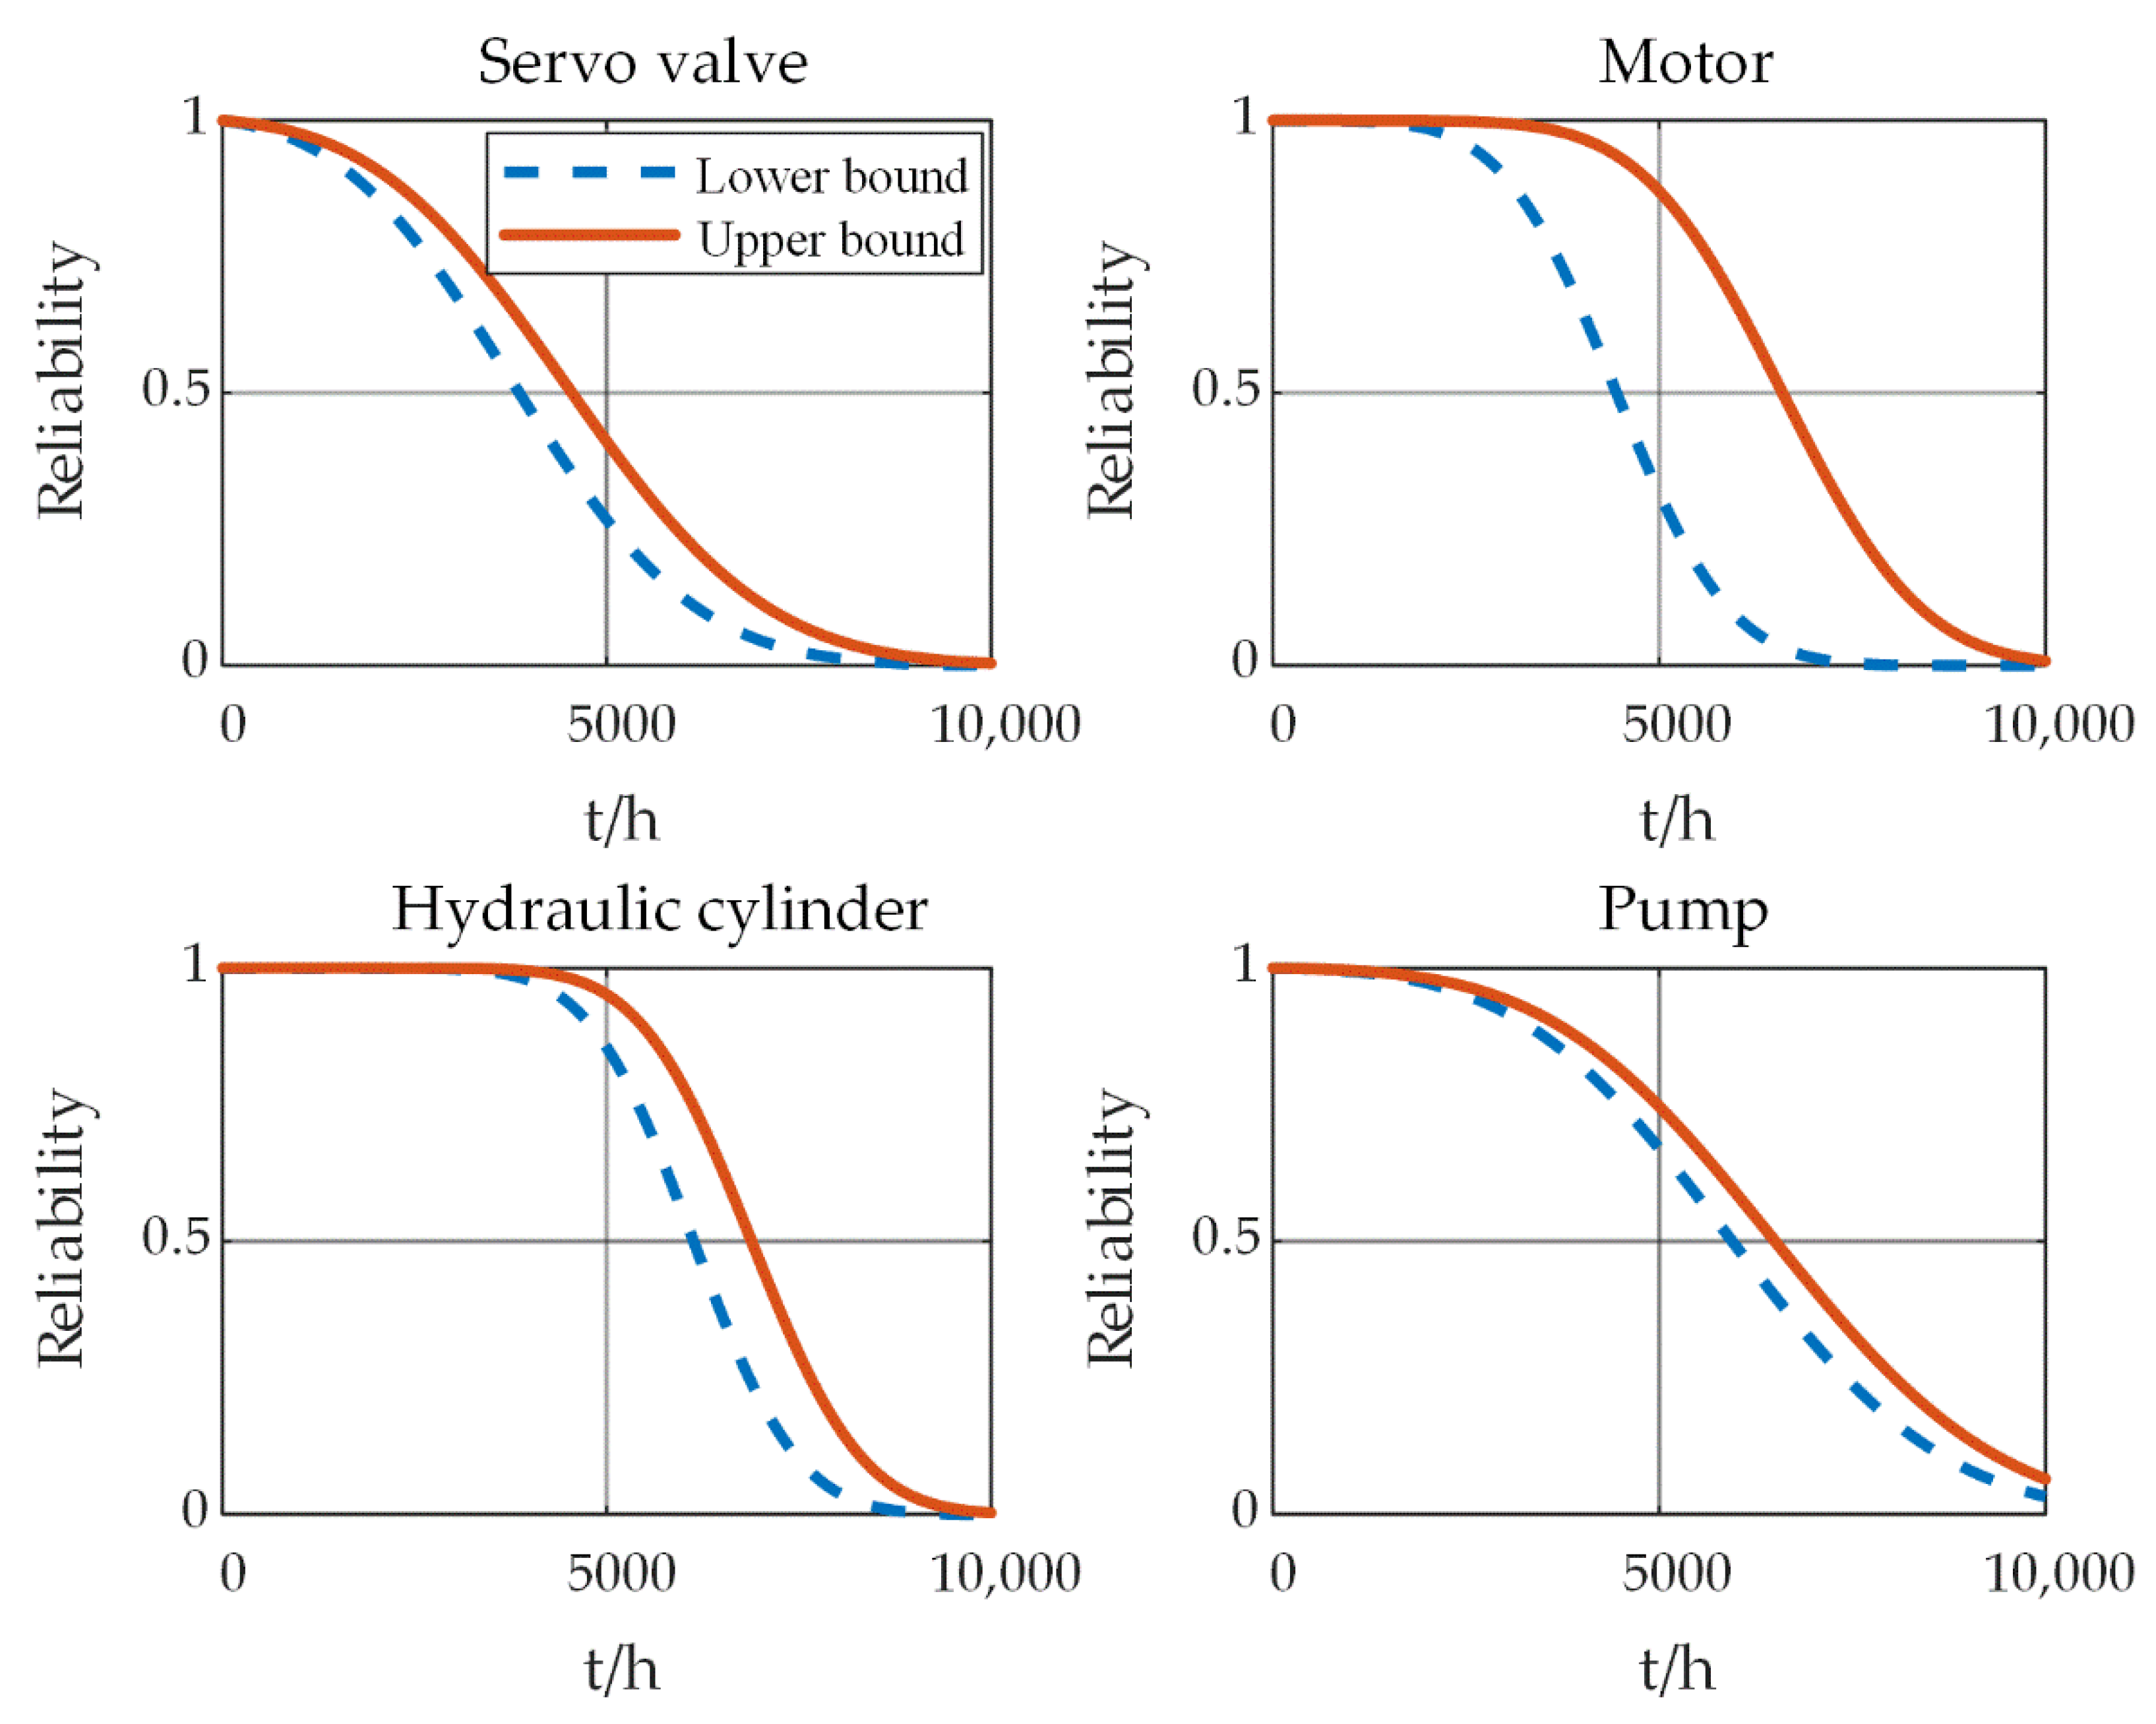
Figure 6 presents the upper bound and lower bound of system reliability changes, that are caused by the upper and lower bounds of component failure thresholds. It can be seen that the system reliability changes with time. As the reliability of the system decreases over time, a preventive maintenance should be timely performed. As can be seen from Figure 6, the fault threshold interval of the motor has a great influence on its reliability. With the operation of the system, the reliability of the servo valve degrades faster, so its maintenance frequency needs to be increased, while the reliability of the hydraulic cylinder degrades relatively slowly, so its maintenance frequency can be relatively low. In general, when the reliability of a component is in the range of 0.55 to 0.65, it means that the component has a high risk of failure. However, the maintenance of the system is a decision made by comprehensively considering the conditions of each key component, so the maintenance time of the system is not simply determined by the reliability safety value of a certain component. In this case, the BIM and IIM methods can be used to identify the key components of the system at different times, in order to improve the reliability of the whole life cycle of the system, and reduce its maintenance cost.
In this paper, the reliability of key components in DRAS is modeled based on IG process. In addition, BIM and IIM are utilized to identify the weak links of the DRAS so that resources can be appropriately allocated to the weak links during maintenance. The proposed method can provide theoretical basis and practical application for the identification of key components and system maintenance under resource constraints. Reference [24] uses joint integrated importance measure to identify key components in aircraft warning system and guide its maintenance, and the results shown are similar to this paper.

5. Conclusions

This paper introduces the composition of a dissimilar redundancy actuation system, and analyzes the failure mechanism of the key components in the system. Based on the failure mechanism of components, it is assumed that the degradation process of each component follows the IG process. The reliability calculation formula of the component in the IG process is then deduced, and the parameters in the reliability are estimated. The results show that the reliability of the servo valve degrades faster, so its maintenance frequency needs to be increased, while the reliability of the hydraulic cylinder degrades relatively slowly, so its maintenance frequency can be relatively low. Afterwards, the BIM and IIM based on the system reliability change are introduced. In addition, the derivation process of BIM and IIM based on the relationship between them, is introduced. Moreover, the two importance measures are applied to the DRAS in order to identify the key components at different times, and provide a theoretical guidance for the system maintenance decision. The results demonstrate that BIM and IIM are coherent in identifying the DRAS key components in some moments. This indicates that BIM and IIM are two efficient methods for component importance identification and system reliability analysis. BIM and IIM can provide a technical support for subsequent maintenance personnel, and increase system reliability with a minimum life cycle cost.

Author Contributions

Conceptualization, Y.Z.; methodology, Y.Z.; software, Y.Z.; validation, C.Z. and R.C.; formal analysis, C.Z. and R.C.; investigation, Y.Z., S.W. and C.Z.; writing—original draft preparation, Y.Z.; writing—review and editing, C.Z.; visualization, Y.Z., S.W. and M.M.T.; project administration, S.W. All authors have read and agreed to the published version of the manuscript.

Funding

This research was funded in part by the National Key Research and Development Program of China (Grant No. 2019YFB2004504), the National Natural Science Foundation of China (Grant No. 51875015, 51620105010, 51675019), the Aviation Science Foundation (Grant No. 201902051001), the Program of China Scholarship Council (No. 202106020106) and Program 111 of China.

Institutional Review Board Statement

Not applicable.

Informed Consent Statement

Not applicable.

Data Availability Statement

Not applicable.

Conflicts of Interest

The authors declare no conflict of interest.

References

  1. Xu, J.; Luo, N.; Yang, Y.; Han, P.; Zhang, D. Reliability analysis for the hydraulic booster control surface of aircraft. J. Aircr. 2017, 54, 456–463. [Google Scholar] [CrossRef]
  2. Li, Z.; Shang, Y.; Jiao, Z.; Lin, Y.; Wu, S.; Li, X. Analysis of the dynamic performance of an electro-hydrostatic actuator and improvement methods. Chin. J. Aeronaut. 2018, 31, 2312–2320. [Google Scholar] [CrossRef]
  3. Jiao, Z.; Bo, Y.; Wu, S.; Shang, Y.; Huang, H.; Tang, Z.; Wei, R.; Li, C. An intelligent design method for actuation system architecture optimization for more electrical aircraft. Aerosp. Sci. Technol. 2019, 93, 105079. [Google Scholar] [CrossRef]
  4. Ijaz, S.; Yan, L.; Hamayun, M.; Shi, C. Active fault tolerant control scheme for aircraft with dissimilar redundant actuation system subject to hydraulic failure. J. Frankl. Inst. 2019, 356, 1302–1332. [Google Scholar] [CrossRef]
  5. Wang, S.; Cui, X.; Shi, J.; Tomovic, M.M.; Jiao, Z. Modeling of reliability and performance assessment of a dissimilar redundancy actuation system with failure monitoring. Chin. J. Aeronaut. 2016, 29, 799–813. [Google Scholar] [CrossRef] [Green Version]
  6. Pan, J.; Khajepour, A.; Li, Y.; Yang, J.; Liu, W. Performance and power consumption optimization of a hydraulic variable valve actuation system. Mechatronics 2021, 73, 102479. [Google Scholar] [CrossRef]
  7. Navatha, A.; Bellad, K.; Hiremath, S.; Karunanidhi, S. Dynamic Analysis of Electro Hydrostatic Actuation System. Procedia Technol. 2016, 25, 1289–1296. [Google Scholar] [CrossRef] [Green Version]
  8. Shi, C.; Wang, X.; Wang, S.; Wang, J.; Tomovic, M.M. Adaptive decoupling synchronous control of dissimilar redundant actuation system for large civil aircraft. Aerosp. Sci. Technol. 2015, 47, 114–124. [Google Scholar] [CrossRef]
  9. Ibsen, A. The politics of airplane production: The emergence of two technological frames in the competition between Boeing and Airbus. Technol. Soc. 2009, 31, 342–349. [Google Scholar] [CrossRef]
  10. Cai, B.; Liu, Y.; Liu, Z.; Tian, X.; Dong, X.; Yu, S. Using Bayesian networks in reliability evaluation for subsea blowout preventer control system. Reliab. Eng. Syst. Saf. 2012, 108, 32–41. [Google Scholar] [CrossRef]
  11. Cai, B.; Liu, Y.; Liu, Z.; Tian, X.; Zhang, Y.; Ji, R. Application of Bayesian Networks in Quantitative Risk Assessment of Subsea Blowout Preventer Operations. Risk Anal. 2013, 33, 1293–1311. [Google Scholar] [CrossRef] [PubMed]
  12. Zhu, P.; Lv, R.; Guo, Y.; Si, S. Optimal Design of Redundant Structures by Incorporating Various Costs. IEEE Trans. Reliab. 2018, 67, 1084–1095. [Google Scholar] [CrossRef]
  13. Zhu, P.; Zhi, Q.; Wang, Z.; Guo, Y. Stochastic Analysis and Optimal Design of Majority Systems. IEEE Trans. Circuits Syst. II Express Briefs 2019, 66, 131–135. [Google Scholar] [CrossRef]
  14. Zhang, T.; Liu, X. Reliability Design for Impact Vibration of Hydraulic Pressure Pipeline Systems. Chin. J. Mech. Eng. 2013, 26, 1050–1055. [Google Scholar] [CrossRef]
  15. Rykov, V.; Kochueva, O.; Rykov, Y. Preventive Maintenance of k-out-of-n System with Respect to Cost-Type Criterion. Mathematics 2021, 9, 2798. [Google Scholar] [CrossRef]
  16. Miziula, P.; Navarro, J. Birnbaum importance measure for reliability systems with dependent components. IEEE Trans. Reliab. 2019, 68, 439–450. [Google Scholar] [CrossRef]
  17. Xing, L.; Zhao, G.; Wang, Y.; Xiang, Y. Reliability modeling of correlated competitions and dependent components with random failure propagation time. Qual. Reliab. Eng. Int. 2020, 36, 947–964. [Google Scholar] [CrossRef]
  18. Taeyong, K.; Song, J. Generalized Reliability Importance Measure (GRIM) using Gaussian mixture. Reliab. Eng. Syst. Saf. 2018, 173, 105–115. [Google Scholar] [CrossRef]
  19. Birnbaum, Z.W. On the Importance of Different Components in a Multi-Component System; Academic Press: New York, NY, USA, 1969; pp. 581–592. [Google Scholar]
  20. Griffith, W.S. Multi-state reliability models. Adv. Appl. Probab. 1980, 17, 735–744. [Google Scholar] [CrossRef]
  21. Wu, S.; Chan, L. Performance utility-analysis of multi-state systems. IEEE Trans. Reliab. 2003, 52, 14–21. [Google Scholar] [CrossRef] [Green Version]
  22. Si, S.; Dui, H.; Zhao, X.; Zhang, S.; Sun, S. Integrated importance measure of component states based on loss of system performance. IEEE Trans. Reliab. 2012, 61, 192–202. [Google Scholar] [CrossRef]
  23. Dui, H.; Si, S.; Zuo, M.; Sun, S. Semi-Markov Process-Based Integrated Importance Measure for Multi-State Systems. IEEE Trans. Reliab. 2015, 64, 754–765. [Google Scholar] [CrossRef]
  24. Dui, H.; Li, S.; Xing, L.; Liu, H. System performance-based joint importance analysis guided maintenance for repairable systems. Reliab. Eng. Syst. Saf. 2019, 186, 162–175. [Google Scholar] [CrossRef]
  25. Dui, H.; Si, S.; Yam, R. A cost-based integrated importance measure of system components for preventive maintenance. Reliab. Eng. Syst. Saf. 2017, 168, 98–104. [Google Scholar] [CrossRef]
  26. Zhang, C.; Zhang, Y.; Dui, H. Importance measure-based maintenance strategy considering maintenance costs. Eksploatacja Niezawodnosc—Maint. Reliab. 2022, 24, 15–24. [Google Scholar] [CrossRef]
  27. Borgonovo, E.; Aliee, H.; Glaβ, M.; Teich, J. A new time-independent reliability importance measure. Eur. J. Oper. Res. 2016, 254, 427–442. [Google Scholar] [CrossRef]
  28. Pei, Y.; Wang, W.; Li, L. Ranking the Vulnerable Components of Aircraft by Considering Performance Degradations. J. Aircr. 2016, 53, 1400–1410. [Google Scholar] [CrossRef] [Green Version]
  29. Natvig, B.; Eide, K.; Gasemyr, J.; Huseby, A.B.; Isaksen, S.L. Simulation based analysis and an application to an offshore oil and gas production system of the Natvig measures of component importance in repairable systems. Reliab. Eng. Syst. Saf. 2009, 94, 1629–1638. [Google Scholar] [CrossRef]
  30. Zhang, K.; Yao, J.; Jiang, T. Degradation assessment and life prediction of electro-hydraulic servo valve under erosion wear. Eng. Fail. Anal. 2014, 36, 284–300. [Google Scholar] [CrossRef]
  31. Zhao, X.; Zhang, S.; Zhou, C.; Hu, Z.; Li, R.; Jiang, J. Experimental study of hydraulic cylinder leakage and fault feature extraction based on wavelet packet analysis. Comput. Fluids 2015, 106, 33–40. [Google Scholar] [CrossRef]
  32. Mahankar, P.; Dhoble, A. Review of hydraulic seal failures due to effect of medium to high temperature. Eng. Fail. Anal. 2021, 127, 105552. [Google Scholar] [CrossRef]
  33. Otava, L.; Graf, M.; Buchta, L. Interior Permanent Magnet Synchronous Motor Stator Winding Fault Modelling. IFAC-PapersOnLine 2015, 48, 324–329. [Google Scholar] [CrossRef]
Figure 1. Dissimilar redundancy actuation system.
Mathematics 10 00843 g001
Figure 2. Logic block diagram of DRAS.
Mathematics 10 00843 g002
Figure 3. Reliability changes over time.
Mathematics 10 00843 g003
Figure 4. BIM values of the key components in the DRAS change over time.
Mathematics 10 00843 g004
Figure 5. IIM values of the key components in the DRAS change over time.
Mathematics 10 00843 g005
Figure 6. Component reliability considering the upper and lower bounds of failure threshold.
Mathematics 10 00843 g006
Table 1. IG distribution parameter values of several components.
ComponentsCode μ i σ i D i
Servo valveA 7.42 × 10 3 6.45 × 10 6 [25,30]
MotorB 2.33 × 10 3 7.15 × 10 6 [10,15]
Hydraulic cylinderC 6.63 × 10 3 3.41 × 10 5 [40,45]
PumpD 9.07 × 10 3 9.63 × 10 6 [50,55]
Table 2. BIM and IIM comparison at 4500 h.
Component Type
Method
Servo ValveMotorHydraulic CylinderPump
BIM
Ranking
0.620
1
0.464
3
0.478
2
0.298
4
IIM
Ranking
1.27 × 10 4
2
1.60 × 10 4
1
5.66 × 10 5
3
4.48 × 10 5
4
Table 3. BIM and IIM comparison at 5500 h.
Component Type
Method
Servo ValveMotorHydraulic CylinderPump
BIM
Ranking
0.662
1
0.366
2
0.269
3
0.114
4
IIM
Ranking
9.49 × 10 5
1
8.25 × 10 5
3
8.29 × 10 5
2
2.04 × 10 5
4
Publisher’s Note: MDPI stays neutral with regard to jurisdictional claims in published maps and institutional affiliations.

