Abstract
A piecewise linear dynamical model is proposed for a stock price. The model considers the price is driven by three rather standard demand components: chartist, fundamental and market makers. The chartist demand component is related to the study of differences between moving averages. This generates a high order system characterized by a piecewise linear map not trivial to study. The model has been studied analytically in its fixed points and dynamics and then numerically. Results are in line with the related literature: the fundamental demand component helps the stability of the system and keeps prices bounded; market makers satisfy their role of restoring stability, while the chartist demand component produces irregularity and chaos. However, in some cases, the chartist demand component assumes the role to compensate the fundamental demand component, felt in an autogenerated loop, and pushes the dynamics to equilibrium. This fact suggests that the instability must not be searched into the nature of the different investment styles rather in the relative proportion of the contribution of market actors.
Keywords:
dynamical systems; financial markets; investment style; border collision bifurcation; fundamental analysis; technical analysis; market maker MSC:
39A60; 91-10; 91B69
1. Introduction
Financial markets are complex systems whose functioning has been studied and discussed largely in literature. Conventionally, markets are seen as populated by rational investors that arbitrage away any possible predictable gain, thus what is left is just perturbation with null returns. However psychological forces unquestionably play a role in financial crashes, for example, it happened in 1929, on the Black Monday of October 1987, or in the dot.com bubble of 2001. Bubbles and crashes cannot be explained by an efficient market, where prices are supposed to reflect all the available information. Starting from empirical facts that cannot be explained by the efficient market hypothesis and observable features that can be seen as the outcome of speculative activities, a large stream of literature developed models in which prices are driven by the demand of heterogeneous market participants. The addressed issues consisted in understanding how irregular patterns, alternating periods of bull and bear markets, can be derivable from the way actors participate in the market. One of the first behavioral model in this direction was proposed in [1] with linear trading rules that were successively extended to non-linear versions in [2,3]. At the same time, imitative behavior and switching between investment styles have been also largely addressed to explain the emergence of fads, herding behavior, and financial bubbles [3,4,5]. Such a field intersects also with some empirical literature that looks at financial data searches for chaotic traces instead of randomity [6,7,8,9].
In the mentioned literature two rather standard approaches in terms of investment styles are considered: fundamental analysis and technical analysis. The fundamental analysis supports the trading through a deep analysis of the real economy behind the asset and evaluating the future earnings; in this respect, a fundamental value will summarize the outcome of such analysis and will drive the trader’s order submission. The technical analysis, based on graphs and indices, return trends and the market sentiment, provides concise tools to understand where the market is going. Professional traders rely both on technical and fundamental analysis to determine whether and how to participate in the market. Hence the model considers the price driven by a composite demand in which fundamentals and indices contribute together to move the price. Moreover, the third typology of component is considered, hereafter referred to as market makers’ demand: market makers are specific entrepreneurs who accomplish the task to absorb excess demand if any. The fundamental and chartist demand components are assumed piecewise linear, indeed it is quite common that an investor does not participate continuously in the market rather she enters (buy) or exits (sell) the market if something gives her a signal of unfair prices or trend inversion; in other words, an investor submits an order, whatever it is, when something happens to suggest the presence of earning opportunities. Thus the model belongs to that part of literature that sees markets as financial dynamical systems and applies continuous and discontinuous piecewise smooth maps in economics and finance, as [10,11,12]; in the specific financial markets, see [13] for a review. In the present model, the chartist demand component is given by a common chartist investment strategy that uses the difference of moving averages to catch trend inversions. From the mathematical point of view, this leads to a large first-order difference equation system whose study is not so straightforward. The equilibrium points and their stability can be studied only partially; the bifurcations that occur belong to the class of border collision bifurcations for which analytical results are still limited to low order systems [14,15,16].
The analytical and numerical analysis confirm that demand based on fundamental analysis keeps prices around the fundamental value even when chaos appears. Demand based on technical analysis can in large amount contribute to enhancing the chaos of the system and the price oscillations, while market makers assume the role to stabilize the market. The presence in the market of investors, those who try to speculate without caring about fundamentals, generates dynamics that remove the price from its fundamental value because their action drives the market in the same direction the market goes, giving strength to the trend. A clear example of such a phenomenon is represented by the financial bubble (see [17,18]): increasing prices lead investors to buy, which feeds the price increase far away from its fundamental. On the other hand, when the price is so pumped, it starts a period of instability, then a crash can occur, or a smooth deflation will bring back the price near its fundamental. In the model each demand component is weighted by a specific parameter, the ratios between these parameters give the balance between the investment styles relative dominance. Results are anything but surprising, and in line with the related literature, however, the emergence of a situation in which the fundamental demand component alone generates periodic prices and small amounts of chartist demand push prices to converge. How can chartist demand push to equilibrium a periodic dynamic triggered by the fundamentals? In an attempt to answer this question: while the fundamental demand component generates a loop that feeds a periodic up and down of prices, the chartist demand component that moves in an opposite direction operates as softening the fundamental force resulting in a convergent price. One could argue that the interaction of different investments styles in the market generates disequilibrium in prices when their contribution is out of proportion, otherwise, the market moves chaotic without spikes or anomalies, apparently in line with the efficient market hypothesis. In other words, one can conclude that the observed instability does not derive from the presence of some specific investment style in itself, rather from a disproportion of their reciprocal contributions to form the total demand.
The novelty of the model stays in introducing: (a) a common chartist investment strategy that sees applied the moving averages; in particular, the difference between two moving averages, as used by technical analysis, involves the use of past prices in the long and short term, leading to a high order system whose study is anything but trivial to face; (b) the market makers demand so far has not experienced enough attention in the related literature. Future investigations will move in the direction of studying deeply the border collisions bifurcation in high order system as it occurs here; adding sophistication to the market makers demand via a piecewise map, which would be more reasonable from the economic point of view; developing a stochastic version of the model to replicate more realistically the market and allowing for calibration on real data.
The rest of the paper is organized as follows: Section 2 presents the model with all its components in details; Section 3 presents the analytical study of the system in each component, in the limit of their tractability; Section 4 presents numerical examples with relative observations and results; in Section 5 a general discussion on the model is provided; finally Section 6 concludes.
2. A Financial Market Model
The proposed model considers the price as moved by the market demand, driven by three rather standard components: a fundamental component, set according to a “fair” price deriving from fundamental analysis; a chartist component, that follows the market trend by using technical analysis, and a market makers component, that helps liquidity and price fluidity absorbing demand in excess.
Let and be the stock price and the demand at time t, respectively. They can be put in relation by a difference equation system of the type
where , and are the fundamental, chartist and market makers demands, respectively. The price is driven by past prices, just one step before, and the demand . The price dependence with respect to the past and the demand could be modeled in many different maps, for the sake of tractability the linear map remains one of the most adopted choices.
Under the action of the three market forces, prices will move up and down, showing stable, periodic, or chaotic behavior. Each market component can dominate more than others pushing the market to an equilibrium price or an erratic movement, that even in a stylized fashion can remind real market reproducing known stylized facts. Each component will be studied analytically and numerically, varying the specific parameters that balance the weight of each component. In the following, each component will be described in detail.
2.1. Fundamental Demand
The fundamental strategy is built around the fundamental price that each agent evaluates according to her perception and belief, selecting the relevant economic and financial factors which contribute to producing the supposed security’s intrinsic value. For the sake of simplicity, we consider a demand driven by a unique fundamental price as all the investors agree on it. A heterogenous specification of the fundamental value could be adopted to incorporate heterogenous agents’ beliefs; for example, we could select a fundamental value following a random walk which can incorporate also the effect of news arrival, as in [5,19], however, it would add more complexity to the model.
Given v the fundamental price, the stock results overvalued if , the stock is correctly valued if , and the stock is undervalued if ; then an investor sells, holds her position, or buys, respectively, because she expects prices decreasing or increasing accordingly. In literature this has been often modeled by a linear function , which can generate an unlimited demand; however limited money availability could suggest that a bounded function could fit better the bounded reality, for example, the following
The Equation (2) owns the quality to be continuous and smooth, however its analytical tractability could be hard. Then a piecewise linearized version around v could be more suitable:
Note that the map is continuous if , discontinuous otherwise. This map can be written also as
where is the indicator function of set A.
The dynamics of these maps will be analyzed in Section 3.1.
2.2. Chartist Demand
The technical analysis attempts to interpret the evolution of the market by looking at charts, for this reason, the investors using such analysis are called often chartists. According to the technical analysis, the price charts present recurrent figures (head and shoulders, Elliot’s wave, triangular forms, just for citing some examples); such figures can indicate evolution, persistence, or inversion of trend. If the market is in a down-trend (bearish) the technical analysis suggests selling, and if it is in an up-trend (bullish) to buy; price dynamics are often summarized by indicators as moving averages, those are built such that they can generate a signal of market changes.
Investment decisions in technical analysis are the result of complex evaluations based on market observation by means of charts, signals, oscillators involving prices, volumes, and any variable of interest. Among the most commonly used indicators, there are moving averages, that smooth the price dynamics, clearing it from temporary oscillations. The difference between two moving averages, a long and a short one is a common indicator sensible to a trend inversion. The moving average (ma) at time t on K days is defined by
it is a smooth line of prices that shows the development of the price following it without anticipating. It is a popular practice to use and compare two moving averages, one on the long term, one on the short term; the former catches the main trend while the latter is more sensitive to short time fluctuations; their difference, called a difference of averages (), is such that it generates a signal as they cross each other; indeed, in the short term, ma is lower than the long-term ma and their position inverts, the short ma is catching an increasing trend inversion; while when the short term is greater than the long one and their position inverts, their intersection signals a decreasing trend beginning. Formally, let be
where , i.e., is the short term moving average and is the long term moving average, briefly we have:
In a few words, the signal is generated when the -line crosses zero, if it does from below, the signal is to buy, if it does from above is to sell. Introducing such an indicator in the chartist demand, we get
where e is the specific chartist parameter and is the indicator function. Given (4), we have
it results
where .
2.3. Market Makers Demand
Market makers clean the market by excess demand, so they buy or sell in opposition to the market behavior. For this reason, the easiest expression is
where is the reaction parameter that balances the market makers’ presence in the market.
3. The Analytical Study
Fundamental and chartist components are piecewise linear maps of first and order. In the present section, fundamental and chartist demand components are first considered singularly and analytically studied to the limit of their tractability, then they will be studied together. The market makers’ demand will not be considered alone because this lacks economic sense.
3.1. The Model with Fundamental Demand
Let us start with the map
The system can be re-written in one equation
which is a one-dimensional map but a second-order difference equation. This map admits a positive fixed point lower than v for , a negative fixed point for and one negative and two positive fixed points greater than v for , where is given by
given to be the solution of the equation
The local/global stability of such points can be studied numerically; the trajectories appear in some cases non-trivial, but a full analytical study is hindered by the presence of the arctang. The map in (10) can be approximated by a two-dimensional piecewise smooth map, which shows interesting behavior, and it is more analytically tractable. Note that parameters in the piecewise smooth map can be set to have a continuous map that approximates (10), the calculation is straightforward. For the sake of simplicity, we use the same notations even if they might differ.
Let us consider now the piecewise linear map
which can be written in a normal form
where , , and
The phase space of this map is divided by the borderlines , into 3 regions , and ; in each region the dynamics follows a linear map continuous in its relative region. The map is invertible if . By a straightforward calculation we find that the map owns three fixed points with ,
Each of these three points exists in an own existence region according to parameters value . In order to determine the stability, we need to calculate the eigenvalues of matrices and , where the characteristic polynomials are
Since admits and as roots, and are stable if . The polynomial has discriminant that depicts different stability regions according to values. The curve partitions the space
into two regions where the eigenvalues are
- real and distinct if ,
- real and equal if ,
- complex if .
The bifurcation conditions are given by
In Figure 1 (left) the stability regions and the bifurcation curves are represented in the plane with , while in (middle) the stability regions and the bifurcation curves are represented in the plane with . In Figure 2 (left:right) the bifurcation surfaces are shown in the space. The conditions for the asymptotic stability are
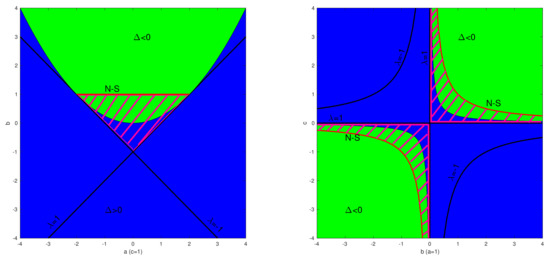
Figure 1.
In (a) on the left hand side the bifurcation conditions together with the asymptotic stability region of the map in Equation (14) are represented in the plane (a,b) with c = 1; In (b) on the right-hand side the bifurcation conditions together with the asymptotic stability region are represented in the plane (b,c) with a = 1. The green area corresponds to complex eigenvalues, the blue one to real eigenvalues; the black lines denote the flip and fold bifurcation, the red line marks the Neimarck Sacker bifurcation and the striped area characterizes the asymptotic stability region.
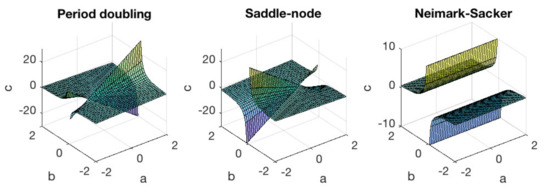
Figure 2.
(left), (middle), (right) show the three bifurcation conditions in Equation (16) represented in the space (a,b,c).
3.2. The Model with Fundamental and Market Makers Demands
In the following section, we consider fundamental demand together with market makers. Considering market makers alone have a poor economical meaning, for this reason, it is more of interest to the presented case. We have the following system
which corresponds to a normal form as in (14) where
Matrices and are invertible if and , respectively. As in (13) the phase space is divided in 3 regions , with and a straightforward calculation brings to the following fixed points
Now the parameters set includes the new parameter . The characteristics of polynomials are
In and eigenvalues are always real and fixed points are stable if and . Flip bifurcation occurs at and , fold bifurcation occurs at and , while Neimarck Sacker bifurcation occurs when . The stability region in is given by the conditions
and bifurcation conditions are
Assuming that which is economically reasonable, in Figure 3 stability regions and bifurcation curves are plotted with (lhs) and (rhs). The triangular region moves accordingly the effect of , while the hyperboles on the right-hand side moves up and down accordingly.
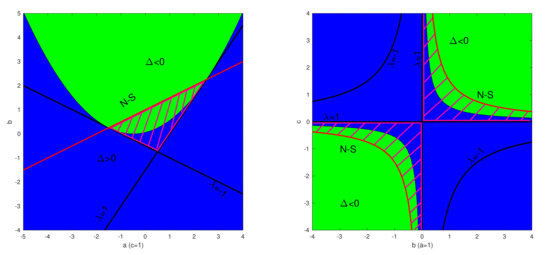
Figure 3.
In (a) on the left hand side the bifurcation conditions together with the asymptotic stability region of the map in Equation (17) are represented in the plane (a, b) with c = 1; In (b) on the right-hand side the bifurcation conditions together with the asymptotic stability region are represented in the plane (b,c) with a = 1. In green the area in which eigenvalues are complex, in blue where eigenvalues are real, the black lines denote the flip and fold bifurcations, the red line marks the Neimarck Sacker bifurcation, and the striped area characterizes the asymptotic stability region. The Figure can be compared with Figure 1 to see that the presence of market makers enlarge the stability region.
3.3. The Model with Chartist Demand
Considering only the chartist component, the model takes the form
where . It is a system of order , that can be transformed into a system of first order as following
Let be , the system takes the normal form in D, where
Outside D the system collapses in , which has the trivial solution .
The characteristic polynomial is given by
where , , , , and . In this case the study of the stability region is not trivial.
3.4. The Complete Model
When all the components are considered the model takes a normal form in where
Also, in this case, we can write the characteristic polynomial, however, the stability region study is not trivial, and it can be performed only partially. For this reason, in the following, we settle for numerical simulation to discuss the dynamics scenario and the economic implications.
4. Numerical Simulation
In the following, we study numerically all the presented cases. In detail, we start with the fundamental map; then we consider fundamental and market makers’ demand together; as a third step we consider chartist demand firstly alone then jointly with fundamental demand and, finally, we combine all the demands. The market makers’ demand is studied only associated with fundamental and chartist demands, indeed, as already mentioned, being thought to absorb excess demand, alone it loses reasonability from the economic point of view. In all the simulations it holds , and . The main discussion is about parameters which give the impact of each demand and past prices on the dynamics.
4.1. Fundamental Demand
We investigate the dynamics starting from the analytical results. In the asymptotic stability region, prices go to one of the fixed points with speed according to the parameters. Closer the parameters to the border of the stability region slower the convergence, as it can be seen in Figure 4, comparing the scenario in the top with parameters , and to that in the bottom with , and , where the value of c at the border would be . Each figure in the following shows price dynamics on the left-hand side and the phase space on the right-hand side. Outside the stability region, the dynamic scenarios include periodic orbits and chaotic motion. Some examples of periodic orbits are reported in Figure 5, where on the top there is an orbit of period 6 to be read clockwise; note that in terms of price and demand the orbit is 3-period but they are combined giving 6 couples of price and demand. On the bottom a periodic elliptic orbit appears, this dynamics holds for any value of when b and c are equal 1. In this case, the effect of the demand is fixed, while the price drift matters: the higher a the closer the ellipse center to the fixed point and the closer the amplitude to the range . Examples of chaotic motion are reported in Figure 6 and Figure 7. In Figure 6 the plot on the top panel shows prices almost regularly oscillating in the range , since parameters are closed to the stability region border; while on the bottom panel parameters are far from the border and prices oscillate widely. In Figure 7, c is negative; being c the fundamental demand parameter, negative values mimic a trend follower demand, indeed the dynamics show bear and bull period (on the top), a wide range of prices (in the center) and price overvaluation (on the bottom). In Figure 8 bifurcation diagrams with respect c show the map behavior varying c.
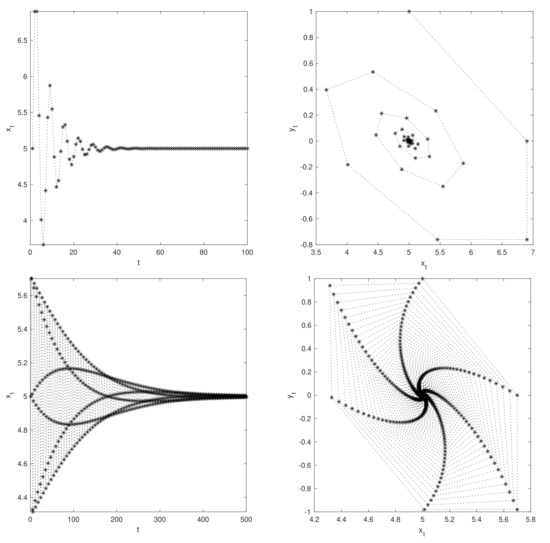
Figure 4.
The (top-left) shows the price evolution and (top-right) the phase space of fundamental map dynamics with a = 1, b = 1.9 and c = 0.4, while (bottom-left) and (bottom-right) show the price evolution and the phase space of fundamental map dynamics with a = 1, b = 0.7 and c = 1.4 note that the value of c at the border would be .
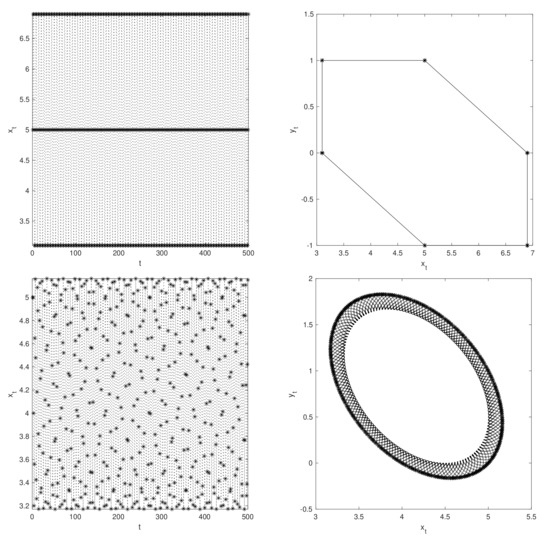
Figure 5.
The (top-left) shows the price evolution and (top-right) the phase space of the fundamental map dynamics with a = 1, b = 1.9 and ; while (bottom-left) and (bottom-right) show the price evolution and the phase space of fundamental map dynamics with a = 0.8, b = 1 and c = 1.
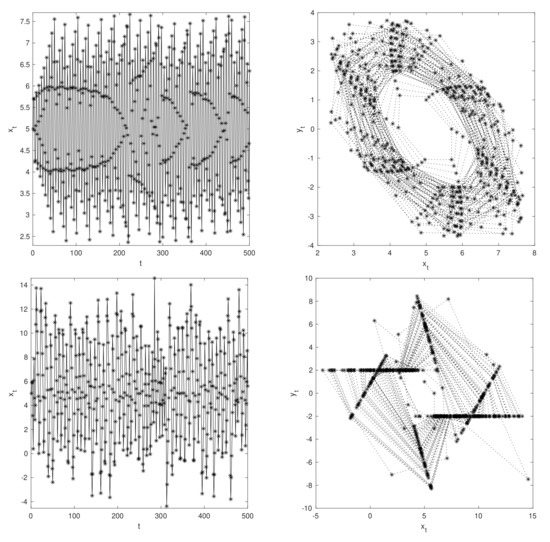
Figure 6.
The (top-left) shows the price evolution and (top-right) the phase space of the fundamental map dynamics with a = 1, b = 0.7 and c = 1.5, note that ; while (bottom-left) and (bottom-right) show the price evolution and the phase space of fundamental map dynamics with a = 1, b = 0.9 and c = 3.4.
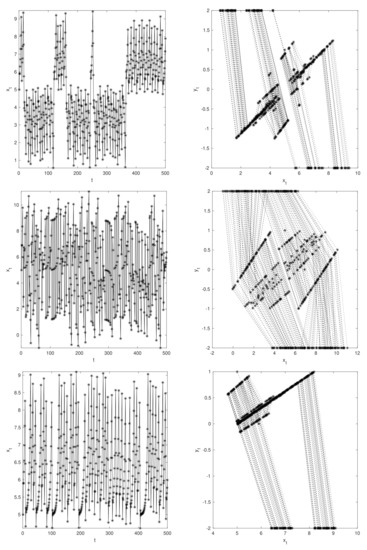
Figure 7.
The (top-left) shows the price evolution and (top-right) the phase space of the fundamental map dynamics with a = 1, b = 0.9 and c = −0.5; while (middle-left) and (middle-right) show the price evolution and the phase space of fundamental map dynamics with a = 1, b = 1.9 and c = −0.4, while in the (bottom) it holds a = 1, b = 0.9 and c = −0.4.

Figure 8.
Bifurcation diagrams with respect c of the fundamental map. (left) shows the diagram with a = 1, b = 1.9 and . (middle) shows the diagram with a = 1, b = 1 and . (right) shows the diagram with a = 0.9, b = 0.9 and . Note that having a and b lower than 1 enlarge the area in which a lower/negative c generates chaos.
4.2. Fundamental and Market Makers
As already discussed, stability regions, see again Figure 3, the presence of market makers tends to regularize prices enlarging the stability region. Outside of this region dynamics scenarios appear very similar to those in the already studied case with only the fundamental demand component. We focus on because values outside this interval own low interest from an economic perspective, indeed such a case complies with a reverse effect of market maker that rather absorbing amplifies the excess demand effect. Even if such dynamics could be interesting from the mathematical point of view, its absence of interest from the economical point of view suggests skipping this study. The simulation outcomes do not add any insight to those already discussed in the fundamental demand map, thus no figures about this case are reported.
4.3. Chartist Demand
It is of interest to see how the system behaves when only chartist demand is active. When and , no matter the chartist contribution, the system converges to a fixed point determined by the initial conditions. When and the system shows a rough periodicity for small value of e, i.e., for small contribution of the chartist investment style, and a chaotic behavior for high values of e, see bifurcation diagrams in Figure 9. Lower the b later the chaos appears, since a low b reduces the amplitude of the chartist demand and hence its impact on prices, see Figure 9 in the center. Finally, if a is greater than 1, but still in that range in which prices do not explode, the contribution of the chartist leads directly to chaos, see Figure 9 (rhs).

Figure 9.
Bifurcation diagrams for the chartist map with respect to the parameter e. (left) shows the diagram with a = 0.9, b = 1 and . (middle) shows the diagram with a = 0.9, b = 0.8 and . (right) shows the diagram with a = 1.1, b = 0.8 and . Note that having the lower the b the later the chaos appears.
4.4. Fundamental and Chartist Demand
Let us now consider the dynamics with the fundamental and chartist demands. In Figure 10 (lhs), are the same as those in the bottom of Figure 5, while . The bifurcation diagrams show that low values of e do not change the dynamics, then the presence of chartist investors stabilizes the price pushing it to converge to a slightly overvalued price. Increasing e the dynamics becomes chaotic with small intervals in which the contribution of chartist demand pushes prices to converge or to oscillate around the equilibrium, not far from the fundamental value. How and why chartist demand can do this is not straightforward to understand and appears counterintuitive. Note that when , and the fundamental map converges and chartist investors do not affect the convergence, even a large amount of chartists do not change the dynamics. Similarly when and and chartist demand has no effect on the periodic dynamics of fundamental map. Differently, when , and , such that the fundamental map dynamics is asymptotically stable, a small presence of chartist has no effect, while high values of e move the dynamics into chaos. Note that in Figure 10 (rhs) there is a range of e in which the price oscillates chaotic into the range , while for e approaching values near 7 prices move chaotic in a very large range. This fact suggests the following picture: prices oscillate in a reasonable range under the action of fundamental and chartist forces, for some reason, chartist investors increase in number till to surpass a certain threshold, after that, prices start to oscillate widely as it happens in case of market turbulence, with prices going up and down crazily. This confirms the belief that chartist investors participate in instability and bubble inflation. However, it appears that the responsibility of instability stays more in the unequal proportion of force pressures on the market than the specific action of an investment style itself. In other words, it is not the adoption of the technical analysis in itself the problem but their dominance in proportion.
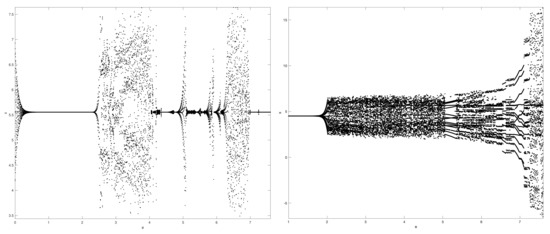
Figure 10.
Bifurcation diagrams for the map that considers together fundamentalist, and chartist demands. The diagrams are presented with respect to e. (left) shows the diagram with a = 1.1, b = 0.8, and . (right) shows the diagram with a = 0.9, b = 0.8, and .
Figure 11 and Figure 12 propose three dynamics with comparable parameters. On the left-hand side, only fundamental demand is considered, while in the center fundamental demand is coupled with chartist demand and on the right-hand side, all the components are effective. The dynamics changes according to the demand: with only fundamental demand, the price stays in a narrow neighborhood of , when chartist demand intervenes, the regular dynamics moves into a chaotic elliptic attractor (see the plot in the center), while the intervention of market maker regularizes and pushes the price to converge fast (see rhs). In this case, chartist demand moves prices to chaos, and market makers restore the convergence. Differently in Figure 12, fundamental parameters are set to generate a periodic elliptic attractor (lhs), chartist demand has the effect to shrink the price to the fixed point (see in the center) and again the market makers accelerate the convergence (rhs). In this example, chartist demand has the effect to push prices to equilibrium.

Figure 11.
(left) shows the phase space of the fundamental map with a = 0.8, b = 0.9 and c = 1.1, (middle) shows the phase space of fundamental and chartist map with a = 0.8, b = 0.9 and c = 1.1 and e = 2.0, and (right) shows the phase space of the complete map with the same values of previous plot and .

Figure 12.
(left) shows the phase space of the fundamental map with a = 1.1, b = 0.9 and (periodic dynamics), (middle) shows the phase space of fundamental and chartist map with a = 1.1, b = 0.9 and and e = 2.0, (right) shows the phase space of the complete map with the same values of previous plot and .
5. Further Discussions
The present section addresses a general discussion about the model, its limits, and some possible future evolutions. The presented model is deterministic and pointed toward considering how market participants, their styles, and their attitudes have an impact on prices and market instability. The model considers three rather standard strategies and provides stylized explanations of empirical market features. Thanks to its simplicity the model is flexible with respect to many future variations. One could include the possibility to have fundamental value varying over time, following for example a random walk as in [4]. This can be done substituting in Equation (10) v by
where .
Another variation could consider the switching between investment styles; this can be done by allowing the reaction parameters c, d, e, and also including the tolerance to change in time as in [19]. Indeed, in the full demand, we can see the contribution of investment styles accounted by traders simultaneously in the proportion given by the reaction parameters. Traders can consider differently the misalignment by fundamentals or the trend, thus reaction parameters can vary according to the strength of the investors’ belief in each specific investment style. In other words, there could be phases in the market in which investors believe and adopt more fundamental analysis than technical one or vice versa. For doing so a mechanism of imitation and profitability evaluation must be implemented. Alternatively, although more simplistic it could be done by considering parameters varying randomly in time. A stochastic version of the model can also be considered, including a random perturbation of prices to incorporate the effect of traders moved by liquidity needs or the effect of exogenous news arrival on the market. The stochastic version has the advantage to replicate more realistically the market features. Indeed, a deterministic model has mainly the aim to offer a stylized explanation of market features and not the presumption to be completely realistic as it is needed to be used for forecasting purposes for example. The stochastic version could be also subjected to a calibration procedure following the simulated method of moments as in [20,21]. Although the undeniable value of work pointed towards the reproduction of real market dynamics in its entirety, such an issue is outside the aims of the present paper and left for future investigations.
6. Conclusions
In the present model, a simple financial market model is considered with three rather standard market forces contributing simultaneously to the total demand: fundamental, chartist, and market makers. The model is given by a discrete difference equation system with a piecewise linear map of a high order. Each component has been studied separately to understand and highlight its contribution to the dynamics. Results are not surprising and in line with the related literature [1,4,12,13]: fundamental demand helps the stability of the system and keeps prices bounded; market makers satisfy their role of restoring stability, while the chartist demand component adds instability and chaotic movement to prices. However, we see that in some cases chartist demand can compensate for fundamental demand, felt in the loop, and pushes the dynamics to equilibrium. The lesson we can take from this fact is that the instability does not stay intrinsically in the nature of the demands but their combination and proportion. Indeed, markets are places where a mix of different beliefs and attitude meets. The market dynamics cannot be anything else than the outcome of such a variety of agents. In the market, the heterogeneity of actors finds an equilibrium that can show regular dynamics and smooth oscillations coherent with the efficient market hypothesis. Nevertheless, if any kind of disequilibrium occurs in the market forces, prices can oscillate widely, bear and bull periods can arrive, and bubbles can inflate and explode.
The contribution of the paper goes in three directions: (1) it considers a common, rather so far unstudied, chartist demand implying moving averages difference; (2) the model includes market maker participation, so far that it has not received so much attention; (3) the model uses a high order piecewise linear map that provides interesting bifurcation diagrams belonging to the class of border collision bifurcations but those deserve much attention for the future, also for their economic implications.
Future investigations can move in the following directions: (1) the study of border collisions bifurcations in high order systems as the one proposed here; (2) the sophistication of the market maker demand via a piecewise map; (3) the implementation of a stochastic version of the model with a mechanism of changing the weight of each investment style; (4) the calibration of a stochastic version of the model to reproduce real markets dynamics.
Funding
AF acknowledges financial support from the project HiDEA (Advanced Econometric methods for High-frequency Data) financed by the Italian Ministry of Education, University and Research (MIUR) under the program “PRIN: PROGETTI DI RICERCA DI RILEVANTE INTERESSE NAZIONALE—Bando 2017” Prot. 2017RSMPZZ.
Institutional Review Board Statement
Not applicable.
Informed Consent Statement
Not applicable.
Data Availability Statement
Data were generated during the study. The paper presents any information needed to replicate the study.
Conflicts of Interest
The author declares no conflict of interest.
References
- Beja, A.; Goldman, M.B. On the dynamic behavior of prices in disequilibrium. J. Financ. 1980, 35, 235–248. [Google Scholar] [CrossRef]
- Day, R.; Huang, W. Bulls, Bears, and Market Sheep. J. Econ. Behav. Organ. 1990, 14, 299–329. [Google Scholar] [CrossRef]
- Chiarella, C. The dynamics of speculative behavior. Ann. Oper. Res. 1992, 37, 101–123. [Google Scholar] [CrossRef]
- Lux, T. The socio-economic dynamics of speculative markets: Interacting agents, chaos, and the fat tails return distributions. J. Econ. Behav. Organ. 1998, 33, 143–165. [Google Scholar] [CrossRef]
- Lux, T.; Marchesi, M. Scaling and criticality in a stochastic multi-agent model of a financial market. Nature 1999, 397, 498–500. [Google Scholar] [CrossRef]
- Gilmore, C.G. A new approach to testing for chaos, with applications in finance and economics. Int. J. Bifurc. Chaos 1992, 3, 583–587. [Google Scholar] [CrossRef]
- Gilmore, C.G. Detecting linear and non linear dependence in stock returns: New methods derived from chaos theory. J. Bus. Financ. Account. 1996, 23, 1357–1377. [Google Scholar] [CrossRef]
- Holyst, J.A.; Zebrowska, M.; Urbanowicz, K. Observation of deterministic chaos in financial time series by Recurrence Plots, can one control chaotic economy? Eur. Phys. J. B 2001, 20, 531–535. [Google Scholar] [CrossRef]
- McKenzie, M.D. Chaotic behavior in national stock market indices. Glob. Financ. J. 2001, 12, 35–53. [Google Scholar] [CrossRef]
- Lorenz, H.W. Non Linear Dynamical Equation and Chaotic Economy; Springer: Berlin, Germany, 1993. [Google Scholar]
- Hommes, C.H.; Nusse, H. Period three to period two bifurcations for piecewise linear models. J. Econ. 1991, 54, 157–169. [Google Scholar] [CrossRef]
- Tramontana, F.; Westerhoff, F.; Gardini, L. On the complicated price dynamics of a simple one-dimensional discontinuous financial market model with heterogeneous interacting traders. J. Econ. Behav. Organ. 2010, 74, 187–205. [Google Scholar] [CrossRef]
- Tramontana, F.; Westerhoff, F. Piecewise-Linear Maps and Their Application to Financial Markets. Front. Appl. Math. Stat. 2016, 2, 10. [Google Scholar] [CrossRef]
- Banerjee, S.; Grebogi, C. Border collision bifurcations in two-dimensional piece wise smooth maps. Phys. Rev. E 1999, 59, 4052–4061. [Google Scholar] [CrossRef]
- Nusse, H.E.; Yorke, J.A. Border collision bifurcations for piecewise smooth one-dimensional maps. Int. J. Bifurc. Chaos 1995, 5, 189–207. [Google Scholar] [CrossRef]
- De, S.; Sharathi Dutta, P.; Banerjee, S.; Ranjan, A. Local and global bifurcations in three dimensional continuous piecewise smooth maps. Int. J. Bifurc. Chaos 2011, 21, 1617–1636. [Google Scholar] [CrossRef]
- Sornette, D.; Johansen, A.; Bouchaud, J.P. Stock Market Crashes, Precursors and Replicas. J. Phys. I Franc. 1996, 6, 167–175. [Google Scholar] [CrossRef]
- Sornette, D. Why Stock Markets Crash: Critical Events in Complex Financial Systems; Princeton University Press: Princeton, NJ, USA, 2004; p. 448. [Google Scholar]
- Westerhoff, F.; Reitz, S. Nonlinearities and Cyclical Behavior: The Role of Chartists and Fundamentalists. Stud. Nonlinear Dyn. Econom. 2007, 7, 4. [Google Scholar] [CrossRef]
- Franke, R.; Westerhoff, F. Structural stochastic volatility in asset pricing dynamics: Estimation and model contest. J. Econ. Dyn. Control. 2012, 36, 1193–1211. [Google Scholar] [CrossRef]
- Fabretti, A. Markov chain analysis in agent-based model calibration by classical and simulated minimum distance. Knowl. Inf. Syst. 2019, 61, 259–276. [Google Scholar] [CrossRef]
Publisher’s Note: MDPI stays neutral with regard to jurisdictional claims in published maps and institutional affiliations. |
© 2022 by the author. Licensee MDPI, Basel, Switzerland. This article is an open access article distributed under the terms and conditions of the Creative Commons Attribution (CC BY) license (https://creativecommons.org/licenses/by/4.0/).