Article

Research on the Resilient Evolutionary Game of Logistics Service Supply Chain with Government Participation

1
College of Business Administration, Shandong Management University, Jinan 250357, China
2
International Business School Suzhou, Xi’an Jiaotong-Liverpool University, Suzhou 215123, China
3
Department of Computer Science, University of Liverpool, Liverpool L69 3BX, UK
*
Author to whom correspondence should be addressed.
Mathematics 2022, 10(4), 630; https://doi.org/10.3390/math10040630
Submission received: 17 January 2022 / Revised: 15 February 2022 / Accepted: 15 February 2022 / Published: 18 February 2022

Abstract

:
The resilient strategy of logistics service supply chains with government participation is not only an effective measure for manufacturers and integrators to lower the risks but also an important component of the modern risk management capability of government. From the perspective of risk society, this paper presupposes the existence of emergencies, embeds the “resilient ability” into the logistics service supply chain, establishes a tripartite evolutionary game model among the government, manufacturers, and integrators, and systematically analyzes the strategy selection process under the participation of the government. On this basis, through numerical experiments, this paper examines the supervision sensitivity with different policies on a micro level, investigates the impact incurred by the change in governmental reward and punishment degree, and further complements the research on the complexity of the strategy selection process in reality. The results show that in the short run, regardless of the reward and punishment measure the government chooses, the manufacturers and integrators will choose not to adopt and implement the resilient supply chain strategy, while, in the long run, increasing manufacturers’ initial supervision and implementing relevant reward and punishment measures can guide integrators to choose the strategy. Increasing government integrators’ reward degree and reducing costs can thus promote the enthusiasm of integrators in resilient logistics service supply chains.

1. Introduction

Handling the challenge of increasingly fierce market competition, supply chain enterprises in Japan, Europe, and the United States take the lead in shifting their production mode to just-in-time production and lean management, adopting centralized production and distribution, and focusing more on acquiring and maintaining their core competitiveness. They transfer the noncore logistics business to professional and efficient outsourcers, to effectively reduce costs and improve efficiency [1,2]. With the improvement of the integrity and complexity of modern logistics outsourcing, various logistics organizations cooperate to form a complete logistics system with a multi-level supply and demand relationship from the perspective of demand, which constitutes the Logistics Service Supply Chain (LSSC) [3]. With the intensification of market competition, the transformation of business models, and the prominence of customers’ personalized needs, emergencies will inevitably interfere with the implementation of logistics plans. The prevailing zero-inventory management strategy challenges the effectual supply of logistics services in a short period, resulting in the loss of customers and market share. From the perspective of embeddedness, emergencies not only impact the product supply chain, but also generate serious impacts on the whole logistics service supply chains and the participants by triggering the deconstruction of enterprise alliances. For example, the outbreak of COVID-19 in 2020 has been a major public health emergency, which has affected various logistics providers, including transportation, storage, freight forwarders, and the integrators served by them, as well as downstream customers, causing serious dysfunction in the logistics service supply chain network. In 2021, The Ever-Given ship event in the Suez Canal led to the cutting off of the most important shipping lane between Europe and Asia, and this sudden logistical crisis was another “attack” to the global supply chain, causing months of disruption of manufacturing. As a result, it was difficult for upstream providers to provide accurate logistics services, incurring serious losses to the product supply chain. Therefore, it is quite necessary to study how to deal with the logistics service supply chain risks under emergencies.
Resilience is a multidimensional and multidisciplinary concept that has its roots in psychology and ecosystems [4] and has been applied to the field of supply chain management. Resilience is generally considered the dynamic capability of an organization to resist risk when dealing with the risk of disruption. In contrast, supply chain resilience is a combination of the robustness and recoverability of a supply chain and includes two core components: First, in the event of a major disaster or disruption, the supply chain system can completely avoid the risk or survive with minimal losses, minimizing the extent of disruption. The second is the capability to react quickly and find an effective recovery path to a stable state when the supply chain is disrupted. The resilient supply chains’ embeddedness requires better preparation, more flexible response, and faster recovery than competitors [5,6]. This fully reflects the superiority of the resilience mechanism, so supply chain resilience provides a new research idea for dealing with the uncertainty of emergency risk [7]. Taleizadeh et al. [8] utilized a Stackelberg game approach for designing resilient supply chains and investigated the impact of using resilience strategies on supply chains competition. Sabouhi et al. [9] presented a hybrid model that aims to determine sourcing and network design decisions, as well as resilience strategies for designing a sustainable supply chain that is resilient to random disruptions. At present, academia mainly focuses on the resilience mechanism of the product supply chain but does not directly involve studying the resilience of logistics service supply chains. Therefore, in the process of logistics service supply chain operation, the existence of emergencies is inevitable, and the resilient system of the product supply chain and logistics service supply chain to deal with emergencies under the participation of government should be established, which is undoubtedly of great value to improve customer satisfaction.
Manufacturers and integrators are both subjects of the limited rational game with government participation, and the three participants have their game strategies with information asymmetries. This paper mainly explores answers to the following three questions:
(1) From the perspective of embeddedness, is there a strategy of stabilization in the evolutionary game among the three participants of government, manufacturer, and integrator?
(2) What is the relationship between the equilibrium convergence of government, manufacturer, and integrator, as well as the initial strategy selection of the respective groups in the evolution process? How does the initial choice affect policy stability?
(3) Can the sustainable development of the resilient supply chain be realized by adjusting the subsidy and penalty degree of government to the integrators?
The main contributions of this paper are as follows: (1) This paper constructs a tripartite asymmetric model of government, manufacturer, and integrator, and uses evolutionary game theory to analyze the resilient decision-making of participants, to achieve optimal returns under bounded rationality. (2) At present, studies on resilient supply chains have mainly focused on product supply chains, while the logistics service supply chain is based on capacity coordination, which is quite different from the product supply chain. The resilience mechanism directly affects the emergency response strategy of the product supply chain and logistics service supply chain cooperation alliance. (3) This paper draws insightful conclusions that the final equilibrium strategy of the three parties can be changed by adjusting the initial parameters. Among them, the reward and punishment from the government and manufacturer resilience strategy are the decisive factors for implementing the resilient logistics service supply chain, which provides the basis for relevant governmental policies.
The remainder of this paper is organized as follows. We summarize the related literature in Section 2. Section 3 provides the assumptions for this study and parameters. Section 4 analyzes the strategic stability of each game agent. Section 5 conducts the simulation and sensitivity analysis. The conclusions, management insights, and future research directions are presented in Section 6.

2. Literature Review

2.1. Coordination of Logistics Service Supply Chain

A good logistics cooperation and service system are important factors for the coordination of the logistics service supply chain. Some scholars have studied logistics service transaction strategies based on the theory of options contracts. Liu et al. [10] studied the impacts of loss-averse preference on the service capacity procurement decisions with demand updating in a logistics service supply chain, which consists of one logistics service integrator and one functional logistics service provider. Zhang et al. [11] analyzed the risk evolution and the main actors’ reactions in the LSSC, including categorizing the urgent scenarios, analyzing their impacts on the diffusion intensity of pricing, profit, and demand, and verifying the models’ validity with the numerical analysis. Lou et al. [12] studied the choice of logistics service outsourcing in the retailer-led supply chain and found that when retailers share part of the fixed cost, a win–win situation will be achieved. Logistics service cost and transaction quantity are also concerned by service supply and demand enterprises, as with the price and quantity coordination of the product supply chain. Wang et al. [13] established a nonlinear mixed-integer multi-objective optimization model for service provider selection and order allocation in the mode of mass customization logistics service. Choi [14] explored a logistics service supply chain with which the logistics-service provider has to decide the reserved quantity of capacity to satisfy future demand in the upcoming season, which depends on whether market disruption occurs or not. Herold [15] provided new insights into the reactions and lessons learned, concerning the COVID-19 pandemic in terms of how logistics service providers managed to maintain supply chains’ resilience and what focused areas have been changed to keep operations functional and maintain financial stability. At present, the risk of the logistics service supply chain adopts the game theory, simulation model, and other methods to build a mathematical model of capacity to demonstrate the internal cooperation mechanism, which does not involve the resilient capability of the logistics service supply chain to deal with the risk of emergencies. This provides a research opportunity for this study.

2.2. Theory of Supply Chain Resilience

With the increasingly intensive global competition, enterprises are more vulnerable to the risk of unexpected events due to the fluctuation of the business environment, the change in management mode, and the complication of the supply chain network [16,17]. In recent years, research on the risk of the supply has become a prevalent topic. Empirical research and quantitative models are used as tools to analyze supply chain vulnerability and supply chain risk performance. Ruel et al. [18] observed an increase in the complexity and vulnerability of their supply chains as a result of global networks and a turbulent environment. Sharma et al. [19] investigated and prioritized the factors that are responsible for supply chain vulnerability. Parast and Subramanian [20] examined the relationship of supply chain disruption risk drivers and firm performance. Largely, the embedded resilient supply chain mechanism posits better preparation, faster response, and faster recovery [21], providing a new research direction for dealing with the uncertainty of emergency risk, and gradually becomes an important topic of supply chain management research.

2.3. Optimization of Supply Chain Resilience

Scholars first carried out in-depth studies on the resilience strategy of supply chain construction. Um and Han [22] theoretically hypothesized and empirically explored the relationships amongst global supply chain risks, supply chain resilience, and mitigating strategies. Nikookar and Yanadori [23] showed that supply chain managers’ social capital, human capital, and cognition are critical to the development of three organizational supply chain resilience antecedents: visibility, responsiveness, and flexibility, which subsequently enhance the firm’s supply chain resilience. Scholars have also conducted insightful studies on the game coordination of resilient cost and benefit. Shoja et al. [24] proposed a mixed-integer linear programming (MILP) model to analyze the efficiency of different delivery modes affecting the resilience of the entire supply chain. Delic et al. [25] studied the impact of supply chain resilience on supply chain performance in the context of the European automotive industry. Taleizadeh et al. [8] utilized a Stackelberg game approach for designing resilient supply chains under price competition and facilities disruption. Diehlmann et al. [26] created the game-theoretic model of Public-Private Emergency Collaborations that provides more detailed information into the motivation and incentives of the partners involved in emergency collaborations. In addition, some scholars have introduced simulations to study the effectiveness of the supply chain resilience management strategy under different supply and demand conditions [27].
According to the literature review, although abundant achievements have been made in the study of supply chain resilience, they mainly focused on the resilience mechanism of the product supply chain, and have not involved the logistics service supply chain resilience. As the logistics service supply chain is based on capacity coordination, which is quite different from the product supply chain, it significantly affects the formation and strengthening of the cooperative alliance. Therefore, this paper intends to introduce the “resilient capability” into the logistics service supply chain, discuss the evolution of the logistics service supply chain resilient system under the participation of the government, and build a long-term mechanism for responding to emergencies of the logistics service supply chain.

3. Model Establishment and Solution

3.1. Model Assumptions

The assumptions for the model describing the tripartite evolutionary game based on government participation, manufacturer support, and integrator operation are as follows Table 1:

3.2. Parameter Settings

According to the model premises and the key factors concerned by the government, manufacturers, and integrators in selecting their strategies, the model parameters are set. The meanings of each symbol are as follows:
D is the production scale of the manufacturer using the resilient supply chain (currency unit: CYN);
α is the proportion of the governments implementing the supervisory strategy for the resilient supply chain system;
β is the proportion of resilient supply chains in the manufacturer set;
γ is the proportion of implementing resilient logistics service supply chains in the integrator set;
φ 1 is the penalty rate of the government for the manufacturer not adopting resilient supply chains;
s is the penalty cost of the government for the integrator not implementing the resilient logistics service supply chains (currency unit: CNY);
c 1 is the cost of the government supervising whether the manufacturer adopts flexible supply chains (current unit: CNY);
c 2 is the cost of the government supervising whether the integrator implements resilient logistics service supply chains (currency unit: CNY);
c 3 is the cost of the manufacturer monitoring whether the integrator implements resilient logistics service supply chains (currency unit: CNY);
c 4 is the cost of implementing the resilient logistics service supply chains for the integrator (currency unit: CNY);
c 5 is the opportunity cost of the supply chains where the integrator does not implement resilient logistics services (currency unit: CNY);
g 1 is the social benefit when the integrator implements the resilient logistics service supply chains in the case of resilient supply chains (currency unit: CNY);
g 2 is the social benefit when the integrator implements the resilient logistics service supply chains in the case of nonresilient supply chains (currency unit: CNY);
g 3 is the social benefit when the integrator does not implement the resilient logistics service supply chains in the case of resilient supply chains (currency unit: CNY);
g 4 is the government social benefit when the integrator does not implement the resilient logistics service supply chains in the case of nonresilient supply chains (currency unit: CNY);
μ 1 is the subsidy rate of the government for the manufacturer adopting resilient supply chains;
μ 2 is the subsidy rate of the government for the integrator implementing the resilient logistics service supply chains;
m 1 is the income of the manufacturer when adopting the resilient supply chains strategy (currency unit: CNY);
m 2 is the income of the manufacturer who does not adopt the resilient supply chains strategy (currency unit: CNY);
l 1 is the income obtained by the integrator when implementing the resilient logistics service supply chains in the resilient supply chains (currency unit: CNY);
l 2 is the income obtained by the integrator when implementing the resilient logistics service supply chains in the case of nonresilient supply chains (currency unit: CNY);
l 3 is the income obtained when the integrator does not implement the resilient logistics service supply chains in the case of resilient supply chains (currency unit: CNY);
l 4 is the income obtained when the integrator does not implement the resilient logistics service supply chains in the case of nonresilient supply chains (currency unit: CNY).
The effective implementation of resilient supply chains under emergencies is the result of a dynamic game among the government, manufacturer, and integrator. According to the model premises, the strategic choices of the government (supervision or not), the manufacturer (adoption or not), and the integrators (implementation or not) are combined [28], as shown in Table 2. Taking ( x 1 , y 1 , z 1 ) as an example, when the government chooses the supervision strategy, the manufacturer chooses to adopt the resilient supply chains, and the integrator chooses to implement the resilient logistics service supply chains. The government income will be the social benefits when the integrator implements the resilient logistics service supply chains under the condition of resilient supply chains ( g 1 ), minus the government’s supervision costs ( c 1 and c 2 ) for the manufacturer and integrator, and minus the government’s subsidies ( μ 1 D and μ 2 c 4 ) for the manufacturer and integrator, namely, g 1 c 1 c 2 μ 1 D μ 2 c 4 . The manufacturer’s income will be its revenue when the integrator implements the resilient logistics service supply chains under the condition of resilient supply chains ( m 1 ), minus the manufacturer’s supervision cost ( c 3 ) for the integrator to implement the resilient logistics service supply chains, plus the government’s subsidy ( μ 1 D ) to the manufacturer, namely, m 1 c 3 + μ 1 D . The income of the integrator will be its revenue when implementing the resilient logistics service supply chains under the condition of resilient supply chains ( l 1 ), minus the cost of the integrator implementing the resilient logistics service supply chains ( c 4 ), plus the government subsidy to the integrator ( μ 2 c 4 ), namely, l 1 c 4 + μ 1 c 4 . Similarly, the game benefit of the government, manufacturer, and integrator can be derived, and the results are shown in Table 3.

4. Strategic Stability Analysis

The evolutionary game theory discusses the equilibrium of limited rational participants through replication dynamic analysis, which is helpful to draw a comprehensive conclusion and can avoid the defects of the complete rationality premise in traditional game theory [29,30].

4.1. Stability Analysis of Government Strategy

(1) Government equilibrium strategy
Assuming that the expected return of government supervision is E G 1 , the expected return of government nonsupervision is E G 2 , and the average expected return of government is E G , we can obtain:
E G 1 = β γ ( g 1 c 1 c 2 μ 1 D μ 2 c 4 ) + ( 1 β ) γ ( g 2 c 1 c 2 + φ 1 D μ 2 c 4 ) + β ( 1 γ ) ( g 3 c 1 c 2 μ 1 D + s ) + ( 1 β ) ( 1 γ ) ( g 4 c 1 c 2 + φ 1 D + s )
E G 2 = β γ g 1 + ( 1 β ) γ g 2 + β ( 1 γ ) g 3 + ( 1 β ) ( 1 γ ) g 4
E G = α E G 1 + ( 1 α ) E G 2 = α [ β γ ( g 1 c 1 c 2 μ 1 D μ 2 c 4 ) + ( 1 β ) γ ( g 2 c 1 c 2 + φ 1 D μ 2 c 4 ) + β ( 1 γ ) ( g 3 c 1 c 2 μ 1 D + s ) + ( 1 β ) ( 1 γ ) ( g 4 c 1 c 2 + φ 1 D + s ) ] + ( 1 α ) [ β γ g 1 + ( 1 β ) γ g 2 + β ( 1 γ ) g 3 + ( 1 β ) ( 1 γ ) g 4 ]
The dynamic equation and first derivative of government strategy replication are as follows:
F ( α ) = d α d t = α ( E G 1 E G ) = α ( 1 α ) [ ( 1 β ) φ 1 D + ( 1 γ ) s β μ 1 D γ μ 2 c 4 c 1 c 2 ]
When [ ( 1 β ) φ 1 D + ( 1 γ ) s β μ 1 D γ μ 2 c 4 c 1 c 2 ] = 0 , then all evolutionary choices of the government are stabilizing strategies. Thus, the threshold γ = [ ( 1 β ) φ 1 D + s β μ 1 D c 1 c 2 ] / ( μ 2 c 4 + s ) .
When [ ( 1 β ) φ 1 D + ( 1 γ ) s β μ 1 D γ μ 2 c 4 c 1 c 2 ] 0 and the threshold γ [ ( 1 β ) φ 1 D + s β μ 1 D c 1 c 2 ] / ( μ 2 c 4 + s ) , then α = 0 , α = 1 are the two stabilization points through the government strategy’s evolution. Finding the first derivative of F ( α ) , we can obtain:
d F ( α ) d α = ( 1 2 α ) [ ( 1 β ) φ 1 D + ( 1 γ ) s β μ 1 D γ μ 2 c 4 c 1 c 2 ]
When stabilizing conditions of evolutionary game d F ( α ) / d α < 0 , the analysis of the different values [ ( 1 β ) φ 1 D + ( 1 γ ) s β μ 1 D γ μ 2 c 4 c 1 c 2 ] is as follows:
(1) If [ φ 1 D + s c 1 c 2 ] < 0 , as 0 α 1 , 0 β 1 , 0 γ 1 , and [ ( 1 β ) φ 1 D + ( 1 γ ) s β μ 1 D γ μ 2 c 4 c 1 c 2 ] < 0 . When α = 1 , d F ( α ) / d α > 0 ; when α = 0 , d F ( α ) / d α < 0 . Thus, α = 0 is the stabilizing strategy for the evolutionary game.
(2) If [ φ 1 D + s c 1 c 2 ] > 0 and γ < [ ( 1 β ) φ 1 D + s β μ 1 D c 1 c 2 ] / ( μ 2 c 4 + s ) , when α = 0 , d F ( α ) / d α > 0 ; when α = 1 , d F ( α ) / d α < 0 . Thus, α = 1 is the stabilizing strategy for the evolutionary game.
(3) If [ φ 1 D + s c 1 c 2 ] > 0 and γ > [ ( 1 β ) φ 1 D + s β μ 1 D c 1 c 2 ] / ( μ 2 c 4 + s ) , when α = 0 , d F ( α ) / d α < 0 ; when α = 1 , d F ( α ) / d α > 0 . Thus, α = 0 is the stabilizing strategy for the evolutionary game.
To sum up, the phase diagram of governmental strategy selection is shown in Figure 1.
As can be seen from Figure 1, when the initial strategy choice of the government is within V α 1 , then [ φ 1 D + s c 1 c 2 ] < 0 and φ 1 D + s < c 1 + c 2 , the governmental benefits from punishing the manufacturers and integrators are less than the latter two’s supervision costs, and thus α = 0 is the stabilizing strategy. Therefore, when the governmental punishment income is less than the supervision cost, the government will choose the nonsupervision strategy. When the initial strategy choice of the government is within V α 2 , [ φ 1 D + s c 1 c 2 ] > 0 and φ 1 D + s > c 1 + c 2 , the governmental benefits from punishing the manufacturers and integrators are more than their supervision costs, and thus α = 1 is the stabilizing strategy. Therefore, when the governmental punishment income is more than the supervision cost, the government will choose the supervision strategy. According to the threshold γ = [ ( 1 β ) φ 1 D + s β μ 1 D c 1 c 2 ] / ( μ 2 c 4 + s ) , if the government subsidy parameter μ 1   μ 2 increases, the threshold γ will decrease. The downward movement of the cross-section leads to a space increase of V α 1 , that is, the greater the government’s subsidy coefficient to the manufacturers and integrators, the more the government’s “nonsupervision” strategy expands the scope of space. On the contrary, if the governmental supervision costs c 1   c 2 rise, the threshold γ cross-section moves downward and the space V α 2 decreases; namely, the higher the governmental supervision cost, the more spaces of the governmental “nonsupervision” strategy there will be, forming a cost pressure on the government to choose the “nonsupervision” strategy.
The above scenario is more in line with the reality of the development of the industrial chain and supply chain in some countries without external risks, simply focusing on economic benefits while ignoring security. The main reason for this situation is that the academia of management advocates for lean manufacturing and efficiency, simply relying on economic growth and the improvement of supply chain efficiency to indicate the development status of local government and enterprises [31,32]. As a result, relevant government departments may ignore social benefits to expand their achievements. They do not increase funds to support enterprises to implement the flexible operation but also do not punish enterprises for ignoring such social benefits. As a result, participating enterprises have neither external concerns about being punished for the loss of social benefits nor internal motivation to implement the resilient supply chains strategy.

4.2. Stability Analysis of Manufacturer’s Strategy

(1) Manufacturer equilibrium strategy
Assuming that the expected return of the manufacturer adopting the strategy is E M 1 , the expected return without adopting the strategy is E M 2 , and the average expected return of the government is E M , we can obtain:
E M 1 = α γ ( m 1 c 3 + μ 1 D ) + α ( 1 γ ) ( m 1 c 3 + μ 1 D ) + ( 1 α ) γ ( m 1 c 3 ) + ( 1 α ) ( 1 γ ) ( m 1 c 3 )
E M 2 = α γ ( 2 m 2 m 1 φ 1 D ) + α ( 1 γ ) ( 2 m 2 m 1 φ 1 D ) + ( 1 α ) γ ( 2 m 2 m 1 ) + ( 1 α ) ( 1 γ ) ( 2 m 2 m 1 )
E M = β E M 1 + ( 1 β ) E M 2 = β [ α γ ( m 1 c 3 + μ 1 D ) + α ( 1 γ ) ( m 1 c 3 + μ 1 D ) + ( 1 α ) γ ( m 1 c 3 ) + ( 1 α ) ( 1 γ ) ( m 1 c 3 ) ] + ( 1 β ) [ α γ ( 2 m 2 m 1 φ 1 D ) + α ( 1 γ ) ( 2 m 2 m 1 φ 1 D ) + ( 1 α ) γ ( 2 m 2 m 1 ) + ( 1 α ) ( 1 γ ) ( 2 m 2 m 1 ) ]
The dynamic equation and first derivative of the manufacturer strategy replication are as follows:
F ( β ) = d β d t = β ( E M 1 E M ) = β ( 1 β ) [ α ( μ 1 D + φ 1 D ) + 2 m 1 2 m 2 c 3 ]
When [ α ( μ 1 D + φ 1 D ) + 2 m 1 2 m 2 c 3 ] = 0 , then all evolutionary choices of the manufacturer are stabilizing strategies. Thus, the threshold α = [ 2 m 2 2 m 1 + c 3 ] / ( μ 1 D + φ 1 D ) . When [ α ( μ 1 D + φ 1 D ) + 2 m 1 2 m 2 c 3 ] 0 and the threshold α [ 2 m 2 2 m 1 + c 3 ] / ( μ 1 D + φ 1 D ) , then β = 0 , β = 1 are the two stabilization points through the governmental strategy’s evolution. Finding the first derivative of F ( β ) :
F ( β ) = d F ( β ) d β = ( 1 2 β ) [ α ( μ 1 D + φ 1 D ) + 2 m 1 2 m 2 c 3 ]
When stabilizing conditions of the evolutionary game F ( β ) < 0 , the analysis of the different values [ 2 m 2 + c 3 2 m 1 ] is as follows:
(1) If [ 2 m 2 + c 3 2 m 1 ] > ( μ 1 D + φ 1 D ) , as 0 α 1 , 0 β 1 , 0 γ 1 , and α > α . When β = 1 , d F ( β ) / d β > 0 ; when β = 0 , d F ( β ) / d β < 0 . Thus, β = 0 is the stabilizing strategy for the evolutionary game.
(2) If [ 2 m 2 + c 3 2 m 1 ] < ( μ 1 D + φ 1 D ) and α > α , when β = 1 , d F ( β ) / d β < 0 ; when β = 0 , d F ( β ) / d β > 0 . Thus, β = 1 is the stabilizing strategy for the evolutionary game. If [ 2 m 2 + c 3 2 m 1 ] < ( μ 1 D + φ 1 D ) and α < α , when β = 1 , d F ( β ) / d β > 0 ; when β = 0 , d F ( β ) / d β < 0 . Thus, β = 0 is the stabilizing strategy for the evolutionary game.
To sum up, the phase diagram of the manufacturer’s strategy selection is shown in Figure 2.
As can be seen from Figure 2, when the initial strategy choice of the manufacturers is within V β 1 , then [ 2 m 2 + c 3 2 m 1 ] > ( μ 1 D + φ 1 D ) and α > 1 , and thus β = 0 is the stabilizing strategy for the evolutionary game, namely, the manufacturers do not choose the resilient supply chain strategy. Therefore, when the profit of adopting the resilient supply chain strategy is less than that of no adoption, the manufacturers will choose not to adopt the resilient supply chain strategy. However, when the initial strategy choice of the manufacturers is within V β 2 , then [ 2 m 2 + c 3 2 m 1 ] < ( μ 1 D + φ 1 D ) and α < 1 , and thus β = 1 is the stabilizing strategy for the evolutionary game, namely, the government’s benefits from punishing the manufacturers and integrators are more than the cost of monitoring them, and thus, α = 1 is the stabilizing strategy, which means that the manufacturers will adopt the resilient supply chains strategy. Therefore, if the manufacturers adopt the resilient supply chain strategy, the profit will be higher than that without it. As a threshold α = [ 2 m 2 + c 3 2 m 1 ] / ( μ 1 D + φ 1 D ) , if the government subsidy parameter μ 1 and penalty coefficient φ 1 increase, the threshold α will decrease. The cross-section moves leftward, leading to a space decrease V β 1 , which indicates that the greater the government subsidy and penalty to the manufacturers, the higher the manufacturer’s willingness to choose the resilient scheme. If the manufacturer’s supervision cost of implementing the resilient logistics services to integrators increases ( c 3 ), the threshold α will increase. The cross-section moves rightward, leading to a space increase V β 1 , which indicates that the greater the manufacturer’s supervision cost, the lower the manufacturer’s willingness to choose the resilient schemes. To sum up, which strategy manufacturers adopt relies on whether it can help maximize the revenue, which in turn implies why it is not effective to implement the resilient supply chain merely based on economic benefit.

4.3. Stability Analysis of Integrator’s Strategy

(1) Integrator equilibrium strategy
Assuming that the integrator’s expected return from implementing the strategy is E I 1 , the expected return from not implementing the strategy is E I 2 , and the integrator’s average expected return is E I , we can obtain:
E I 1 = α β ( l 1 c 4 + μ 1 c 4 ) + α ( 1 β ) ( l 2 c 4 + μ 1 c 4 ) + ( 1 α ) β ( l 1 c 4 ) + ( 1 α ) ( 1 β ) ( l 2 c 4 )
E I 2 = α β ( l 3 c 5 s ) + α ( 1 β ) ( l 4 c 5 s ) + ( 1 α ) β ( l 3 c 5 ) + ( 1 α ) ( 1 β ) ( l 4 c 5 )
E I = γ E I 1 + ( 1 γ ) E I 2 = γ [ α β ( l 1 c 4 + μ 1 c 4 ) + α ( 1 β ) ( l 2 c 4 + μ 1 c 4 ) + ( 1 α ) β ( l 1 c 4 ) + ( 1 α ) ( 1 β ) ( l 2 c 4 ) ] + ( 1 γ ) [ α β ( l 3 c 5 s ) + α ( 1 β ) ( l 4 c 5 s ) + ( 1 α ) β ( l 3 c 5 ) + ( 1 α ) ( 1 β ) ( l 4 c 5 ) ]
The dynamic equation and first derivative of integrator strategy replication are as follows:
F ( γ ) = d γ d t = γ ( E I 1 E I ) = γ ( 1 γ ) [ c 5 c 4 + β ( l 1 l 3 ) + ( 1 β ) ( l 2 l 4 ) + α ( μ 2 c 4 + s ) ]
When [ c 5 c 4 + β ( l 1 l 3 ) + ( 1 β ) ( l 2 l 4 ) + α ( μ 2 c 4 + s ) ] = 0 , then the evolutionary choices of integrators are stabilizing strategies. Thus, the threshold β = [ c 4 c 5 + l 4 l 2 α ( μ 2 c 4 + s ) ] / ( l 1 + l 4 l 2 l 3 ) . When [ c 5 c 4 + β ( l 1 l 3 ) + ( 1 β ) ( l 2 l 4 ) + α ( μ 2 c 4 + s ) ] 0 and the threshold β [ c 4 c 5 + l 4 l 2 α ( μ 2 c 4 + s ) ] / ( l 1 + l 4 l 2 l 3 ) , then γ = 0 , γ = 1 are the two stabilization points through the integrator strategy’s evolution. Finding the first derivative of F ( γ ) , we can obtain:
F ( γ ) = d F ( γ ) d γ = ( 1 2 γ ) [ c 5 c 4 + β ( l 1 l 3 ) + ( 1 β ) ( l 2 l 4 ) + α ( μ 2 c 4 + s ) ]
When stabilizing conditions of the evolutionary game F ( γ ) < 0 , the analysis of different values [ c 5 c 4 + β ( l 1 l 3 ) + ( 1 β ) ( l 2 l 4 ) + α ( μ 2 c 4 + s ) ] is as follows:
(1) If μ 2 c 4 + s < c 4 c 5 + l 3 l 1 , as 0 α 1 , 0 β 1 , 0 γ 1 , l 2 < l 4 , and [ c 5 c 4 + β ( l 1 l 3 ) + ( 1 β ) ( l 2 l 4 ) + α ( μ 2 c 4 + s ) ] < 0 . When γ = 1 , d F ( γ ) / d γ > 0 ; when γ = 0 , d F ( γ ) / d γ < 0 . Thus, γ = 0 is the stabilizing strategy for the evolutionary game.
(2) If μ 2 c 4 + s > c 4 c 5 + l 3 l 1 and β > β , when γ = 1 , d F ( γ ) / d γ < 0 ; when γ = 0 ,   d F ( γ ) / d γ > 0 . Thus, γ = 1 is the stabilizing strategy. If μ 2 c 4 + s > c 4 c 5 + l 3 l 1 and β < β , when γ = 1 , d F ( γ ) / d γ > 0 ; when γ = 0 , d F ( γ ) / d γ < 0 . Thus, β = 0 is the stabilizing strategy.
To sum up, the phase diagram of the integrator’s strategy selection is shown in Figure 3.
As can be seen from Figure 3, when the initial strategy choice of the integrators is within V γ 1 , then μ 2 c 4 + s < c 4 c 5 + l 3 l 1 , and thus γ = 0 is the stabilizing strategy, namely, integrators do not implement the resilient logistics service supply chain. Under the situation of the governmental participation and manufacturer’s adoption of the resilient supply chain, if the integrators’ income from implementing the strategy is less than that from no implementation, the integrator will eventually choose not to implement the resilient logistics service. However, when the initial strategic choice of the integrators is within V γ 2 , then μ 2 c 4 + s > c 4 c 5 + l 3 l 1 , [ c 5 c 4 + β ( l 1 l 3 ) + ( 1 β ) ( l 2 l 4 ) + α ( μ 2 c 4 + s ) ] > 0 , and thus γ = 1 is the stabilizing strategy, namely, the integrator implements the resilient logistics service supply chain. In the context of the governmental participation and manufacturer’s adoption of the resilient supply chain, if the integrators’ income from implementing the strategy is greater than that from no implementation, the integrator will eventually choose to implement the resilient logistics service. As the threshold is [ c 5 c 4 + β ( l 1 l 3 ) + ( 1 β ) ( l 2 l 4 ) + α ( μ 2 c 4 + s ) ] , if μ 1 increases, the threshold γ will decrease. The decreasing space V γ 1 in Figure 3 shows that when the government subsidy to the integrator is higher, more integrators tend to choose the resilient logistics service supply chain. If s increases, the threshold γ will decrease. The increasing space V γ 2 shows that the more the government punishes the integrators, the more the integrators tend to choose the resilient logistics service supply chain. Similarly, the smaller c 4 and c 5 are, namely, the lower the cost of implementing resilient logistics, the more the integrators tend to implement resilient logistics services.

4.4. Stability Analysis of Strategy Combination of the Participants

In addition to the analyses above, the strategic combination of the three players is analyzed integrally. According to the dynamic trend of the three participants, the space can be divided into eight equilibrium states, and each equilibrium state is sensitive to small disturbances. The tripartite game has no strict Nash equilibrium solution (pure equilibrium strategy solution), as shown in Table 4.
When the initial state is at the intersection of V α 2 , V β 2 , and V γ 2 , the strategy of the participants will be in equilibrium (1, 1, 1); when the government only carries out the ‘supervision’ strategy, the manufacturer will adopt the resilient supply chain, and the integrator will implement the resilient logistics service supply chain. The above conclusions are consistent with the current real situation of industrial chain and supply chain logistics in developing countries. As building such resilient supply chains in these countries and regions in the case of emergencies is largely at an initial stage, the government needs to take necessary interventions [33]. In the short term, when the initial state is at the intersection of V α 2 , V β 1 , and V γ 1 , the participants converge to (1,0,0). Although the government implements the ‘supervision’ strategy, and the manufacturers and integrators have not seen the operating income of the resilient supply chain and resilient logistics in the short term, even if the government takes the ‘supervision’ strategy in the initial state, the manufacturers and integrators still choose not to adopt or implement the strategy. Therefore, for effective intervention in the short term, the government can take effective reward and punishment measures to encourage the manufacturers and integrators to actively build a resilient supply chain system. In the long run, when the initial state is at the intersection of V α 1 , V β 2 , and V γ 2 , the participants converge to the equilibrium state of (1,0,0). Due to the emergencies’ continuous effect on the supply chains, to ensure long-term benefits, even without the participation of the government, manufacturers and integrators will eventually take the initiative to adopt the adoption strategy, which is also the inevitable trend of supply chain development in a risky societal environment.

5. Example Analysis

In this paper, numeric experiments are used to analyze the impact of the initial proportion of each subject selection strategy in the logistics service supply chain and the change in government reward and punishment parameters with the evolution. This section is carried out via the software MATLAB 2017a. To verify the feasibility and effectiveness of the model and avoid the bias of specific examples influencing the model’s reliability, the basic parameters are set randomly within the constraints of the parameter relationship in Section 3.2. The details are as follows: D = 100 , c 1 = 2 , c 2 = 2 , c 3 = 5 , c 4 = 7 , c 5 = 9 , μ 1 = 0.2 , μ 2 = 0.1 , φ 1 = 0.3 , s = 30 , m 1 = 40 , m 2 = 50 , l 1 = 30 , l 2 = 35 , l 3 = 47 , l 4 = 42 , and λ = 0.2 . According to these parameters, the overall experimental environment for resilient coordination decision-making of logistics service supply chains with government participation is established, and the sensitivity is adopted to further analyze the impact on resilient decision-making if the government changes the subsidy and penalty degree.

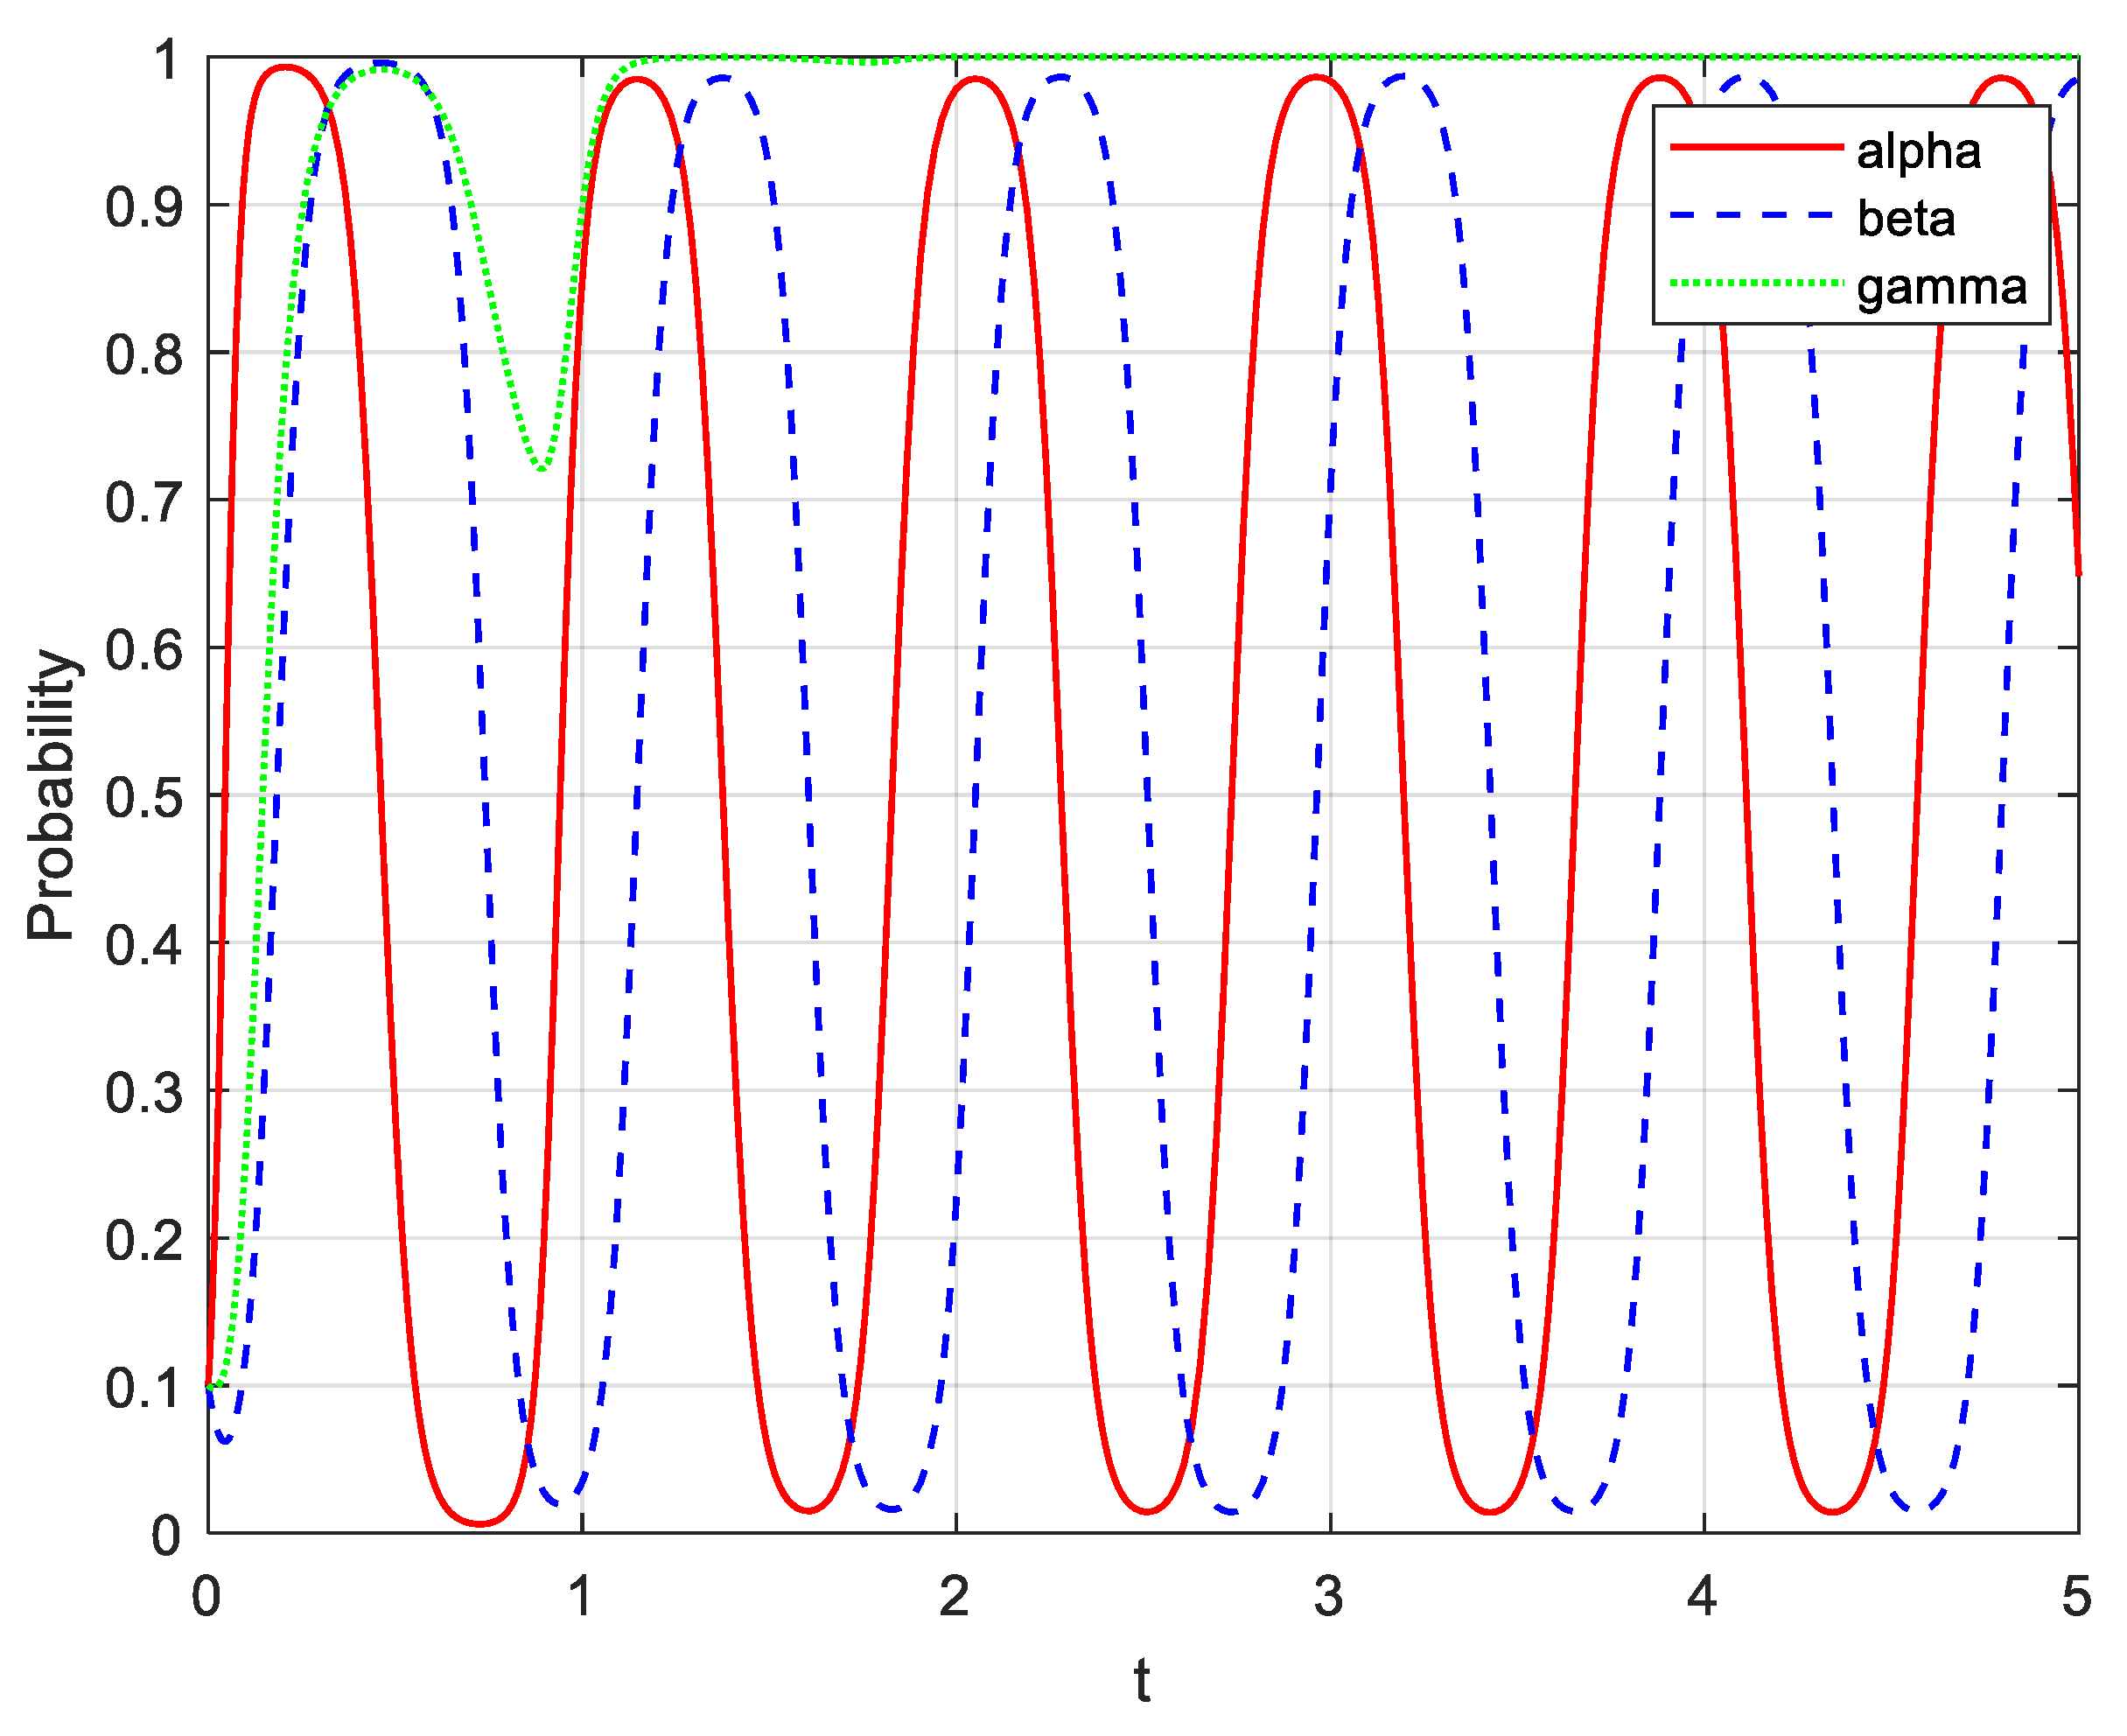
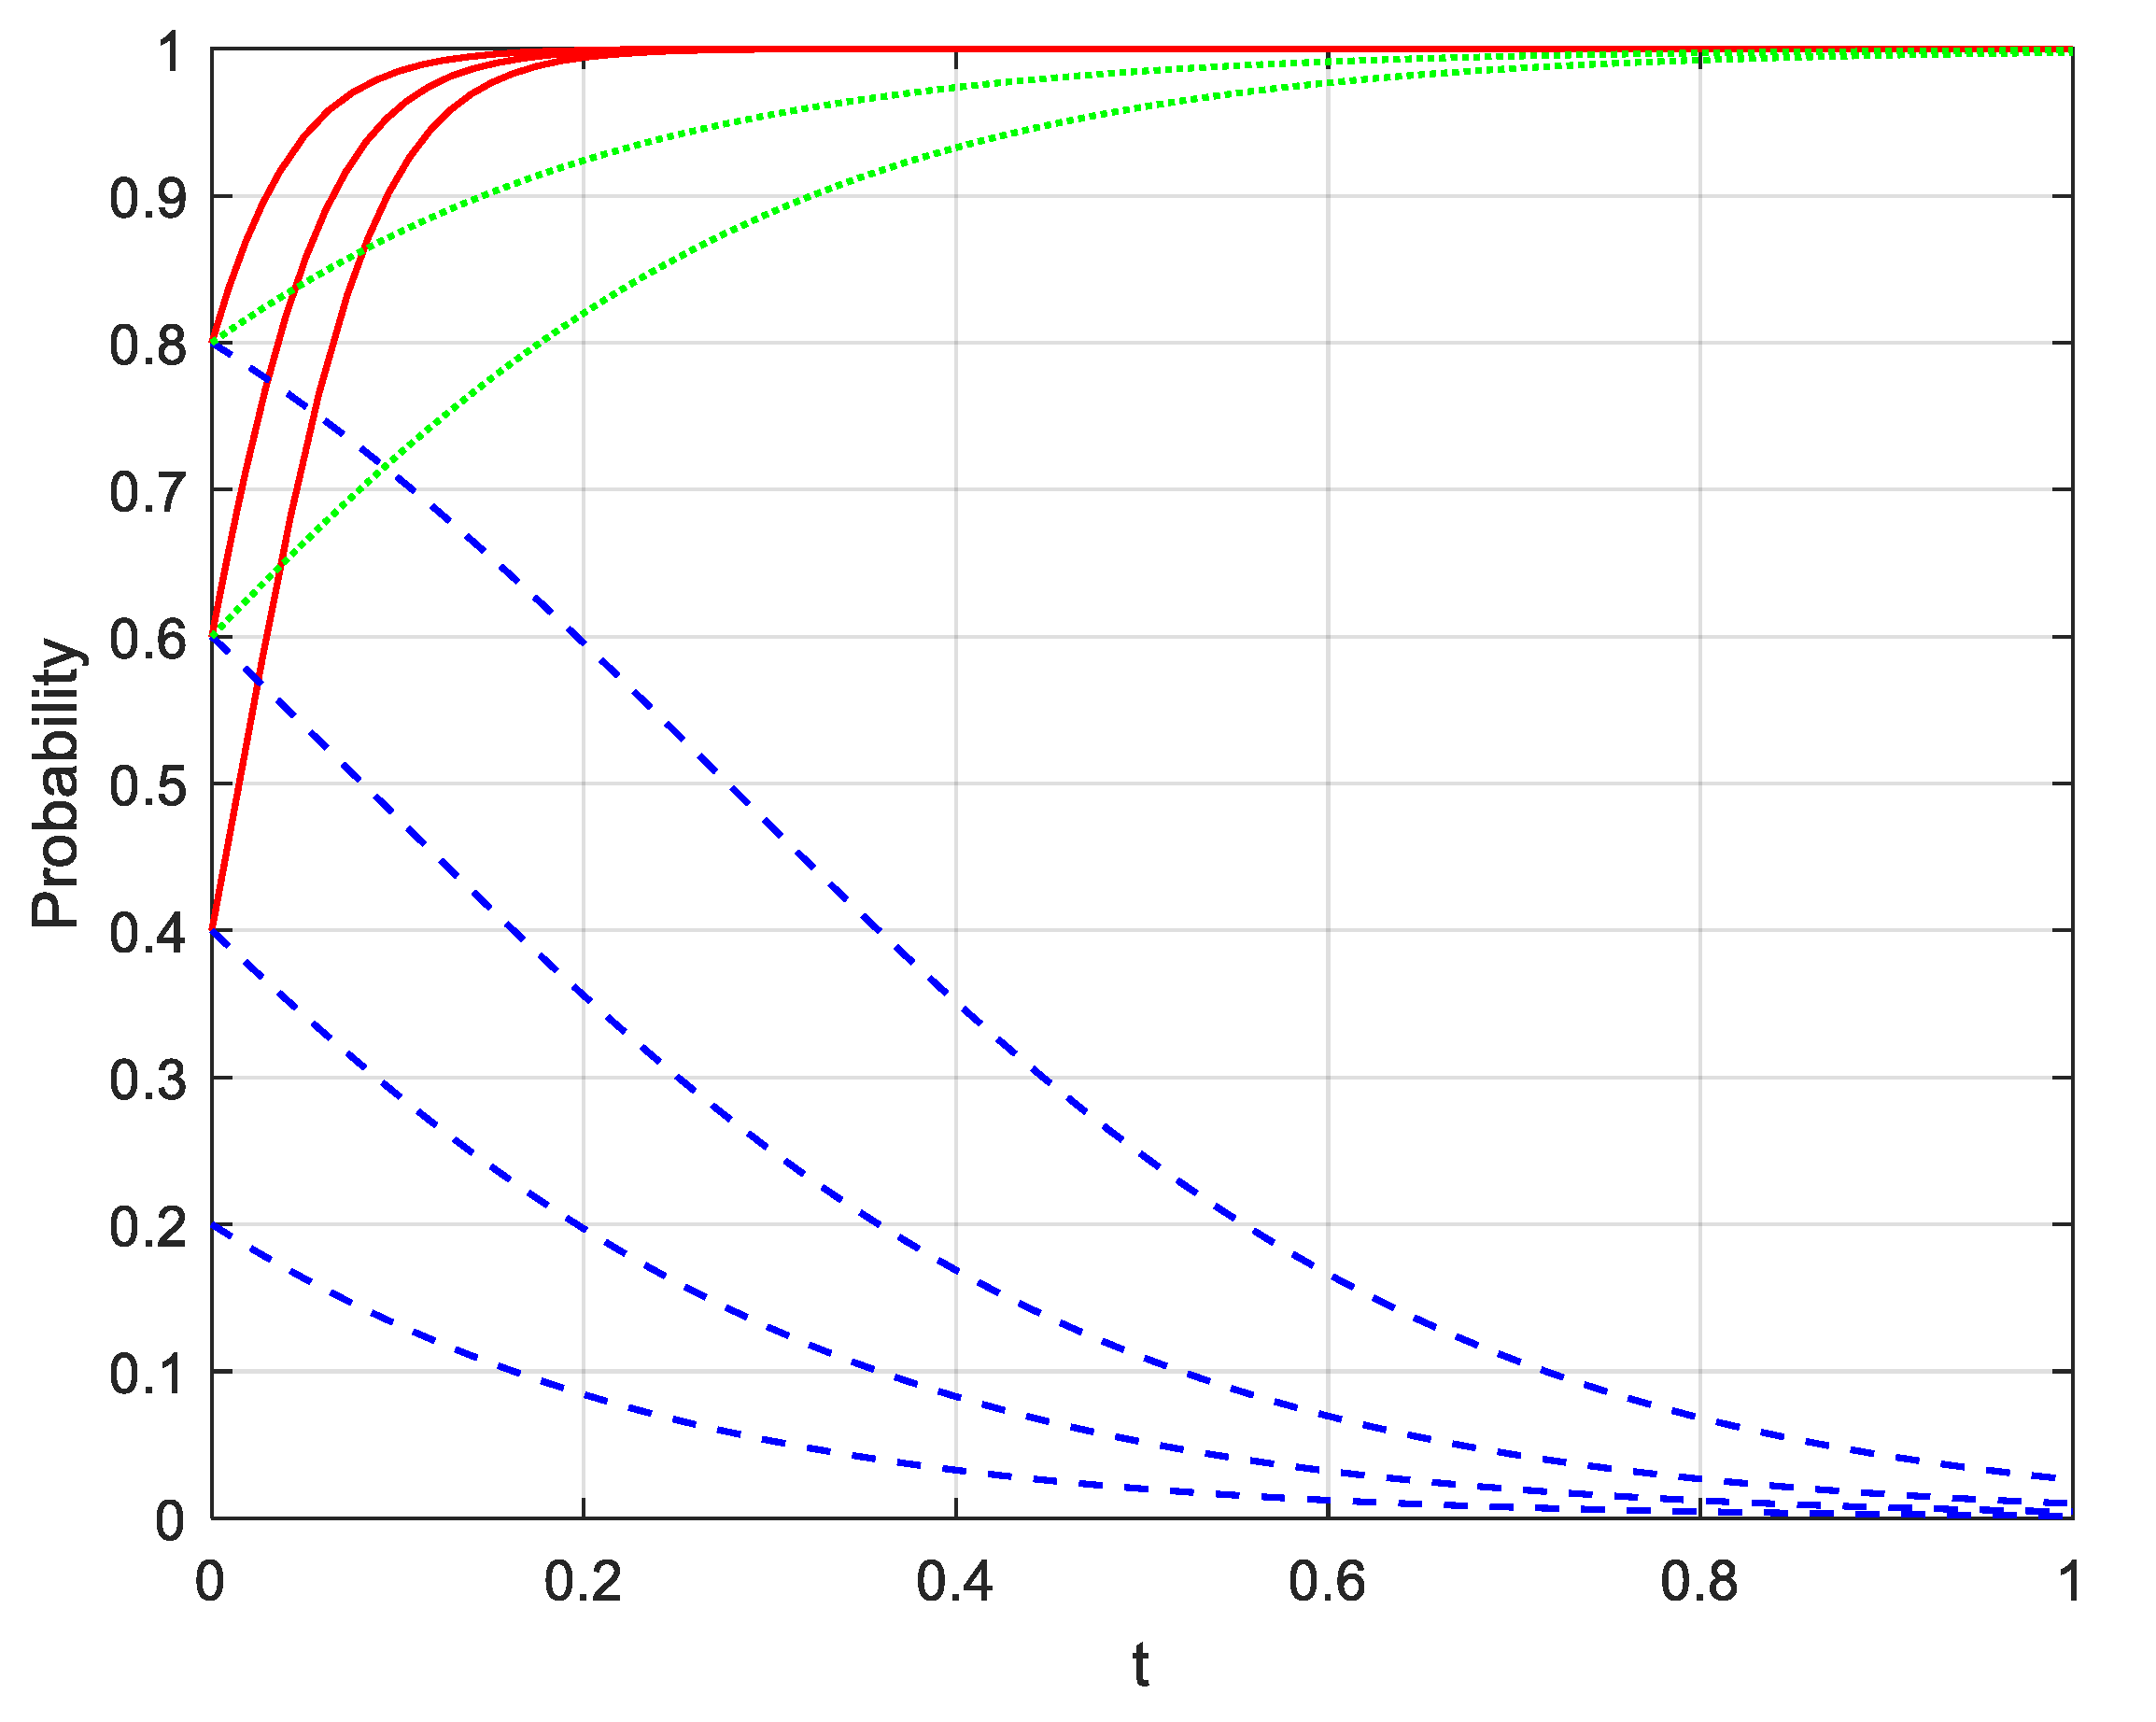
5.1. Influence of Initial Proportion of Selection Strategy on Evolution Results

(1) Participant strategy selection with a fixed initial value
As mentioned above, α , β , and γ respectively represent the initial proportion of governmental supervision strategy, the manufacturer’s resilient supply chains strategy, and the integrator’s resilient logistics service supply chain strategy. The fixed initial values are α = 0.1 , β = 0.1 , and γ = 0.1 , respectively. As shown in Figure 4, with the mutual influence through the evolution between the government, manufacturers, and integrators, the equilibrium convergence of each subject is not only related to the initial proportion of their selection but also affected by the initial proportion of the manufacturers’ and integrators’ strategy selection. Meanwhile, the probability of the three parties participating in the evolution is similar to a certain periodic fluctuation, and the equilibrium state cannot be achieved all the time. It shows that there is no stable point in the tripartite evolutionary game.
(2) Influence of initial proportion change on participant selection
With the initial values that α = 0.1 , β = 0.2 , and γ = 0.2 , Figure 2 shows that in different initial states, only considering the change in initial state, the government, manufacturers, and integrators choose the equilibrium strategy without considering the later interaction of the three parties. Consistent with the previous comprehensive conclusion, there are eight different equilibrium results for participants in different initial game states [34]. Figure 5 shows that when the initial government supervision is low, the manufacturers and integrators have relatively little external pressure. Even if the government supervision is significantly increased later, they will still choose not to adopt or implement the strategy. On the contrary, when the government initially adopts high-level supervision, that is, the initial proportion of supervision is adjusted from 0.1 to 0.6, the manufacturers and integrators are under high-level pressure (Figure 6). Manufacturers thus tend to implement the resilient supply chains strategy, while integrators prefer to implement the resilient logistics service supply chains strategy. Even if the government regulation is aborted later, the manufacturers and integrators will intentionally implement resilient supply chains.

5.2. Impact of Governmental Participation on the Evolution

This part kept other parameters unchanged to investigate the evolutionary impact of the government on the change in integrator subsidy and penalty. The initial proportion of the government group supervision strategy is α = 0.4 , the initial proportion of the manufacturers adopting the resilient supply chains is β = 0.2 , and the initial proportion of integrators implementing the resilient logistics service supply chains is γ = 0.6 . Figure 7 shows the implementation of the original government subsidy coefficient φ 1 = 0.3 and punishment amount s = 30 . Under this circumstance, the integrator does not tend to implement the resilient logistics service strategy, the manufacturer does not tend to adopt the resilient supply chains strategy, and the government chooses the supervision strategy; the strategy combination is (1, 0, 0). After adjusting the government subsidy coefficient φ 1 = 0.6 and penalty amount s = 40 (Figure 8), the integrator finally tends to implement the resilient logistics service supply chains, and the manufacturer tends to adopt the resilient supply chains. The government still chooses the supervision strategy, that is, the strategic combination is (1, 1, 1). This shows that when the government increases the integrators’ subsidy coefficient and punishment degree, the integrator chooses to implement the resilient logistics service supply chain to lower costs and increase revenue. It can be seen that the final equilibrium strategy of participants can be changed by adjusting the parameter value to realize the sustainable development of the resilient supply chains [35,36], which provides the basis for relevant governmental policies.

6. Conclusions and Implications

6.1. Conclusions

Resilient logistics service supply chains are an effective measure for manufacturers and integrators to deal with the challenges in an increasingly adverse and risky business environment, and governmental supervision and guidance is a vital premise for its steady implementation [37,38]. Aiming at the problem of realizing the resilient decision-making of logistics service supply chains in the environment with crises, this paper develops a tripartite asymmetric model of government, manufacturers, and integrators, and deploys evolutionary game theory to analyze the resilient decision-making of participants for the optimal income under limited rationality. The results show that in the short term, regardless of what reward and punishment measure the government chooses, manufacturers and integrators will choose not to adopt and implement the resilient logistics service supply chains, while in the long term, manufacturers and integrators will proactively choose to adopt and implement without government supervision. Moreover, the government reward and punishment, as well as the manufacturer’s resilient supply chains strategy, are the decisive factors for the integrators to implement resilient logistics in the long run.

6.2. Managerial Implications

In an era with considerable uncertainties, building resilient logistics service supply chains needs policy, technology, and management support, which will have to involve the government, manufacturers, integrators, and other stakeholders [39,40]. Compared to the supply chain enterprises’ direct implementation of mandatory measures or conventional measures such as subsidies, this paper involves governmental policies and the main players’ behavior, and analyzes the evolutionary game mechanism of how the government, manufacturers, and integrators adopt the resilient supply chains, generating managerial implications as follows:
(1) It can be seen from the stability analysis of government strategy in Section 4.1 that under the situation of various risks, government departments cannot simply focus on economic benefits and ignore potential risks. Building a resilient logistics service supply chain requires the government to explore the cooperative relationship with manufacturers, integrators, and other enterprises, as well as seek the horizontal balance of the participants. The government should also urge the manufacturers to adopt the resilient supply chain and the integrators to implement the resilient logistics service supply chain. Meanwhile, government departments are also required to implement diversified assessment standards for the companies involved [41], incorporate the indicators of social security into the evaluation system, increase the proportion of benefits for the social security, reduce the proportion of economic growth assessment, and promote the improvement of governance capacity.
(2) According to the manufacturer stability analysis in Section 4.2, it is not reasonable that the manufacturer decides to maximize revenue while maintaining the resilient supply chains with less economic performance [42]. According to the analysis in Section 5.1, we can guide manufacturers to choose a resilient supply chain strategy by improving the governmental initial supervision, adopting resilient supply chain subsidies and relevant punishment, compensating manufacturers’ redundant production, and reducing manufacturers’ supervision costs.
(3) Similarly, the integrator evolution strategy in Section 4.2 also determines its final strategy based on revenue. Through the analysis of Section 5.2, the government can improve the integrators’ enthusiasm for resilient logistics service supply chains by improving the subsidy rate of implementing resilient logistics service supply chains, strengthening nonimplementation punishment, and reducing implementation costs.

6.3. Research Limitations and Future Directions

Compared with previous studies that only considered the game between two parties, although this study develops an evolutionary model of the resilient logistics service supply chain to deal with crises among three parties, the impacts of crises often involve more in reality, such as supply, operation, and demand, especially in the presence of the commitment of different governments. Thus, it is necessary to interpret the complexity and dynamics of strategies from the perspective of the overall system and consider the complexity of crises. In further studies, system dynamics can be used to disentangle the comprehensive impacts of resilient logistics and supply chains. Vensim PLE v5.4B software can be used to simulate for exploring the crisis and its impact on the performance of a resilient system, facilitating the development of risk management measures.

Author Contributions

Conceptualization, G.Z. and X.W.; methodology, G.Z.; software, Y.W.; formal analysis, J.K.; writing—original draft preparation, G.Z.; writing—review and editing, X.W. All authors have read and agreed to the published version of the manuscript.

Funding

This research was funded by The National Social Science Foundation of China, grant number 21BJY227.

Institutional Review Board Statement

Not applicable.

Informed Consent Statement

Not applicable.

Data Availability Statement

Not applicable.

Acknowledgments

We would like to be grateful to the editors and anonymous referees for their valuable comments.

Conflicts of Interest

The authors declare no conflict of interest.

References

  1. Ho, W.; He, T.; Lee, C.K.M.; Emrouznejad, A. Strategic logistics outsourcing: An integrated QFD and fuzzy AHP approach. Expert Syst. Appl. 2009, 39, 10841–10850. [Google Scholar] [CrossRef]
  2. Giri, B.C.; Sarker, B. Improving performance by coordinating a supply chain with third party logistics outsourcing under production disruption. Comput. Ind. Eng. 2017, 103, 168–177. [Google Scholar] [CrossRef]
  3. Liu, W.; Liu, Y.; Zhu, D.; Wang, Y.; Liang, Z. The influences of demand disruption on logistics service supply chain coordination: A comparison of three coordination modes. Int. J. Prod. Econ. 2016, 179, 59–76. [Google Scholar] [CrossRef]
  4. Govindan, K.; Azevedo, S.G.; Carvalho, H.; Machado, V. Impact of supply chain management practices on sustainability. J. Clean. Prod. 2014, 85, 212–225. [Google Scholar] [CrossRef]
  5. Chopra, S.; Sodhi, M. Reducing the Risks of Supply Chain Disruptions. MIT Sloan Manag. Rev. 2014, 55, 73–80. [Google Scholar]
  6. Thomé, A.M.T.; Scavarda, L.F.; Scavarda, A.; Thomé, F.E.S.D.S. Similarities and contrasts of complexity, uncertainty, risks, and resilience in supply chains and temporary multi-organization projects. Int. J. Proj. Manag. 2015, 34, 1328–1346. [Google Scholar] [CrossRef]
  7. Sharma, M.; Luthra, S.; Joshi, S.; Kumar, A. Developing a framework for enhancing survivability of sustainable supply chains during and post-COVID-19 pandemic. Int. J. Logist. Res. Appl. 2020, 8, 1–21. [Google Scholar] [CrossRef]
  8. Taleizadeh, A.A.; Ghavamifar, A.; Khosrojerdi, A. Resilient network design of two supply chains under price competition: Game theoretic and decomposition algorithm approach. Oper. Res. 2020, 4, 1–33. [Google Scholar] [CrossRef]
  9. Sabouhi, F.; Jabalameli, M.S.; Jabbarzadeh, A. An optimization approach for sustainable and resilient supply chain design with regional considerations. Comput. Ind. Eng. 2021, 159, 107510. [Google Scholar] [CrossRef]
  10. Liu, W.; Wang, M.; Zhu, D.; Zhou, L. Service capacity procurement of logistics service supply chain with demand updating and loss-averse preference. Appl. Math. Model. 2019, 66, 486–507. [Google Scholar] [CrossRef]
  11. Zhang, G.; Wang, X.; Gao, Z.; Xiang, T. Research on Risk Diffusion Mechanism of Logistics Service Supply Chain in Urgent Scenarios. Math. Probl. Eng. 2020, 2020, 1–12. [Google Scholar] [CrossRef]
  12. Lou, Y.; Feng, L.; He, S.; He, Z.; Zhao, X. Logistics service outsourcing choices in a retailer-led supply chain. Transp. Res. Part E Logist. Transp. Rev. 2020, 141, 101944. [Google Scholar] [CrossRef]
  13. Wang, G.; Hu, X.; Li, X.; Zhang, Y.; Feng, S.; Yang, A. Multiobjective decisions for provider selection and order allocation considering the position of the CODP in a logistics service supply chain. Comput. Ind. Eng. 2020, 140, 106216. [Google Scholar] [CrossRef]
  14. Choi, T.-M. Facing market disruptions: Values of elastic logistics in service supply chains. Int. J. Prod. Res. 2021, 59, 286–300. [Google Scholar] [CrossRef]
  15. Herold, D.M.; Nowicka, K.; Pluta-Zaremba, A.; Kummer, S. COVID-19 and the pursuit of supply chain resilience: Reactions and “lessons learned” from logistics service providers (LSPs). Supply Chain Manag. Int. J. 2021, 26, 702–714. [Google Scholar] [CrossRef]
  16. Deng, Y.; Jiang, M.; Ling, C. An improved diffusion model for supply chain emergency in uncertain environment. Soft Comput. 2020, 24, 6385–6394. [Google Scholar] [CrossRef]
  17. Wu, S.; Li, Q. Emergency Quantity Discount Contract with Suppliers Risk Aversion under Stochastic Price. Mathematics 2021, 9, 1791. [Google Scholar] [CrossRef]
  18. Ruel, S.; Shaaban, S.; Ducros, M. Supply chain vulnerability: Contributions from an edifying case study. J. Enterp. Inf. Manag. 2019, 32, 214–232. [Google Scholar] [CrossRef]
  19. Sharma, S.K.; Srivastava, P.R.; Kumar, A.; Jindal, A.; Gupta, S. Supply chain vulnerability assessment for manufacturing industry. Ann. Oper. Res. 2021. [Google Scholar] [CrossRef]
  20. Parast, M.M.; Subramanian, N. An examination of the effect of supply chain disruption risk drivers on organizational performance: Evidence from Chinese supply chains. Supply Chain Manag. Int. J. 2021, 26, 548–562. [Google Scholar] [CrossRef]
  21. Burin, A.R.G.; Arostegui, M.N.P.; Llorens-Montes, J. Ambidexterity and IT competence can improve supply chain flexibility? A resource orchestration approach. J. Purch. Supply Manag. 2020, 26, 100610. [Google Scholar] [CrossRef]
  22. Um, J.; Han, N. Understanding the relationships between global supply chain risk and supply chain resilience: The role of mitigating strategies. Supply Chain Manag. Int. J. 2020, 26, 240–255. [Google Scholar] [CrossRef]
  23. Nikookar, E.; Yanadori, Y. Preparing supply chain for the next disruption beyond COVID-19: Managerial antecedents of supply chain resilience. Int. J. Oper. Prod. Manag. 2021, 42, 59–90. [Google Scholar] [CrossRef]
  24. Shoja, A.; Molla-Alizadeh-Zavardehi, S.; Niroomand, S. Adaptive meta-heuristic algorithms for flexible supply chain network design problem with different delivery modes. Comput. Ind. Eng. 2019, 138, 106107. [Google Scholar] [CrossRef]
  25. Delic, M.; Eyers, D.R. The effect of additive manufacturing adoption on supply chain flexibility and performance: An empirical analysis from the automotive industry. Int. J. Prod. Econ. 2020, 228, 107689. [Google Scholar] [CrossRef]
  26. Diehlmann, F.; Lüttenberg, M.; Verdonck, L.; Wiens, M.; Zienau, A.; Schultmann, F. Public-private collaborations in emergency logistics: A framework based on logistical and game-theoretical concepts. Saf. Sci. 2021, 141, 105301. [Google Scholar] [CrossRef]
  27. Rajesh, R. Flexible business strategies to enhance resilience in manufacturing supply chains: An empirical study. J. Manuf. Syst. 2020, 44, 903–919. [Google Scholar] [CrossRef]
  28. Sun, S.; Yang, H.; Yang, G.; Pi, J. Evolutionary Games and Dynamics in Public Goods Supply with Repetitive Actions. Mathematics 2021, 9, 1726. [Google Scholar] [CrossRef]
  29. Zhi, B.; Liu, X.; Chen, J.; Jia, F. Collaborative carbon emission reduction in supply chains: An evolutionary game-theoretic study. Manag. Decis. 2019, 57, 1087–1107. [Google Scholar] [CrossRef]
  30. Chen, M.-H.; Wei, H.; Wei, M.; Huang, H.; Su, C.-H. Modeling a green supply chain in the hotel industry: An evolutionary game theory approach. Int. J. Hosp. Manag. 2020, 92, 102716. [Google Scholar] [CrossRef]
  31. Singh, R.K.; Gupta, A.; Gunasekaran, A. Analysing the interaction of factors for resilient humanitarian supply chain. Int. J. Prod. Res. 2018, 56, 6809–6827. [Google Scholar] [CrossRef]
  32. Zhan, Y.; Chen, K.Z. Building resilient food system amidst COVID-19: Responses and lessons from China. Agric. Syst. 2021, 190, 103102. [Google Scholar] [CrossRef]
  33. Lei, S.; Chen, C.; Li, Y.; Hou, Y. Resilient Disaster Recovery Logistics of Distribution Systems: Co-Optimize Service Restoration With Repair Crew and Mobile Power Source Dispatch. IEEE Trans. Smart Grid 2019, 10, 6187–6202. [Google Scholar] [CrossRef] [Green Version]
  34. Xing, X.-H.; Hu, Z.-H.; Luo, W.-P. Using evolutionary game theory to study governments and logistics companies’ strategies for avoiding broken cold chains. Ann. Oper. Res. 2020, 2, 1–29. [Google Scholar] [CrossRef]
  35. Li, C.; Zhang, F.; Cao, C.; Liu, Y.; Qu, T. Organizational coordination in sustainable humanitarian supply chain: An evolutionary game approach. J. Clean. Prod. 2019, 219, 291–303. [Google Scholar] [CrossRef] [Green Version]
  36. Zhang, X.; Zhou, G.; Cao, J.; Wu, A. Evolving strategies of e-commerce and express delivery enterprises with public supervision. Res. Transp. Econ. 2020, 80, 100810. [Google Scholar] [CrossRef]
  37. Kaur, H.; Singh, S.P. Disaster resilient proactive and reactive procurement models for humanitarian supply chain. Prod. Plan. Control 2020, 10, 1–14. [Google Scholar] [CrossRef]
  38. Yavari, M.; Zaker, H. Designing a resilient-green closed loop supply chain network for perishable products by considering disruption in both supply chain and power networks. Comput. Chem. Eng. 2020, 134, 106680. [Google Scholar] [CrossRef]
  39. Al-Refaie, A.; Al-Tahat, M.; Lepkova, N. Modelling relationships between agility, lean, resilient, green practices in cold supply chains using ism approach. Technol. Econ. Dev. Econ. 2020, 26, 675–694. [Google Scholar] [CrossRef]
  40. Razavian, E.; Tabriz, A.A.; Zandieh, M.; Hamidizadeh, M.R. An integrated material-financial risk-averse resilient supply chain model with a real-world application. Comput. Ind. Eng. 2021, 161, 107629. [Google Scholar] [CrossRef]
  41. Sharma, H.B.; Vanapalli, K.R.; Cheela, V.S.; Ranjan, V.P.; Jaglan, A.K.; Dubey, B.; Goel, S.; Bhattacharya, J. Challenges, opportunities, and innovations for effective solid waste management during and post COVID-19 pandemic. Resour. Conserv. Recycl. 2020, 162, 105052. [Google Scholar] [CrossRef] [PubMed]
  42. Lawrence, J.-M.; Hossain, N.U.I.; Jaradat, R.; Hamilton, M. Leveraging a Bayesian network approach to model and analyze supplier vulnerability to severe weather risk: A case study of the U.S. pharmaceutical supply chain following Hurricane Maria. Int. J. Disaster Risk Reduct. 2020, 49, 101607. [Google Scholar] [CrossRef] [PubMed]
Figure 1. Phase diagram of governmental strategy selection.
Mathematics 10 00630 g001
Figure 2. Phase diagram of the manufacturer’s strategy selection.
Mathematics 10 00630 g002
Figure 3. Phase diagram of integrator’s strategy selection.
Mathematics 10 00630 g003
Figure 4. Equilibrium results of the tripartite evolutionary game with a fixed initial value.
Mathematics 10 00630 g004
Figure 5. Equilibrium results of tripartite evolutionary game with the governmental initial proportion α = 0.1 .
Mathematics 10 00630 g005
Figure 6. Equilibrium results of tripartite evolutionary game with the governmental initial proportion α = 0.6 .
Mathematics 10 00630 g006
Figure 7. Impact of tripartite evolutionary results before the change in governmental reward and punishment strategy.
Mathematics 10 00630 g007
Figure 8. Impact of tripartite evolutionary results after the change in governmental reward and punishment strategy.
Mathematics 10 00630 g008
Table 1. Evolutionary game model assumptions.
DimensionAssumption
ParticipantThe government, who inspects and supervises the resilient logistics service supply chains supported by manufacturers and integrators and formulates corresponding policies; the manufacturers, who adopt resilient supply chains to support the integrators; and the integrators, under the joint supervision of the government and manufacturers, who are the implementers of resilient logistics service supply chains.
PurposeThe purpose of the three parties is to maximize their respective interests. As the promoter of the coping strategy for an emergent crisis, optimal social benefits are the major goal of the government, while profit maximization is the main goal pursued by the manufacturers and integrators.
RationalityGiven the limited rationality of participants in reality, a traditional game is abandoned and an evolutionary game is chosen as the research tool.
StrategyThe government has two strategies: supervision and no supervision; the manufacturers also have two strategic choices for the resilient supply chains, namely adoption and no adoption; the integrators have two strategies as well: implementation and no implementation for the resilient operation of logistics service supply chains.
Table 2. Portfolio return matrix of government, manufacturer, and integrator.
The Integrator The   Government   Supervises   ( α ) The   Government   Does   Not   Supervise   ( 1 α )
Adopted   by   the   Manufacturer   ( β ) Not   Adopted   by   the   Manufacturer   ( 1 β ) Adopted   by   the   Manufacturer   ( β ) Not   Adopted   by   the   Manufacturer   ( 1 β )
Implemented   ( γ ) ( x 1 ,   y 1 ,   z 1 ) ( x 2 ,   y 2 ,   z 2 ) ( x 3 ,   y 3 ,   z 3 ) ( x 4 ,   y 4 ,   z 4 )
Not   implemented   ( 1 γ ) ( x 1 ,   y 1 ,   z 1 ) ( x 2 ,   y 2 ,   z 2 ) ( x 3 ,   y 3 ,   z 3 ) ( x 4 ,   y 4 ,   z 4 )
Table 3. Strategic alternative for portfolio return of government, manufacturer, and integrator.
Strategic Alternative Government   ( x ) Manufacturer   ( y ) Integrator   ( z )
( x 1 , y 1 , z 1 ) g 1 c 1 c 2 μ 1 D μ 2 c 4 m 1 c 3 + μ 1 D l 1 c 4 + μ 2 c 4
( x 2 , y 2 , z 2 ) g 2 c 1 c 2 + φ 1 D μ 2 c 4 2 m 2 m 1 φ 1 D l 2 c 4 + μ 2 c 4
( x 3 , y 3 , z 3 ) g 1 m 1 c 3 l 1 c 4
( x 4 , y 4 , z 4 ) g 2 2 m 2 m 1 l 2 c 4
( x 1 , y 1 , z 1 ) g 3 c 1 c 2 μ 1 D + s m 1 c 3 + μ 1 D l 3 c 5 s
( x 2 , y 2 , z 2 ) g 4 c 1 c 2 + φ 1 D + s 2 m 2 m 3 φ 1 D l 4 c 5 s
( x 3 , y 3 , z 3 ) g 3 m 1 c 3 l 3 c 5
( x 4 , y 4 , z 4 ) g 4 2 m 2 m 1 l 4 c 5
Table 4. Game strategic alternatives of government, manufacturer, and integrator.
Equilibrium Space V β 1 V β 2
V γ 1 V γ 2 V γ 1 V γ 2
V α 1 (0, 0, 1)(0, 0, 1)(0, 1, 0)(0, 1, 1)
V α 2 (1, 0, 0)(1, 0, 1)(1, 1, 0)(1, 1, 1)
Publisher’s Note: MDPI stays neutral with regard to jurisdictional claims in published maps and institutional affiliations.

