1. Introduction
Social media brings collective intelligence by sharing knowledge between users. News on social media that contains reviews, opinions, and other information has played an essential role in people’s decisions [
1]. It also has a significant effect on our social life. At the same time, the development of social media technologies raises adverse effects, such as the spread of fake news. Fake news and misleading articles are straightforward to circulate because they have particular traction [
2]. The appealing thing about fake news is that sometimes authors write the information using clickbait titles, bombastic narration, and viral topics discussion. One characteristic of news articles published in social media is often their lesser quality as compared to conventional news since there is no regulatory authority on social media [
3]. There are several types of fake news, such as fake rumors, satires, fake reviews, advertisements, misleading content, fake speech about politics, and many more. Compared to mainstream media, social media circulates fake news faster, contributing to increased partisan conflict and political polarization [
4,
5]. Fake news has been spreading intentionally and misleading society to believe false information; this phenomenon has made identifying fake news based on shared content very difficult. Information on social media is actively disseminated from person to person, causing a particular content detection problem. Fake news circulation is not only a current issue; it has been disseminated for centuries. Dealing with fake news is a complicated task due to its massive spread. Therefore, automatic fake news detection is needed.
Fake news detection research has become necessary due to the limitation of human ability to handle massive news spread on the internet. Additionally, researchers can develop systems that help people select information for their consumption. Many studies have been done in this field, including (1) an automated system for distinguishing fake news [
6], (2) analysis by time-series in different domains for sentiment predictive discussion method [
7], (3) capturing steady differences in the language of fake and real news by using deep neural networks [
8], and (4) building a shared convolutional neural network using two paths, which are shared low-level features and joint optimization [
9], and many more.
In addition to being used to detect fake news [
10,
11], natural language processing has been widely utilized for various more sophisticated tasks, i.e., Human Activity Recognition (HAR) [
12], sentiment analysis [
13,
14,
15], and spoken notifications for intelligent environments [
16]. This paper aims for involvement in the Constraint @ AAAI2021-COVID19 Fake News Detection dataset shared task using the pre-trained model and deep learning. Our proposed method implemented Latent Dirichlet Allocation (Topic-based), BART, and Cosine Document Similarity as the primary tools for the COVID-19 dataset. This method fills a lack of training datasets by selecting a dataset based on topic and creating a counterfeit generated training dataset to increase the model’s accuracy. A topic model is one of the research fields in computer sciences, especially in text mining and information retrieval tasks. It uses the machine learning method to induce a generative probabilistic model of text corpora [
17]. Latent Dirichlet allocation (LDA) is the most reputable topic model, introduced in 2003 by Blei et al. [
18]. According to Arjovsky et al. and Hou et al. [
19,
20], small datasets create problems, such as (1) the discriminator is always overfitting for the training dataset, (2) the feedback becomes insignificant when it sends into the generator, and (3) training data start to deviate. However, an augmentation generator that generates adversarial data can be applied to the training dataset; it will help to increase the number of dataset rows [
21]. Furthermore, it can improve performance (accuracy, precision, and F1-score) although modifying training data sometimes will decrease the natural composition of information [
22,
23]. We created a counterfeit training dataset using BART with OpenAI GPT2 as pre-trained. BART is an autoencoder that can reduce the noise for pretraining sequence-to-sequence models [
24,
25]. In fact, BART is made by training many corrupted documents and optimizing the cross-entropy’s regeneration loss function between the decoder’s output and the original document.
The main ideas of this paper include:
We initiated involvement in Constraint @ AAAI2021-COVID19 Fake News Detection by integrating transfer learning, selecting a training dataset using the topic model, and generating a counterfeit training dataset.
The main idea of this paper is to select the most impacted data using topic-based methods and then sort it based on data distinctiveness. Moreover, we generated counterfeit training data using BART and compared it toward source text using cosine similarity. Counterfeit-generated text is created from 70% source text and 30% automatically generated text. If the comparison cosine similarity result between counterfeit generated text and source text is more than 95%, add counterfeit generated text into the dataset.
In order to prove the resistance of performances and the robustness in various numbers of data training, we experimented with various dataset sizes (30%, 50%, 80%, and 100%) for random rows, random + generated text, topic-based, and TB-BCG. Then, we tested those datasets by using simple Long Short-Term Memory (LSTM) and Convolutional Neural Network (CNN) models to obtain comprehensive results.
This article is presented as follows:
Section 2 is the related work to review the LDA as a topic model, Bidirectional and Auto-Regressive Transformers (BART) in terms of generating text, and Cosine Document Similarity.
Section 3 states the framework and methodology in theoretical and practical, which contains six processes: data processing, LDA, adding training documents using the text generator, text generator, document similarity, and models.
Section 4 contains hardware and software specifications in experiment setup and the experiment steps in description of task.
Section 5 is the result.
Section 6 is the discussion and future work, and
Section 7 is the conclusion section.
3. Proposed Method
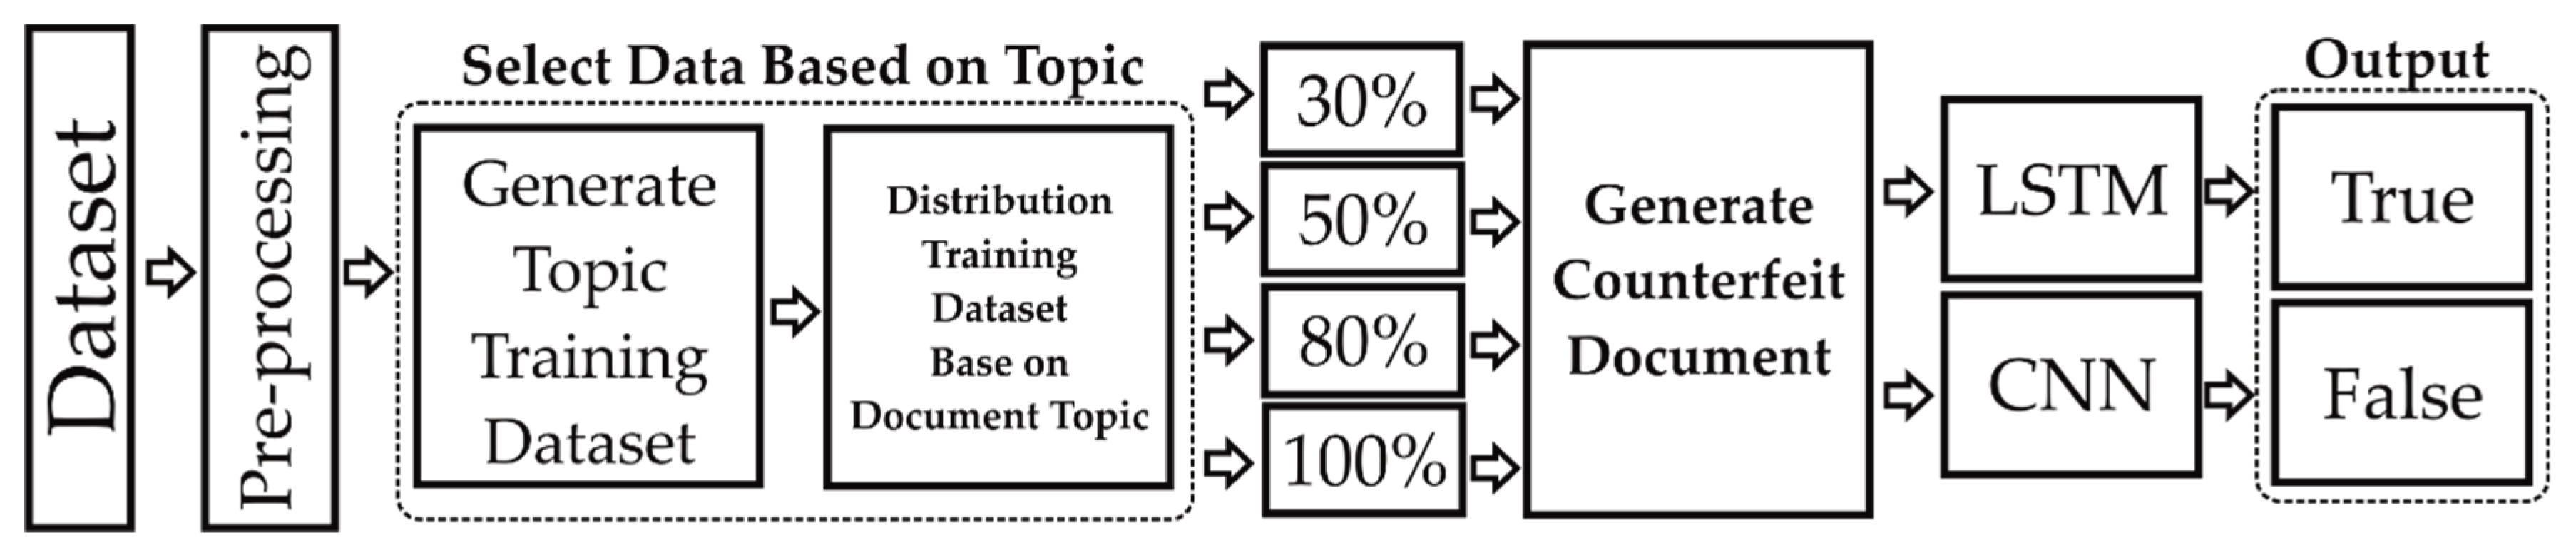
According to
Figure 1, the process starts from preprocessing; this process aims to clean text, convert emojis, expand words, and spelling correction. Select data based on topics; this process aims to classify and distribute documents according to topic, then sort documents based on topic scores. Results are four datasets, with sizes 30%, 50%, 80%, and 100% of the overall dataset. Next, generate a counterfeit document using BART based on original text to make various text. After that, calculate similarity using the cosine similarity function if the similarity is more than 95%, then add counterfeit as new data. Last, the final step is to train a simple LSTM or CNN to obtain the final result.
Data distribution of a dataset.
Table 1 shows a balanced data distribution for training, validation, and testing. The amount of validation and testing is 33% of the training dataset for each. In addition, the number of real and fake news has the same number of data, and the distribution of unique words is not far apart.
3.1. Data Processing
First, we executed our tweet preprocessing and text preprocessing for transformer-based models by removing useless punctuation marks for text classification. We kept symbols @ and # because those have specific semantics in tweets. Second, we transformed the text into lowercase and replaced URLs, mentions, and emojis into unique tokens. Third, we used the Python emoji library to change the particular emoji into a meaningful textual description: redheart:, thumbsup:, etc. Furthermore, we converted hashtags into words (“#COVID”→”COVID”). Removing stopwords was not applied for this dataset to increase the ability to generate new text. We did expand contractions into full words, for example, “you’re” to “you are.” We also performed spell correction in processing textual data by using TextBlob. This library gives a compatible API that can change uncomplete words to common words. It can increase natural language processing (NLP) accuracy, such as noun phrase extraction, sentiment analysis, text classification, part-of-speech tagging, and more. Last, we turned all letters to lowercase.
3.2. Latent Dirichlet Allocation (LDA)
To select documents in the dataset based on the LDA method, we used the Gensim module. Gensim provides an LDA module that is highly scalable, strong, good performance-optimized, and well tested by many users. We utilized LDA multicore Online Learning, which uses whole CPU cores in a computer to parallelize and speed up model training.
Suppose we have four documents containing specific words/terms, then split each document into words and count it by number, as shown in
Table 2.
Table 2 shows that each document has terms/words contained in the document. Because LDA uses a bag-of-words mechanism, we should count every term in a document, for example, Doc 1 has no terms “Corona”, one term “India”, two terms “Disease”, and so on.
During this work, we use the same symbol and terminology used by David Blei [
18], Hamed Jelodar et al. [
30], and Ponweiser [
17]. LDA states that each document can be represented as a probabilistic distribution over latent topics and that topic distribution in all documents’ topic distribution shares a common Dirichlet prior. Each latent topic in the LDA model is also represented as a probabilistic distribution over words, and the word distributions of topics share a common Dirichlet prior.
According to David Blei [
18], a word is the basic unit of discrete data, defined to be an item from a vocabulary indexed by (
. A corpus is a collection of
documents denoted by
D. Document
d having
Nd words (
d ϵ {1
), LDA models
D according to the following generative process [
30]:
- (1)
Choose a multinomial distribution for topic from a Dirichlet distribution with parameter β.
- (2)
Choose a multinomial distribution for document from a Dirichlet distribution with parameter α.
- (3)
For a word in document d,
- (a)
Select a topic from
- (b)
Select a word from .
The word in documents is only an observed variable during the generative process with
as latent variables, where
is word distribution for topic
t, and
document topic distribution for document
d.
are hyperparameters, where
is Dirichlet prior parameter of per-document-topic distribution, and
is Dirichlet prior parameter of per topic–word distribution. To obtain these latent variables and hyperparameters, the probability of the observed data
D is calculated and maximized as follows [
30]:
Defined, β is drawn from the Dirichlet distribution, given α are the distribution of words over topics and parameters of topic Dirichlet prior. Defined, is some documents, N is the vocabulary size, and T is the number of topics. The Dirichlet-multinomial pair for the corpus-level topic distributions is considered as . The Dirichlet-multinomial pair for topic-word distribution is given as . The variable are document-level variables sampled per document. variables are word-level variables and are sampled for each word in each text-document. As a result, each document is then seen as a probability distribution over set of topics.
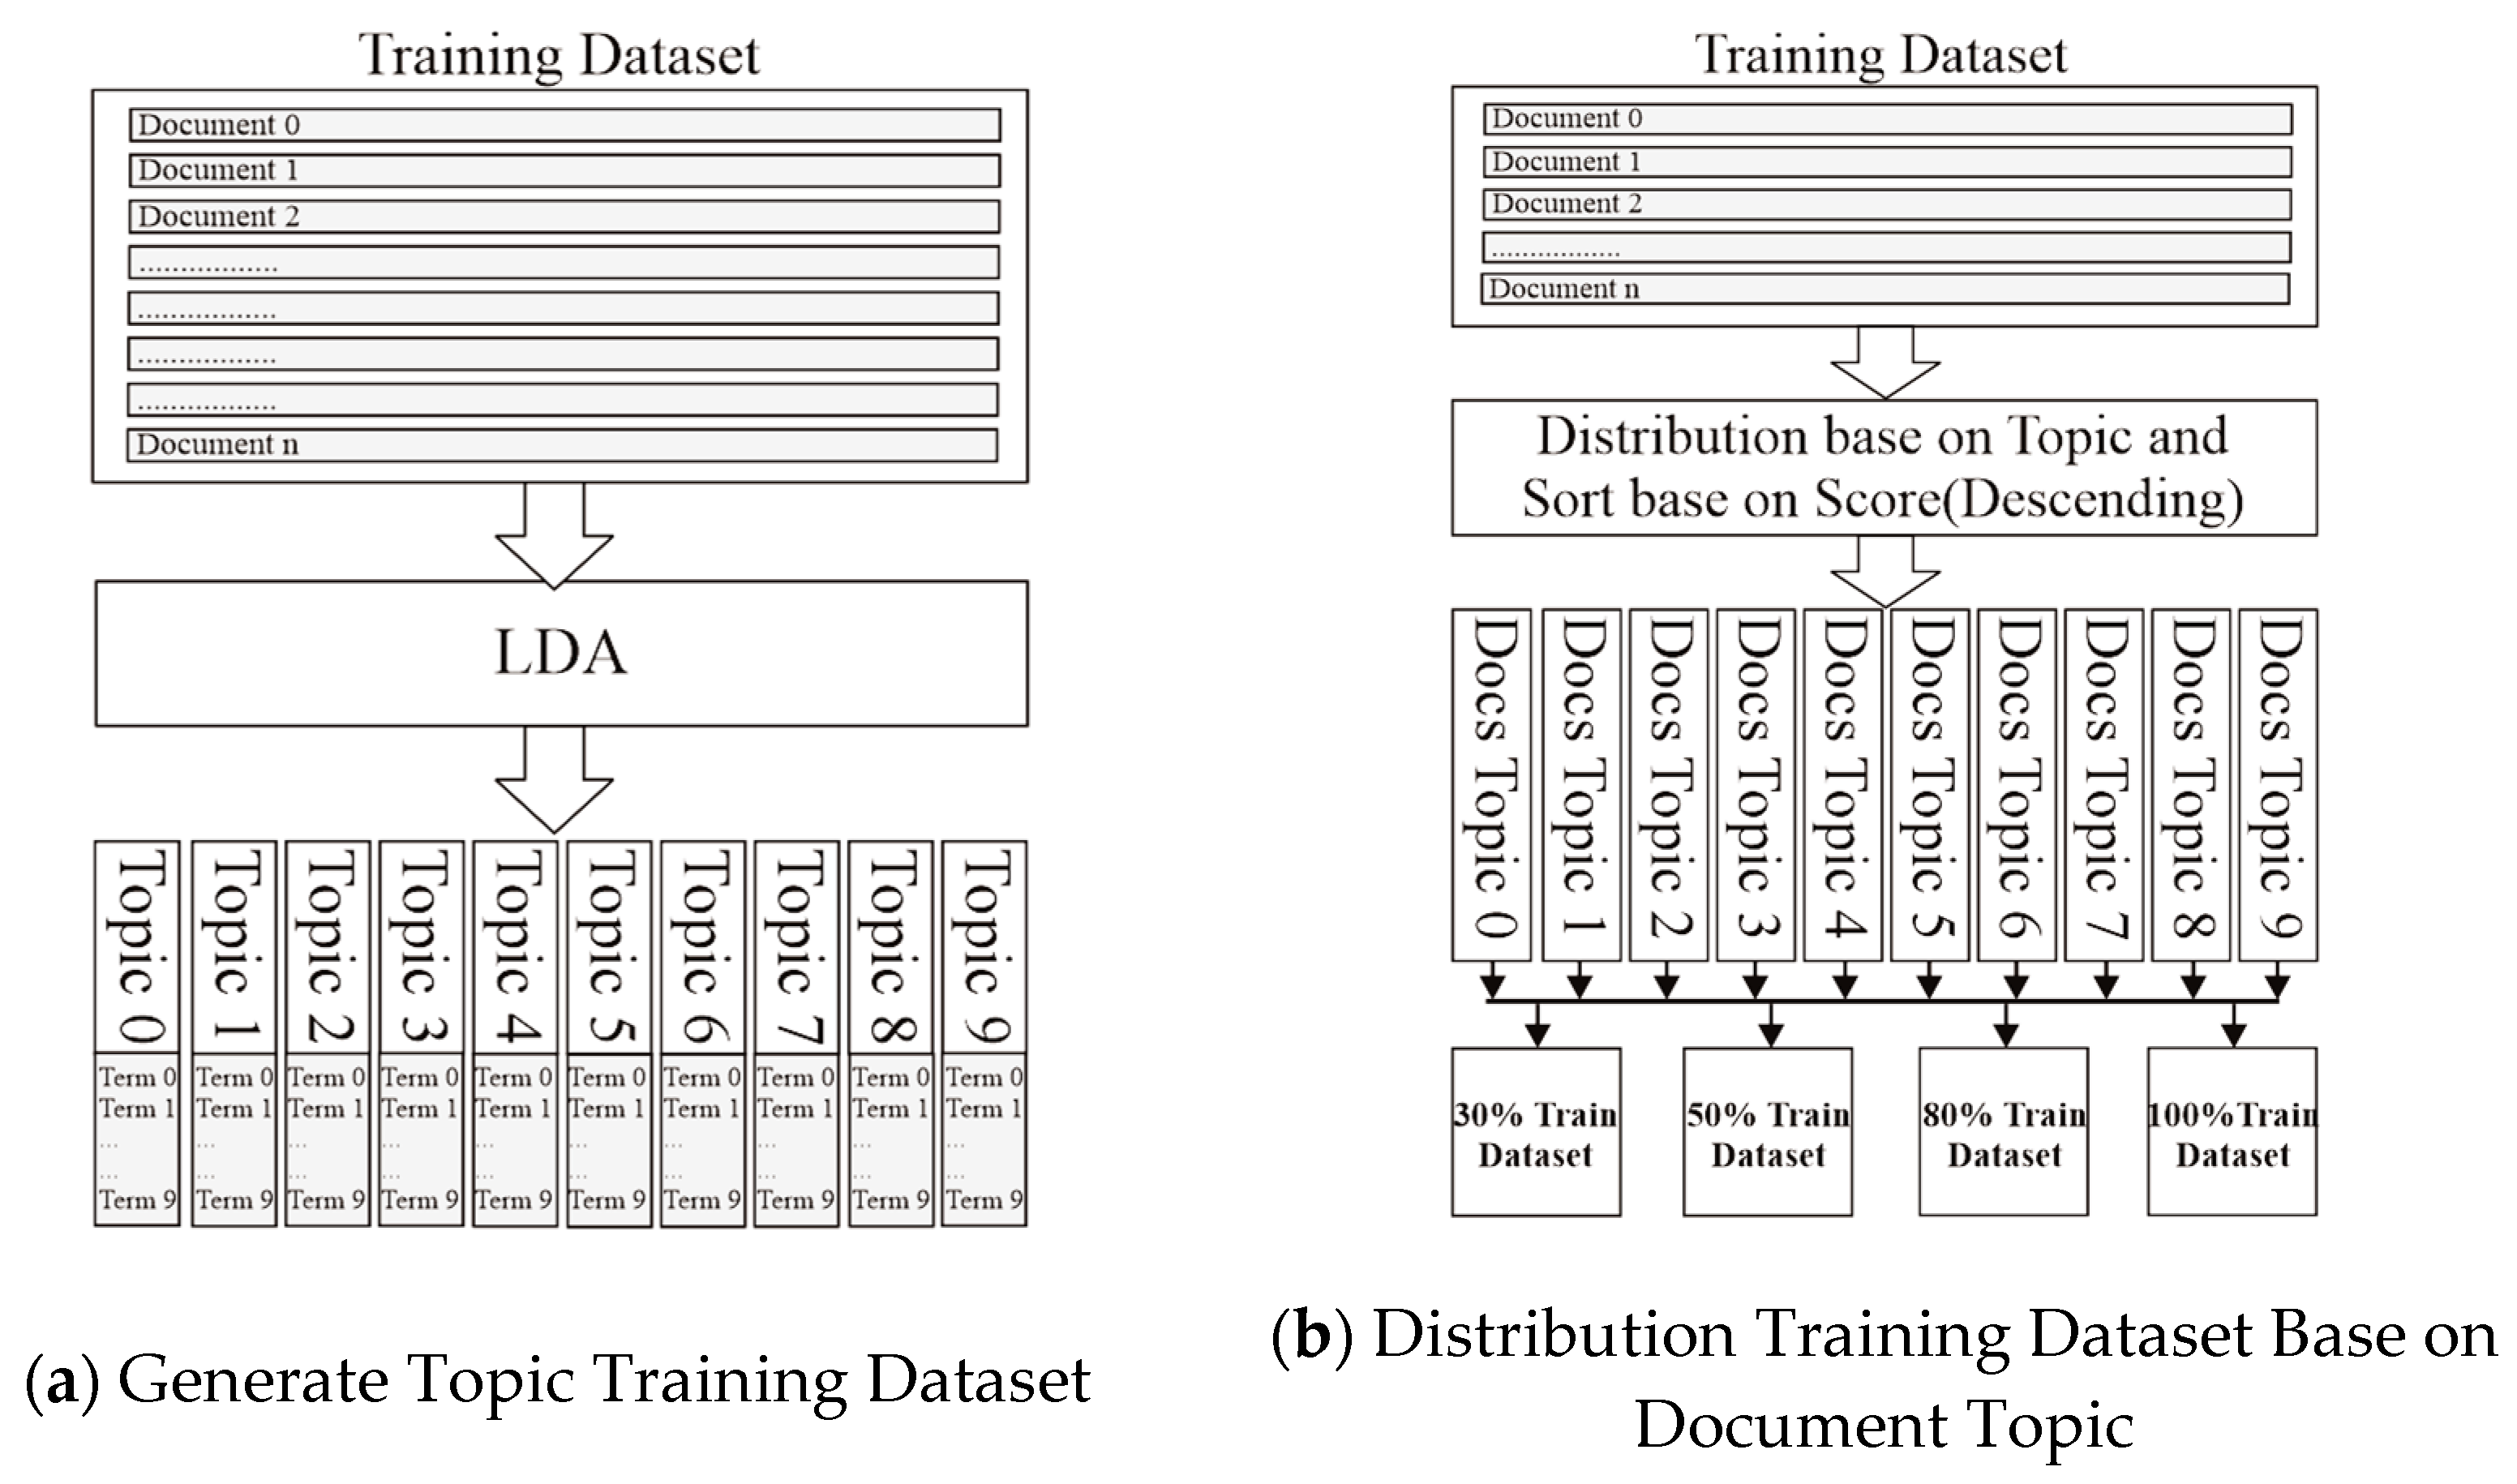
3.3. Selecting and Deviding Dataset
We divided the process into two steps in order to select documents for training dataset using the LDA mechanism that we already explained in a previous subsection: (1) LDA model generates training topics to produce ten topics. Each topic consists of 10 terms. Then, (2) distribute documents in training dataset based on same LDA model in step 1; this process aims to classify and distribute documents based on the topic, then sort documents based on topic scores. The steps are shown in the
Figure 2a,b.
3.4. Sort Most Distinctive Row in Dataset
In order to find out which is the most distinctive data row towards other rows, we need to calculate the level of similarity of a row toward other rows. We do this to each topic group. The equation can be seen below:
is the similarity value of each row in the dataset,
n is the amount of documents, and
x and
y are iteration variables.
and
are the variables to be compared. After counting each row, based on the results of the calculations using the equation above, we sorted in ascending order—the more considerable the similarity value, the more similar the text row towards others. The explanation regarding text similarity can be found in sub-
Section 3.7 of this paper.
The final result of the process is four datasets that contain 30%, 50%, 80%, and 100% documents from each topic. For illustration, the 30% training dataset indicates that dataset consists of the top 30% of documents classified as topic_0, the top 30% of documents classified in topic_1, and so on.
3.5. Add Training Documents Using the Text Generator
We also added generated documents into the training dataset. The Algorithm 1 can be seen as follows:
| Algorithm 1. Document generation and labeling |
- 1:
input:
|
- 2:
d: document
|
- 3:
label: label of document (0 = fake, 1 = true)
|
- 4:
output:
|
- 5:
g: generated document
|
- 6:
new_label: new label of document
|
- 7:
def generate_text(d, label)
|
- 8:
n = length(d) # count length of text d
|
- 9:
q = d [0:int(n*0.70)] # get the 70% of text
|
- 10:
p = generate(q, num_of_results = 50, lenght_of_result = n)
|
- 11:
# Generating 50 counterfeit documents
|
- 12:
for i = 0 to num_of_results: # iteration from 0 to 49
|
- 14:
p_sim[] = similarity(d, p[i]) # get similarity by
|
- 14:
# comparing each counterfeit
|
- 15:
# text(p[i]) toward original
|
- 16:
# document(d)
|
- 17:
t = argmax(p_sim) # find the highest similarity
|
- 18:
# for current text
|
- 19:
if p_sim[t] > 0.95: # if the similarity more 95%
|
- 20:
new_label = label # then classified same with
|
- 21:
# the original document (d)
|
- 22:
return g = p[t], new_label # the results is
|
- 23:
# generated document
|
- 24:
# and new label
|
This function has two inputs, namely d = document (consist n words) and label = label of document (0 = fake, 1 = true). Output of this function is g = generated document and new_label = label of generated document.
Where n is the length of the document, q contains 70% number of words from the d document. Variable p is an array variable containing generated documents (produces 50 (fifty) documents); each generated document has the same length as the d document. Furthermore, we obtain the similarity score between each generated document and d document using cosine similarity, then put values into the p_sim array variable. Variable t is the Argmax of the p_sim array variable. We decided that if the similarity score exceeds 0.95, then the new_label for the generated document (g) is equal to label, and we then save the generated text as counterfeit-generated text.
We chose 70% of the original text to generate 30% for the rest because this combination still keeps more than half the actual text, and the sentence does not lose too much meaning. Previously, we tested several combinations of 50% original text to 50% generated text, but it is too difficult to gain 95% similarity; moreover, we tested 85% original text to 15% generated text, but the meaning is too close between the original text and counterfeit. Hence, we decided to use 70% of the original text to generate 30% for the rest.
3.6. Text Generator
Algorithm 1 shows one of the processes is to generate ten documents, then select the one closest to the original. We utilized the GPT2 model as the transformer text-generator tool, and we used a low-level API, namely the pipeline. This model uses the “Language Models are Unsupervised Multitask Learners.” It applied BART as a model combination. Pretraining has two stages: (1) arbitrary noising function for the many corrupted texts and (2) reconstructing the original text using a sequence-to-sequence model for the learned process. BART has an autoregressive decoder for Sequence Generation Process, and the system can directly fine-tune it. After that, the system will copy and manipulate all information to perform denoising to move closer to the pre-training objective. Here, the decoder generates outputs autoregressively, and the input encoder is the input sequence in stage (1).
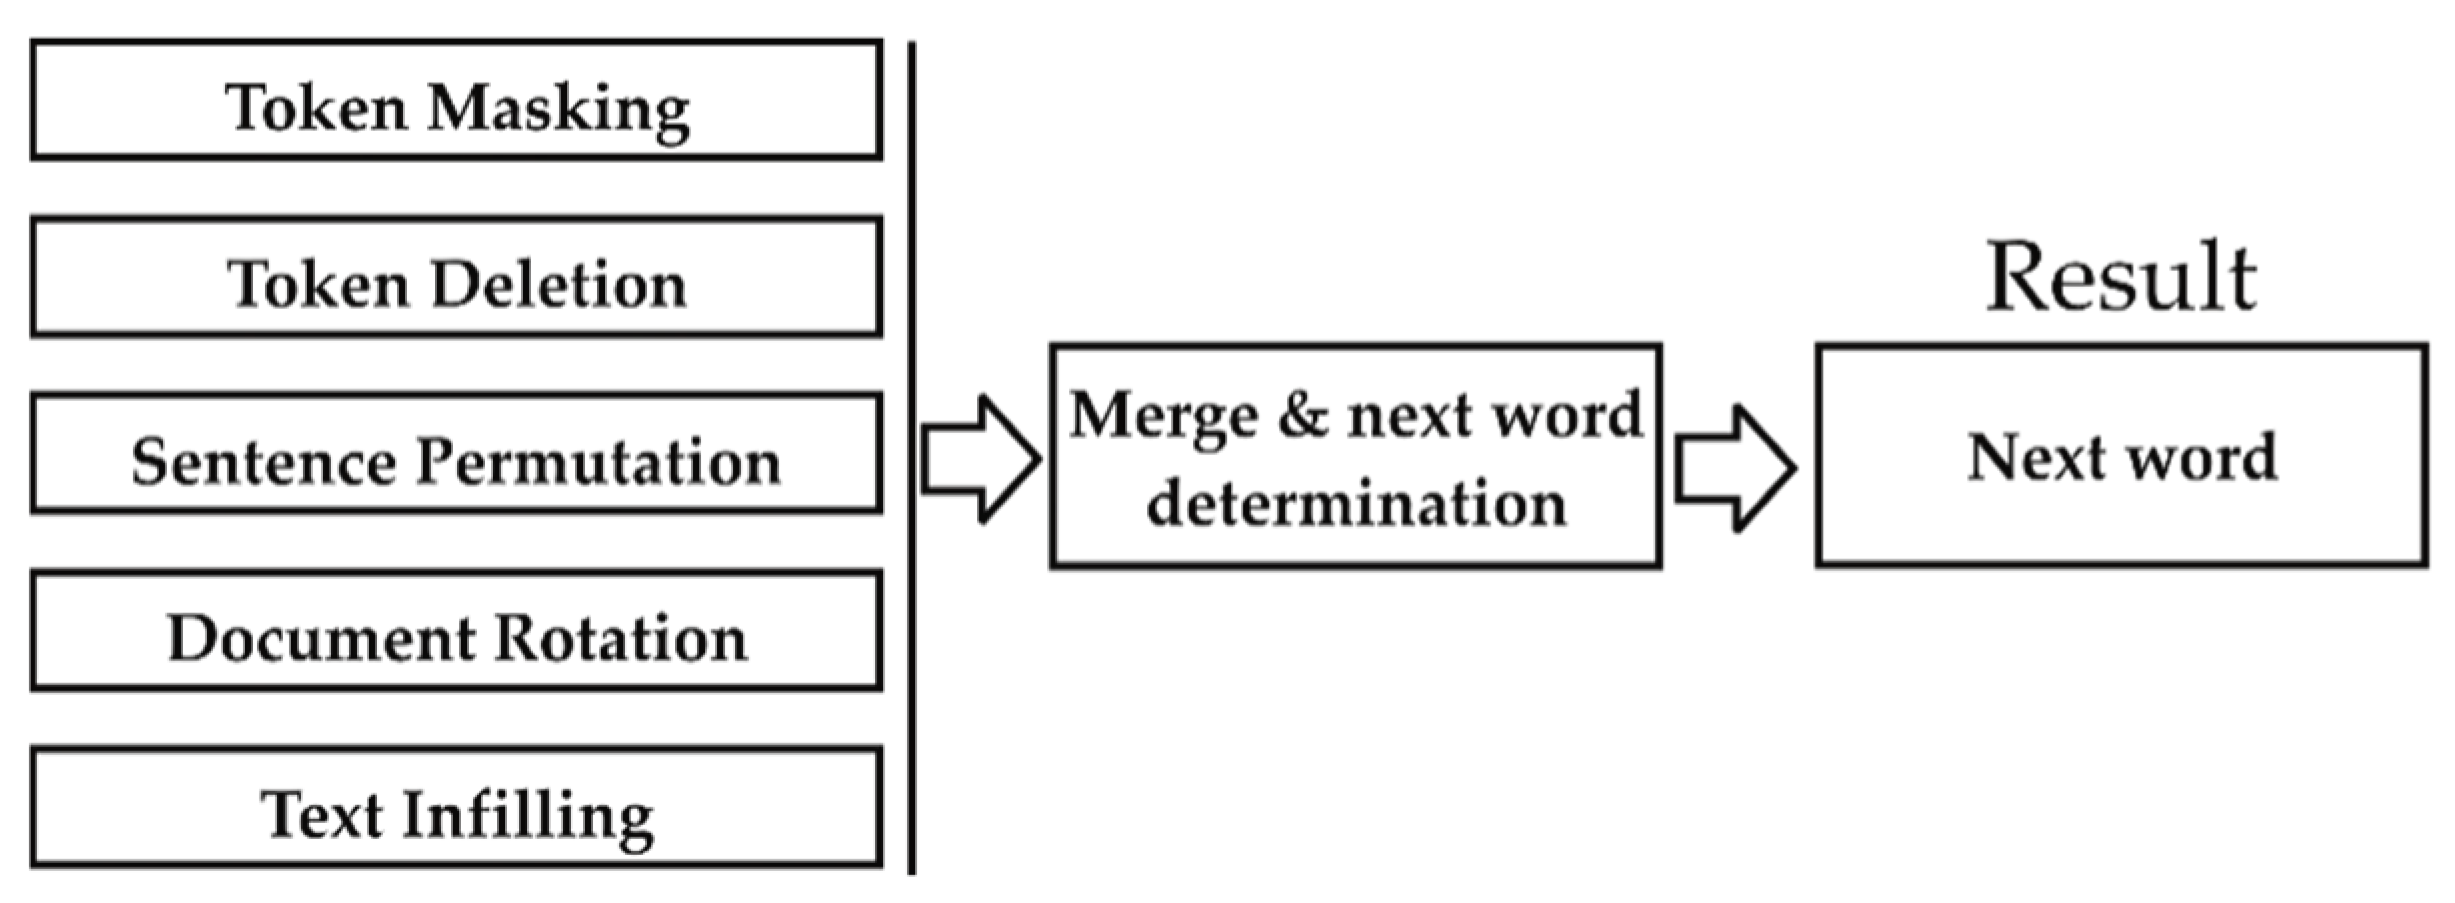
To generate new sentences, it combines five methods as seen in
Figure 3: for token masking, BERT implements randomized tokens, makes them sampled, and replaces them with (MASK) elements. For token deletion, delete random tokens in text input. This process is different from token masking; the model itself decides which places are missing in the inputs. For text infilling, take samples using several text spans, then replace every span with a single (MASK) token. If spans are 0-length, then correspond to the insertion of (MASK) tokens. For sentence permutation, a document is distributed into several sentences based on total stop words and then rearranged in random order. For document rotation: chose a token uniformly and randomly, then rotate the document and put that chosen token at the beginning of the document. Those five methods will generate the following words one by one until the specified sentence length is reached. The input is a sequence of words. Then, the process of token masking, token deletion, sentence permutation, document rotation, and text infilling are executed. The results of the execution of these processes are combined, and the process decides the most appropriate word to become the generator’s result.
Table 3 shows original document and a few samples of counterfeit generated document.
3.7. Document Similarity
We used cosine similarity to get the distance between two documents. Those documents that we compared are original documents toward each generated document in the array. In many NLP tasks, a cosine similarity is an approach to measuring the similarity between two non-zero vectors, aiming to get the inner product space. A document can contain thousands of attributes/words; the characteristic of the document depends on attributes, and we can classify it as the frequency based on a particular word/keyword/phrase. This method is called a term-frequency vector, for which the main task is to represent text into objects. For example, we have two documents and then generate both into term-frequency vectors. However, those vectors have many zero values in common, meaning that both vectors have no corresponding documents and do not share many words. As a result, those texts are not similar. In this process, the measurement will focus on the words that the two documents have in common and words frequency. In other words, it is necessary to measure for numeric data that overlooks zero matches.
The formula of similarity function is following:
where
is the Euclidean norm of vector
or defined as
. In theory, it is the length of the vector. Furthermore,
is the Euclidean norm of vector
y. This similarity equation calculates the distance of vectors
x and
y, and the result is the cosine of the angle. If the cosine value of 0, the two vectors are at 90 degrees to each other (orthogonal), or we can say those vectors have no match.
3.8. Models
To obtain comprehensive results, we tested our approach to two simple models, which are based on Recurrent Neural Network (RNN) and Convolutional Neural Network (CNN).
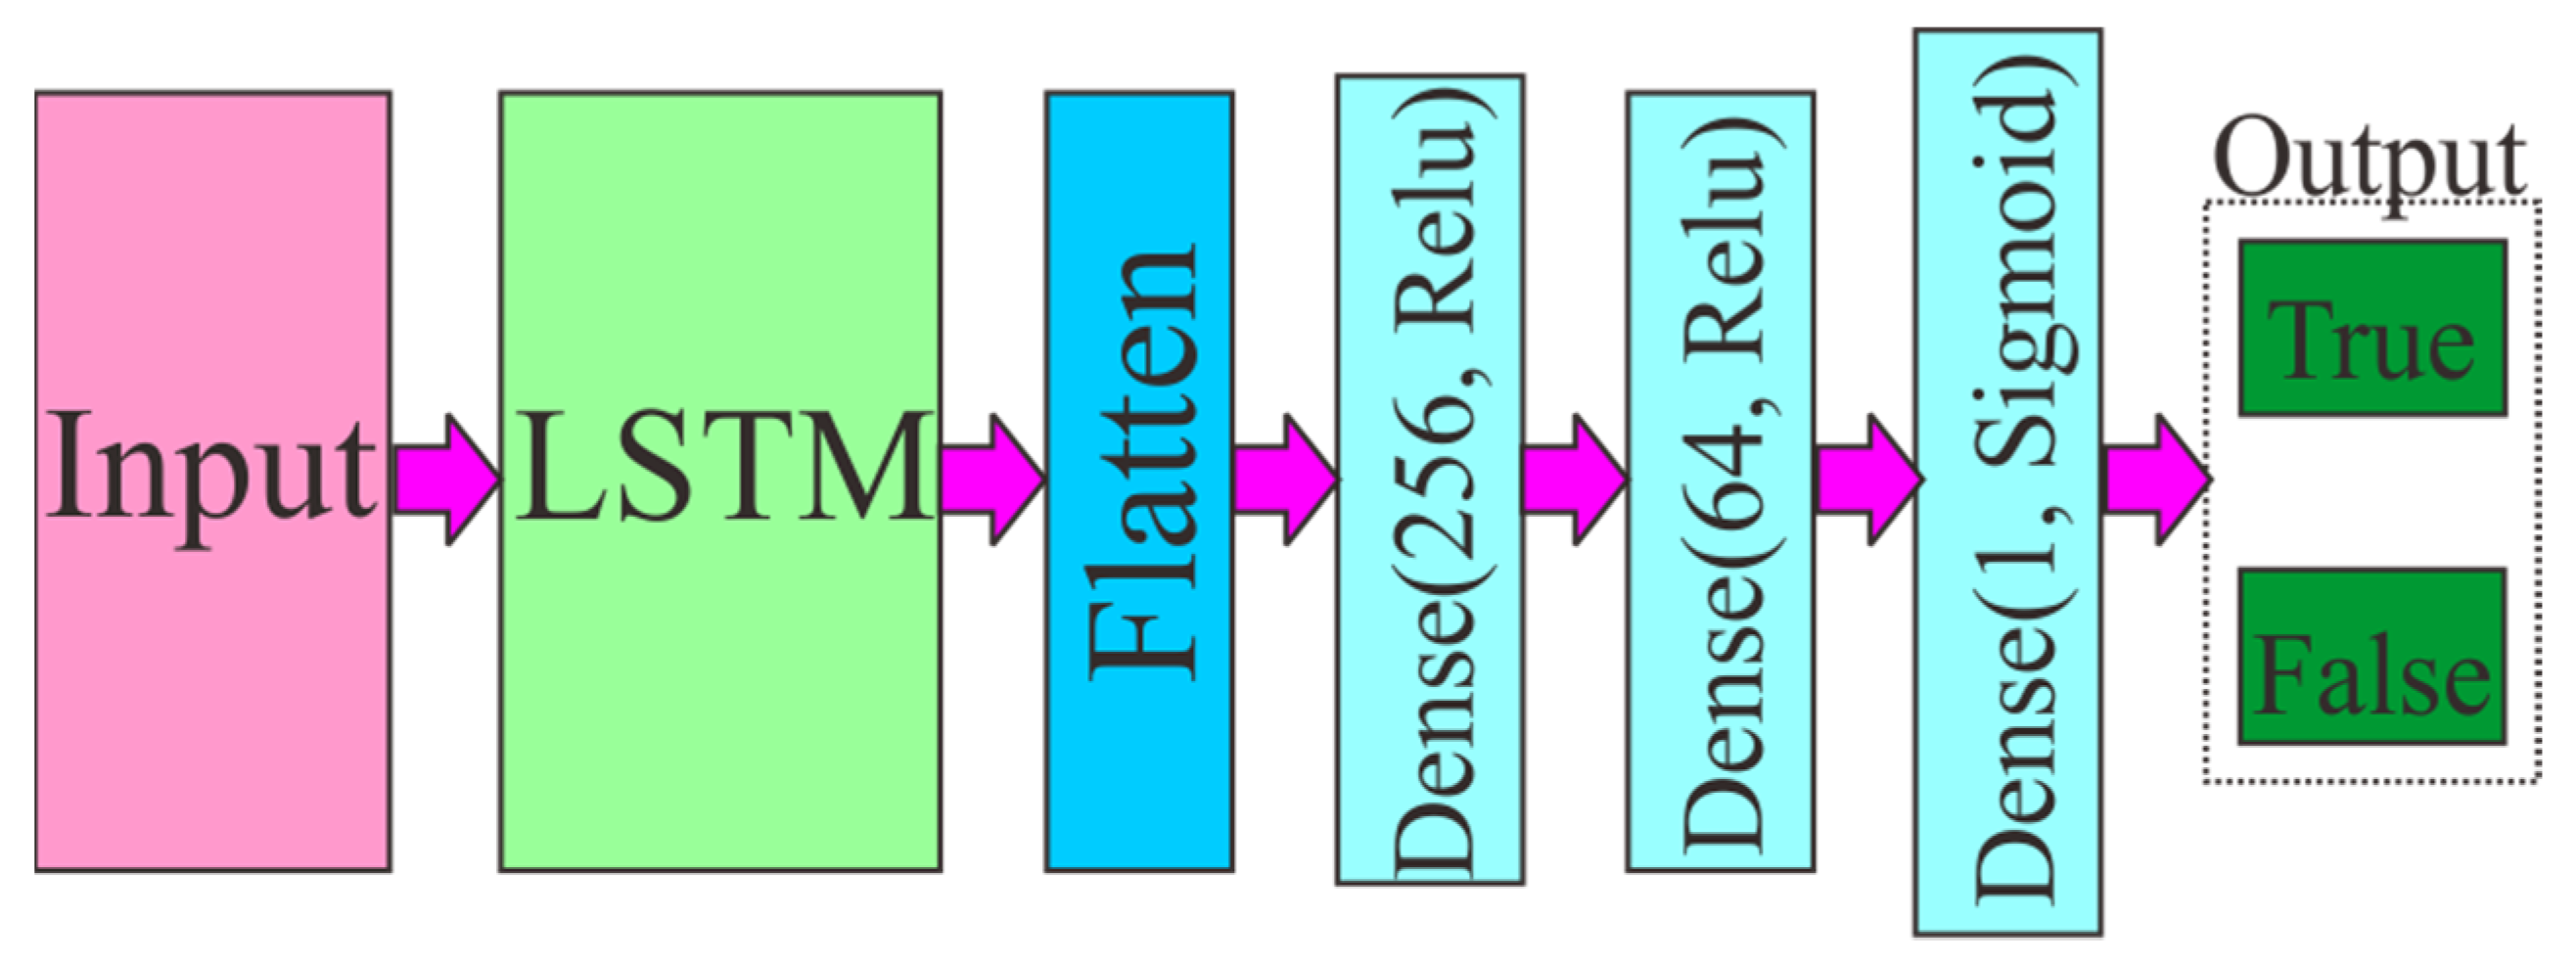
First, we focused on the RNN based duo to the LSTM network as an RNN since the RNN is a more straightforward system. The model used Facebook/Bart-large pre-trained as input; it produces matrix 300 × 1024 for their result. Then, we utilized an LSTM network, and 2 Dense (Relu) as shown in
Figure 4. This simple network can efficiently use past input features via an LSTM layer and forward the information to the following Dense Layers. For the last layer, we used the Sigmoid function to obtain binary output (0 = fake, 1 = true).
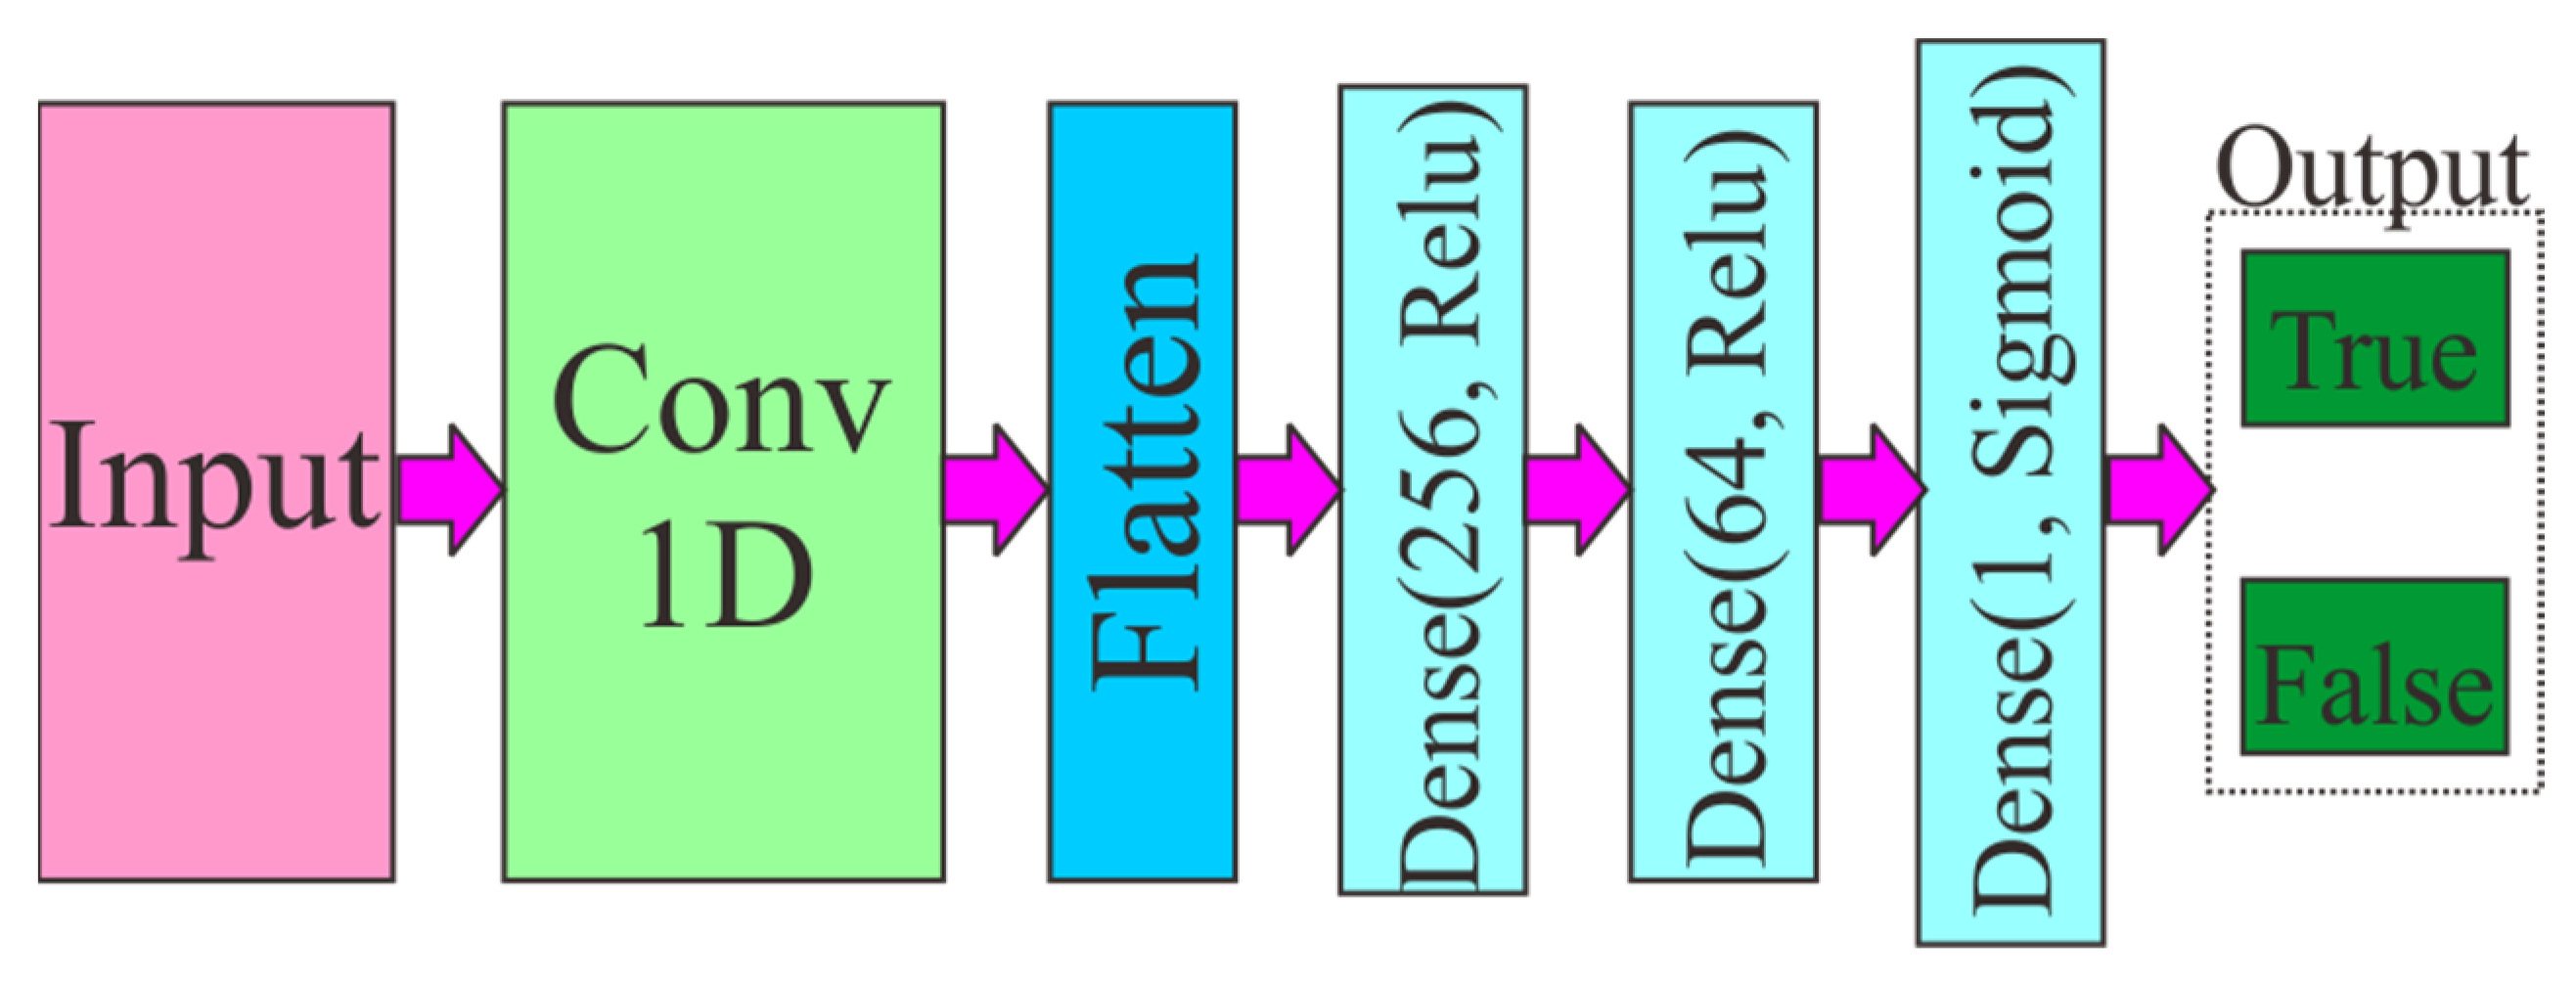
Second, we utilized Convolutional Neural Network 1-d. It is a classical approach to fix a simple problem, such as the ensembles of decision trees, training machine learning models, and time-series data on fixed-sized windows. In this research, we used the same matrix dimension and pre-processing as input. Those two models produce binary classification by using the sigmoid function.
Figure 5 shows that all components in the structure are like
Figure 4 except the Conv1D layer.
5. Result and Analysis
In this section, we show and analyze the results we obtained according to section experiment and task and discuss topics and their weight, topic distribution in datasets, statistics, percentage, and counterfeit-generated text in datasets, and the result would be to give the accuracy of each model.
First, we randomly divided the dataset into four datasets as a baseline and named those as Train-30 (30% from the dataset), Train-50, Train-80, and Train-100. It is necessary because it will produce results that can compare to our method more comprehensively.
Second, we generated counterfeit text for every train random data (Train-50, Train-80, and Train-100) by using the GPT2 model as the transformer text-generator tool. We named those as Train-gen-30, Train-gen-50, Train-gen-80, and Train-gen-100.
Third, we implemented LDA to extract topics from the original training Constraint @ AAAI2021-COVID19 Fake News Detection dataset. The ten topics and their top 10 words are presented with relative weights. Unlike Guo et al. [
42] and Hao et al. [
43], we did not name each topic based on the relevant relationship between their top words and their identical relative weights. As shown in
Table 3 for the example, we used Topic 0, 1, 2, …, 9.
Table 4 shows terms and their weight in the topic, and Gensim generates it automatically. Another significant contribution LDA made in statistical distribution theory is weighted distributions, elaborating the two-level models in the traditional hierarchical Bayesian literature. LDA estimates that each text comes from multiples topics and returns the weight of each topic for each document. LDA succeeds in fixing both problems by handling the topic mixture weights as a k-parameter hidden random variable rather than a large set of individual parameters explicitly linked to the training set. Because The LDA algorithm does not return the same results since it incorporates some randomness to the initialization process, we executed topics until we obtained well-distributed topic distribution between topics.
The most interpretable topics extracted from the fake news and real news are shown in
Table 4. We divided it into ten topics, and each topic has ten words. As the result for topic 0, the words and their weight are 0.036*“deaths” + 0.030*“amp” + 0.027*“states” + 0.018*“cases” + 0.016*“numbers” + 0.014*“pradesh” + 0.011*“days” + 0.011*“spread” + 0.010*“coronavirus” + 0.009*“day”. This means the top 10 keywords that contribute to this topic are: “deaths”, “amp”, “states”, and so on, and the weight of “deaths” on topic 0 is 0.036. The number of hidden topics is a fundamental arrangement in topic modeling, and the weights reflect how important a keyword is to that topic. This LDA method represents the marginal distribution of a document as a continuous mixture combination. The observed data are the words of each text, and the hidden variables represent the latent topical structure, i.e., the topics themselves and how specific composition presents them.
Table 4 reveals that in this research dataset, coronavirus and words related to it are the most frequently appearing words. All sequence in topics have slightly diverse words, and the difference is only in order of words and the weight. It proved that both fake news and real news could have the same topics. Although we will not decide whether it is true using the topic model, dividing it into a few topics will help us know the correlation between one text and another.
Fourth, we obtained the topics assigned to each document with the method topic distributions of the LDAModel. We created four datasets with different amounts of documents based on topics shown in
Table 4, namely 30%, 50%, 80%, and 100% of the total training dataset.
Table 5 shows the total number of documents and how many documents there are for each topic.
As shown in the results presented in
Table 5, Topic 9 has the most significant number of documents, and Topic 6 is the smallest. Because we distributed topics into datasets according to the percentage of documents number in total, it creates a balanced distribution in each dataset. The Topic-100 dataset means we retrieve the entire dataset, but it is sorted differently from the actual dataset.
Fifth, we generated counterfeit text by using the GPT2 model as the transformer text-generator tool. Our model used the “Language Models are Unsupervised Multitask Learners”. We also applied pre-training BART.
Table 6 shows the difference for each dataset, statistics, percentage, and counterfeit-generated text.
The results presented in
Table 6 show that Train-30, Train-Gen-30, Topic-30, and TB-BCG-30 have different total rows. The difference between Train-30 and Topic-30 is caused due to the way we divided rows. For Train-30, it has more rows because we divided it directly from total data, which is 30% from the entire rows. Meanwhile, for topic-30, we obtained 30% of each topic, as seen in step four in this section. The generated texts caused Topic-Gen-30 to obtain more rows. However, this process made the dataset between true and fake unbalanced. Take as an example TB-BCG-30; these additions of generated text enlarged the difference between true and fake, which is 9.9% and is contrary to Train-30 and Topic-30, which have a difference of 4.21% and 0.1%, respectively. Not all rows in the dataset produced the generated text as a result. If the similarity level between real text and generated text is less than 95%, the system will not add it as counterfeit-generated text. TB-BCG-30 only generated 644 counterfeit-generated texts from a total of 1844 Topic-30 rows.
Sixth, we trained all the datasets using the simple LSTM and CNN models to evaluate our model, just as we described in
Section 3. All our experiments used the same hyperparameters. We utilized four different metrics, including precision, accuracy, recall, and F1-score, to compare the results of each dataset. Because F1-score represents recall and precision, we take F1-score as a performance comparison. The results can be seen in
Table 7,
Table 8,
Table 9 and
Table 10 for 30%, 50%, 80%, and 100% of the dataset, respectively. Bold texts are the highest performance (F1-Score) in each table.
We compared all results based on a group of amounts row.
Table 7,
Table 8 and
Table 10 show that our approach obtained the highest F1-score results for groups 30%, 50%, and 100% of the dataset. That means our proposed method worked well here. By rearranging and selecting the dataset based on their distinctiveness, we can provide a more diverse order. However, for
Table 9, Train-gen-80 gained the best result. We assume this happens because data distribution is balanced between fake and true labels. The training dataset obtained from the selected topic (Topic-30, Topic-50, Topic-80, Topic-100) obtained worse performance than the Train-gen (Train-gen-30, Train-gen-50, Train-gen-80, Train-gen-100) because the topic data are fewer than the Train-gen. TB-BCG affected accuracy due to the number of rows that were successfully generated. However, TB-BCG yields the highest performance in our experiment. LSTM and CNN obtain performance results that were quite close between them.
6. Discussion and Future Work
Although our approach was successful in many experiments in this paper, many things can still be improved. For example, in LDA, we manually determined the number of topics and the number of terms in each topic. We tried to add a topic or terms, but performances are worse than the baseline. Thus, topics and terms number can be determined by the dataset and the amount of data. The experimental result of 80% dataset shows that Train-gen-80 demonstrated the best performance; this indicates that our approach cannot surpass the baseline under certain circumstances. Generating using Algorithm 1 and the BART text generator still has many shortcomings. The lack of generated text categorized in the criteria (similarity ≥ 95%) makes the unequal dataset distribution between true and false labels; according to
Table 6, the generated text only makes up less than 50 percent of the total data.
To overcome the difficulties and drawbacks found in this work, we suggest two research directions:
First, develop a new method using LDA but with a system that automatically determines the number of topics and the number of terms for each topic. It will be helpful to make the system better in reading the dataset and performing the necessary configurations to obtain a more promising performance.
Second, create a new robust algorithm so that even the new words change up to 30% by random throughout the text but still have similarities to the original text.


