Abstract
Feature selection (FS) methods play essential roles in different machine learning applications. Several FS methods have been developed; however, those FS methods that depend on metaheuristic (MH) algorithms showed impressive performance in various domains. Thus, in this paper, based on the recent advances in MH algorithms, we introduce a new FS technique to modify the performance of the Dwarf Mongoose Optimization (DMO) Algorithm using quantum-based optimization (QBO). The main idea is to utilize QBO as a local search of the traditional DMO to avoid its search limitations. So, the developed method, named DMOAQ, benefits from the advantages of the DMO and QBO. It is tested with well-known benchmark and high-dimensional datasets, with comprehensive comparisons to several optimization methods, including the original DMO. The evaluation outcomes verify that the DMOAQ has significantly enhanced the search capability of the traditional DMO and outperformed other compared methods in the evaluation experiments.
Keywords:
feature selection (FS); dwarf mongoose optimization (DMO); quantum-based optimization (QBO); metaheuristic (MH) MSC:
68Txx
1. Introduction
The recent advances in meta-heuristic (MH) algorithms have been widely employed in different applications, including the feature selection (FS) problems [1]. The FS problems are necessary for machine learning-based classification methods. In the domains of data mining and machine learning, the FS process is one of the most crucial preprocessing procedures for evaluating high-dimensional data. Classification accuracy in machine learning issues is heavily reliant on the chosen characteristics of a dataset. The basic goal of feature selection is to improve the performance of algorithms by removing extraneous and irrelevant characteristics from the dataset [2]. It is clear that FS methods play significant roles in enhancing classification accuracy as well as reducing computational costs. In general, FS methods can be adopted in various applications, such as wireless sensing [3], human activity recognition [4], medical applications [5], text classification [6], image classification [7], remote sensing images [8], fault detection and diagnosis [9], intrusion detection system [10], and other complex engineering problems [11,12,13].
In recent years, MH optimization algorithms have shown significant performance in FS applications. For example, Xu et al. [1] developed a modified version of the grasshopper optimization algorithm (GOA) for FS applications. They used bare-bones Gaussian strategy and elite opposition-based learning to boost the local and global search mechanisms of the GOA and to balance the exploitation and exploration mechanisms. The improved method called EGOA was tested with different numerical functions, and it showed superior performance compared to the original GOA. In [14], three binary versions of the differential evolution (DE), Harris Hawks optimization (HH0), and grey wolf optimization (GWO) algorithms were developed to select features from electroencephalogram (EEG) data for cognitive load detection. They tested the developed methods with several classifiers, including the support vector machine (SVM) and the K-nearest neighbor (KNN). The binary HHO with the KNN classifier achieved the best results. Başaran [15] applied three MH algorithms, namely genetic algorithm (GA), particle swarm optimization (PSO), and artificial bee colony, to select features from the magnetic resonance imaging (MRI) to classify brain tumors. The three MH methods’ applications improved the SVM classifier’s classification accuracy. Rashno et al. [16] proposed an efficient FS method based on a multi-objective PSO algorithm. They used the feature ranks and particle ranks to update the position of particles and their velocity during each iteration. Additionally, 16 datasets were utilized to assess the performance of the improved PSO method, which achieved significant performance compared to 11 existing methods. Nadimi-Shahraki et al. [17] developed a new FS approach using a modified whale optimization algorithm (WOA). They used a pooling technique and three search mechanisms to boost the search capability of the traditional WOA. This method was utilized to improve the classification of the COVID-19 medical images. Varzaneh et al. [2] proposed an FS approach using a modified equilibrium optimization algorithm. They used an Entropy-based operator to boost the search performance of the traditional equilibrium optimization method. Moreover, they used the binary version of the modified equilibrium optimization method. The binary version was evaluated with eight datasets to be tested as an FS method, which recorded better results compared to several optimization methods. Hassan et al. [18] suggested a binary version of the manta ray foraging (MRF) algorithm as an FS method, which was applied to enhance the classification of the intrusion detection systems. The developed version of the MRF method was applied with the random forest classifier and the adaptive S-shape function, and it was tested with well-known IDS datasets, such as CIC-IDS2017 and NSL-KDD. Eluri and Devarakonda [19] used a binary version of the golden eagle optimizer (GEO) as an FS approach. They utilized a technique called Time Varying Flight Length along with the binary version of the GEO for balancing the exploitation and exploration processes of the GEO. It was compared to a number of well-known MH optimization algorithms as well as feature selection methods. The outcomes showed that the developed GEO had shown competitive performance. Balasubramanian and Ananthamoorthy [20] applied the salp swarm optimizer (SSA) as an FS method to enhance the glaucoma diagnostic. The SSA was utilized with the Kernel-Extreme Learning Machine (KELM) classifier, and it significantly improved the classification accuracy. Long et al. [21] proposed a new FS approach based on an enhanced version of the butterfly optimization algorithm. The modification was inspired by the PSO algorithm to update positions based on the velocity and memory items in the local search stage. It was tested with complex problems and FS benchmark datasets and was compared with different optimization methods.
Utilizing the high performance of the MH algorithms in FS applications, in this paper, we proposed a new FS approach, using a modified version of the Dwarf mongoose optimization algorithm [22]. The DMO was recently developed based on dwarf mongoose foraging behavior in nature. It has three social groups that are used in the algorithm design, called alpha, babysitters, and scout groups. The DMO was assessed using different and complex optimization and engineering problems. The outcomes confirmed its competitive performance. Like other MH methods, an individual MH may face some limitations during the search process. The main limitation of the original DMO is the convergence speed and trapping at local optima. This occurred since the balance between the exploration and exploitation may be weak. In general, exploration phase aims to discover the feasible regions which contain the optimal solutions, whereas, the exploitation aims to discover the optimal solution inside the feasible region. To solve this issue, in this paper, we use a search technique called Quantum-based optimization (QBO) [23]. The main goal of the QBO is to provide better balancing between exploration and exploitation phases to produce efficient solutions. Actually, the QBO has been applied to enhance the performance of several MH techniques, for example, the quantum Henry gas solubility optimization (QHGSO) algorithm [24], the quantum salp swarm algorithm (QSSA) [25], quantum GA (QGA) [26], and quantum marine predators algorithm (QMPA) [27].
The proposed method, called DMOAQ, starts by dividing the sample of the testing set into training and testing. It is followed by setting the initial value for a set of individuals that represent the solution for the tested problem, and then followed by computing the fitness value for each of them using the training sample and allocating the best of them. After that, it uses the operators of DMO to update the current solutions. The process of enhancing the value of solutions is conducted until it reaches the stop condition. Then, it uses the best solution to evaluate the learned model based on the reduced testing set. The developed DMOAQ is tested with different datasets, as well as compared to a number of MH optimization methods to verify its performance.
In short, the main objectives and contributions of this study are listed as follows:
- To develop a new variant of the Dwarf Mongoose Optimization Algorithm (DMO) algorithm as feature selection.
- To achieve an optimal balance between exploitation and exploration for the DMO algorithm, we utilized a Quantum-based optimization technique. Thus, a new version of the DMO, called DMOQA, was developed and applied as an FS approach.
- To evaluate the performance of DMOAQ using a set of different UCI datasets and high dimensional datasets. In addition, we compare it with other well-known FS methods.
The structure of the rest of the sections of this study is given as: Section 2 introduces the background of the Dwarf Mongoose Optimization Algorithm and Quantum-based optimization. Section 3 shows the steps of the developed method. Section 4 presents the experimental results and their discussion. The conclusion and future are introduced in Section 5.
2. Background
2.1. Dwarf Mongoose Optimization Algorithm
The Dwarf Mongoose Optimization (DMO) Algorithm is introduced in [22], as an MH technique that simulates the behavior of the Dwarf Mongoose in nature during searching for food. In general, DMO contains five phases, beginning with the initiation phase, followed by the alpha group phase, when the female alpha directs the exploration of new locations. The phase of the scout group is when new sleeping mounds (i.e., food source) are explored based on old sleeping mounds. Additionally, a greater variety of terrain is explored as foraging intensity increases. The babysitting group phase, which is only carried out when the timer value exceeds the value of the babysitting exchange parameter, is marked in green. The termination phase, which is indicated in neon green, is where the algorithm finally comes to a halt. A thorough explanation is shown in the following phases.
2.1.1. Phase 1: Initialization
The Dwarf Mongoose Optimization Algorithm begins by creating a matrix of size () and initializing the population of mongooses (X) as Equation (1), where the problem dimensions (d) are represented in columns and the population size (n) is displayed in rows.
An element () is the component of the problem’s jth dimension found in the population’s ith solution. Typically, its value is determined by using Equation (2) as a uniformly distributed random value that is constrained by the problem’s upper () and lower () limits.
2.1.2. Phase 2: Alpha Group
The next step in DMO is to compute the fitness value () of each solution then compute its probability, and this process is formulated as:
where the number of mongooses n is updated using the following formula.
In Equation (4), refers to number of babysitters.
The female alpha of the group uses a distinctive vocalisation () to communicate with the others. This is used to coordinate the movement of the group in the large foraging area. So, the DMO uses the following equation to update the value of solution .
where is an integer that is produced randomly from the range [–1,1] for each iteration. In addition, the sleeping mound is updated using Equation (6).
Followed by calculating the average sleeping mound (), as in Equation (7):
2.1.3. Step 3: Scouting Group
The fresh candidate places for food or a sleeping mound are scouted during the algorithm’s scouting phase while existing sleeping mounds are ignored in accordance with nomadic customs. Scouting and foraging take place simultaneously, with the scouted areas only being visited after the babysitters’ exchange criterion is met. The current location of the sleeping mound, a movement vector (M), a stochastic multiplier (), and a movement regulating parameter () are used to steer the scouted places for the food and sleeping mounds, as shown in Equation (8).
The future movement depends on the performance of the mongoose group, and the new scouted position () is simulated with both success and failure of improvement of the overall performance in mind.
The movement of mongoose (M) described in Equation (9) is regulated via the collective-volitive parameter (), which is computed in Equation (10).
At the start of the search phase, the collective-volitive parameter allows for rapid exploration, but, with each iteration, the focus gradually shifts from discovering new regions to exploiting productive ones.
2.1.4. Phase 4: Babysitting Group
The alpha group switches positions with babysitters in the late afternoon and early evening, providing the alpha female an opportunity to look after the colony’s young. The population size affects the ratio of caregivers to foraging mongooses. The following Equation (11) is modeled to imitate the exchange process after midday or in the evening.
Until the counter (C) surpasses the exchange criteria parameter, at which point the data collected by the preceding foraging group are re-initialized, and the counter is reset to zero, the alpha continues in the scout phase. The babysitter’s initial weight is set to zero in order to ensure that the average weight of the alpha group is decreased in the following iteration, which promotes exploitation.
2.1.5. Phase 5: Termination
The dwarf mongoose algorithm stops once the maximum number of defined iterations has been reached and returns the best result obtained during execution.
2.2. Quantum-Based Optimization
Within this section, the basic information for the quantum-based optimization (QBO) is introduced. In QBO, a binary number is used to represent the features that will be either selected (1) or eliminated (0). Each feature in QBO is represented by a quantum bit (Q-bit (q)), where q denotes the superposition of binary values (i.e., ‘1’ and ‘0’). The following equation [23] can be used to establish the mathematical formulation of Q-bit(q).
where the possibility of the value of the Q-bit being ‘0’ and ‘1’ is given by and , respectively. The parameter denotes the angle of q, and it is updated using (/).
The process of finding the changing in the value of q is the main objective of QBO, and it is determined by calculating as:
In Equation (14), is the rotation angle of ith Q-bit of jth Q-solution. The value of is predefined based on as in Table 1, and followed the experimental tests conducted on the knapsack problems [28].

Table 1.
Predefined value of .
3. Proposed Method
In order to improve the ability to strike a better balance between the exploration and exploitation of DMA while looking for a workable solution, QBO is used. The training and testing sets of the newly created FS method, DMOAQ, are composed of 70% and 30% of the total data, respectively. Then, using the training samples, the fitness values for each population are calculated. After that, the best agent is allocated, which has the lowest fitness value. The solutions are modified using the operators of DMA during the exploitation phase. Updating of each individual continues until the stop criteria are met.
After that, the testing set’s dimension is reduced depending on the best solution, and the implemented DMOAQ as FS is evaluated using a variety of metrics. The DMOAQ (Figure 1) is thoroughly covered in the following sections.
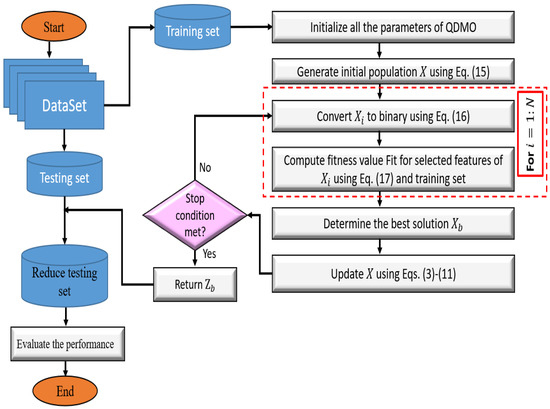
Figure 1.
The main work flow of the proposed DMOAQ feature selection method.
3.1. First Stage
At this point, the N agents representing the population are made. In this study, each solution contains D features and Q-bits. As a result, the formulation of the solution is in Equation (15).
A collection of superpositions of probabilities for those features that are either selected or not are referred to as in this equation.
3.2. Second Stage
Updating the agents until they meet the stop criteria is the main goal of this stage of the DMOAQ. This is conduucted by a number of stages, the first of which is to use Equation (16) to obtain the binary of each unique :
where is defined in Equation (12). is the random value. The next step is to learn the classifier using the training features that correspond to the ones in and compute the fitness value, which is defined as:
The total number of features that were chosen is shown in Equation (17) by the variables , and is the error classification using the classifier (i.e., relevant features). The factor that equalizes the fitness value of two parts is .
3.3. Third Stage
At this point, the testing set is reduced by only choosing features that match those in the binary version of . The output of the testing set is then predicted using the trained classifier on the testing set’s reduced dimension. The output’s quality is then evaluated using a variety of metrics. Algorithm 1 details the DMOAQ algorithm’s steps.
| Algorithm 1 The DMOAQ method. |
|
4. Experimental Setup and Dataset
In this section, the quality of the proposed DMOAQ is computed through a set of two experimental series. The first experiment used a set of eighteen UCI datasets. Whereas, the second experiment aims to assess the performance of DMOAQ using eight high-dimensional datasets collected from different domains.
4.1. Performance Measures
This study uses six performance metrics to evaluate the effectiveness of the developed DMOAQ. These metrics represent the averages of the accuracy, standard deviation, the selected attributes, and fitness value, as well as the minimum fitness value and maximum fitness value. The definitions of each of them are given as the following.
where FN, TN, FP and TP, denotes false negative, true negative, false positive, and true positive, respectively.
Maximum () of the fitness value () is defined in Equation (17).
Minimum () of the fitness value () is defined in Equation (17).
Standard deviation () of the fitness value () is defined in Equation (17).
where is the number of runs and the average of is given by .
To validate the performance of developed DMOAQ, it is compared to other methods, including traditional DMOA, grey-wolf optimization algorithm (GWO) [29], Chameleon Swarm Algorithm [30], Electric fish optimization (EFO) [31], Atomic orbital search (AOS) [32], Arithmetic Optimization (AO) [33], Reptile Search Algorithm (RSA) [34], LSHDE [35], sinusoidal parameter adaptation incorporated with L-SHADE (LSEpSin) [36], L-SHADE with Semi Parameter Adaptation (LSPA) [37] and Chaotic heterogeneous comprehensive learning particle swarm optimizer (CHCLPSO) [38]. The parameters of each technique is put according to the original implementation of each of them. Whereas, the common parameters such as and N are sets of 50 and 20, respectively. To obtain the average of the performance measures, each algorithm is conducted 25 times.
4.2. Experimental Series 1: FS Using UCI Datasets
In this section, the proposed DMOAQ is evaluated in selecting the relevant features using eighteen datasets [39]. These datasets were collected from different fields, and they consist of a varying number of instances, features, and classes. The descriptions of these datasets are given in Table 2.

Table 2.
Description of UCI datasets.
The results of the DMOAQ are compared to eleven algorithms; these algorithms are: DMOA, bGWO, Chameleon, EFO, AOS, AO, RSA, LSHADE, LSHADE-cnEpSin (LcnE), LSHADE-SPACMA (LSPA) and CHCLPSO. In this regard, six performance measures are used, namely the average (Avg), maximum (MAX), minimum (MIN), and standard deviation (St) of the fitness function values, as well as the accuracy (Acc) and the number of the selected features. All results are presented in Table 3, Table 4, Table 5, Table 6 and Table 7.

Table 3.
Average of the fitness function values.

Table 4.
Standard deviation of the fitness function values.

Table 5.
Minimum of the fitness function values.

Table 6.
Maximum of the fitness function values.

Table 7.
Accuracy measure for all datasets.
Table 3 shows the results of the average of the fitness function for the DMOAQ and the compared algorithms for all datasets. The DMOAQ achieved the best results in 7 out of 18 datasets (i.e., Exactly, KrvskpEW, M-of-n, Tic-tac-toe3, WaveformEW, WineEW, and Zoo). The AO obtained the second rank by obtaining the best fitness function values in 4 datasets (i.e., Breastcancer4, IonosphereEW, PenglungEW, and SonarEW). The Chameleon and bGWO were ranked third and fourth, respectively. The AOS and RSA showed good results and came in the fifth and sixth ranks. Whereas, the rest of the algorithms were ranked as follows: DMOA, EFO, LSHADE, and LSHADE-SPACMA, respectively. The worst values were obtained by the LSHADE-cnEpSin. Figure 2 illustrates the fitness functions’ average for all datasets for this measure.

Figure 2.
Average of values of the fitness function.
Table 4 presents the standard deviation values for the algorithms. The proposed DMOAQ showed acceptable standard deviation values, whereas, the CHCLPSO showed the smallest Std values followed by LSHADE and LSHADE-SPACMA. The worst results were shown by the bGWO, Chameleon, and LSHADE-SPACMA. The rest of the algorithms showed similar results to some extent. Figure 3 illustrates the standard deviation average of the fitness functions for all datasets for this measure.
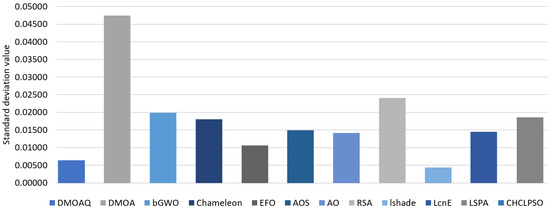
Figure 3.
Average of the standard deviation of the fitness function.
Moreover, the best results of the fitness function values are recorded in Table 5. This table indicates that the proposed DMOAQ obtained the minimum fitness values in 8 out of 18 datasets. It was ranked first with obtaining the best Min results in Exactly, KrvskpEW, M-of-n, Tic-tac-toe3, Vote, WaveformEW, WineEW, and Zoo. The Chameleon showed the second-best results and obtained the best values in 6 out of 18 datasets. Both bGWO, AOS, and AO were ranked third, fourth, and fifth, respectively. The worst performances were shown by LSHADE-cnEpSin, LSHADE, and LSHADE-SPACMA. Figure 4 illustrates the minimum average of the fitness functions for all datasets for this measure.

Figure 4.
Average of minimum values of the fitness function.
Table 6 records the results of the worst results of the fitness function values for the compared methods. Based on these, the proposed DMOAQ showed good Max values compared to the other methods; it achieved the best values in 44% of all datasets, namely: Breastcancer4, Exactly, KrvskpEW, M-of-n, Tic-tac-toe3, WaveformEW, WineEW, and Zoo, whereas, it provided competitive results in the rest datasets. The DMOA obtained the best results in three datasets, namely: IonosphereEW, Lymphography, and WineEWsimilar, and was ranked second, followed by AO, AOS, and Chameleon. Figure 5 illustrates the maximum average of the fitness functions for all datasets for this measure. Although both LSHADE-SPACMA obtained the best results in two datasets, its average value was worse than most algorithms, which means it showed the best values in only Exactly2 and SpectEW datasets. The worst performances were shown by LSHADE, LSHADE-SPACMA, and CHCLPSO algorithms.
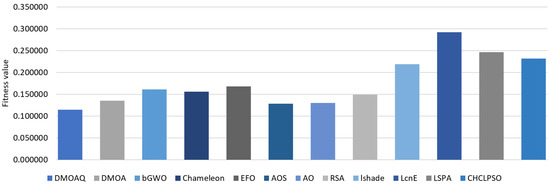
Figure 5.
Average of maximum values of the fitness function.
In terms of the accuracy measure, Table 7 shows the average of the classification accuracy for all methods. This table indicates the best performance of the DMOAQ in 44% of all datasets namely: namely: Exactly, Exactly2, IonosphereEW, KrvskpEW, M-of-n, WaveformEW, WineEW, and Zoo, which indicates the good ability of the DMOAQ in correctly classifying the datasets. The AOS and AO obtained the second and third ranks, followed by Chameleon and bGWO, respectively. The lowest accuracy results were obtained by the LSHADE and LSHADE-cnEpSin algorithms. Figure 6 illustrates the classification accuracy average for all datasets for this measure.
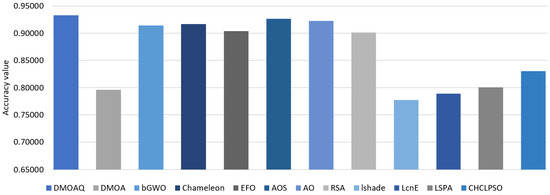
Figure 6.
Average of the classification accuracy for UCI datasets.
4.3. Experimental Series 1: FS for High Dimensional Datasets
This section evaluates the proposed DMOAQ a set of high dimensional datasets (https://archive.ics.uci.edu/ml/datasets.php, accessed on 20 October 2022) as described in Table 8. These datasets were gathered from the UCI machine learning repository and additional sources, and they span a variety of uses, such as event detection, sentiment analysis, and sensor-based human activity recognition. Eight datasets in total were acquired, including five from the UCI repository and the GPS trajectories dataset, which records the GPS coordinates, trajectory identifier, and duration of moving cars and buses in a city. GAS sensors dataset, which is a collection of 100 records containing temperature, humidity, and data from 8 MOX gas sensors in a home environment. With the help of a Wireless Sensor Network (WSN), the MovementAAL (Indoor User Mobility Prediction using RSS) dataset predicts an indoor user’s movement using radio signal strength (RSS) from multiple WSN nodes and user movement patterns. In order to determine whether a patient will live or die, the Hepatitis dataset includes 155 records of hepatitis C patients. A total of 30 people performing six various activities while holding the smartphone around their waist, including walking, sitting, standing, and lying, are included in the UCI-HAR dataset for human activity recognition. Both the SemEval2017 Task4 [40] dataset and the STS-Gold [41] dataset are English textual datasets for sentiment analysis that were gathered from Twitter, where each tweet is categorized as positive, negative, or neutral. A crisis event detection dataset in English called the C6 is used to forecast crises, including hurricanes, floods, earthquakes, tornadoes, and wildfires [42].

Table 8.
The number of features and samples in each dataset.
The experimental results of the DMOAQ method are compared to nine algorithms, namely: DMOA, bGWO, Chameleon, RunEFO, AOS, AO, RSA, LSHADE, and LSHADE-cnEpSin (LenE), LSHADE-SPACMA (LSPA), and CHCLPSO. The performance of the proposed DMOAQ is evaluated using five metrics, namely the average values of the fitness function and the selected feature number, as well as the classification accuracy, sensitivity, and specificity. The results are recorded in Table 9, Table 10, Table 11, Table 12 and Table 13.

Table 9.
Average of the fitness function values.

Table 10.
Number of selected features obtained from competitive algorithms.

Table 11.
Accuracy obtained from competitive algorithm for all datasets.

Table 12.
Sensitivity obtained from competitive algorithm for all datasets.

Table 13.
Specificity obtained from competitive algorithm for all datasets.
The results of the fitness function average for the NLP datasets are recorded in Table 9. From this table, the DMOAQ achieved the best average in 63% of the datasets (i.e., STSGold, sensors, Movm, UCI, and C6); however, it obtained the same results with RSA in the Trajectory dataset. By these results, the DMOAQ method was ranked first. The RSA algorithm was ranked second by obtaining the best average in 2 datasets (i.e., Trajectory and hepatitis), followed by the AO, and it obtained the best results in the Sem dataset. The rest of the methods were ordered as follows: by Chameleon, bGWO, DMOA, and AOS, respectively. The worst result was shown by the EFO. Figure 7 illustrates the fitness functions’ average for all datasets for this measure.
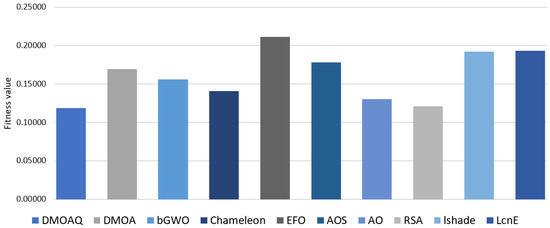
Figure 7.
Average of the fitness function values.
Moreover, the selected feature numbers by all methods are recorded in Table 10. In this measure, the best method is the one that can determine the relevant features with the highest accuracy value. As shown in Table 10, the DMOAQ method selected the smallest features amount and considered the best method; in detail, it obtained the lowest features in 7 out of 8 datasets. The Chameleon was the second-best algorithm, followed by AO, bGWO, RSA, and DMOA. Figure 8 shows the ratio of the selected features for all datasets for this measure.
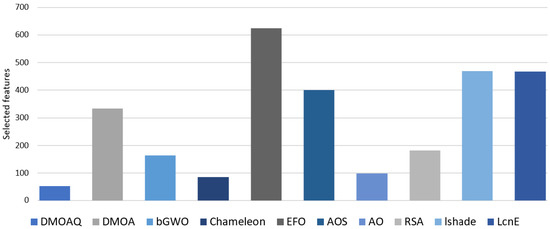
Figure 8.
Ratio of the selected features for all datasets.
Furthermore, the results of the classification accuracy results are presented in Table 11. The DMOAQ method, as in this table, obtained the highest accuracy results in 3 out of 8 datasets, namely: sensors, Movm, and UCI datasets, whereas, it showed the same results in two datasets with RSA in Trajectory and EFO in C6. The second-best algorithm was the RSA. The AO came in the third rank, followed by DMOA, LSHADE, and Chameleon, respectively. The worst accuracy results were recorded by the AOS. Figure 9 illustrates the classification accuracy average for all datasets for this measure.
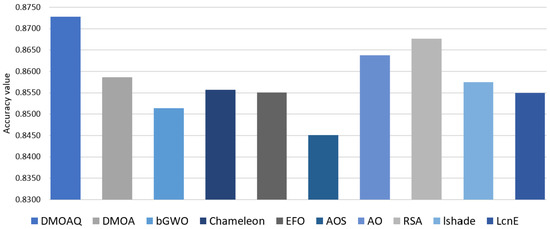
Figure 9.
Average of the classification accuracy for all datasets.
In terms of the sensitivity measure, Table 12 reports the results of this measure for all datasets. From Table 12, the proposed DMOAQ showed good sensitivity results in all datasets and obtained the best sensitivity value in c6 datasets and the same values with AO and RSA in both sensors and hepatitis datasets; however, it was ranked second after the RSA algorithm. The AO came in the third rank, followed by DMOA and LSHADE. The AOS was also ranked last.
Moreover, Table 13 records the values of the specificity measure. From this table, the proposed DMOAQ obtained the best specificity results in 3 out of 8 datasets and showed the same results with AO and RSA in the sensors dataset. In addition, the DMOAQ obtained the best specificity average for all datasets equal to 0.9313, whereas the second-best algorithms (i.e., DMOA) obtained a specificity average equal to 0.9188. The third and fourth algorithms were Chameleon and LSHADE. The rest algorithms showed the same results to some extent.
Although the proposed method showed good results in most cases, it failed to reach the optimal values in some datasets because it is sensitive to the initial population, which needs to be improved in the future studies with different methods such as chaotic maps.
5. Conclusions and Future Work
In this paper, a new feature selection method has been presented. This method was called DMOAQ which depends on improving the performance of dwarf mongoose optimization (DMO) algorithm using quantum-based optimization (QBO). The main idea of the proposed method is to increase the balance between the exploration and exploitation of the traditional DMO during the searching process using the QBO to avoid the search limitations of the DMO. The performance of the DMOAQ has evaluated over 18 benchmark feature selection datasets and eight high dimensional datasets. The results were compared to well-known metaheuristic algorithms. The evaluation outcomes demonstrated that the QBO had significantly enhanced the search capability of the traditional DMO, whereas it obtained the best accuracy in 44% of the benchmark datasets as well as 62% in the high dimensional datasets. In the future, the proposed method will be evaluated in different applications such as image segmentation, parameter estimation, and solving real engineering problems. In addition, it can be applied to solve multi-objective optimization problems.
Author Contributions
M.A.E. and R.A.I., conceptualization, supervision, methodology, formal analysis, resources, data curation, and writing—original draft preparation. S.A., writing—review and editing. M.A.A.A.-q., formal analysis, validation, writing—review and editing. S.A., writing—review, editing, and editing, project administration, and funding acquisition. A.A.E., supervision, resources, formal analysis, methodology and writing—review and editing. All authors have read and agreed to the published version of the manuscript.
Funding
Princess Nourah bint Abdulrahman University Researchers Supporting Project number (PNURSP2022R197), Princess Nourah bint Abdulrahman University, Riyadh, Saudi Arabia.
Data Availability Statement
The data available upon request.
Conflicts of Interest
The authors declare that there are no conflict of interest regarding the publication of this paper.
References
- Xu, Z.; Heidari, A.A.; Kuang, F.; Khalil, A.; Mafarja, M.; Zhang, S.; Chen, H.; Pan, Z. Enhanced Gaussian Bare-Bones Grasshopper Optimization: Mitigating the Performance Concerns for Feature Selection. Expert Syst. Appl. 2022, 212, 118642. [Google Scholar] [CrossRef]
- Varzaneh, Z.A.; Hossein, S.; Mood, S.E.; Javidi, M.M. A new hybrid feature selection based on Improved Equilibrium Optimization. Chemom. Intell. Lab. Syst. 2022, 228, 104618. [Google Scholar] [CrossRef]
- Al-qaness, M.A. Device-free human micro-activity recognition method using WiFi signals. Geo-Spat. Inf. Sci. 2019, 22, 128–137. [Google Scholar] [CrossRef]
- Dahou, A.; Al-qaness, M.A.; Abd Elaziz, M.; Helmi, A. Human activity recognition in IoHT applications using Arithmetic Optimization Algorithm and deep learning. Measurement 2022, 199, 111445. [Google Scholar] [CrossRef]
- Remeseiro, B.; Bolon-Canedo, V. A review of feature selection methods in medical applications. Comput. Biol. Med. 2019, 112, 103375. [Google Scholar] [CrossRef]
- Pintas, J.T.; Fernandes, L.A.; Garcia, A.C.B. Feature selection methods for text classification: A systematic literature review. Artif. Intell. Rev. 2021, 54, 6149–6200. [Google Scholar] [CrossRef]
- Raj, R.J.S.; Shobana, S.J.; Pustokhina, I.V.; Pustokhin, D.A.; Gupta, D.; Shankar, K. Optimal feature selection-based medical image classification using deep learning model in internet of medical things. IEEE Access 2020, 8, 58006–58017. [Google Scholar] [CrossRef]
- AL-Alimi, D.; Al-qaness, M.A.; Cai, Z.; Dahou, A.; Shao, Y.; Issaka, S. Meta-Learner Hybrid Models to Classify Hyperspectral Images. Remote Sens. 2022, 14, 1038. [Google Scholar] [CrossRef]
- Onel, M.; Kieslich, C.A.; Guzman, Y.A.; Floudas, C.A.; Pistikopoulos, E.N. Big data approach to batch process monitoring: Simultaneous fault detection and diagnosis using nonlinear support vector machine-based feature selection. Comput. Chem. Eng. 2018, 115, 46–63. [Google Scholar] [CrossRef]
- Dahou, A.; Abd Elaziz, M.; Chelloug, S.A.; Awadallah, M.A.; Al-Betar, M.A.; Al-qaness, M.A.; Forestiero, A. Intrusion Detection System for IoT Based on Deep Learning and Modified Reptile Search Algorithm. Comput. Intell. Neurosci. 2022, 2022, 6473507. [Google Scholar] [CrossRef]
- Anter, A.M.; Ali, M. Feature selection strategy based on hybrid crow search optimization algorithm integrated with chaos theory and fuzzy c-means algorithm for medical diagnosis problems. Soft Comput. 2020, 24, 1565–1584. [Google Scholar] [CrossRef]
- Al-qaness, M.A.; Ewees, A.A.; Fan, H.; AlRassas, A.M.; Abd Elaziz, M. Modified aquila optimizer for forecasting oil production. Geo-Spat. Inf. Sci. 2022, 1–17. [Google Scholar] [CrossRef]
- Bashir, S.; Khan, Z.S.; Khan, F.H.; Anjum, A.; Bashir, K. Improving heart disease prediction using feature selection approaches. In Proceedings of the 16th IEEE International Bhurban Conference on Applied Sciences and Technology (IBCAST), Islamabad, Pakistan, 8–12 January 2019; pp. 619–623. [Google Scholar]
- Yedukondalu, J.; Sharma, L.D. Cognitive load detection using circulant singular spectrum analysis and Binary Harris Hawks Optimization based feature selection. Biomed. Signal Process. Control. 2022, 79, 104006. [Google Scholar] [CrossRef]
- Başaran, E. A new brain tumor diagnostic model: Selection of textural feature extraction algorithms and convolution neural network features with optimization algorithms. Comput. Biol. Med. 2022, 148, 105857. [Google Scholar] [CrossRef]
- Rashno, A.; Shafipour, M.; Fadaei, S. Particle ranking: An Efficient Method for Multi-Objective Particle Swarm Optimization Feature Selection. Knowl.-Based Syst. 2022, 245, 108640. [Google Scholar] [CrossRef]
- Nadimi-Shahraki, M.H.; Zamani, H.; Mirjalili, S. Enhanced whale optimization algorithm for medical feature selection: A COVID-19 case study. Comput. Biol. Med. 2022, 148, 105858. [Google Scholar] [CrossRef]
- Hassan, I.H.; Mohammed, A.; Masama, M.A.; Ali, Y.S.; Abdulrahim, A. An Improved Binary Manta Ray Foraging Optimization Algorithm based feature selection and Random Forest Classifier for Network Intrusion Detection. Intell. Syst. Appl. 2022, 16, 200114. [Google Scholar] [CrossRef]
- Eluri, R.K.; Devarakonda, N. Binary Golden Eagle Optimizer with Time-Varying Flight Length for feature selection. Knowl.-Based Syst. 2022, 247, 108771. [Google Scholar] [CrossRef]
- Balasubramanian, K.; Ananthamoorthy, N. Correlation-based feature selection using bio-inspired algorithms and optimized KELM classifier for glaucoma diagnosis. Appl. Soft Comput. 2022, 128, 109432. [Google Scholar] [CrossRef]
- Long, W.; Xu, M.; Jiao, J.; Wu, T.; Tang, M.; Cai, S. A velocity-based butterfly optimization algorithm for high-dimensional optimization and feature selection. Expert Syst. Appl. 2022, 201, 117217. [Google Scholar] [CrossRef]
- Agushaka, J.O.; Ezugwu, A.E.; Abualigah, L. Dwarf mongoose optimization algorithm. Comput. Methods Appl. Mech. Eng. 2022, 391, 114570. [Google Scholar] [CrossRef]
- Xing, H.; Ji, Y.; Bai, L.; Sun, Y. An improved quantum-inspired evolutionary algorithm for coding resource optimization based network coding multicast scheme. AEU Int. J. Electron. Commun. 2010, 64, 1105–1113. [Google Scholar] [CrossRef]
- Mohammadi, D.; Abd Elaziz, M.; Moghdani, R.; Demir, E.; Mirjalili, S. Quantum Henry gas solubility optimization algorithm for global optimization. Eng. Comput. 2021, 38, 2329–2348. [Google Scholar] [CrossRef]
- Chen, R.; Dong, C.; Ye, Y.; Chen, Z.; Liu, Y. QSSA: Quantum evolutionary salp swarm algorithm for mechanical design. IEEE Access 2019, 7, 145582–145595. [Google Scholar] [CrossRef]
- SaiToh, A.; Rahimi, R.; Nakahara, M. A quantum genetic algorithm with quantum crossover and mutation operations. Quantum Inf. Process. 2014, 13, 737–755. [Google Scholar] [CrossRef]
- Abd Elaziz, M.; Mohammadi, D.; Oliva, D.; Salimifard, K. Quantum marine predators algorithm for addressing multilevel image segmentation. Appl. Soft Comput. 2021, 110, 107598. [Google Scholar] [CrossRef]
- Srikanth, K.; Panwar, L.K.; Panigrahi, B.K.; Herrera-Viedma, E.; Sangaiah, A.K.; Wang, G.G. Meta-heuristic framework: Quantum inspired binary grey wolf optimizer for unit commitment problem. Comput. Electr. Eng. 2018, 70, 243–260. [Google Scholar] [CrossRef]
- Ibrahim, R.A.; Elaziz, M.A.; Lu, S. Chaotic opposition-based grey-wolf optimization algorithm based on differential evolution and disruption operator for global optimization. Expert Syst. Appl. 2018, 108, 1–27. [Google Scholar] [CrossRef]
- Braik, M.S. Chameleon Swarm Algorithm: A bio-inspired optimizer for solving engineering design problems. Expert Syst. Appl. 2021, 174, 114685. [Google Scholar] [CrossRef]
- Yilmaz, S.; Sen, S. Electric fish optimization: A new heuristic algorithm inspired by electrolocation. Neural Comput. Appl. 2020, 32, 11543–11578. [Google Scholar] [CrossRef]
- Azizi, M. Atomic orbital search: A novel metaheuristic algorithm. Appl. Math. Model. 2021, 93, 657–683. [Google Scholar] [CrossRef]
- Abualigah, L.; Diabat, A.; Mirjalili, S.; Abd Elaziz, M.; Gandomi, A.H. The arithmetic optimization algorithm. Comput. Methods Appl. Mech. Eng. 2021, 376, 113609. [Google Scholar] [CrossRef]
- Abualigah, L.; Abd Elaziz, M.; Sumari, P.; Geem, Z.W.; Gandomi, A.H. Reptile Search Algorithm (RSA): A nature-inspired meta-heuristic optimizer. Expert Syst. Appl. 2022, 191, 116158. [Google Scholar] [CrossRef]
- Tanabe, R.; Fukunaga, A.S. Improving the search performance of SHADE using linear population size reduction. In Proceedings of the 2014 IEEE Congress on Evolutionary Computation (CEC), Beijing, China, 6–11 July 2014; pp. 1658–1665. [Google Scholar]
- Awad, N.H.; Ali, M.Z.; Suganthan, P.N.; Reynolds, R.G. An ensemble sinusoidal parameter adaptation incorporated with L-SHADE for solving CEC2014 benchmark problems. In Proceedings of the 2016 IEEE Congress on Evolutionary Computation (CEC), Vancouver, BC, Canada, 24–29 July 2016; pp. 2958–2965. [Google Scholar]
- Mohamed, A.W.; Hadi, A.A.; Fattouh, A.M.; Jambi, K.M. LSHADE with semi-parameter adaptation hybrid with CMA-ES for solving CEC 2017 benchmark problems. In Proceedings of the 2017 IEEE Congress on Evolutionary Computation (CEC), Donostia, Spain, 5–8 June 2017; pp. 145–152. [Google Scholar]
- Yousri, D.; Allam, D.; Eteiba, M.; Suganthan, P.N. Chaotic heterogeneous comprehensive learning particle swarm optimizer variants for permanent magnet synchronous motor models parameters estimation. Iran. J. Sci. Technol. Trans. Electr. Eng. 2020, 44, 1299–1318. [Google Scholar] [CrossRef]
- Dua, D.; Graff, C. UCI Machine Learning Repository; University of California, School of Information and Computer Science: Irvine, CA, USA, 2017. [Google Scholar]
- Rosenthal, S.; Farra, N.; Nakov, P. SemEval-2017 task 4: Sentiment analysis in Twitter. arXiv 2019, arXiv:1912.00741. [Google Scholar]
- Ahuja, R.; Sharma, S. Sentiment Analysis on Different Domains Using Machine Learning Algorithms. In Advances in Data and Information Sciences; Springer: Berlin/Heidelberg, Germany, 2022; pp. 143–153. [Google Scholar]
- Liu, J.; Singhal, T.; Blessing, L.T.; Wood, K.L.; Lim, K.H. Crisisbert: A robust transformer for crisis classification and contextual crisis embedding. In Proceedings of the 32nd ACM Conference on Hypertext and Social Media, Virtual, 30 August–2 September 2021; pp. 133–141. [Google Scholar]
Publisher’s Note: MDPI stays neutral with regard to jurisdictional claims in published maps and institutional affiliations. |
© 2022 by the authors. Licensee MDPI, Basel, Switzerland. This article is an open access article distributed under the terms and conditions of the Creative Commons Attribution (CC BY) license (https://creativecommons.org/licenses/by/4.0/).