Abstract
In probabilistic analysis, random variables with unknown distributions are often appeared when dealing with practical engineering problem. A Hermite normal transformation model has been proposed to conduct structural reliability assessment without the exclusion of random variables with unknown probability distributions. Recently, linear moments (L-moments) are widely used due to the advantages of stability and insensitivity. In this paper, the complete expressions of the inverse transformation of L-moments Hermite (L-Hermite) model have been proposed. The criteria are proposed to derive the complete inverse transformation of performance function and the complete expressions of the inverse transformation of L-Hermite model are formulated. Moreover, a first-order reliability method for structural reliability analysis based on the proposed inverse transformation of L-Hermite model is then developed using the first four L-moments of random variables. Through the numerical examples, the proposed method is found to be efficient for normal transformations since the results of the proposed L-Hermite are in close agreement with the results of Rosenblatt transformation. Additionally, the reliability index obtained by the proposed method using the first four L-moments of random variables provides a close result to the reliability index obtained by first-order reliability method with known probability density functions in structural reliability assessment.
Keywords:
normal transformation; L-moments; complete expression; Hermite model; structural reliability; inverse transformation; complete expressions; first-order reliability method; random variables; practical engineering MSC:
60K10
1. Introduction
One basic problem of structural reliability analysis is calculating the failure probability. In practical engineering, it is usually necessary to consider the uncertainties both from the structure itself and the external load [1,2]; therefore, the calculation of failure probability is usually a high-dimensional integral, which is difficult to solve directly. Under the background, various reliability approximation methods have been developed during the past five decades, such as Monte Carlo simulation (MCS) [3,4], first-order reliability method (FORM) [5,6], second-order reliability method (SORM) [7,8,9], the moment methods and simulation methods for estimating the failure probability [10,11]. However, almost all these methods are assumed to have normally distributed random variables. Normal transformation techniques are realized when dealing with non-normal random variables. The normal transformation (the x-u transformation) and its inverse transformation (the u-x transformation) can be applied using the Rosenblatt [12] or Nataf transformation [13] with known probability density functions (PDFs). However, as we all know, the distributions of the random variables are often unknown in many practical engineering problems, so it is a fatal task to realize the x-u and u-x transformation by conventional methods. To solve the problem, Fleishman suggested the third-order polynomial normal transformation, in which the u-x transformation can be realized by using the first four central moments (C-moments). Due to the complex solution of the polynomial coefficients, some explicit expressions of coefficients have been developed, such as the second-order Fisher-Cornish expansion [14], Winterstein’s formula [15], and the four C-moments standardization function of the Hermite model [16,17]. Among them, the C-moments standardization function of the Hermite model is explicit and efficient for x-u transformation. However, studies have shown that the numerical values of sample C-moments, particularly when the sample size is small, may be very different from those of the probability distribution from which the sample was drawn [18].
The linear moments (L-moments) are an alternative moment system used to characterize the shape of a probability distribution. The concept of L-moments originates from various disconnected results on linear combinations of order statistics. Hosking [18] unified the theory of L-moments and provided guidelines for the practical use of L-moments. L-moments have the advantage of stability and are relatively robust to the effects of outliers [18]. Due to these advantages, L-moments have been used for hydrological and structural reliability [19,20,21,22,23,24,25,26,27,28]. For example, Ahmad et al. [18] performed the flood frequency analysis of annual maximum stream flows over the station in Negeri Sembilan by using the L-moments; Pandey et al. [20] evaluated the effectiveness of the method of L-moments for estimating parameters of the Pareto distribution model of peaks over a sufficiently high threshold; MacKenzie and Winterstein [23] compared L-moments and conventional C-moments to model current speeds in the North sea; Winterstein and MacKenzie [24] proposed the Hermite model based on L-moments and estimated extreme response statistics using this Hermite model, in which the polynomial coefficients of u-x transformation have been derived; Tung [25] proposed the simple and explicit expressions for the polynomial coefficients in normal transformation based on L-moments; Tong et al. [28] proposed a method for simulating strongly non-Gaussian and non-stationary processes by combining Karhunen–Loève expansion with the L-moments-based Hermite polynomial model. From past research, it can be concluded that the L-Hermite transformation mainly focuses on the u-x transformation. However, the expression of the inverse transformation (the x-u transformation) for the L-Hermite model is still lacking. Without a clear definition of the complete expression of the polynomial normal transformation by the L-Hermite model and the corresponding monotonic regions of x or u, the L-Hermite model will be unsuitable for reliability engineering.
The project of this paper is to find the complete expression of inverse transformation based on the L-Hermite model. Moreover, a combination of L-moments and FORM for calculating the reliability index is proposed. This paper is organized as follows. The definition of L-moments is provided in Section 1. The complete expressions of the transformation, including the x-u transformation and the u-x transformation, are derived in Section 2. Section 3 is to show the method of combination of L-moments and FORM. The accuracy and efficiency of the proposed complete expressions of the inverse transformation of the L-Hermite model and correlated transformation for structural reliability assessment are demonstrated in Section 4. The findings of this paper are finally summarized in Section 5.
2. The L-Hermite Models
2.1. General Results for L-Moments
Let X be a random variable and let X1:n≤ X2:n ≤…≤ Xn:n be the order statistics, a random variable distributed as the j-th smallest element of a random sample of size n drawn from the distribution of X. Hosking [18] defined the L-moments of X to be the quantities
The L in ‘L-moments’ emphasizes that is a linear function of the expected order statistics. The expectation of an order statistic may be written as
The first four L-moments can then be expressed as
in which and are measures of the mean and scale. Higher L-moments reflect different aspects of distribution shape. and reflect asymmetric and symmetric deviations. The L-moment ratios and are defined as dimensionless analogs of and , therefore, they are plausible measures of skewness and kurtosis.
In practice, L-moments must usually be estimated from random samples drawn from an unknown distribution. Assuming that xl, x2, ···, xn are the samples and xl:n ≤ x2:n ≤ ··· ≤ xn:n, the ordered samples, and the first four sample L-moment, i.e., l1, l2, l3, and l4, can be given by [22]
2.2. L-Hermite Transformation Models
The conventional Hermite models can be expressed as [15]
where , , are Hermite coefficients, and , x0 is the standardized random variable, and are the mean and the standard deviation of x, u is the standard normal variable.
Then regrouping as , and dividing by , Equation (11) can be expressed as
and the scaling factor K becomes
in which , , , and .
Equations (11)–(13) comprise the L-Hermite models. In the conventional Hermite conversion models, both skewness and kurtosis of central moments vary with both and , whose expressions are complicated [17]. This leads to approximate results for the coefficients, and then the Hermite model may only approximately match the desired skewness and kurtosis. However, for the L-Hermite models, depends only on c, and depends on b and c, therefore, which are explicit expressions. Therefore, the L-moment ratios and can be preserved without approximation in the results.
3. Complete Expressions of the Inverse Transformation of the L-Hermite Models
3.1. Basic Ideas
To develop the complete expressions of the inverse transformation of the L-Hermite models, i.e., x-u transformation, Equation (12) can be rewritten as follows
in which is a cubic function of u, , are polynomial coefficients, is the transformed random variable of x, and , and are given by
To identify the proper expression of the x-u transformation, the key problem is to find the solution to Equation (14).
3.2. Selection of Suitable Solution for the Inverse Transformation
The x-u transformation can be determined by solving the root of u in Equation (14), and the process of obtaining the root of u is essentially solving the cubic equation. According to the Cardano formula [28], the solution of a cubic equation can be expressed as:
where
in which I is the discriminant of the roots. When I > 0, there exists one real root; when I = 0, there are two real roots; and when I < 0, there are three real roots.
However, when a cubic equation has three real roots, the roots expressed by Equations (17) and (18) involve complex numbers. In order to solve the problem, the trigonometric function can be used to express the three real roots [29], i.e.,
Using the inequalities 0 ≤ arccos(m) ≤ π for a real number m such that −1 ≤ m ≤ 1, one can obtain u1 > u2 > u3 after derivation.
According to the Cardano formula, the number of roots can be determined by the discriminant I. Since the calculation of I is rather complicated, another concise discriminant method should be found.
In order to find a concise discriminant method, we need to analyze the property of . The monotonicity of is relevant to its derivative. According to Equation (14), the first derivative of can be derived as
One critical point can be defined as the value of u when =0. The number of solutions is determined by the parameter p, expressed as
Selection criterion 1: the sign of p
When , one obtains strictly monotonic, and there will be only one solution of Equation (14), the root can be determined as Equation (16).
When , one obtains non-monotonic, there will be two or three solutions of Equation (14), there are two critical points of , and the derivative value at the critical point equals zero.
Selection criterion 2: the range of x
Assume that the two critical points are and (), respectively. The range of u is divided into three monotonic regions: (, , (, ), and , ). The solutions in these sections can be named , , (), respectively.
At critical points, the value of x’ is computed as and .
The parameter can be determined by the value of x, which is shown as
where .
Selection criterion 3: the sign of c.
From the basic principles of transformation [14]:
where and are the cumulative density functions (CDF) of x and u, respectively.
Taking the derivative of both sides with respect to u of Equation (28) leads to
in which and are the PDF of x and u, respectively.
According to Equations (14) and (29), the first derivative of can be expressed as
Using Equation (30), one can obtain that the sign of can be determined by c since that K, , and are greater than zero.
Selection criterion 4: the sign of .
According to Equation (29), the second-order derivative of can be expressed as
where and denote the derivatives of with respect to x and with respect to u, respectively.
When , the value of in Equation (31) can be simplified as
According to Equation (25), the sign of is determined by . The sign of is determined by the L-skewness , which measures the symmetry of the distribution. Figure 1a,b give the representative PDFs with positive and negative . It can be seen from Figure 1a,b that when , the random variable has a longer left tail and the maximum of PDF appears on the right side of the mean value, therefore, is positive, and when , the PDF of a random variable has a longer right tail, so is negative.
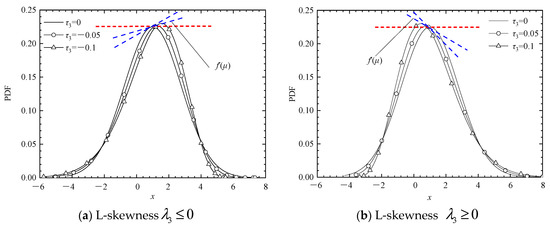
Figure 1.
The relationship between the sign of and .
3.3. The Complete Expressions of the Inverse Transformation of L-Hermite Models
As detailed above, the solution of the inverse transformation of L-Hermite models is determined by the value of p, x, c, and .
- (i)
When , there is only one root. According to the Cardano formula, the root can be determined as Equation (16).
- (ii)
- and
When , and based on selection criterion 2, if , then or , and Equation (16) is the appropriate solution.
- (iii)
- , , and c < 0
If , then , the real roots of Equation (29) may be Equation (21) or Equation (22). Based on Selection criterion 3, if c < 0, the sign of is negative, and the root is formulated as Equation (21).
- (iv)
- , , c > 0 and
If c > 0, the sign of is positive, both Equation(20) and (22) are possible, and Selection criterion 4 should be considered.
According to Selection criterion 4, when , is positive and Equation (20) is the suitable solution;
- (v)
- , , c > 0 and
When , is negative, and Equation (22) is the suitable solution.
- (vi)
- and
When c = 0, Equation (14) is a quadratic function, and the corresponding u is expressed as
- (vii)
- and
When and , the Equation (14) is a liner function, then there is
For convenience, the complete expressions of the inverse transformation of the L-Hermite model can be summarized in Table 1.

Table 1.
Expressions of u.
4. FORM for Structural Reliability Analysis Based on the L-Hermite Model
Based on the proposed inverse transformation of the L-Hermite model, FORM for reliability analysis, including both independent variables and correlated variables, can be readily realized. The computation procedure for FORM based on the inverse transformation of the L-Hermite model is described as follows, with the flowchart illustrated in Figure 2:
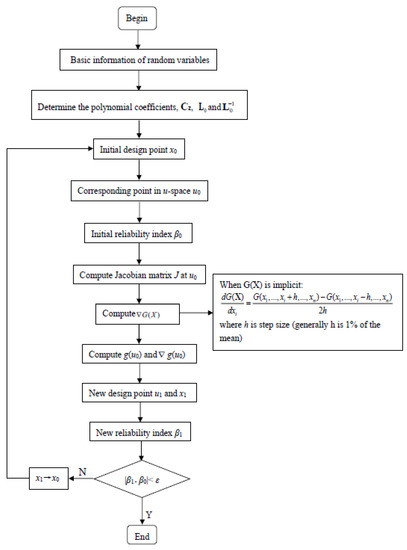
Figure 2.
Procedure of FORM using the proposed method.
- (1)
- Obtain the first four L-moments of each random variable for all variables and the original correlation matrix for correlated variables by the probability information.
- (2)
- Determine the polynomial coefficients by Table 1, the correlation matrix CZ, the lower triangular matrix L0, and its inverse matrix .
- (3)
- Assume an initial checking point x0 (generally take the mean value).
- (4)
- Obtain the corresponding checking point in the independent standard normal space, u0.
- (5)
- Determine the initial reliability index .
- (6)
- Determine the Jacobian matrix evaluated at u0, where the Jacobian matrix is given by
- (7)
- Determine the value of the gradient vector at u0 and the value of the function in normal space:
- (8)
- Calculate the new check point:
The corresponding reliability index can be calculated as .
- (9)
- Calculate the absolute difference between β and β0 until , where is the permissible error (generally ).
Otherwise, repeat step 4 through step 9 until convergence is achieved.
5. Applications in Structural Reliability Analysis
5.1. Comparison of the x-u Transformation among Commonly Used Distributions
For a random variable x to have a known PDF, f(x), the relation between x and u can be derived by using normal transformation techniques. Using the proposed complete expressions of the inverse transformation of the L-Hermite model, the x–u transformation for random variables with all practical combinations of the first four L-moments can be realized. To demonstrate its accuracy and efficiency, the first example considers four random variables following Weibull, gamma, Gumbel, and exponential distributions. With the first four moments of the random variables, the polynomial coefficients in Equation (11) can be readily obtained. The distribution parameters and the first four moments of these random variables are listed in Table 2.

Table 2.
Probability distributions and their statistical parameters for Example 1.
The changes of the x-u transformation function for the four non-normal random variables are shown in Figure 3a–d, obtained from different methods, i.e., the Rosenblatt transformation (The exact), the C-Hermite method (Zhang), the proposed method and the Winterstein formula. Figure 3 reveals the following:
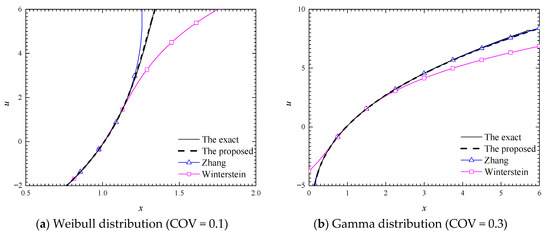
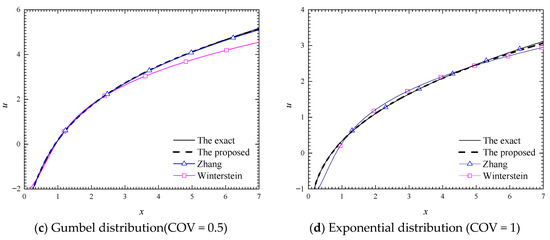
Figure 3.
Comparison of x-u transformation with different normal transformation methods.
- The Winterstein formula provides suitable results when the value of x is around the mean value. However, when the absolute value of x is far from the mean, the results obtained by the Winterstein formula exhibit significant differences compared with the exact ones, except for the case of exponential distribution with COV = 1 (Figure 3d).
- In general, the C-Hermite method can also provide suitable results with the Rosenblatt transformation. For the gamma variable with COV = 0.3 (Figure 3b), the Gumbel variable with COV = 0.5 (Figure 3c), and the exponential variable with COV = 1 (Figure 3d), the results of x–u transformation obtained by the C-Hermite method are similar with the exact ones. However, for the Weibull variables, there are large differences between the results obtained by the C-Hermite method and the exact ones when the value of x is far from the mean value (see Figure 3a).
- The proposed L-Hermite method performs better than the Winterstein formula and the C-Hermite method, especially for the Weibull variable with COV = 0.1 (Figure 3a), and the results of the proposed L-Hermite are in close agreement with the exact ones in the whole investigation range for all the four cases considered.
5.2. First-Order Reliability Analysis, including Random Independent Variables with Unknown CDFs/PDFs
The second example considers a soil settlement, which has been investigated by B.N. Rao [30]. The structures are shown in Figure 4. Assuming that the contribution of secondary consolidation to settlement is negligible, the settlement at point A is required to be less than 2.5 in. In this example, the performance function is given by
in which e0 is the void ratio of the clay layer before loading, H is the thickness of the clay layer, Cc is the compression index of the clay, p0 and Δp are, respectively, the original effective pressure before loading and the pressure increased at point B due to structural construction (mid height of the clay layer). The probability distribution of the random variables is listed in Table 3.
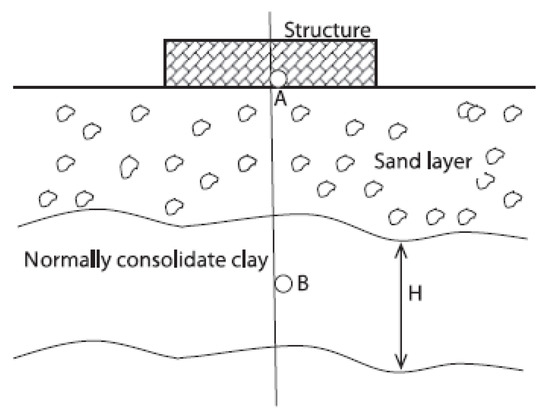
Figure 4.
The model of soil settlement.

Table 3.
Random variables in Example 2.
In this example, the PDFs of random variables are known; therefore, using the general FORM procedure, the reliability index can be obtained as 1.3627.
To investigate the efficiency and accuracy of the proposed method, only the first four L-moments of random variables H, CC, e0, p, Δp are used to calculate the reliability index. With the aid of Table 1 and Equation (12), the x-u and u-x transformations of the random variables can be easily performed by using the first four L-moments. Table 3 lists the parameters for the transformation of the random variables. Then, the reliability index βL-FORM with the known first four L-moments can be readily obtained as 1.3638. Similarly, the reliability index βC-FORM can also be readily obtained as 1.3645 when only the first four C-moments are assumed to be known.
The result shows that the reliability index obtained using the first four L-moments of random variables H, CC, e0, p, Δp are generally close to the result obtained by using the PDFs, and the result is more accurate than that obtained by using the first four C-moments for this example.
5.3. Reliability Analysis of Implicit Performance Function
The third example considers a three-bay six-story frame structure under lateral loads, which is shown in Figure 5.
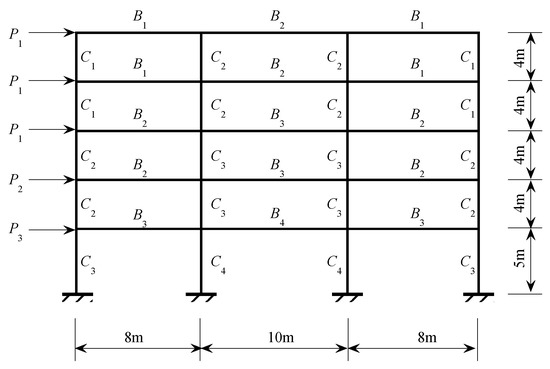
Figure 5.
Three-bay five-story frame structure considered in Example 3.
The moments of inertia of frame members and cross-sectional areas are given in Table 4. The performance function of this example is [31]
where u(X) is the top-floor displacement determined by finite element analysis, and ulim is the specified limit, taken as 0.02 m.

Table 4.
Probabilistic information of the basic random variables for Example 3.
Here seven random variables are considered, which includes one Young’s modulus and six applied loads, and their corresponding probabilistic information is listed in Table 4.
Based on the computational procedure shown in Figure 5, the reliability index can be calculated by the proposed method for random variables with unknown PDFs. The parameters of the proposed complete expressions of L-Hermite are listed in Table 4.
In this example, the performance function is implicit. According to Equation (38), the gradient vector of the performance function can be calculated by the central differentiation method. With known PDFs of random variables, the first-order reliability assessment can be calculated as βFORM = 2.9009. The proposed method is then used to illustrate the accuracy, and the four moments of random variables are listed in Table 4, in which the gradient vector of the performance function is also determined by the central differentiation method according to Equation (38), and the βL-FORM is readily obtained as 3.0975. Using the first four C-moments, the reliability index obtained by the C-Hermite method is βC-FORM = 3.1038. It can be observed that the reliability index obtained by the proposed method using the first four L-moments provides a close result to the one compared with those obtained by FORM using PDFs of random variables.
6. Conclusions
This study develops a probability distribution based on the polynomial normal transformation of both independent and correlated variables, and the proposed method is applied to structural reliability analysis. The transformation from non-normal random variables to normal ones, including independent and correlated random variables, is investigated, and the results obtained by the proposed complete expressions of the inverse L-Hermite model are quite accurate compared to the exact values. Numerical examples are presented to demonstrate the application of the proposed complete expressions of the inverse L-Hermite transformation in FORM, including independent and correlated random variables with unknown CDFs/PDFs. It is found that:
- The polynomial coefficients of the L-Hermite model can be expressed by the first four L-moments explicitly. They are much easier and simpler than those based on C-moments, where the coefficients have to be obtained by nonlinear equations.
- Numerical examples show that the inverse L-Hermite transformation is close to the exact values in the whole investigation range, which are more accurate than the C-Hermite transformation.
- The reliability obtained by the proposed FORM based on the L-Hermite model is close to those by using known CDFs/PDFs. It can be concluded that the presented method of inverse L-Hermite transformation is quite efficient for normal transformation and sufficiently accurate to include random variables with unknown probability distributions in structural reliability analysis.
Author Contributions
Conceptualization, M.-N.T.; methodology, M.-N.T.; visualization, F.-Q.S.; writing—original draft preparation, M.-N.T.; writing—review and editing, F.-Q.S. and C.-X.C. All authors have read and agreed to the published version of the manuscript.
Funding
This research received no external funding.
Institutional Review Board Statement
Not applicable.
Informed Consent Statement
Not applicable.
Data Availability Statement
The data used to support the findings of this study are availablefrom the corresponding author upon request.
Conflicts of Interest
The authors declare no conflict of interest.
References
- Choi, Y.; Ahn, J.; Chang, D. Time–dependent reliability analysis of Plate–stiffened prismatic pressure vessel with corrosion. Mathematics 2021, 9, 1544. [Google Scholar] [CrossRef]
- Barbu, V.S.; D’Amico, G.; Gkelsinis, T. Sequential interval reliability for discrete–time homogeneous semi–markov repairable systems. Mathematics 2021, 9, 1997. [Google Scholar] [CrossRef]
- Binder, K.; Heermann, D. Monte Carlo Simulation in Statistical Physics; Chapman and Hall: London, UK, 1964. [Google Scholar]
- Barker, A.A. Monte carlo calculations of the radial distribution functions for a proton electron plasma. Aust. J. Phys. 1965, 18, 119–134. [Google Scholar] [CrossRef]
- Shinozuka, M. Basic analysis of structural safety. J. Struct. Eng. 1983, 109, 721–740. [Google Scholar] [CrossRef]
- Cornell, C. A Probability–based structural code. J. Am. Concr. Inst. 1968, 66, 974–985. [Google Scholar]
- Kiureghian, A.; Stefano, M. Efficient Algorithm for Second–Order Reliability Analysis. J. Eng. Mech. ASCE 1988, 117, 2904–2923. [Google Scholar] [CrossRef]
- Cai, G.; Elishakoff, I. Refined second–order reliability analysis. Struct. Saf. 1994, 14, 267–276. [Google Scholar] [CrossRef]
- Riesch–Oppermann, H.; Bruckner–foit, A. First–and second–order approximations of failure probabilities in probabilistic fracture mechanics. Reliab. Eng. Syst. Saf. 1988, 23, 183–194. [Google Scholar] [CrossRef]
- Fleishman, A. A method for simulating non–normal distributions. Psychometrika 1978, 43, 521–532. [Google Scholar] [CrossRef]
- Zhao, Y. Third–Moment Standardization for Structural Reliability Analysis. J. Struct. Eng. 2000, 126, 724–732. [Google Scholar] [CrossRef]
- Rebba, R.; Mahadevan, S. Validation of models with multivariate output. Reliab. Eng. Syst. Saf. 2006, 91, 861–871. [Google Scholar] [CrossRef]
- Liu, P.; Kiureghian, A. Multivariate distribution models with prescribed marginals and covariances. Probabilistic Eng. Mech. 1986, 1, 105–112. [Google Scholar] [CrossRef]
- Fisher, R.; Cornish, E. The percentile points of distributions having known cumulants. Technometrics 1960, 2, 209–225. [Google Scholar] [CrossRef]
- Winterstein, S. Nonlinear vibration models for extremes and fatigue. J. Eng. Mech. 1988, 114, 1772–1790. [Google Scholar]
- Zhao, Y.; Lu, Z. Fourth–moment standardization for structural reliability assessment. J. Struct. Eng. 2007, 133, 916–924. [Google Scholar] [CrossRef]
- Zhang, X.; Zhao, Y.; Lu, Z. The inverse transformation of the explicit fourth–moment standardization for structural reliability. Adv. Struct. Eng. 2018, 21, 769–782. [Google Scholar] [CrossRef]
- Hosking, J. L–moments: Analysis and estimation of distributions using linear combinations of order statistics. J. R. Stat. Soc. Ser. B Methodol. 1990, 52, 105–124. [Google Scholar] [CrossRef]
- Chen, Y.; Huang, G.; Shao, Q. Regional analysis of low flow using L–moments for Dongjiang basin. Hydrol. Sci. J. 2006, 51, 1051–1064. [Google Scholar] [CrossRef]
- Shanhzad, M.; Asghar, Z. Comparing TL–Moments, L–Moments and Conventional Moments of Dagum Distribution by Simulated data. Rev. Colomb. Estadística 2013, 36, 79–93. [Google Scholar]
- Pandey, M.D.; van Gelder, P.H.A.J.M.; Vrijling, J.K. The estimation of extreme quantiles of wind velocity using L–moments in the peaks–over–threshold approach. Struct. Saf. 2001, 23, 179–192. [Google Scholar] [CrossRef]
- Greenwood, J.; Landwehr, J.; Matalas, N. Probability weighted moments: Definition and relation to parameters of several distributions expressable in inverse form. Water Resour. Res. 1979, 15, 1049–1054. [Google Scholar] [CrossRef]
- MacKenzie, C.; Winterstein, S. Comparing L–Moments and Conventional Moments to Model Current Speeds in the North Sea. In Proceedings of the 2011 Industrial Engineering Research Conference (IERC 2011), Reno, NV, USA, 21–25 May 2011. [Google Scholar]
- Winterstein, S.; Machenzie, C. Extremes of nonlinear vibration: Comparing models based on moments, l–moments, and maximum entropy. J. Offshore Mech. Arct. Eng. 2013, 135, 21601–21602. [Google Scholar] [CrossRef]
- Chen, X.; Tung, Y. Investigation of polynomial normal transform. Struct. Saf. 2003, 25, 423–445. [Google Scholar] [CrossRef]
- Zhao, Y.; Tong, M.; Lu, Z.; Xu, J. Monotonic Expression of Polynomial Normal Transformation Based on the First Four L–Moments. J. Eng. Mech. ASCE 2020, 146, 06020003. [Google Scholar] [CrossRef]
- Tong, M.; Zhao, Y.; Lu, Z. Normal Transformation for Correlated Random Variables based on L–moments and its Application in Reliability Engineering. Reliab. Eng. Syst. Saf. 2020, 207, 107334. [Google Scholar] [CrossRef]
- Tong, M.; Zhao, Y.; Zhao, Z. Simulating strongly non–Gaussian and non–stationary processes using Karhunen–Loève expansion and L–moments–based Hermite polynomial model. Mech. Syst. Signal Process. 2021, 160, 107953. [Google Scholar] [CrossRef]
- Shelbey, S. CRC Standard Mathematical Tables; CRC Press: Boca Raton, FL, USA, 1975. [Google Scholar]
- Rao, B.; Chowdhury, R. Factorized high dimensional model representation for structural reliability analysis. Eng. Comput. 2008, 25, 708–738. [Google Scholar] [CrossRef]
- He, J.; Gao, S.; Gong, J. A sparse grid stochastic collocation method for structural reliability analysis. Struct. Saf. 2014, 51, 29–34. [Google Scholar] [CrossRef]
Publisher’s Note: MDPI stays neutral with regard to jurisdictional claims in published maps and institutional affiliations. |
© 2022 by the authors. Licensee MDPI, Basel, Switzerland. This article is an open access article distributed under the terms and conditions of the Creative Commons Attribution (CC BY) license (https://creativecommons.org/licenses/by/4.0/).