Abstract
The evolution of strain energy density of outburst-prone coal is of great significance for analyzing the characteristics of energy accumulation and release in coal and rock masses. The dynamic mechanical properties of coal samples were tested by using the split Hopkinson pressure bar (SHPB) technique. Dynamic tensile mechanical properties, layered effect and density evolution characteristics of strain energy for coal were studied. The dynamic failure and crack propagation process of the specimen were recorded with a high-speed camera. In addition, a digital image correlation (DIC) method was used to analyze the evolution characteristics of the strain field during the deformation process of the specimen. The distribution characteristics of the particle fragments were statistically analyzed. The results show that the bedding orientation of the coal has a significant effect on its deformation and damage features. The presence of weak planes, microcracks and laminae causes its shear damage zone to behave more complex. If the crack plane coincides with the high shear stress plane, the developed shear cracks extend along the weak laminae and the shear damage zones in BD specimens are not symmetrically distributed. When the laminated surface of the coal sample is at a certain angle with the impact loading direction, the damage mode is coupled with tensile and shear damage. The percentage mass distribution of particles and fines increases with increasing bedding orientation. The effect of water on the dynamic damage of coal samples is significant. Based on the principle of pressure expansion of wing-shaped cracks, the formula for calculating the dynamic strength of water-saturated coal samples under dynamic loading was derived.
Keywords:
dynamic tensile mechanical property; outburst coal; crack extension; strain energy density; impact loading MSC:
74H45
1. Introduction
Engineering fields such as oil well fracturing, mining rock fracturing, protection under explosion and other catastrophic natural phenomena such as earthquakes and rock bursts are almost always related to rock fracture and stress wave propagation in rocks under impact loads. Common geological hazards such as coal and gas protrusion and coal rock instability in coal mine production also involve deformation, crack expansion, energy accumulation and release, and damage mechanism of rocks under impact loading [1]. The mechanical properties of rocks under impact loading are quite different from those under static loading. Due to the natural complexity of rocks and the inertial effect of impact loading, theoretical and experimental studies on the dynamic damage of rock materials are not yet complete. There are still many fundamental problems that need further exploration and in-depth research. In order to develop rock engineering technology and prevent the occurrence of catastrophic accidents due to rock damage caused by impact in engineering, it is necessary to understand the dynamic damage mechanisms of rocks [2]. The study of dynamic mechanical properties of rocks is of great interest to reveal the damage mechanisms of rocks and guide engineering practice.
The dynamic mechanical properties of coal rock have been studied extensively by previous scholars. Song et al. [3] studied the deformation and damage processes of rocks under different loading conditions. A rock matrix-fracture medium model for non-homogeneous and fractured coal seams was proposed by Zhang et al. [4]. Hao et al. [5] used the crack volume strain method, and acoustic emission (AE) method were used to analyze the anisotropy of the crack initiation strength, damage strength, the failure mode and the AE characteristics of coal reservoir. Li et al. [6] studied the influence of sampling directions (perpendicular to bedding planes and parallel to bedding planes) on the transient charge signals of coal. Gong [7] analyzed the crack extension process and crack distribution after damage in bituminous coal specimens. Liu et al. [8] used an acoustic emission system to experimentally investigate the mechanical properties and associated acoustic emission characteristics of loaded coal for different bedding angles, and developed an acoustic emission-based damage model. The effect of bedding angle on coal permeability was systematically investigated by Pan et al. [9,10,11,12]. Hou et al. [13] carried out Brazilian splitting tests on bedding coal and analyzed the effects of low temperature cooling fracturing and bedding orientation on the mechanical properties and fracture morphology of the coal. The effect of bed texture on the dynamic indirect tensile strength of coal was investigated by Zhao et al. [14]. Li et al. [15] established a model for the calculation of anisotropic coal permeability and analyzed the distribution pattern of permeability in arbitrary directions at different angles to the beds plane. Li et al. [16,17,18] investigated the effect of circumferential pressure and bedding angle on the mechanical properties of coal. Liu et al. [19,20] carried out LNMR and NMR studies of the microstructural characteristics and pore size distribution of high-grade coals with different bedding structures. Influence of bedding on the fracture pattern of the coal mass during blasting was investigated Zhao et al. [21]. Yuan et al. [22] revealed the influence of primary fractures and the bed angle of the coal on its deformation and damage characteristics. Huang et al. [23,24] used the double-exposure holographic interference method to observe the evolution of strain field of barite before destruction. This method uses a pulsed laser as the light source to record the interference fringes of a pair of images superimposed on a photographic dry plate at very short intervals. However, it can only measure transient processes, not continuous dynamic processes. Regarding the study of photomechanical methods, the digital scatter correlation method (DSCM) based on image recording has obvious advantages in the measurement of deformation fields of rock specimens [25]. In the early 1980s, DSCM was proposed as an image processing method by Peters et al. [26] and by Yamaguchi [27]. Skurtveit et al. [28,29,30,31] used scattering interference and digital scattering correlation methods to analyze the fracture evolution of inhomogeneous rocks. Song et al. [32,33,34] used the white-light digital scattering correlation method as an observation tool to study the deformation field and stress evolution during rock damage under uniaxial compression. The geological formation process of coal rocks determines the complex composition, structure and tectonics of coal rocks. Primary structures such as undulating laminae, linear laminae, lenticular laminae, and secondary structures such as joints, are widely present in coal rocks [35,36]. Rocks are quasi-brittle materials with basic mechanical parameters such as tensile strength, compressive strength and fracture toughness. Since the tensile strength of rocks is much lower than the compressive strength, tensile damage often occurs first when they are subjected to external loads. As a common main damage mode of rocks, the study of dynamic tensile deformation damage of rocks is essential for further understanding of dynamic mechanical properties of rocks.
In our study, the dynamic mechanical properties of coal samples were tested by using the SHPB technique. Dynamic tensile mechanical properties, layered effect and density evolution characteristics of strain energy for coal were studied. The dynamic failure and crack propagation process of the specimen were recorded with a high-speed camera. In addition, the DIC method was used to analyze the evolution characteristics of the strain field during the deformation process of the specimen. The distribution characteristics of the particle fragments were statistically analyzed.
2. Experimental Setup
2.1. Specimen Preparation
The coal specimens used in the test were selected from the 7135 return air roadway of Pingmei Shenma coal mine (see Figure 1). The coal type is long bituminous coal. To make the experimental results comparable, the coal specimens used for the experiments were obtained from relatively intact bulk coal specimens. The dimensions of the disc specimens were based on those recommended by the International Society of Rock Mechanics. The size of coal specimen was Φ50 mm × 25 mm. A total of 90 specimens were selected from the processed disc specimens. The average diameter was 49.29 mm and the average thickness was 25.27 mm. The dimensional error was within ±1 mm. The two-end face was polished, and the unevenness was ±0.05 mm. The maximum deviation of the vertical axis was not more than 0.25°. Figure 2 shows the prepared coal specimens with different bedding angles. In this study, the bituminous coal of Pingdingshan mine was selected and the bituminous coal samples were tested by X-ray diffractometer produced by Japan Science Electric Co., Ltd., which is located in Tokyo Port, Japan. XRD test results of bituminous coal are shown in Figure 3. All specimens were divided into three groups of 0.45, 0.47 and 0.49 MPa according to the emission pressure. The specimens were divided into five groups of 15 each according to the bedding angle (0°, 22.5°, 45°, 67.5° and 90°). Table 1 shows the grouping of coal samples. There were three specimens used in equivalent test conditions.

Figure 1.
Location of outburst coal sampling. (a) The location of Pingmei Shenma Coal Mine in China. (b) Location of rock sample collection. (c) The coal rock sample was collected at 7135 return air lane.
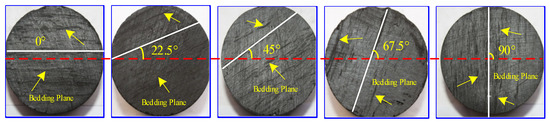
Figure 2.
Actual photos of prepared coal specimens.
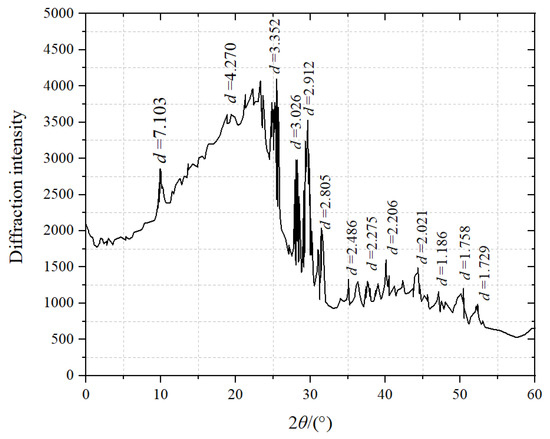
Figure 3.
X-ray diffraction pattern of outburst proneness coal.

Table 1.
Grouping of coal samples.
2.2. Laboratory Devices
Figure 4 shows the structure of the SHPB loading device. Under a certain air pressure, the punch collides with the incident bar at a certain speed. A stress pulse is generated at the end of the incident bar. According to the homogenisation condition of the SHPB device, the stresses and strains at the two interfaces become balanced after several reflections. The mean stress σ, strain ε and strain rate of the specimen can be derived as a function of time, i.e.,
where, σI(t), σR(t) and σT(t) are the incident, reflected and transmitted stresses at time t respectively, ρeCe is the wave impedance of the elastic rod, Ls is the length of the specimen, and Ae, As are the cross-sectional areas of the elastic rod and the specimen, respectively.
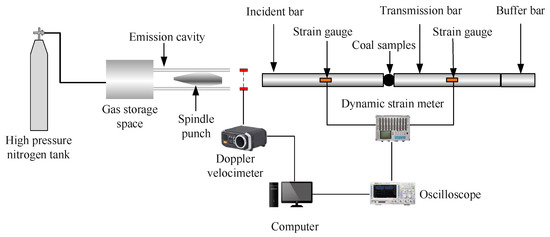
Figure 4.
Dynamic loading device.
Equations (4) and (5) can be derived from one-dimensional stress wave theory [37]. The load and displacement at the two end faces of the specimen are
where subscript 1 denotes the left end face of the specimen. Subscript 2 denotes the right end face of the specimen, I is the incident wave initial, R is the reflected wave initial, and T is the transmitted wave initials.
From Equations (4)–(7), the following equations can be obtained
In addition,
Substituting Equation (11) into the three Equations (8)–(10), the following equations can be obtained
The DSCM method was used to observe the variation of strain field on the surface of the specimen. Figure 5 shows the principle of digital speckle method. It is necessary to determine a reasonable method to calculate the correlation coefficient. The standardized covariance correlation method is the most widely used method in calculating correlation formula, as shown in the following equation.

Figure 5.
The principle of Digital Speckle Correlation Method (DSCM).
2.3. Stress Distribution Analysis in Brazilian Disk
The stress components inside and around the Brazilian disk were calculated, as shown in Figure 6 and Figure 7. From Figure 8, for any point M in the Brazilian disk, it is known that the stress component at point M is
when the point M is on the right side of the force, both θ1 and θ2 take positive values, and both take negative values when on the left side. There is the following relationship in ΔOMN
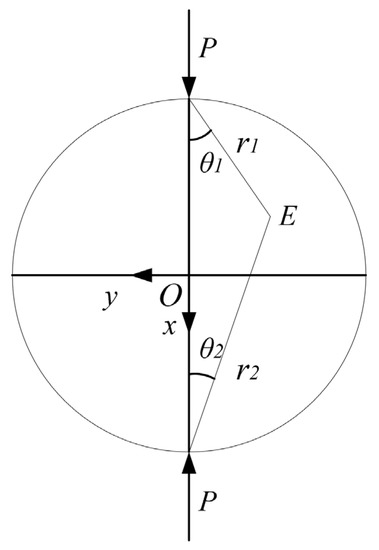
Figure 6.
Force state of Brazil disc test.
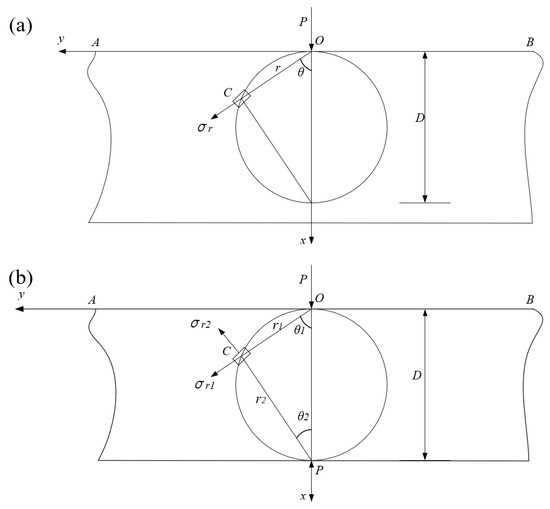
Figure 7.
Force analysis of the disc. (a) Half plane of infinite plate on the role of P in the level of vertical load on the boundary AB. (b) The plates on both sides are infinitely long, the width is D, and the thickness of the plate is l, which is affected by a pair of symmetrical line load P.
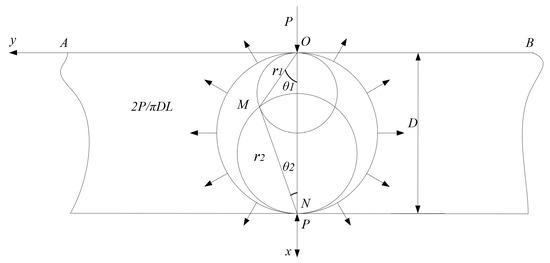
Figure 8.
Force state of the Brazil disc.
Substituting Equations (17)–(19) into Equation (16) yields
To further simplify, a coordinate translation is performed. The origin O of the Oxy coordinate system is translated to the center of the disc.
Substituting Equation (21) into Equation (20) yields,
From Equation (22), when y = 0 and x = 0, the stress components on the diameter ON are
The stress component perpendicular to the diameter ON is given by
The above represents the analytical solution of the stress state at any point inside the Brazilian disk based on the Airy stress function and the linear elasticity superposition principle. Figure 9 shows the internal stress distribution of the Brazilian disc.
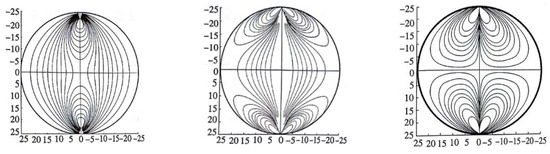
Figure 9.
Distribution of stress in Brazil disc.
In Figure 10, on the diameter ON, y = 0 and the tensile stress σyy is a constant. Therefore, under critical conditions, when the load at the time of damage is Pc, the tensile strength T0 of the material can be obtained as
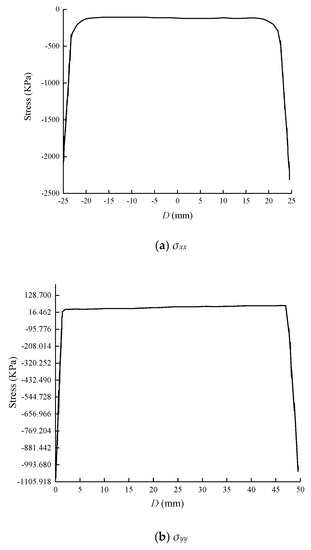

Figure 10.
Stress component on the diameter ON.
3. Experimental Results and Discussion
3.1. Debris Characterisation
Specimens of equal water saturation were analyzed for comparison. The saturation of the coal specimens was 100%. Figure 11 shows the corresponding histograms of the mass distribution of coal rock debris particle size groupings. The specimens in each group had the same water saturation state and were subjected to various velocities of impact loading. The mass percentages of the debris particle size distribution for each group of specimens were compared according to the bedding orientation of the specimens. As can be seen in Figure 11a, the specimens with a bedding orientation of 45° had the lowest percentage mass distribution of particles and fines. As the bedding orientation increased or decreased from 45°, the percentage mass distribution of particles and fines increased. In Figure 11b,c, the particle and fines chip size mass distribution increase and then decrease as the laminate orientation changes from 0 to 90°. This means that the percentage mass distribution of particulate and fines debris was smallest for both sets of specimens when the lamination orientation is 0 and 90°. When the lamination orientation was 22.5, 45 and 67.5°, the percentage mass distribution of particles and fines was higher than the percentage mass distribution of debris at the previous two bedding orientations. For the specimens in Figure 11d,e, except for coal samples with bedding angle of 90°, the percentage mass distribution of particles and fines increased with increasing bedding orientation.
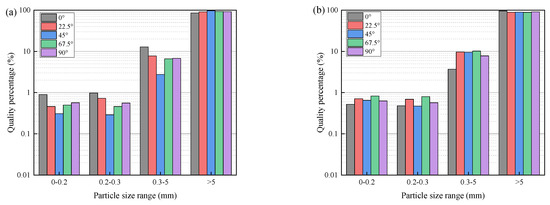
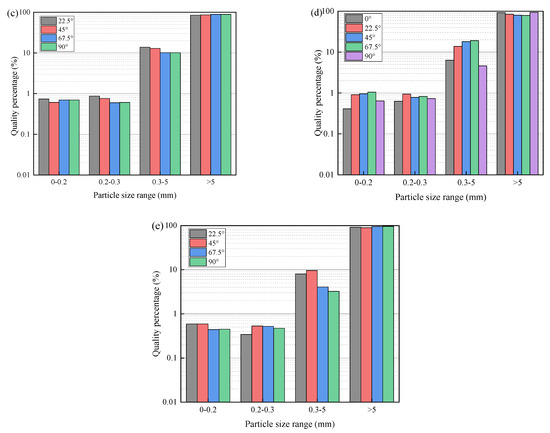
Figure 11.
Percentage mass distribution of debris particle size at different lamination angles. (a) v = 1.737 m/s, (b) v = 2.351 m/s, (c) v = 2.728 m/s, (d) v = 3.309 m/s, and (e) v = 4.008 m/s.
For coal rock fragments with a particle size greater than 5 mm, the fragment scale ratio distribution is shown in Figure 12. In Figure 12a, for the specimen with the bedding orientation of 0°, the length-to-thickness ratio of the debris basically ranged from 1.3 to 6.3, with an average value of 2.64. It was concentrated in the range of 2 to 3.5, mainly in the form of lumpy debris, including some plate debris, with a representative size of L:W:D = 3:2:1 (L, W and D are the length, width and density of the debris, respectively). In Figure 12b, for the specimen with the bedding orientation of 22.5°, the length-to-thickness ratio of the debris ranged from 1 to 5.7, with an average value of 2.54. It was mostly in the form of lumpy debris, with a representative size of L:W:D = 2.0:1.8:1.0. The specimen with a bedding orientation of 45° in Figure 12c had a length-to-thickness ratio of 1.7 to 5, with an average value of 3.08, with the largest number of plate debris and a slightly smaller number of block debris, and a representative size of L:W:D = 3:2:1. The specimen with a bedding orientation of 67.5° in Figure 12d had a length-to-thickness ratio of 1.7 to 5, with an average value of 3.08. The specimen with a bedding orientation of 67.5°, the length to thickness ratio of the debris was mainly concentrated in the range of 1~3, with an average value of 1.99. It basically consisted of blocky debris, containing some plate debris, with a representative dimension of L:W:D = 2.0:1.5:1.0. The specimen with a bedding orientation of 90° in Figure 12e, the length to thickness ratio of the debris ranged from 1.3~5.2, with an average value of 2.66. It mainly consisted of blocky debris, containing some plate debris, with a representative dimension of L:W:D =2.0:1.5:1.0. In addition, it contained plate debris with dimensions of L:W:D = 2.5:1.3:1.0.
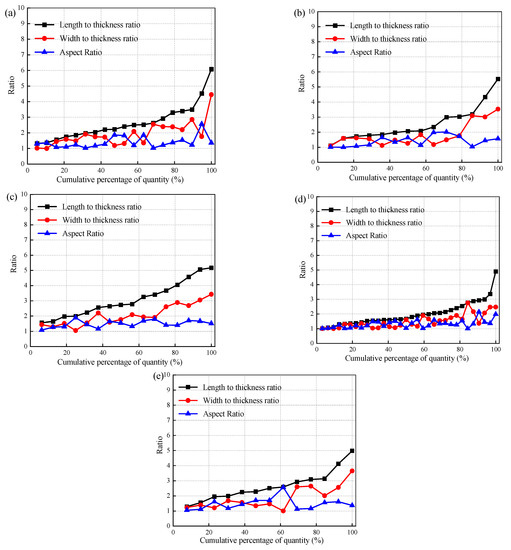
Figure 12.
Debris scale ratio distribution of coal rock specimens with different laminar orientations. (a) θ = 0°, v = 3.221 m/s, (b) θ = 22.5°, v = 3.233 m/s, (c) θ = 45°, v = 3.308 m/s, (d) θ = 67.5°, v = 3.363 m/s, and (e) θ = 90°, v = 3.15 m/s.
3.2. Evolution Characteristics of Strain Energy Density
Figure 13 shows the crack propagation process and fragment distribution in representative outburst-prone coal. When the bedding orientation was 0°, the coal and rock specimens underwent complete tensile failure. The failure mode of the coal rock specimen was mainly tensile failure. For example, in the second row, a tensile crack first occurred in the radial direction of the specimen, and finally the crack ran through the entire specimen. Figure 14 shows the evolution of the strain field in the dynamic tensile process of representative outburst proneness coal. In addition to tensile strain localization in the radial direction, the coal specimens with different bedding orientation also showed strain localization in other regions. In the second row, tensile strain occurred in the direction of the bedding of the specimen. In the fifth row, tensile strain localization occurred in both radial and bedding directions. The size of the strain localization area in the bedding direction was much more modest than in the radial dimension. When the quantity of the localized area of the disk specimen surged, i.e., when macroscopic failure occurred, the localized phenomenon on both sides of the localized zone disappeared immediately.
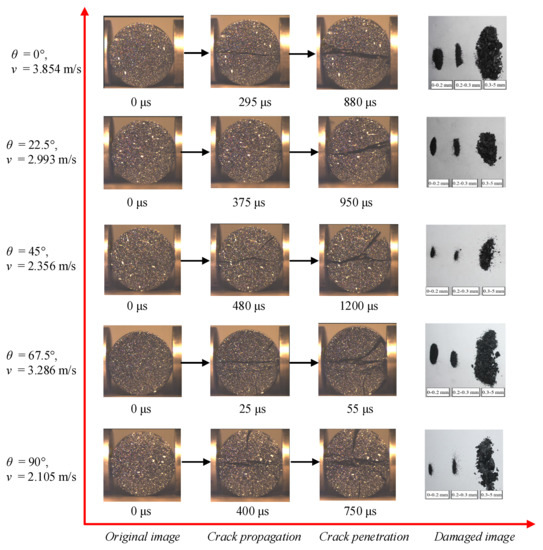
Figure 13.
Crack propagation process and fragment distribution in representative outburst-prone coal.
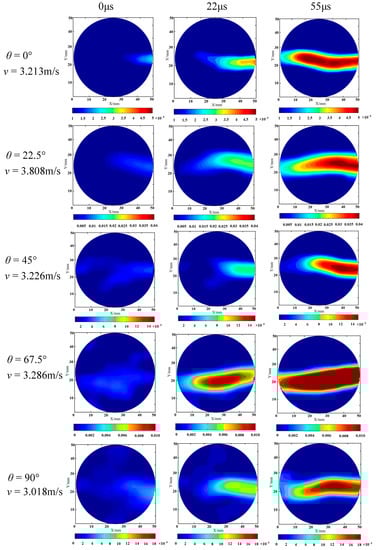
Figure 14.
Evolution of strain field in dynamic tensile process of representative outburst-prone coal.
In the SHPB test results, the damage modes of BD specimens mainly included shear and tensile failure. When the BD disc specimen was homogeneous and isotropic, the tensile damage crack started at the middle of the disc and expanded in a direction parallel to the impact loading, as shown in Figure 15a. The tensile crack rapidly expanded and divided the BD disc specimen into two half discs. At this point, the specimen was no longer intact, resulting in a redistribution of stress around the contact surface at both ends of the specimen. As the loading continued and the stresses at both ends of the specimen were redistributed, shear damage zones appeared at both ends of the specimen. Since the specimen was homogeneous and isotropic, the shear damage zone was basically symmetrical in distribution. However, for anisotropic coal rocks that were non-homogeneous and contained laminae, the damage mode of their BD specimens was more complicated, as shown in Figure 15b. The tensile breakage mode was still the main damage mode of the specimen, due to the higher tensile stress to which the coal sample was subjected and its own lower tensile strength. However, the presence of weak planes, microcracks and laminae caused its shear damage zone to behave in a more complex fashion. If the crack plane coincided with the high shear stress plane, the developed shear cracks extended along the weak laminae and the shear damage zones in BD specimens were not symmetrically distributed, as shown in Figure 15b. The above experimental results confirm our hypothesis, as shown in the second, third and fourth rows of Figure 14, where the presence of asymmetric shear damage zones at both ends of the specimen can be observed in the final damage pattern of the specimen.
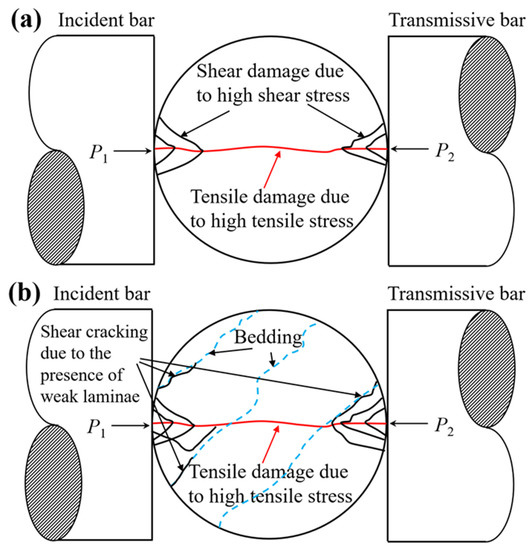
Figure 15.
Comparison of loading and failure modes of layered rock. (a) Homogeneous and isotropic rocks. (b) Non-homogeneous and anisotropic coal rocks.
Deformation energy evolution was analyzed quantitatively. Based on the final damage mode of the specimen and the strain field before damage, the calculated deformation field was divided into the deformation localisation zone and the area outside the deformation localisation zone. As shown in Figure 16a, the energy analysis area was divided into zone 1 and zone 2 outside the deformation localisation zone (strain energy density was calculated separately for each region). The elastic deformation energy density formula could be used to derive the deformation energy density U in the area outside the deformation localisation zone of the rock specimen
where, E and v are the modulus of elasticity and Poisson’s ratio of the coal rock specimen, respectively. ε1 and ε2 are the principal strains at the surface of the rock specimen.
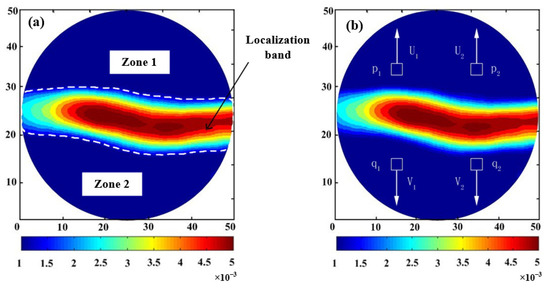
Figure 16.
Characteristics of deformation localization zone of coal with outburst proneness. (a) Schematic diagram of energy analysis area. (b) Relative tensile displacement.
Figure 16b shows a schematic diagram of the relative tensile displacement analysis of the deformation localisation zone of the coal rock specimen. Figure 17, Figure 18 and Figure 19 show the energy evolution curves and tensile displacement evolution curves of coal and rock specimens. As can be seen from Figure 17, when the impact velocity was 1.303 m/s, the maximum deformation energy density in the two regions of the specimen was 750 × 106 J/m3 and 580 × 106 J/m3, respectively. The relative tensile displacements of the two sets of measurement points increased simultaneously with the beginning of the peak in zone 1. When the impact velocity was 2.112 m/s, the peak values of zone 1 and zone 2 were close to 470 × 106 J/m3 and 310 × 106 J/m3. When the energy density began to increase, the relative tensile displacement of the two groups of measuring points also increased at a relatively stable rate. When the time was increased to 200 μs, the displacement of the two groups of measurement points had a difference of about 0.05 mm. The relative tensile displacement increases rapidly as the energy on either side of the specimen positioning zone reached its peak.
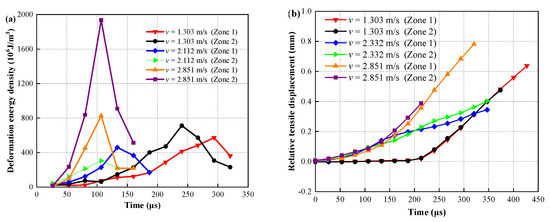
Figure 17.
Deformation energy density and tensile displacement characteristics of coal specimens with bedding orientation of 0°. (a) Deformation energy density. (b) Relative tensile displacement.
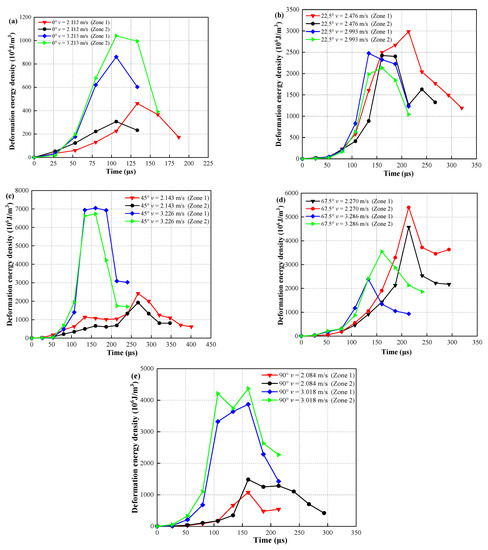
Figure 18.
Deformation energy density evolution curves of coal specimens. (a) 0°, (b) 22.5°, (c) 45°, (d) 67.5°, (e) 90°.
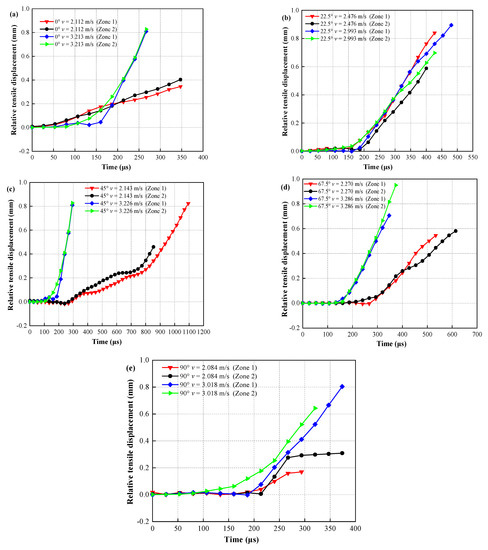
Figure 19.
Relative tensile displacement evolution of outburst coal specimens. (a) 0°, (b) 22.5°, (c) 45°, (d) 67.5°, (e) 90°.
It can be seen from Figure 18 that when the bedding orientation was 45°, the peak deformation energy density in area 1 and area 2 of the specimen reached 7000 × 106 J/m3, which was the largest among the five specimens. When the bedding orientation was 90°, the peak deformation energy density was about 4000 × 106 J/m3. The time taken for the specimen to reach peak energy was essentially 100–130 μs.
When the peak of the deformation energy density fell (θ = 0°), the peak deformation energy density differed by a factor of 5–7, influenced by the velocity of the impact load on the specimen. It is speculated that when the bedding orientation is 0°, because the cohesion between radial bedding is weak, microcracks would develop rapidly in the coal rock along the bedding surface. However, the microcracks in other areas of the coal rock would not be fully developed, so the deformation degree of the specimen would not be large, resulting in too little energy accumulation. When the bedding orientation gradually increases, the microcracks would fully develop, the deformation would be significant, and the accumulated deformation energy would be greater than that when the bedding orientation was 0°.
When the bedding direction was 0°, the relative tensile displacement of the two sets of measurement points began to increase as the energy began to accumulate (Figure 19). The relative tensile displacements of the two groups of measurement points in the localized zone were basically unchanged until the deformation energy density reaches its peak. When the energy density of zone 1 reached a peak, the relative tensile displacements of the two groups of measurement points started to grow at the same time. When the energy density started to grow, the relative tensile displacement of the two groups of measurement points also started to grow at a relatively stable rate. When the time increased to 200 μs, the displacement of the two groups of measurement points generated a difference of about 0.05 mm. The relative tensile displacement of the two groups of measurement points started to grow relatively slowly, and when the energy density in the area on both sides of the localized zone reached its peak, the growth of the relative displacement tensile amount became large rapidly. From Figure 19b it can be seen that, the tensile displacements of the measured points in the two regions of the specimen started to increase when the energy density decreased from the peak. There was a difference of about 0.02 mm between the displacements of the two sets of measurement points at the beginning of the growth. As the displacement increased, the difference gradually decreased. The relative tensile displacements of the measurement points bifurcated after the growth started. The difference decreased briefly in the middle and then continued to increase again. The difference of about 0.1 mm between the tensile displacements of the two measurement points was maintained throughout the growth process. The relative tensile displacement of the measurement points started to increase after the energy density reached its maximum value (Figure 19c). The relative tensile displacements of the two groups of measurement points, on the other hand, started to grow only when the energy density reached the second peak, and there was a difference of about 0.02~0.03 mm. At 160 μs, the displacement of the original group of measurement points with larger displacement decreased by 0.05 mm compared to the other group of measurement points. The coal samples with a laminar angle of 67.5 degrees had a different time for the relative tensile displacement to start growing in the region, which was influenced by the impact velocity. The higher the impact velocity, the earlier the growth time. The increasing trend of tensile displacement at different impact velocities was similar in both regions when the laminar angle is 90 degrees.
3.3. Distribution Characteristics of Coal Specimen Fragments
The residual debris of coal rock was collected and analyzed, and the debris in the range of 0~0.2 mm, 0.2~0.3 mm and 0.3~5 mm were collected and weighed. The classification method of rockburst debris is shown in Table 2. The mass percentage of particle sizes of broken coal specimens are shown in Figure 20. Since the mass percentage distribution range of each particle size after crushing of coal specimens was large, in order to better reflect its distribution characteristics, semi-log coordinates are used in the figure. Combined with the scale characteristics of semi-log coordinates, the percentages of fragment mass of natural or water-saturated coal specimens in the size range of 0–0.2 mm can be seen to vary little with increasing impact velocity (0.4489~0.776%). For natural or saturated coal specimens with chip particle sizes of 0.2 to 5 mm, however, the percentage chip mass was significantly increased with increasing impact velocity (3.533~11.879%). The percentage mass of saturated coal specimens with chip sizes of 0.2 to 5 mm was less than that of natural coal specimens, except for the coal specimens in which the bedding angle was 45 degrees, according to the results in Table 2 and Figure 20. This conclusion, therefore, proves the benefits of water injection for dust removal.
Table 2.
Classification criteria and analysis method of rockburst debris.
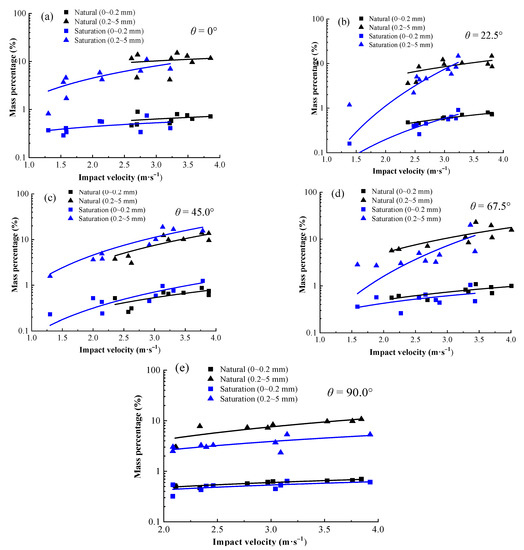
Figure 20.
Statistical mass percentage of particle size of broken coal specimens. (a) 0°, (b) 22.5°, (c) 45°, (d) 67.5°, (e) 90°.
4. Numerical Simulation
4.1. CDEM and Criteria
CDEM has evolved based on the Lagrangian system. It combines the advantages of both continuous and discrete simulation methods. It can simulate the whole process of material deformation to cracking. The numerical model in CDEM is shown in Figure 21a. This numerical model consists of blocks and interfaces. CDEM contains different node types such as continuous, discrete and hybrid node types, as shown in Figure 21b. One of the finite element types is shown in Figure 21c.
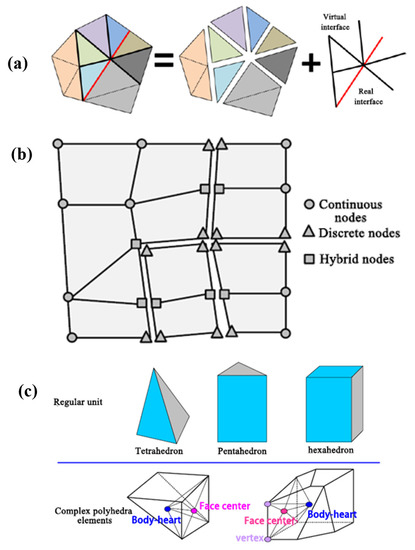
Figure 21.
Schematic diagram of CDEM method and principle. (a) The structure of the numerical model in CDEM. (b) Node type in CDEM. (c) The element of finite element in CDEM.
CDEM can monitor the contact force, the type of microcracks and the number of microcracks at various points within the specimen during the test, while the development of cracks on the surface of the specimen and the displacement of the specimen as a whole can be observed on a macroscopic level. In CDEM, when the particles are subjected to an external load, the particles move and change the bonding force between them. When the bonding force exceeds the bonding strength of the particles, microscopic cracks are created, and adjacent cracks overlap to form macroscopic visible cracks.
The input parameters used were a uniaxial compressive strength of 27.64 MPa, a tensile strength of 1.75 MPa, a cohesion of 7.85 MPa, an internal friction angle of 32.64°, a damping factor of 0.7, a modulus of elasticity of 2.29 GPa, and Poisson’s ratio of 0.24 obtained from the tests. The continuous-discontinuous element method establishes the control equations through a Lagrangian energy system [38,39,40]. The expressions are as follows
In the formula, is the nonconservative force of the system, and L is the Lagrangian function, which can be written as
where, , and are the work of system kinetic energy, elastic energy and conservative force.
The energy functional of the unit is
The damping force and the boundary external force are
where, is the damping factor and is the surface force on the cell boundary.
From Equations (28)–(30), Equation (27) can be written as
Using the integral by parts, we get
The Lagrangian equation is simplified as
In addition
Then the Lagrangian equation can be written as
When the unit rupture occurs, the above equation can be written as
and
The final equation is
Solving Equation (38) is the core of CDEM operations. First seeking the elastic force
Seeking damping force
The motion equation is
For solving CDEM arithmetic problems using Euler forward interpolation methods, two steps are included in each time step, namely the finite element solution and the discrete element solution. Throughout the calculation, the degree of equilibrium of the system is represented by the unbalanced rate.
CDEM uses a time-based dynamic relaxation technique for explicit iterative calculation. Figure 22 shows the calculation flow.
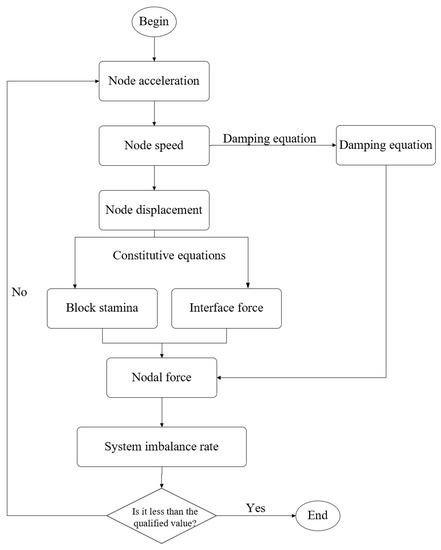
Figure 22.
Flow chart of CDEM calculation steps.
4.2. Analysis of Dynamic Tensile Characteristics of Coal Based on CDEM
Figure 23 shows the experimental model. The stratification angles are set in five groups of 0°, 22.5°, 45°, 67.5° and 90°. The whole model consists of 10,429 nodes and 20,544 triangular unit blocks. The substrate and laminar mechanical properties in the model are shown in Table 3.
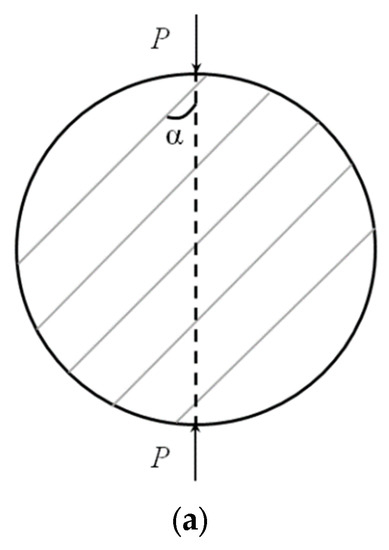
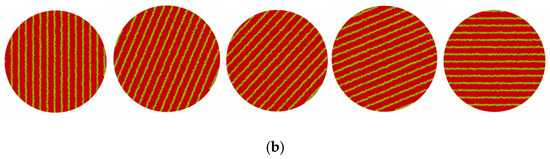
Figure 23.
Numerical model of Brazilian disk coal specimen with different bedding angles. (a) The angle between the bedding plane and the loading direction is the bedding angle. (b) Models with bedding angles of 0°, 22.5°, 45°, 67.5° and 90° respectively.
Table 3.
Parameters of coal specimens involved in numerical calculation.
When applying a velocity load at the upper loading point of the specimen to characterize the applied dynamic load, its loading parameters are
In the above equation, v is the applied dynamic velocity load, m/s, and t0 is the time required for the rate load to go from 0 to a given value. Here, the model is uniformly taken as 60 μs. This rise time is generally taken as the time required for the stress wave to make five round trips within the specimen, with different loading rates corresponding to different strain rates.
Figure 24 shows the evolution of the dynamic splitting stress field in the specimen, and the propagation of the stress waves. In the Figure, the impact velocity v = 4 m/s and the coal specimen lamination angle θ = 45°. After the impact load was applied, the stress wave started to propagate from the upper loading point to the lower boundary, and reached the lower loading point at 60 μs. Then, the stress waves were reflected from the loading point below. The overall stress field was symmetrically distributed at 120 μs, and this distribution pattern was consistent with the theoretical solution above. Stress concentrations in the middle of the specimen became more concentrated with the superimposed effect of the stress waves. Crack initiation occurred in the middle of the Brazilian disc specimen at 210 μs. The cracks then continued to expand to the loading boundaries of the upper and lower layers. Some secondary cracking occurred at the loading point. Cracks of 320 μs penetrated and the specimen was damaged. Figure 25 shows the displacement field change and crack extension process for the same specimen. From the evolution of the displacement field, the characteristics of the stress wave in the specimen can be seen. In contrast, the middle of the specimen cracked at 210 μs.
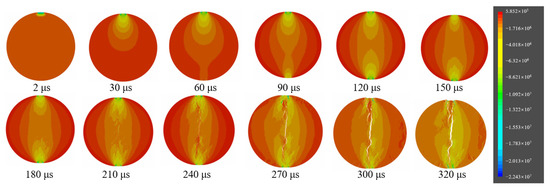
Figure 24.
Dynamic splitting stress field evolution of a typical Brazil disk coal specimen under impact load.
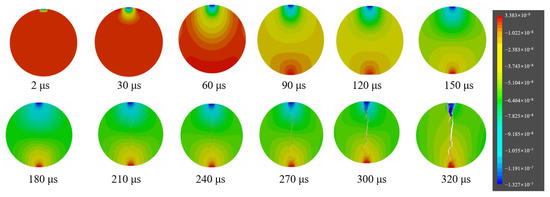
Figure 25.
Dynamic splitting displacement field evolution of a typical Brazil disk coal specimen under impact load.
Figure 26 shows the crack expansion process of coal specimens with impact velocity v = 4 m/s and bedding angles of 0°, 22.5°, 45°, 67.5°, and 90°. The cracks in the coal specimen first started in the center part along the stratification plane (θ = 0°), because this weak surface is prone to stress concentration and subsequent crack expansion occurred along the stratification plane at the upper and lower loading boundaries. Eventually crack penetration damage occurred in the specimen. The specimen damage mode was typical of tensile damage. The specimens exhibited certain shear damage characteristics along the lamina surface (θ = 22.5°, 45°, 67.5°) but the main damage mode was still tensile damage. When the stratified planes were perpendicular to the direction of loading (θ = 90°), the specimen still exhibited tensile damage characteristics. Simultaneous tensile and shear damage occurred at an angle to the direction of loading at the split level. The results of this numerical simulation are consistent with the conclusions obtained from the experiments carried out. In addition, in the numerical simulations, we also observed some secondary cracks along the weak surface of the lamina. This was due to the additional shear damage caused by the laminar surface. This result is consistent with the phenomenon depicted in Figure 14.
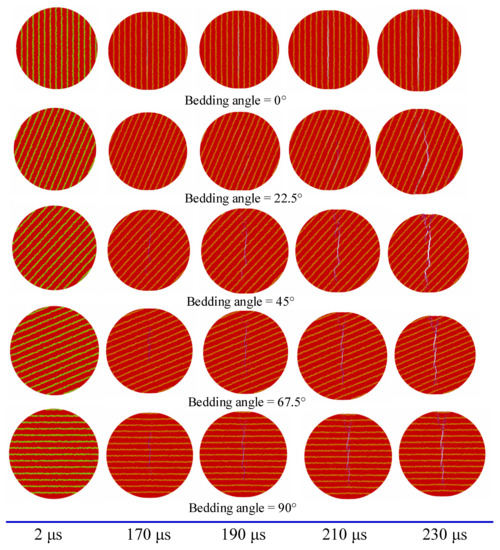
Figure 26.
Dynamic crack initiation process.
Figure 27 shows comparisons between the numerical simulation results of CDEM and the experimental results. It can be seen that the damage patterns of the specimens obtained from the numerical simulations are in good agreement with the experiments. The failure modes are all standard Brazilian disc failure modes with cracking along the center of the specimen. The main cracks are tensile cracks and show a tensile-shear compound fracture pattern at the end of the specimens. It is noteworthy that the simulated 22.5° bedding angle coal sample had a more obvious shear effect along the bedding plane, which is consistent with the experimental primary crack pattern. Figure 28 illustrates the comparison of the impact velocity-dynamic tensile strength curves obtained from the experimental and CDEM simulations. It can be noted that the numerical simulation can calculate a larger range of impact velocities, and the dynamic tensile strength test dispersion of coal samples with different bedding angles was greater than that of the experiment. However, in general, the trend that the dynamic tensile strength obtained from the simulation increased approximately linearly with the increase of impact velocity, and is consistent with the experimental findings. Both methods show the rate effect of dynamic tensile strength.
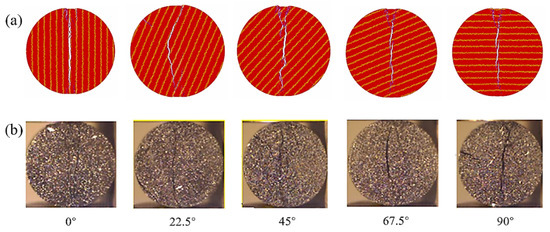
Figure 27.
Comparison of numerical simulation and experimental results. (a) Failure models of coal specimen with different bedding angles. (b) SHPB test.

Figure 28.
Comparative plots between the impact velocity and dynamic tensile strength curves obtained from experiments and numerical simulations.
The results of the CDEM simulation show the evolution of the dynamic splitting stress and strain fields of the Brazilian disc coal sample under impact loading, and the propagation, reflection and superposition characteristics of the stress waves in the coal rock specimen, which are in good agreement with the experimental results. This compensates for the incomplete recording of the crack initiation and extension process due to the limited frequency of the high-speed camera.
5. Discussion
Figure 29a shows a diagram of the Stefan effect. It is also known as the Stefan-Reynolds equation. It was first derived by Stefan when analysing the external forces required to separate two discs immersed in a viscous fluid at a given speed with a small distance between them. The Stefan effect is a physical phenomenon. When thin discs immersed in a viscous fluid are separated from each other, a hydrostatic pressure gradient is created between the discs due to the viscous flow, creating a viscous drag force that prevents the discs from separating from each other. The understanding of the Stefan effect is not limited to disc separation. It is clear that any change in the volume of fluid between the discs would cause a change in the hydrostatic pressure of the fluid between the discs, which would cause a viscous fluid to flow, creating a resistance to the movement of the discs [41]. Thus, coal can be considered as a series of micro-disc systems containing free water (viscous fluid). When the coal is subjected to dynamic loading, the Stefan effect occurs during the deformation of the pores due to the presence of free water in the coal micro-pores. This is shown in Figure 29b. Water does not easily reach the pore tips when dynamically loaded.
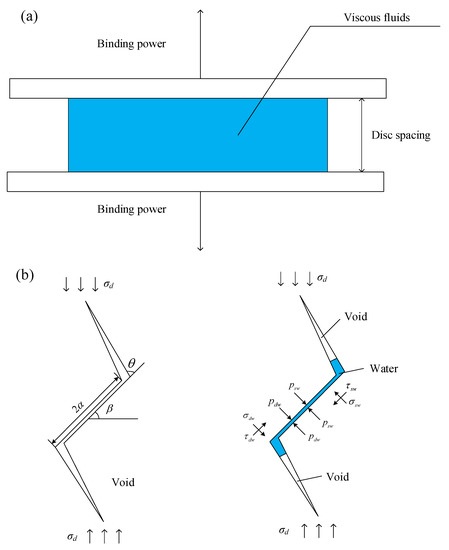
Figure 29.
Schematic representation of the effect of water on the dynamic expansion characteristics of cracks in coal. (a) Schematic of the Stefan effect. (b) Dynamically loaded free water forces on fracture surfaces.
The single dynamic load, the cohesive force F due to the free water surface tension of the fissure, and the resistance F′ due to the Stefan effect, prevent the fissure from expanding and fracturing. The force preventing fracture of the fracture is pdw:
where V is the volume of the liquid, K is the surface energy, φ is the wetting angle, δ is the radius of the curved surface of the water, η is the viscosity of the liquid, r is the radius of two parallel circular plates filled with incompressible viscous liquid in the middle, vdw is the relative velocity of the separation of the two circular plates, h is the distance between the two circular plates, and M is the area of the fissure containing water.
The shear stress τd-sw and the normal stress σd-sw at the main fracture face of the winged fissure containing pore free water are expressed in Equations (44) and (45) as shown in Figure 29b:
where, fd-sw is the friction factor of the fracture surface under dynamic water content conditions.
We found that the dynamic tensile strength, breaking strain and peak deformation energy density of coal rock specimens in the water-saturated state were higher than those in the natural state when the lamina orientation was the same and the impact velocities were similar. When the lamina orientation was 0° and the impact velocity was less than 3 m/s, the tensile strength of the water-saturated specimens was basically the same as that of the specimens in the natural state. After the impact velocity exceeded 3 m/s, the growth rate of the former gradually increased compared with the latter. The difference between the tensile strength of the water-saturated specimens and the natural state of the coal rock specimens reached 0.3~0.4 MPa when the lamination orientation was 22.5° and the impact velocity was greater than 2.5 m/s. When the lamination orientation was 45° and the impact velocity was 3 m/s, and the strength of the water-saturated specimens was about 0.1 MPa higher. When the lamination orientation was 67.5°, the data obtained from the water-saturated specimens were less and the strengths were slightly lower than those of the natural state by 0.1~0.2 MPa. When the lamination orientation was 90°, the tensile strengths of the water-saturated specimens were higher than those of the natural state by 0.1 MPa after the impact velocity was greater than 3 m/s.
The peak energy density of the water-saturated coal rock specimens was higher than that of the natural state coal rock specimens, with the former being 1.5 to 2 times higher than the latter. The energy density of the water-saturated specimens reached its peak at a time period 10–20% later than that of the natural coal rock specimens. Our preliminary analysis suggests that this is due to the fact that the crack expansion under impact loading is much faster than the expansion rate during static loading. The free water in the rock pores is unable to diffuse into the expanding fracture in an instant, while the effect of surface tension begins to emerge. The water creates a cohesive force F at the crack face that prevents crack expansion, resulting in an increase in the stress value when the rock is ruptured in a water-saturated state. This phenomenon can be explained by the Stefan effect in physics: when parallel circular flat plates separate at a relative velocity dv/dt, the viscous fluid generates a counter force F’ to prevent the separation between the plates. The resistance produced by the Stefan effect can be expressed as Equation (43), η being the viscosity of the liquid (Pa·s). Coal rock specimens in the water-saturated state have higher values of η than specimens in the natural state. The stress values of coal rock specimens in the saturated water state are greater than those of coal rock specimens in the natural state for similar impact velocities. Due to the presence of water, the crack expansion rate in the coal rock specimens is suppressed. Therefore, the saturated water specimens have higher peak stress and peak deformation energy density.
6. Conclusions
In this work, the dynamic tensile properties and evolution characteristics of strain energy density for coal were investigated using both the SHPB and CDEM methods. The following conclusions are drawn.
- (1)
- When the laminated surface of the coal sample is at a certain angle with the impact loading direction, the damage mode is coupled with tensile and shear damage. For the natural or saturated coal samples with debris particle sizes of 0~0.2 mm, the percentage of debris mass does not change much with the increase of impact velocity. In addition, the percentage of fragment mass increases significantly with the increase of impact velocity for the natural or water-saturated coal samples with the fragment size of 0.2~5 mm.
- (2)
- The presence of weak planes, microcracks and laminae cause the shear damage zone to behave in a more complex manner. If the crack plane coincides with the high shear stress plane, the developed shear cracks extend along the weak laminae and the shear damage zones in BD specimens are not symmetrically distributed.
- (3)
- Changes in the difference between the relative tensile displacements of two groups of measurement points on the localization zone also reflect the evolution of deformation localization of the specimen. When the deformation localization begins in the center of the specimen, the displacements of the two groups of measurement points are relatively consistent at the beginning of the growth, and the difference between them generally begins to increase in the middle.
- (4)
- The energy accumulated inside the coal rock specimen that causes damage of the specimen increases with the increase of impact velocity. For medium-grained debris with a particle size >5 mm, the scale ratio characteristics show that the range of variation of the scale ratio of coal rock debris is relatively large when the impact velocity is small. Plate fragments with a length-thickness ratio range of 3~6 are predominant. When the impact velocity gradually increases, the variation range of coal rock debris scale ratio gradually decreases, the debris scale characteristics tend to be stable, and the blocky debris with the length-to-thickness ratio lower than 3 predominates.
Author Contributions
Conceptualization, S.G. and C.W.; Methodology, L.Z.; Software, Y.J. and L.Z.; Validation, S.G., C.W. and F.X.; Formal analysis, H.Z.; Investigation, J.W. and X.R.; Resources, S.W.; Data curation, S.Y.; Writing—original draft preparation, S.G., C.W. and L.Z.; Writing—review and editing, S.G.; Visualization, J.L.; Supervision, S.G. and F.X.; Project administration, F.X.; Funding acquisition, S.G. All authors have read and agreed to the published version of the manuscript.
Funding
This work was financially supported by the Fundamental Research Funds for the Universities of Henan Province (grant no. NSFRF200332), China Postdoctoral Science Foundation (grant no. 2021M701100), Key Research and Development and Promotion of Special (Science and Technology) Project of Henan Province (grant nos. 212102310379 and 212102310603), National Natural Science Foundation of China (grant nos. 41907402 and 51604093), the Key Scientific Research Project Fund of Colleges and Universities in Henan Province (grant nos. 21A610005 and 20B440001), and the Doctoral Foundation of Henan Polytechnic University (grant no. B2019-22).
Data Availability Statement
Data will be made available on request.
Conflicts of Interest
The authors declare no conflict of interest.
References
- Lu, J.; Zhang, D.; Huang, G.; Li, X.; Gao, H.; Yin, G. Effects of loading rate on the compound dynamic disaster in deep underground coal mine under true triaxial stress. Int. J. Rock Mech. Min. Sci. 2020, 134, 104453. [Google Scholar] [CrossRef]
- Li, J.; Zhao, J.; Gong, S.Y.; Wang, H.C.; Ju, M.H.; Du, K.; Zhang, Q.B. Mechanical anisotropy of coal under coupled biaxial static and dynamic loads. Int. J. Rock Mech. Min. Sci. 2021, 143, 104807. [Google Scholar] [CrossRef]
- Song, H.; Zhang, H.; Fu, D.; Yang, Y.; Huang, G.; Qu, C.; Cai, Z. Experimental study on damage evolution of rock under uniform and concentrated loading conditions using digital image correlation. Fatigue Fract. Eng. Mater. Struct. 2013, 36, 760–768. [Google Scholar] [CrossRef]
- Zhang, C.; Yu, G.; Zhang, C. Rock matrix-fractured media model for heterogeneous and fractured coal bed. Trans. Nonferrous Met. Soc. China 2011, 21, 621–625. [Google Scholar] [CrossRef]
- Hao, X.; Wei, Y.; Yang, K.; Su, J.; Sun, Y.; Zhu, G.; Wang, S.; Chen, H.; Sun, Z. Anisotropy of crack initiation strength and damage strength of coal reservoirs. Petrol. Explor. Dev. 2021, 48, 243–255. [Google Scholar] [CrossRef]
- Li, J.; Guan, C.; Han, K.; Wang, Z. Characteristics of transient charge on Datong coal sample surfaces with different cracking propagation. PLoS ONE 2020, 15, 0229824. [Google Scholar] [CrossRef]
- Gong, S. Investigation of tensile and fracture mechanical properties of bituminous coal at different strain rates. J. Mater. Res. Technol. 2021, 15, 834–845. [Google Scholar] [CrossRef]
- Liu, J.; Yang, M.; Wang, D.; Zhang, J. Different bedding loaded coal mechanics properties and acoustic emission. Environ. Earth Sci. 2018, 77, 322–332. [Google Scholar] [CrossRef]
- Pan, R.; Fu, D.; Yu, M.; Lei, C. Directivity effect of unloading bedding coal induced fracture evolution and its application. Int. J. Min. Sci. Technol. 2017, 27, 825–829. [Google Scholar]
- Tian, K.; Wei, E. Gas seepage model and experiment based on bedding effect of fractured coal body. Math. Probl. Eng. 2022, 2022, 3863267. [Google Scholar] [CrossRef]
- Dai, J.; Liu, C.; Li, M.; Song, Z. Influence of principal stress effect on deformation and permeability of coal containing beddings under true triaxial stress conditions. R. Soc. Open Sci. 2019, 6, 181483. [Google Scholar] [CrossRef]
- Liu, C.; Yin, G.; Li, M.; Shang, D.; Deng, B.; Song, Z. Deformation and permeability evolution of coals considering the effect of beddings. Int. J. Rock Mech. Min. Sci. 2019, 117, 49–62. [Google Scholar] [CrossRef]
- Hou, P.; Xue, Y.; Gao, F.; Dou, F.; Su, S.; Cai, C.; Zhu, C. Effect of liquid nitrogen cooling on mechanical characteristics and fracture morphology of layer coal under Brazilian splitting test. Int. J. Rock Mech. Min. Sci. 2022, 151, 105026. [Google Scholar] [CrossRef]
- Zhao, Y.; Zhao, G.; Jiang, Y.; Elswoth, D.; Huang, Y. Effects of bedding on the dynamic indirect tensile strength of coal: Laboratory experiments and numerical simulation. Int. J. Coal Geol. 2014, 132, 81–93. [Google Scholar] [CrossRef]
- Li, M.; Liang, W.; Yue, G.; Yue, J.; Zheng, X. Experiment and modeling of permeability under different impact loads in a structural anisotropic coal body. ACS Omega 2020, 5, 9957–9968. [Google Scholar] [CrossRef]
- Li, Y.; Zhao, B.; Yang, J.; Sun, J.; Huang, W.; Li, Z.; Wang, B. Experimental study on the influence of confining pressure and bedding angles on mechanical properties in coal. Minerals 2022, 12, 345. [Google Scholar] [CrossRef]
- Zhong, K.; Zhao, W.; Qin, C.; Chen, W. Experimental study on the mechanical behavior and failure characteristics of layered coal at medium strain rates. Energies 2021, 14, 6616. [Google Scholar] [CrossRef]
- Yang, R.; Zhou, Y.; Ma, D. Failure mechanism and acoustic emission precursors of coal samples considering bedding effect under triaxial unloading condition. Geofluids 2022, 2022, 8083443. [Google Scholar] [CrossRef]
- Liu, J.; Hu, J.; Shen, M.; Yang, M.; Fang, Y. LNMR study on microstructure characteristics and pore size distribution of high-rank coals with different bedding. Adv. Civil Eng. 2021, 2021, 8542630. [Google Scholar] [CrossRef]
- Liu, J.; Jia, G.; Gao, J.; Hu, J.; Chen, S. NMR study on pore structure and permeability of different layers of deep low-rank coal. Energy Sour. Part A Recovery Util. Environ. Eff. 2020, 2020, 1742254. [Google Scholar] [CrossRef]
- Zhao, J.; Zhang, Y.; Ranjith, P.G. Numerical simulation of blasting-induced fracture expansion in coal masses. Int. J. Rock Mech. Min. Sci. 2017, 100, 28–39. [Google Scholar] [CrossRef]
- Tao, Y.; Yuanlong, W.; Shiwan, C.; Liu, W.; Zhao, L.; Zhang, X. Study on mechanical properties and crack propagation of raw coal with different bedding angles based on CT scanning. ACS Omega 2022, 7, 27185–27195. [Google Scholar]
- Huang, J.; Cheng, G.; Zhao, Y.; Ren, W. An experimental study of the strain fields development prior to failure of a marble plate under compression. Tectonophysics 1990, 175, 269–284. [Google Scholar]
- Liu, D.; Cai, M.; Zhou, Y.; Chen, Z.Y. A study on dynamic monitoring of rock crack extension process. J. Rock Mech. Eng. 2006, 25, 467–472. [Google Scholar]
- Sutton, M.A.; Mingqi, C.; Peters, W.H.; Chao, Y.J.; McNeill, S.R. Application of an optimized digital correlation method to planar deformation analysis. Image Vis. Comput. 1986, 4, 143–150. [Google Scholar] [CrossRef]
- Peters, W.H.; Ranson, W.F. Digital imaging techniques in experimental stress analysis. Opt. Eng. 1982, 21, 427–431. [Google Scholar] [CrossRef]
- Yamaguchi, I. A laser-speckle strain gauge. J. Phys. E Sci. Instrum. 1981, 14, 1270. [Google Scholar] [CrossRef]
- Skurtveit, E.; Torabi, A.; Gabrielsen, R.H.; Zoback, M.D. Experimental investigation of deformation mechanisms during shear-enhanced compaction in poorly lithified sandstone and sand. J. Geophys. Res. Solid Earth 2013, 118, 4083–4100. [Google Scholar] [CrossRef]
- Sun, Q.; Cai, C.; Zhang, S.; Tian, S.; Li, B.; Xia, L. Study of localized deformation in geopolymer cemented coal gangue-fly ash backfill based on the digital speckle correlation method. Construct. Build. Mater. 2019, 215, 321–331. [Google Scholar] [CrossRef]
- Ma, S.; Xu, X.; Zhao, Y. The GEO-DSCM system and its application to the deformation measurement of rock materials. Int. J. Rock Mech. Min. Sci. 2004, 41, 292–297. [Google Scholar] [CrossRef][Green Version]
- Yuan, C.; Yuan, Z.; Wang, Y.; Li, C.-M. Analysis of the diffusion process of mining overburden separation strata based on the digital speckle correlation coefficient field. Int. J. Rock Mech. Min. Sci. 2019, 119, 13–21. [Google Scholar] [CrossRef]
- Song, Y.; Ren, H.; Xu, H.; Chen, Z.; Dong, A. Study on synergistic system of energy-absorbing yielding anti-impact supporting structure and surrounding rock. Sci. Rep. 2022, 12, 1–9. [Google Scholar] [CrossRef]
- Zhang, Z.; Xie, H.; Zhang, R.; Guo, X.; Chen, Z.; Dong, A. Deformation damage and energy evolution characteristics of coal at different depths. Rock Mech. Rock Eng. 2019, 52, 1491–1503. [Google Scholar] [CrossRef]
- Meng, Q.; Zhang, M.; Han, L.; Pu, H.; Nie, T. Effects of acoustic emission and energy evolution of rock specimens under the uniaxial cyclic loading and unloading compression. Rock Mech. Rock Eng. 2016, 49, 3873–3886. [Google Scholar] [CrossRef]
- Wold, M.B.; Connell, L.D.; Choi, S.K. The role of spatial variability in coal seam parameters on gas outburst behaviour during coal mining. Int. J. Coal Geol. 2008, 75, 1–14. [Google Scholar] [CrossRef]
- Chen, Y.; Zhang, Y.; Li, X. Experimental study on influence of bedding angle on gas permeability in coal. J. Petrol. Sci. Eng. 2019, 179, 173–179. [Google Scholar] [CrossRef]
- Xibing, L. Rock Dynamics Fundamentals and Applications; Science Press: Beijing, China, 2014. [Google Scholar]
- Fan, Y.; Li, S.; Hou, Y.; Kim, M.-S.; Yun, S. A study of the failure mechanism of rock and soil associate under different boundary conditions. Hydrogeol. Eng. Geol. 2013, 40, 47–48. [Google Scholar]
- Fan, Y.; Adewuyi, O.I.; Feng, C. Strength characteristics of soil rock mixture under equal stress and cyclic loading conditions. Geosyst. Eng. 2015, 18, 73–77. [Google Scholar]
- Feng, C.; Li, S.; Liu, X.; Zhang, Y. A semi-spring and semi-edge combined contact model in CDEM and its application to analysis of Jiweishan landslide. J. Rock Mech. Geotech. Eng. 2014, 6, 26–35. [Google Scholar] [CrossRef]
- Zheng, D.; Li, Q. An explanation for rate effect of concrete strength based on fracture toughness including free water viscosity. Eng. Fract. Mech. 2004, 71, 2319–2327. [Google Scholar] [CrossRef]


Publisher’s Note: MDPI stays neutral with regard to jurisdictional claims in published maps and institutional affiliations. |
© 2022 by the authors. Licensee MDPI, Basel, Switzerland. This article is an open access article distributed under the terms and conditions of the Creative Commons Attribution (CC BY) license (https://creativecommons.org/licenses/by/4.0/).