Abstract
The degree of informatization of coal mine safety management is becoming higher and higher, and a large amount of information is generated in this process. How to convert the existing information into useful data for risk control has become a challenge. To solve this challenge, this paper studies the mathematical model of coal mine risk early warning in China based on data mining. Firstly, the coal mine risk data was comprehensively analyzed to provide basic data for the risk prediction model of data mining. Then, the adaptive neuro-fuzzy inference system (ANFIS) was optimized twice to build the coal mine risk prediction model. By optimizing the calculation method of the control chart, the coal mine risk early warning system was proposed. Finally, based on the coal mine risk early warning model, the software platform was developed and applied to coal mines in China to control the risks at all levels. The results show that the error of the optimized ANFIS was reduced by 66%, and the early warning error was reduced by 57%. This study aimed to provide implementation methods and tools for coal mine risk management and control, and data collected has reference significance for other enterprises.
MSC:
91G70
1. Introduction
Accident risk has always been a key factor restricting the sustainable development of enterprises, especially the coal mining enterprises. With the advancement of science and technology, the scientific and informatization level of enterprise safety management is becoming higher and higher. In this process, the data of safety management be-comes more and more complex. However, the utilization rate of these data is very low, resulting in a waste of data resources. How to convert the existing data into useful in-formation for risk control has become a challenge. This paper aimed to solve this problem based on data mining and analysis.
Many studies have committed to studying the risk assessment methods of various industries and have achieved fruitful results. One of the effective ways of enterprise risk control is risk assessment. The commonly used evaluation methods are machine learning, such as the SVM algorithm and mathematical fuzzy set [1,2], the BP neural network [3], and the MLP-ANN model [4]. Safety management based on risk assessment methods has been widely studied and applied in many industries, for example, health and safety policies of microenterprises [5,6]. Currently, the safety risk classification standards for chemical enterprises are studied from the aspects of personnel technical level, equipment failure, major hazard source, production process, environment, accident, certification, safety assessment and emergency response [7]. Based on social cognition theory and behavior motivation theory [8], the research model of safety production management mode and safety behavior has been established. Using the analytic hierarchy process (AHP) and fuzzy comprehensive evaluation method (FCE) [9], the evaluation index model for safety production management of oil field enterprises was established. A risk analysis model was established for the most important and least important emergencies and future situations in enterprise risk management [10,11].
As one of the high-risk industries, coal mine safety management has had more and more attention and thoroughly studied [12,13,14]. According to the historical experiences contained in the comprehensive database [15], the risks of serious accidents in the fossil energy chain were compared. Ventilation accidents in underground coal mines were analyzed to assess the effectiveness of legislative reform on the overall safety of the working environment [16,17]. The coal mine safety assessment method based on fuzzy logic was proposed and applied to overcome the uncertainty encountered in the risk assessment method of the classification decision matrix [18]. The overall framework of mine risk management was proposed, including risk assessment and risk treatment, to effectively reduce the negative impacts of mine closure [19]. The models of coal mine safety assessment and management have been widely studied, mainly including entropy weight and grey clustering [20,21], fuzzy risk [22], data mining [23] and multi-agent modeling [24]. In addition, the behavior and psychological factors affecting employees affect the safety state of coal mines [25,26,27,28].
Risk prediction and early warning are widely used, mainly in finance [29], transportation [30,31,32], construction [33], process of industrial operations [34], human resource management [35], natural disasters [36,37], and metal dust and natural gas accidents [38,39]. In addition, the analytic hierarchy process, entropy weight method and multiple correlation number method have been used to analyze the static risk or dynamic risk on urban public safety, and the regional risk on urban public safety has been predicted [40].
In coal mining enterprises, risk early warning is the key to advance the risk control gateway. The safety early warning model of coal face was established based on FCM (fuzzy clustering model) and GA-BP (genetic algorithm–back propagation neural network) [41]. The early warning model of coal and gas outbursts and human factor risk was established based on data mining [42,43]. The prediction model was constructed to improve the safety and productivity of underground coal mines, using a hybrid CNN–LSTM (convolutional neural network–long-short-term memory neural network) model and sensors supported by the Internet of things [44]. Most studies have studied the risk of coal mine accidents from the perspective of evaluation and management. However, in an actual working coal mine, risk is identified and warned of in advance, and then it is dynamically grading controlled. This can prevent trouble before it happens. Therefore, this paper mines data from coal mine risk information. Based on this, ANFIS (adaptive network-based fuzzy inference system) is optimized to predict the risk of coal mine accidents. The optimized control chart is used for risk early warning to build a coal mine risk management and control system.
With the rapid development of computer technology, risk early warning and system security rely more and more on computer and information technology. An evaluation security system based on dynamic Bayesian networks has been constructed [45]. High reliability software systems have been developed to prevent failures and improve system safety [46]. An intelligent software platform has been developed to improve the quality of the process hazard analysis (PHA) by combining hazard and operability studies (HAZOP), layer of protection analysis (LOPA), safety requirements specification (SRS) and safety integrity level (SIL) [47]. In coal mining enterprises, the safety management information system has gradually improved [48,49,50,51].
The implementation of monitoring and early warning systems based on sensors has developed rapidly [52,53]. Tuyen proposed a new deep learning architecture, namely psounet, and developed an early warning system to improve the performance of mountain torrent segmentation from satellite images [54]. Based on AHP and fuzzy comprehensive evaluation, Xiong established a comprehensive standard cloud model and early warning system to achieve the purpose of roof risk assessment and identification [55].
The application of computer technology in coal mine enterprise management has become increasingly mature, and the research on data mining in this field is also developing rapidly. Combining coal mine risk control with data mining and taking full advantage of data mining analysis is the current trend.
First, this paper studies the risk of coal mine behavior, which refers to the “three violations” of coal mine workers in actual safety production. Then, an early warning model based on the behavior risk data of coal miners (including the time, place, and content of workers’ violations) is established. Different from other studies, the ANFIS is optimized twice in this study to build a coal mine risk prediction model. By optimizing the calculation method for the UCL of the control chart, a coal mine risk early warning method is proposed. Finally, based on the coal mine risk control technology and data mining, this paper develops a risk management and control platform for coal mines in China. The application of this platform can realize functions including dynamic monitoring, data prediction, and risk early warning of various accident risks for coal mine enterprises, which is a convenient and effective to carry out coal mine risk control and early warning, greatly improving the modernization and informatization of risk control and early warning.
2. Methods
Coal mine risk management and control technology consists of data analysis, risk prediction, and early warning. The data analysis used data mining to analyze the periodic changes of different types of data, and then calculate the correction coefficient. In the risk prediction, the optimized ANFIS was used to predict the data within a specified time range. In the risk early warning, the optimized control chart was used to determine whether to give early warning.
The coal mine risk prediction of the optimized adaptive neuro-fuzzy inference system based on data mining in this study includes the following 5 steps (Figure 1).
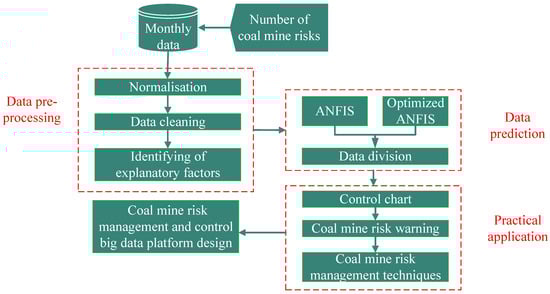
Figure 1.
Risk prediction process.
2.1. Data Processing and Analysis
According to the characteristics of coal mine risk information text data sources, i.e., long text, high noise, large specialized vocabulary, as well as the Chinese text, there are problems such as continuous uninterrupted words and stop words. Before analyzing and predicting coal mine hazards information text, it was necessary to pre-process the data according to the characteristics of the text. In this paper, a text pre-processing method was designed for the features of the coal mine hidden danger information text, as shown in Figure 2. The text pre-processing method mainly included short text localization, removal of text noise, word separation, and removal of discontinued words. It provided data quality assurance and text data formalization support for post-sequence data mining analysis and risk prediction work.
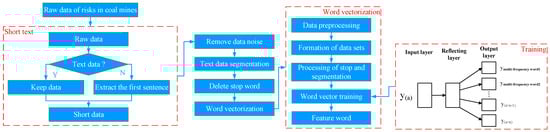
Figure 2.
Pre-processing method of mine risk data information.
Hidden text was converted into short text, and then the segmentation words and stop words were removed. In this study, the Jieba partitioning library was used to process the information on coal mine hazards. Because the text contained some proper nouns, such as “falling slag”, “piece gang”, “topping out”, etc., the splitting results were biased. Therefore, we added a custom dictionary for mine accident information to solve this problem. To remove the special characters and punctuation, the words at the end of the subdivision were deactivated.
Coal mine hidden danger information was mainly based on a large-scale corpus, and word vectors were trained to establish the relationship between context and intermediate words. The higher the correlation between the intermediate words and the context, the better the effect of the trained word vector. On the contrary, the weaker the correlation between words in the text, the longer the training time of the word vector, and the worse the effect. The statistics of the multi-frequency word algorithm were increased to improve the training effect of the word vector. Multi-frequency words and context were used as the output layer to improve the effect and rationality of word vector training. Figure 2 shows the structure of the model training part.
As shown in Figure 2, since the dataset of the coal mine hidden danger information text was large, it was necessary to reduce the training window and the dimension of the word vector during word vector training. The trained word vector contained richer in-formation, enabling a deep learning network to process more complex natural languages. The process and results of the word vector training are shown in Appendix A Table A1 and Table A2.
2.2. Risk Prediction
ANFIS has a good reasoning and expression ability and combines the self-organization, self-adaptive, and self-learning abilities of a neural network. In terms of data prediction, it can not only predict linear data but also non-linear data, which can reduce the prediction error. Therefore, this paper used ANFIS to predict the coal mine risk data. In practical application, although ANFIS can predict the changing trend of risk (the change law of risk with time), the error is large. ANFIS predicts the quantitative change of coal mine risk over time, and the difference between the prediction result and the actual value is referred to as the prediction error. For this reason, we optimized the prediction algorithm according to the trend of risk change and the characteristics of ANFIS.
The gradient search method of the ANFIS minimum error is based on the total error minimization method. The learning process reduces the error function E in the fastest direction to adjust the premise parameters until the error value is satisfactory. The risk prediction error is relatively large due to the constant learning rate of ANFIS. Therefore, optimizing the learning efficiency and risk prediction ability of ANFIS was the focus of this paper. The adjustment of the learning parameters can be expressed by Equation (1).
where is the learning rate, is the ith output, k is the kth group of data, and E is the total error.
In order to further reduce the error, the characteristics of the cyclical changes in the risks of coal mining enterprises were considered to further optimize ANFIS. Under similar production conditions in the same coal mining enterprise, the changes in its risk data were cyclical. In order to improve the reliability of risk prediction, data mining algorithms were used to analyze the periodic errors of risk data to optimize risk prediction. The model is shown in Equations (2) and (3).
where m is the amount of data required for prediction analysis; n is the year of the data to be analyzed; is the mean value of the risk data; where 1 ≤ m < n.
where is the standard deviation of the data error.
Taking the three-violation data on 10 August 2021, as an example, the data of the previous 3 years can be used as a reference (2018–2020), that is, n = 2021, m = 3. Then, n, m, and related data are inputted into Equation (3) and the error of the same date in two consecutive years is analyzed. According to Equation (3), the standard deviation of the three-violation data in the past 3 years can be calculated to analyze the degree of dispersion. Finally, the learning efficiency of ANFIS was further optimized, as shown in Equation (4).
where i is the output result order.
2.3. Risk Warning
Control chart is an analysis method based on the principle of hypothesis testing and is often used to detect whether a production process is in the control state. The control chart in this study was used to analyze the coal mine risk data to intuitively and effectively judge whether the safety situation is under control. The control chart includes the center line (CL = μ), the upper control line (UCL = μ + 3σ), and the lower control line (LCL = μ − 3σ), as well as the sample statistics and point tracing curves extracted in chronological order.
Because the upper control line is relatively fixed, false positives may be found in the process of practical application. Therefore, this paper optimized the UCL to reduce false alarms, as shown in Equations (5)–(7). The correction coefficient is calculated according to the trend of data to reduce the fluctuation of the UCL. If the mean value of the data (d) to be analyzed is greater than that of the reference data (μ), the UCL will decrease with the change range (ω). On the contrary, the UCL will increase with the change range.
where ω is the correction coefficient; Dmax is the maximum value of the risk data to be analyzed; Dmin is the minimum value of the risk data to be analyzed.
where d is the mean value of the risk data to be analyzed.
In the process of coal mine safety production, the risk prediction and early warning mechanism is an important part to control and manage the focus of coal mine risk control. This paper combined the coal mine hierarchical control mechanism, the data analysis method, and the prediction and early warning model to build a new coal mine risk prediction model, as shown in Figure 3.
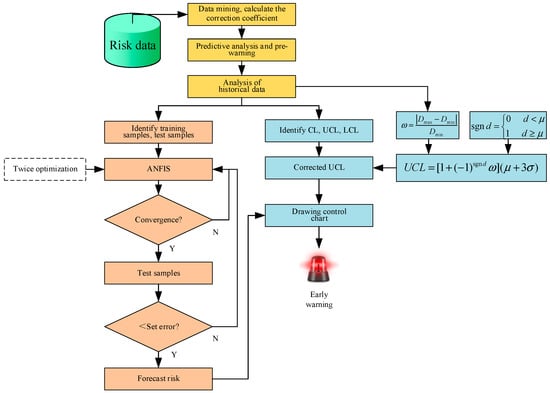
Figure 3.
Early warning mechanism of coal mine risk.
Based on the new prediction model, we obtained the data for the last three years from the risk information database, and calculated the CL, UCL, and LCL. The historical data was divided into training samples and test samples, and the training samples were used to train the optimized ANFIS algorithm. After convergence, the test samples were used to test the model. If the resulting error was reasonable, prediction could be performed; otherwise, the model was retrained. Then, the UCL, CL, and LCL were calculated. If the predicted data exceeded the controllable range, an early warning would be given.
Since Python can provide efficient high-level data structures, rich standard libraries, and simple and effective object-oriented programming [56], it was used to implement the text analysis and risk prediction models built in this paper. In addition, it also allows the development of Web applications. Therefore, this paper used Python to implement the application platform development of the process, as shown in Figure 3.
2.4. Data Sources
Luxi Coal Mine, located in Yanzhou City, is a new modern mine approved by the State Planning Commission of China. It was completed and put into operation in May 2004. The mine area is 59.6 km2, the geological reserves of the mine are 324 million tons, the industrial reserves are 108 million tons, and the production capacity is 1.5 million tons/year. The data for this study came from the Luxi Coal Mine, which had generated a large amount of mine safety risk data since the implementation of the mine safety risk management system in 2014, and this paper selected a total of 92,937 risk data generated from May 2017 to June 2021 as data support. It is worth noting that risk data are mainly related to workers’ violations, as shown in Figure 4. This paper predicts behavioral risk from a macro perspective. Based on the rule that the number of violations changes with time, the number of violations of work areas or coal mining enterprises in a certain period of time in the future was analyzed and predicted.
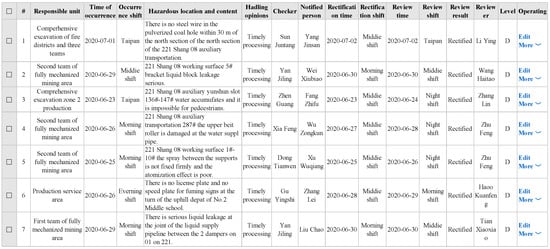
Figure 4.
Risk data (partial data).
During the selection of variables, 6 different types of variables were selected to explain the associations between hidden risks. Due to the large amount of data and the number of valid correlations that exist. In this paper, the hidden risk level was used as the analysis target, and other hidden risk occurrence sectors, times, locations and months were used as the underlying variables for the analysis. The overall situation of potential risks in coal mines is shown in Table 1.

Table 1.
Combined statistics on hidden risks in coal mines.
According to the steps shown in Figure 3, the specific risk descriptions and risk types in Table 1 were extracted to form a text data set of one line and one sentence. The word vector model was analyzed using python, after word segmentation. The word vector model included word similarity information expressed by cosine values. The word with the highest similarity with the corresponding hidden danger type was regarded as the characteristic word of the type of safety risk. Feature words contain rich basic information, which helps managers understand the overall situation of security risks. The main feature words (Table 2) closely related to safety risks were extracted and analyzed according to the word vector model. “Roof”, “signature”, “life”, “clear”, “responsibility”, “operation log”, “shift”, “shift leader” and “non flooded” did not mean risk, but were just words that appeared in daily risk management. In other words, the appearance of these words meant that the corresponding statement may be the content describing risks. The text information was input into the word vector model, and these feature words were extracted and processed by the model. The processing flow is the word vector part shown in Figure 2.
Table 2.
Analysis results of main characteristic words of potential safety risks.
3. Results
3.1. Data Preprocessing
According to the characteristic words of safety hazards, managers can quickly form an intuitive understanding of safety hazards, further clarify the information flow of hidden danger characteristics of different hidden danger subjects and grasp the details of hidden dangers. A Sankey chart is a specific type of flow chart. The width of the extended branches in the chart corresponds to the size of the data flow. The sum of the widths of all the main branches should be equal to the sum of the widths of all the distributed branches. It maintains the energy balance and is very suitable for visual analysis of data flow and other data. In the experiment, the amount of information flow was positively related to the co-occurrence frequency and similarity of different words.
Because displaying a large amount of data at the same time may affect the data visualization effect, more representative hidden danger types, operation units, and hidden danger locations were selected to draw the Sankey chart. Taking the hidden danger of coal dust and support as an example, the safety hazard characteristics of different work units and different hidden danger positions were obtained. The Sankey chart of safety hidden danger is shown in Figure 5.
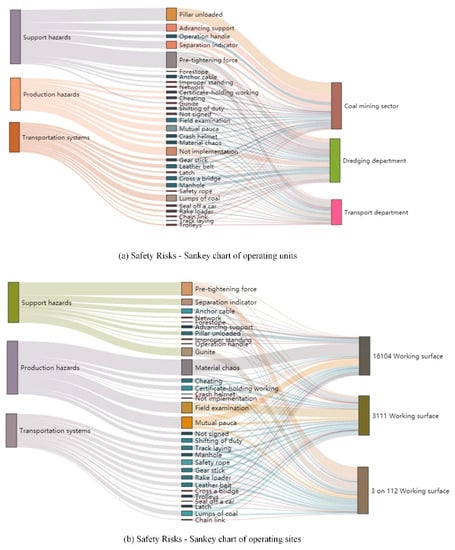
Figure 5.
Sankey Chart of safety risks.
The trend of lines in the Sankey chart indicate the trend of the data flow, which can help analyze the change in the data flow. The change in the width of the lines is inducive to understand the data change. On this basis, different nodes were compared. Figure 5a shows the safety risk Sankey chart of the operating units, and Figure 5b shows the safety risk Sankey chart of the operating sites. In Figure 5, each branch represents an information flow, and the width of the branch represents the information flow. The left side of each figure is the analyzed security risk, the middle of the figure is the safety risk feature word extracted in this experiment, and the right side of the figure represents the location of the potential risk to be analyzed or the operation unit at the time of the potential risks. The width and flow direction of the branches in Figure 5a present the frequency and characteristics of the potential safety risks of different operating units, respectively. The width and flow direction of the branches in Figure 5b represent the frequency and characteristics of potential safety risks in different locations, respectively.
3.2. Predicted Results
According to the process shown in Figure 3, this paper encapsulates a prediction model and used python for implementation. By inputting the information in the time and risk category, the prediction results can be obtained. For example, the prediction data can be obtained by inputting the 40 days of data concerning the above 38 types of risks in the risk categories of gas, coal dust, roof fall, etc. (denoted by 1, 2, 3, etc.).
The optimized prediction algorithm was used to predict coal mine risks, and the prediction results are shown in Figure 6, Figure 7 and Figure 8.
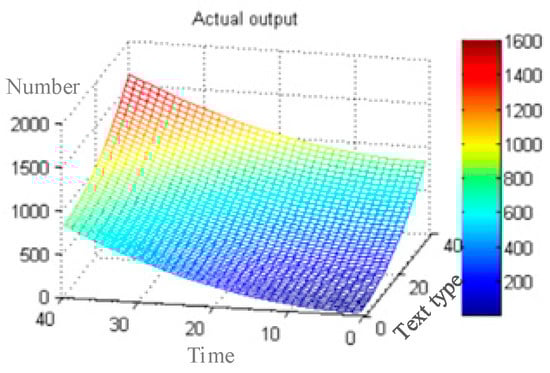
Figure 6.
Actual data.
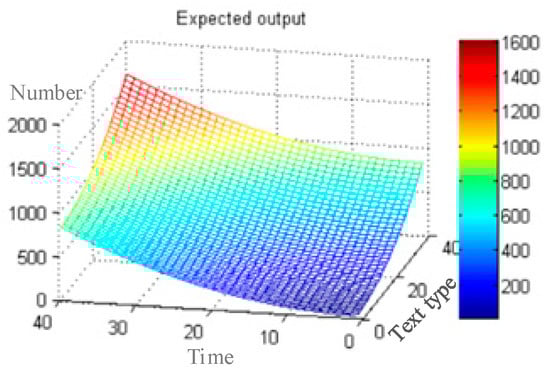
Figure 7.
Predicted data.
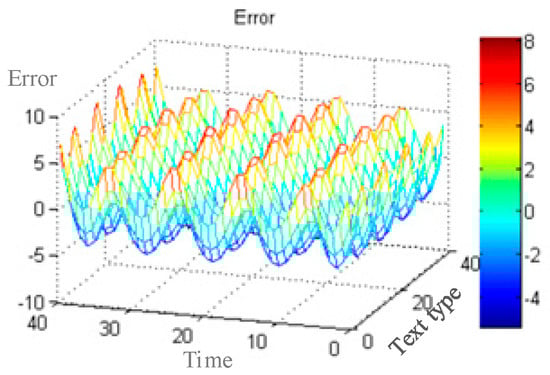
Figure 8.
Error of predicted data.
The optimized actual risk data is shown in Figure 6. Compared with the predicted data (Figure 7), the changing trend was consistent, indicating that the optimized ANFIS did not affect the change trend of the predicted risk. In order to demonstrate the convergence effect of the optimized ANFIS, the error was calculated, as shown in Figure 8. From Figure 8, the errors were all within 10 and were reduced by about 16%, indicating that adjusting the learning rate improved the ANFIS convergence effect and reduced the errors.
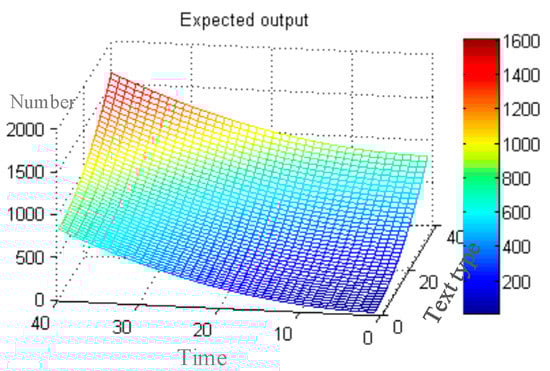
Figure 9.
Predicted data secondary optimization.
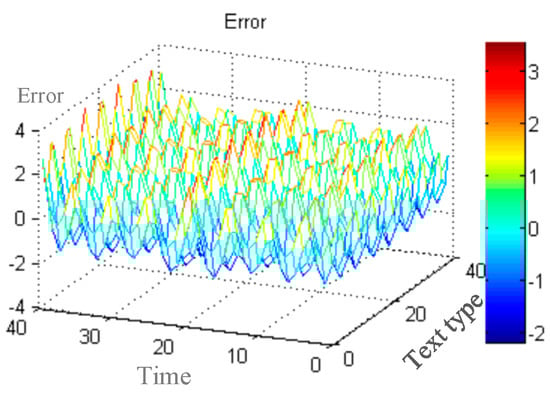
Figure 10.
Error secondary optimization.
The changing trend of the risk prediction data was the same as that of actual data, indicating that the secondary optimization of ANFIS did not affect the changing trend of the coal mine risk prediction. From Figure 10, the error was within 4, which was 66% lower than the original error and 60% lower than the first optimization. The analysis of the results of the two optimizations shows that the optimized ANFIS has good function approximation characteristics, fast convergence speed, and high precision, and can automatically form fuzzy reasoning rules and adjust learning parameters.
3.3. Early Warning Results
In this paper, the CL, UCL, and LCL of the control chart can be drawn in days with reference to the number of hidden dangers and three-violations of coal mines within the first three years of the prediction time point.
Three-violations refer to three types of violations made by coal mine workers, i.e., illegal command, illegal operation, and violation of labor discipline. The training samples and predicted values were the changing trends of the number of three-violations, as shown in Figure 11. The more three-violations, the higher the coal mine’s risk. From Figure 11, although three-violations exist, the number was within the UCL, indicating that the risk level of the coal mines in this period was within an acceptable range. In recent years, coal mine safety management achieved good results with no major risks or accidents, thus the coal mine safety is under control. In this paper, the statistical range of data was expanded to further explain the runaway phenomenon of control charts.
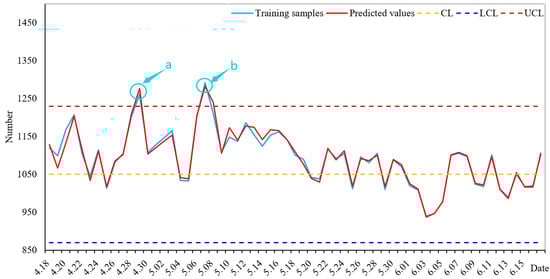
Figure 11.
Control chart analysis (Point a and point b are data exceeding the upper limit of control).
In Figure 11, the abscissa is the date, and the ordinate is the risk quantity. The forecast data for 18 April 2021 and 18 June 2021 are the forecast violation data. Figure 11 shows both the actual number of three-violations and the predicted data. The three dashed lines show the UCL, Cl, and LCL of the control diagram. The predicted data from 17 April to 18 May showed that the risk data exceeded the UCL twice. In fact, the number of risks on 29 April (point a in the figure) and 7 May (point b in the figure) were abnormal, exceeding the upper limit of the control chart. This indicates that accidents may have occurred in coal mining enterprises. However, the coal mining enterprises have strengthened their safety supervision, found and solved the hidden dangers in time, and restored normal safety production. The three-violations were within the controllable range from 18 May to 18 June and the behavior safety of the coal mine was in a normal state. Through comparative analysis, it was found that the non-optimized control chart was misreported seven times during this period, while the optimized control chart was misreported three times. The error of the optimized control chart was reduced by about 57%.
4. The Software Platform of the Model
4.1. Overall System Design
The entire coal mine risk management and control process requires the transmission and processing of large amounts of information, and is time-sensitive. Based on coal mine risk management and control technology, the development of a coal mine risk management and control data mining platform can take full advantage of data analysis to carry out coal mine risk management and early warning work in a flexible, convenient and real-time manner.
According to the implementation process and demand analysis of coal mine risk control technology, this paper divides the platform into modules for data collection, data analysis, integrity management, and safety training, with the specific functional structure shown in Figure 12.
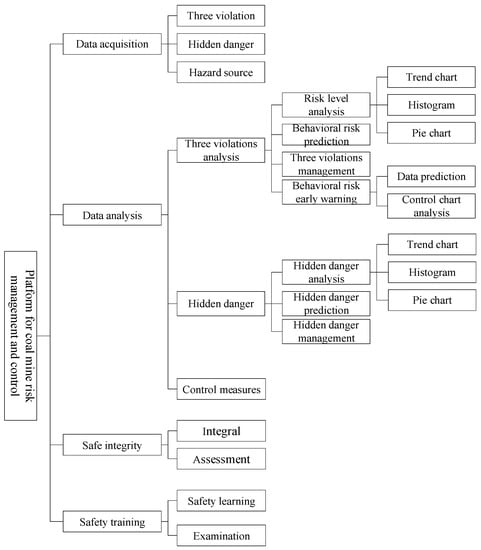
Figure 12.
Functional block diagram of the platform.
4.2. Design Implementation of the System
The data mining platform for coal mine risk control was fully functional, and this section focuses on the data analysis module related to risk prediction and early warning.
- (1)
- Database design
The system platform used MySQL as the database, which was a high-performance and relatively simple database system that was less complex to set up and manage than some larger systems. MySQL can be accessed interactively using several interfaces for entering queries and viewing the results: a command-line client program, a Web browser, or an X Window System client program. The software platform used interfaces such as “Select”, “Update”, “Insert” and “Delete” to access the MySQL database, operation commands to save and retrieve risk data.
The coal mine risk control data mining platform based on hierarchical model was designed and developed to better analyze and apply the coal mine risk early warning technology, and a coal mine risk control database was built using MySQL. Relevant codes are shown in Appendix B.
- (2)
- System design
The homepage of the system shows an overview of the system’s functional modules, including data collection, data analysis, integrity management, safety training, and other modules. As shown in Figure 12, the left side of the homepage shows the shortcut entrance of all functions, and the middle part shows the results of data analysis in the form of a histogram, pie chart, and line graph.
The data analysis module of the control chart was based on the risk prediction model to predict the risk change trend of different levels. It read the corresponding data from the database and calculated the LCL, UCL, and CL according to the requirements of the control chart analysis. The data prediction interface is shown in Figure 13.
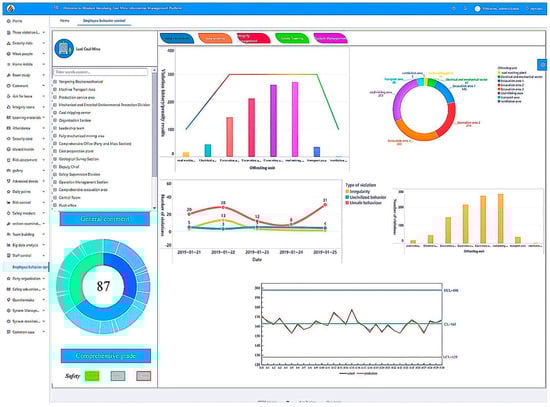
Figure 13.
Coal mine risk management platform.
5. Discussion
5.1. Comparative Analysis of Prediction Models
BP and GA-BP are commonly used in data prediction. This paper compared and analyzed the error in 12 months of risk prediction using different prediction models (BP, GA-BP, ANFIS, primarily optimized ANFIS, and secondarily optimized ANFIS) to verify the effectiveness of the proposed prediction model in this paper, as shown in Figure 14.
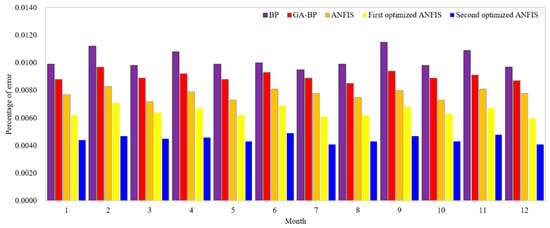
Figure 14.
Comparative analysis of prediction error rate.
The analysis results showed that based on data mining, the twice-optimized ANFIS provides very accurate and reliable results and minimize the error rate in a short time when using a large amount of complex data.
5.2. Comparative Analysis of Early Warning
This paper compared and analyzed the error rate of the control chart and the optimized control chart to discuss the advantages and disadvantages of the optimized control chart for early warning, as shown in Figure 15.
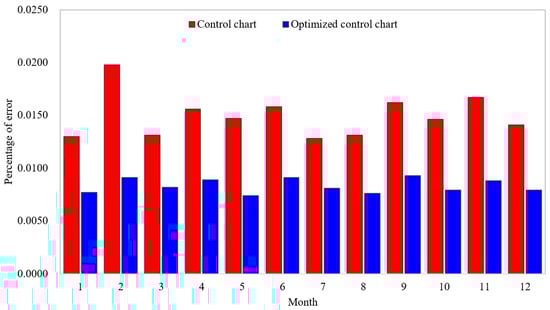
Figure 15.
Comparative analysis of error rate of control chart.
The results of the comparative analysis showed that the optimized control chart can dynamically calculate the UCL of the control chart, reduce the early warning error, realize the prevention, early warning, pre-control coal mine accidents, and improve coal mine safety production management.
5.3. Application Effect of Software Platform
After the design, programming implementation and software testing the coal mine risk management and control data analysis platform was developed and applied in the Luxi Coal Mine. The platform monitored the risk data (employees’ violations) and provided prediction and early warning results back to safety supervisors. The data and analysis results could provide a management basis and a decision-making tool for safety supervisors. According to the prediction results, safety supervisors could track the progression of the violators’ rectification, thus improving the safety awareness of employees and promoting a reduction in the number of violations.
Figure 16 shows a significant reduction in the number of risks after using the software platform (2019 and 2020) compared with before its use (2017 and 2018). A closer look shows that the number of risks decreased year by year after applying the software platform compared to the same period before its implementation.
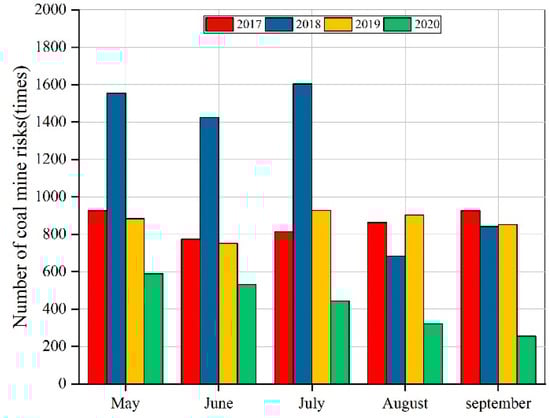
Figure 16.
Comparative analysis of the number of risks.
Using this software platform, the employees of Luxi Coal Mine were able to receive risk warning alert information in time to rectify the situation and prevent accidents, which improved their safety awareness and effectively reduced the accident rate.
5.4. Limitations of the Study
In this paper, an early warning system for coal mine risks was proposed. The system could not only analyze the association rules of coal mine risks but also predict the number of risk occurrences. Although the ANFIS architecture model improved the efficiency and reliability of the proposed system and reduced false alarms, the current prediction data was mainly based on the data recorded by the information system. Further improvements can be made by future research on the sophisticated and lightweight sensors to provide more accurate signals, and could even predict the location of potential hazards.
6. Conclusions
This paper combined the optimized ANFIS with the control chart to predict the number of risks and improve the coal mine risk management and control technology. The coal mine risk control data analysis platform was developed and successfully applied in the Luxi Coal Mine. The main conclusions are as follows.
- (1)
- According to the characteristics of coal mine risk information, useful risk data were extracted from a large amount of text information to provide raw data for prediction and early warning models.
- (2)
- By optimizing the ANFIS twice in succession, the coal mine risk prediction model was constructed. The results of the comparative analysis showed that the optimized model can effectively reduce the error of coal mine risk prediction. Combined with this model, a coal mine risk early warning model based on the control chart was proposed.
- (3)
- The coal mine risk control data analysis platform was developed based on the coal mine risk control technology and applied to the Luxi Coal Mine, and achieved good results.
Overall, the coal mine risk control technology and platform studied in this paper provides a scientific, effective, standardized, and convenient way for coal mine risk control, greatly improving the efficiency and quality of coal mine safety production.
Author Contributions
Conceptualization, K.Y.; data curation, D.M.; methodology, L.Z.; validation, P.L.; formal analysis, P.L.; investigation, K.Y.; resources, J.C.; data curation, K.Y.; writing—original draft preparation, K.Y.; writing—review and editing, D.M. and P.L.; supervision, J.W. and D.M.; project administration, L.Z. and J.W.; funding acquisition, K.Y. All authors have read and agreed to the published version of the manuscript.
Funding
This research was funded by the Shandong Provincial Natural Science Foundation, China, grant number ZR2020QE137, National Natural Science Foundation of China, grant number 52204224 and Humanities and Social Sciences Research Project of the Ministry of Education of China, grant number 22YJC840038.
Institutional Review Board Statement
The study was conducted according to the guidelines of the Declaration of Helsinki, and the study was approved by the Shandong Provincial Natural Science Foundation (ZR2020QE137).
Informed Consent Statement
Informed consent was obtained from all subjects involved in the study.
Data Availability Statement
The data presented in this study are available on request from the corresponding author.
Acknowledgments
The authors would like to thank the support of all the safety engineering teachers and students and the authors of the references.
Conflicts of Interest
The authors declare no conflict of interest.
Appendix A
Table A1.
Raw data of hidden danger information in Luxi coal mine.
Table A1.
Raw data of hidden danger information in Luxi coal mine.
| Time | Unit | Shift | Place and Content |
|---|---|---|---|
| 2020.11.03 | Tunneling area 1 | Middle shift | The support at the working face has liquid leakage at many places, the working face is partially broken, and the scraper bolts at many places are loose. The bolts of the tail slip reducer are loose. The bolts at the oil discharge port of the shearer rocker arm are seriously worn. The chain wheels of scraper and transfer machine are seriously worn. Strengthen equipment management and carry out special rectification. |
| 2020.11.03 | Tunneling area 2 | Middle shift | The risk identification of the withdrawal measures for the installation of the auxiliary belt down the mountain is too simple, the support is inverted, the switch is turned over and the adhesion is not managed according to the major risk, various lifting appliances and wire ropes are not selected and calculated, and the equipment accessories are not marked with the detailed weight. |
| 2020.11.03 | Fully mechanized mining area | Middle shift | The anchor rod, anchor plate and plate of the backup support material for the auxiliary belt down the mountain stockyard are not consistent with the real object, and the specification and model of the anchor agent are not filled in. |
| 2020.11.03 | Coal mining team | Middle shift | Temporary support materials are thrown at the head, and the back road is blocked. |
| 2020.11.03 | Electromechanical work area | Middle shift | The road cleat and belt rack pipe at the downhill of the auxiliary track shall be thrown at random. |
| 2020.11.03 | Electromechanical work area | Middle shift | The fixing screws of the sliding tail reducer of the working face are loose. |
| 2020.11.03 | Electromechanical work area | Middle shift | The coupling clearance of 3 # pump in −300 horizontal central pump house is small. |
| 2020.11.03 | Fully mechanized mining area | Morning shift | In the third mining area, there is a lot of gangue accumulated in the roadway after the belt goes down the hill, and the two sides are not high enough. |
Table A2.
Classification experiment results.
Table A2.
Classification experiment results.
| Index | Type Classification | |||||||
|---|---|---|---|---|---|---|---|---|
| Equipment Management | Site Management | Civilized production | Comprehensive Dust-Proof | Roof | Local Ventilation | Label Management | Belt Conveyor | |
| Accuracy rate | 0.92 | 0.96 | 0.9 | 0.96 | 0.97 | 0.94 | 0.87 | 0.98 |
| Recall rate | 0.89 | 0.91 | 0.86 | 0.91 | 0.95 | 0.88 | 0.96 | 0.91 |
| Overall accuracy rate | 0.92 | |||||||
Appendix B
Class.forName(“com.mysql.jdbc.Driver”);
Connection conn=DriverManager.getConnection(“jdbc:mysql://127.0.0.1:3306/mine?
useUnicode=true&characterEncoding=utf-8”, “root”, “root”);
Statement st=conn.createStatement();
#-------------------
ResultSet rs=st.executeQuery(“select * from t_s_user_view”);
#--------------------
def remove_punctuation(line):
line = str(line)
if line.strip()==‘‘:
return ‘‘
rule = re.compile(u”[^a-zA-Z0-9\u4E00-\u9FA5]”)
line = rule.sub(‘‘,line)
return line
#--------------------
def stopwordslist(filepath):
stopwords = [line.strip() for line in open(filepath, ‘r’, encoding=‘utf-8’).readlines()]
return stopwords
#--------------------
stopwords = stopwordslist(“./CNStopWords.txt”)
#--------------------
df[‘cut_content’] = df[‘clean_content’].apply(lambda x: “ ”.join([w for w in list(jb.cut(x)) if w not in stopwords]))
df.head()
MAX_NB_WORDS = 50000
MAX_SEQUENCE_LENGTH = 250
EMBEDDING_DIM = 100
#--------------------
jieba_list = []
jieba.load_userdict(‘./data/dict4in1.txt’)
from wordcloud import WordCloud
import matplotlib
import matplotlib.pyplot as plt
matplotlib.rcParams[‘figure.figsize’] = (10.0, 5.0)
References
- Agioutantis, Z.; Luxbacher, K.; Karmis, M.; Schafrik, S. Development of an atmospheric data-management system for underground coal mines. J. S. Afr. Inst. Min. Metall. 2014, 114, 1059–1063. [Google Scholar]
- Amin, M.T.; Khan, F.; Imtiaz, S. Dynamic availability assessment of safety critical systems using a dynamic Bayesian network. Reliab. Eng. Syst. Saf. 2018, 178, 108–117. [Google Scholar] [CrossRef]
- Benson, C.; Argyropoulos, C.D.; Dimopoulos, C.; Mikellidou, C.V.; Boustras, G. Safety and risk analysis in digitalized process operations warning of possible deviating conditions in the process environment. Process Saf. Environ. Prot. 2021, 149, 750–757. [Google Scholar] [CrossRef]
- Brodny, J.; Tutak, M. Applying computational fluid dynamics in research on ventilation safety during underground hard coal mining: A systematic literature review. Process Saf. Environ. Prot. 2021, 151, 373–400. [Google Scholar] [CrossRef]
- Burgherr, P.; Eckle, P.; Hirschberg, S. Comparative assessment of severe accident risks in the coal, oil and natural gas chains. Reliab. Eng. Syst. Saf. 2012, 105, 97–103. [Google Scholar] [CrossRef]
- Chang, Y.J.; Khan, F.; Ahmed, S. A risk-based approach to design warning system for processing facilities. Process Saf. Environ. Prot. 2011, 89, 310–316. [Google Scholar] [CrossRef]
- Cheng, L.H.; Guo, H.M.; Lin, H.F. Evolutionary model of coal mine safety system based on multi-agent modeling. Process Saf. Environ. Prot. 2021, 147, 1193–1200. [Google Scholar] [CrossRef]
- Cremen, G.; Bozzoni, F.; Pistorio, S.; Galasso, C. Developing a risk-informed decision-support system for earthquake early warning at a critical seaport. Reliab. Eng. Syst. Saf. 2022, 218, 108035. [Google Scholar] [CrossRef]
- Cui, C.Q.; Wang, B.; Zhao, Y.X.; Zhang, Y.J.; Xue, L.M. Risk management for mine closure: A cloud model and hybrid semi-quantitative decision method. Int. J. Miner. Metall. Mater. 2020, 27, 1021–1035. [Google Scholar] [CrossRef]
- Cui, L.; Shu, Y.D.; Wang, Z.H.; Zhao, J.S.; Qiu, T.; Sun, W.Y.; Wei, Z.Q. HASILT: An intelligent software platform for HAZOP, LOPA, SRS and SIL verification. Reliab. Eng. Syst. Saf. 2012, 108, 56–64. [Google Scholar] [CrossRef]
- Dey, P.; Chaulya, S.K.; Kumar, S. Hybrid CNN-LSTM and IoT-based coal mine hazards monitoring and prediction system. Process Saf. Environ. Prot. 2021, 152, 249–263. [Google Scholar] [CrossRef]
- Du, J.S.; Chen, J.; Pu, Y.Y.; Jiang, D.Y.; Chen, L.L.; Zhang, Y.R. Risk assessment of dynamic disasters in deep coal mines based on multi-source, multi-parameter indexes, and engineering application. Process Saf. Environ. Prot. 2021, 155, 575–586. [Google Scholar] [CrossRef]
- Guo, H.M.; Cheng, L.H.; Li, S.G.; Lin, H.F. Regional risk assessment methods in relation to urban public safety. Process Saf. Environ. Prot. 2020, 143, 361–366. [Google Scholar]
- Hassler, M.L.; Andrews, D.J.; Ezell, B.C.; Polmateer, T.L.; Lambert, J.H. Multi-perspective scenario-based preferences in enterprise risk analysis of public safety wireless broadband network. Reliab. Eng. Syst. Saf. 2020, 197, 106775. [Google Scholar] [CrossRef]
- Hu, J.Q.; Chen, C.G.; Liu, Z.Y. Early warning method for overseas natural gas pipeline accidents based on FDOOBN under severe environmental conditions. Process Saf. Environ. Prot. 2022, 157, 175–192. [Google Scholar] [CrossRef]
- Huang, B.N.; Wei, J.K.; Tang, Y.H.; Liu, C. Enterprise Risk Assessment Based on Machine Learning. Comput. Intell. Neurosci. 2021, 2021, 6049195. [Google Scholar] [CrossRef]
- Huang, Y.X.; Fan, J.D.; Yan, Z.G.; Li, S.G.; Wang, Y.P. Research on Early Warning for Gas Risks at a Working Face Based on Association Rule Mining. Energies 2021, 14, 6889. [Google Scholar] [CrossRef]
- Iphar, M.; Cukurluoz, A.K. Fuzzy risk assessment for mechanized underground coal mines in Turkey. Int. J. Occup. Saf. Ergon. 2020, 26, 256–271. [Google Scholar] [CrossRef]
- Ivaz, J.; Stojadinovic, S.; Petrovic, D.; Stojkovic, P. Analysis of fatal injuries in Serbian underground coal mines-50 years review. Int. J. Inj. Control Saf. Promot. 2020, 27, 362–377. [Google Scholar] [CrossRef]
- Jia, X.H.; Zhang, D.H. Prediction of maritime logistics service risks applying soft set based association rule: An early warning model. Reliab. Eng. Syst. Saf. 2021, 207, 107339. [Google Scholar] [CrossRef]
- Jing, S.F.; Liu, X.W.; Gong, X.Y.; Tang, Y.; Xiong, G.; Liu, S.; Xiang, S.G.; Bi, R.S. Correlation analysis and text classification of chemical accident cases based on word embedding. Process Saf. Environ. Prot. 2022, 158, 698–710. [Google Scholar] [CrossRef]
- Jiskani, I.M.; Han, S.; Rehman, A.U.; Shahani, N.M.; Tariq, M.; Brohi, M.A. An Integrated Entropy Weight and Grey Clustering Method-Based Evaluation to Improve Safety in Mines. Min. Metall. Explor. 2021, 38, 1773–1787. [Google Scholar] [CrossRef]
- Jiskani, I.M.; Yasli, F.; Hosseini, S.; Rehman, A.U.; Uddin, S. Improved Z-number based fuzzy fault tree approach to analyze health and safety risks in surface mines. Resour. Policy 2022, 76, 102591. [Google Scholar] [CrossRef]
- Jo, B.W.; Khan, R.M.A. An Event Reporting and Early-Warning Safety System Based on the Internet of Things for Underground Coal Mines: A Case Study. Appl. Sci. 2017, 7, 925. [Google Scholar] [CrossRef]
- Kirin, S.; Sedmak, A.; Li, W.; Brzakovic, M.; Miljanovic, I.; Petrovic, A.; Sedmak, S. Human factor risk management procedures applied in the case of open pit mine. Eng. Fail. Anal. 2021, 126, 105456. [Google Scholar] [CrossRef]
- Klimecka-Tatar, D. Safety Management in Quality Management Approach—The Context of Safe Working Conditions in Micro-, Small and Medium-Sized and Large Enterprises. In Education Excellence and Innovation Management: A 2025 Vision To Sustain Economic Development during Global Challenges; International Business Information Management Association: Sewilla, Spain, 2020; pp. 5181–5193. [Google Scholar]
- Kumar, P.; Gupta, S.; Gunda, Y.R. Estimation of human error rate in underground coal mines through retrospective analysis of mining accident reports and some error reduction strategies. Saf. Sci. 2020, 123, 104555. [Google Scholar] [CrossRef]
- Li, B.; Wang, E.Y.; Shang, Z.; Liu, X.F.; Li, Z.H.; Li, B.L.; Wang, H.; Niu, Y.; Song, Y. Optimize the early warning time of coal and gas outburst by multi-source information fusion method during the tunneling process. Process Saf. Environ. Prot. 2021, 149, 839–849. [Google Scholar] [CrossRef]
- Liu, Q.L.; Dou, F.F.; Meng, X.F. Building risk precontrol management systems for safety in China’s underground coal mines. Resour. Policy 2021, 74, 101631. [Google Scholar] [CrossRef]
- Mamudu, A.; Khan, F.; Zendehboudi, S.; Adedigba, S. Dynamic risk modeling of complex hydrocarbon production systems. Process Saf. Environ. Prot. 2021, 151, 71–84. [Google Scholar] [CrossRef]
- Mei, Q.; Wang, Q.W.; Liu, S.X.; Zhou, Q.M.; Zhang, J.J. Effects of organizational safety on employees’ proactivity safety behaviors and occupational health and safety management systems in Chinese high-risk small-scale enterprises. Int. J. Occup. Saf. Ergon. 2020, 26, 101–111. [Google Scholar] [CrossRef]
- Meng, H.X.; Liu, X.; Xing, J.D.; Zio, E. A method for economic evaluation of predictive maintenance technologies by integrating system dynamics and evolutionary game modelling. Reliab. Eng. Syst. Saf. 2022, 222, 108424. [Google Scholar] [CrossRef]
- Meng, F.Q. Safety Warning Model of Coal Face Based on FCM Fuzzy Clustering and GA-BP Neural Network. Symmetry 2021, 13, 1082. [Google Scholar] [CrossRef]
- Miao, C.L.; Duan, M.M.; Sun, X.X.; Wu, X.Y. Safety management efficiency of China’s coal enterprises and its influencing factors Based on the DEA-Tobit two-stage model. Process Saf. Environ. Prot. 2020, 140, 79–85. [Google Scholar] [CrossRef]
- Miao, D.J.; Yu, K.; Zhou, L.J.; Chen, Y.; Jin, W.Q.; Chen, H. Dynamic risks hierarchical management and control technology of coal chemical enterprises. J. Loss Prev. Process Ind. 2021, 71, 104466. [Google Scholar] [CrossRef]
- Mohammadnazar, H.; Pulkkinen, M.; Ghanbari, H. A root cause analysis method for preventing erratic behavior in software development: PEBA. Reliab. Eng. Syst. Saf. 2019, 191, 106565. [Google Scholar] [CrossRef]
- Paltrinieri, N.; Khan, F.; Amyotte, P.; Cozzani, V. Dynamic approach to risk management: Application to the Hoeganaes metal dust accidents. Process Saf. Environ. Prot. 2015, 92, 669–679. [Google Scholar] [CrossRef]
- Samitas, A.; Kampouris, E.; Kenourgios, D. Machine learning as an early warning system to predict financial crisis. Int. Rev. Financ. Anal. 2020, 71, 101507. [Google Scholar] [CrossRef]
- Silva, J.F.; Jacinto, C. Finding occupational accident patterns in the extractive industry using a systematic data mining approach. Reliab. Eng. Syst. Saf. 2012, 108, 108–122. [Google Scholar] [CrossRef]
- Sun, G.B. Quantitative analysis of enterprise chain risk based on SVM algorithm and mathematical fuzzy set. J. Intell. Fuzzy Syst. 2020, 39, 5773–5783. [Google Scholar] [CrossRef]
- Tang, Q.L.; Lei, M.F.; Zhu, B.B.; Peng, L.M.; Wu, W.M.; Shi, C.H. Design and Application of Risk Early Warning System for Subway Station Construction Based on Building Information Modeling Real-Time Model. Adv. Civ. Eng. 2021, 2021, 8898893. [Google Scholar] [CrossRef]
- Teng, Y.; Sun, Y.; Yang, H.H.; Guo, X.Y.; Chen, X.L. Research on the relationship between enterprise safety production management mode and employees’ safety behavior based on social cognition and behavior incentive theory. Int. J. Occup. Saf. Ergon. 2022, 2021, 2022957. [Google Scholar] [CrossRef] [PubMed]
- Tubis, A.; Werbinska-Wojciechowska, S.; Sliwinski, P.; Zimroz, R. Fuzzy Risk-Based Maintenance Strategy with Safety Considerations for the Mining Industry. Sensors 2022, 22, 441. [Google Scholar] [CrossRef] [PubMed]
- Wang, Q.Q.; Cheng, C.; Zhang, C.; Zhang, J.H.; Ning, K.Y. Fuel Gas Enterprise Accident Risk Assessment Based on BP Neural Network. In Man-Machine-Environment System Engineering (Mmese 2019); Lecture Notes in Electrical Engineering; Springer: Singapore, 2020; Volume 576, pp. 759–767. [Google Scholar]
- Wang, Y.; Huang, L.S.; Yang, W. A Novel Real-Time Coal Miner Localization and Tracking System Based on Self-Organized Sensor Networks. Eurasip J. Wirel. Commun. Netw. 2010, 2010, 142092. [Google Scholar] [CrossRef][Green Version]
- Wu, F.; Cheng, L.; Yu, Y.L.; Sun, J.J. Research on the index system of chemical enterprise safety risk state based on analytic hierarchy. In Proceedings of the 2021 5th International Conference on Advances in Energy, Environment and Chemical Science (AEECS 2021), Shanghai, China, 26–28 February 2021; Volume 245, p. 03082. [Google Scholar]
- Xie, X.C.; Fu, G.; Xue, Y.J.Y.; Zhao, Z.Q.; Chen, P.; Lu, B.J.; Jiang, S. Risk prediction and factors risk analysis based on IFOA-GRNN and apriori algorithms: Application of artificial intelligence in accident prevention. Process Saf. Environ. Prot. 2019, 122, 169–184. [Google Scholar] [CrossRef]
- Yan, X.; Deng, X.W.; Sun, S.H. Analysis and Simulation of the Early Warning Model for Human Resource Management Risk Based on the BP Neural Network. Complexity 2020, 2020, 8838468. [Google Scholar] [CrossRef]
- Yao, M.; Fang, Y.X.; Tang, W.L.; Zhou, J.J. Study on safety behavior planning theory and control strategies for coal chemical workers. Saf. Sci. 2020, 128, 104726. [Google Scholar]
- Zhang, J.Q.; Chen, X.B.; Sun, Q.B. An Assessment Model of Safety Production Management Based on Fuzzy Comprehensive Evaluation Method and Behavior-Based Safety. Math. Probl. Eng. 2019, 2019, 4137035. [Google Scholar] [CrossRef]
- Zhang, S.K.; Tao, S.; Ding, Z.G. Proactive Early warning on Sailing Risk of Real-time Ship Traffic in Waterway. In Proceedings of the 2019 6th International Conference on Information Science and Control Engineering (ICISCE 2019), Shanghai, China, 20–22 December 2019; pp. 1099–1102. [Google Scholar]
- Zhou, Y.F.; Xie, K.; Zhang, X.Y.; Wen, C.; He, J.B. Efficient Traffic Accident Warning Based on Unsupervised Prediction Framework. IEEE Access 2021, 9, 69100–69113. [Google Scholar] [CrossRef]
- Zhu, J.; Wang, X.; Yang, L.; Qin, Z.; Geng, J.; Zhang, X. Research on the Construction of a Comprehensive Evaluation Model of Psychological Factors in Coal Mine Workers’ Safety: Investigation and Analysis of 1,500 Miners in East China. Front. Public Health 2022, 10, 849733. [Google Scholar] [CrossRef]
- Tuyen, D.; Tuan, T.M.; Son, L.; Ngan, T.T.; Giang, N.L.; Thong, P.H.; Hieu, V.V.; Gerogiannis, V.C.; Tzimos, D.; Kanavos, A. A Novel Approach Combining Particle Swarm Optimization and Deep Learning for Flash Flood Detection from Satellite Images. Mathematics 2021, 9, 2846. [Google Scholar] [CrossRef]
- Xiong, Y.; Kong, D.Z.; Cheng, Z.B.; Wu, G.Y.; Zhang, Q. The Comprehensive Identification of Roof Risk in a Fully Mechanized Working Face Using the Cloud Model. Mathematics 2021, 9, 2072. [Google Scholar] [CrossRef]
- Deitel, P.; Deitel, H. Python for Programmers; Prentice Hall: Hoboken, NJ, USA, 2019. [Google Scholar]


Publisher’s Note: MDPI stays neutral with regard to jurisdictional claims in published maps and institutional affiliations. |
© 2022 by the authors. Licensee MDPI, Basel, Switzerland. This article is an open access article distributed under the terms and conditions of the Creative Commons Attribution (CC BY) license (https://creativecommons.org/licenses/by/4.0/).