

Mathematical Modeling of the Reliability of Polymer Composite Materials

 ,
,  , and
, and
Abstract
1. Introduction
- Structural models are the models based on the logical interaction schemes of the elements included in the system from the point of view of maintaining the operability of the system as a whole [6]. At the same time, statistical information about the reliability of the elements is used without involving information about the physical properties of the material, parts and connections, external loads and influences, and the mechanisms of interaction between the elements. Structural models are presented in the form of block diagrams and graphs (for example, fault trees and event trees). And the initial information is presented in the form of the known probability values of the failure-free operation of the elements, failure rates, etc.
- Mathematical models of the reliability theory are the models taking into account mechanical, physical, and other real processes that entail a change in the object properties and object components. These are the models of mechanics widely used in the calculations of machines and structures. Force and kinematic interactions of machine elements and structures are complex. The behavior of these objects essentially depends on their interaction with the environment, nature, and the intensity of the exploitation processes [7].
- Development of a methodological approach and methodology for predicting the reliability for solving the problem of predicting the reliability of materials for products made of polymer composite materials according to various criteria.
- Use of the probability theory to process the stochastic information of physical experiments: the information on the statistical variability of deformation–strength, elastic, dilatometric, and shrinkage characteristics.
- Development of a model for calculating reliability according to the strength criterion.
- Determination of the statistical characteristics of composite materials and the effective stress concentration factor of the materials.
- Determination of the mathematical dependence of the failure-free operation probability of the samples on their cross-sectional area.
- Construction of the dependence of the failure-free operation probability on the holding time at different pressures and temperatures of casting and molding the products from composite materials at different operating temperatures of the products.
- Experimental studies on the products made of polymer composite materials to improve the strength characteristics of the products and their reliability.
- Numerical modeling of the strength function of the materials and molded products depending on the cross-sectional area of the samples and the yield strength of thermoplastics based on polypropylene.
2. Materials and Methods
2.1. Selection of Research Materials
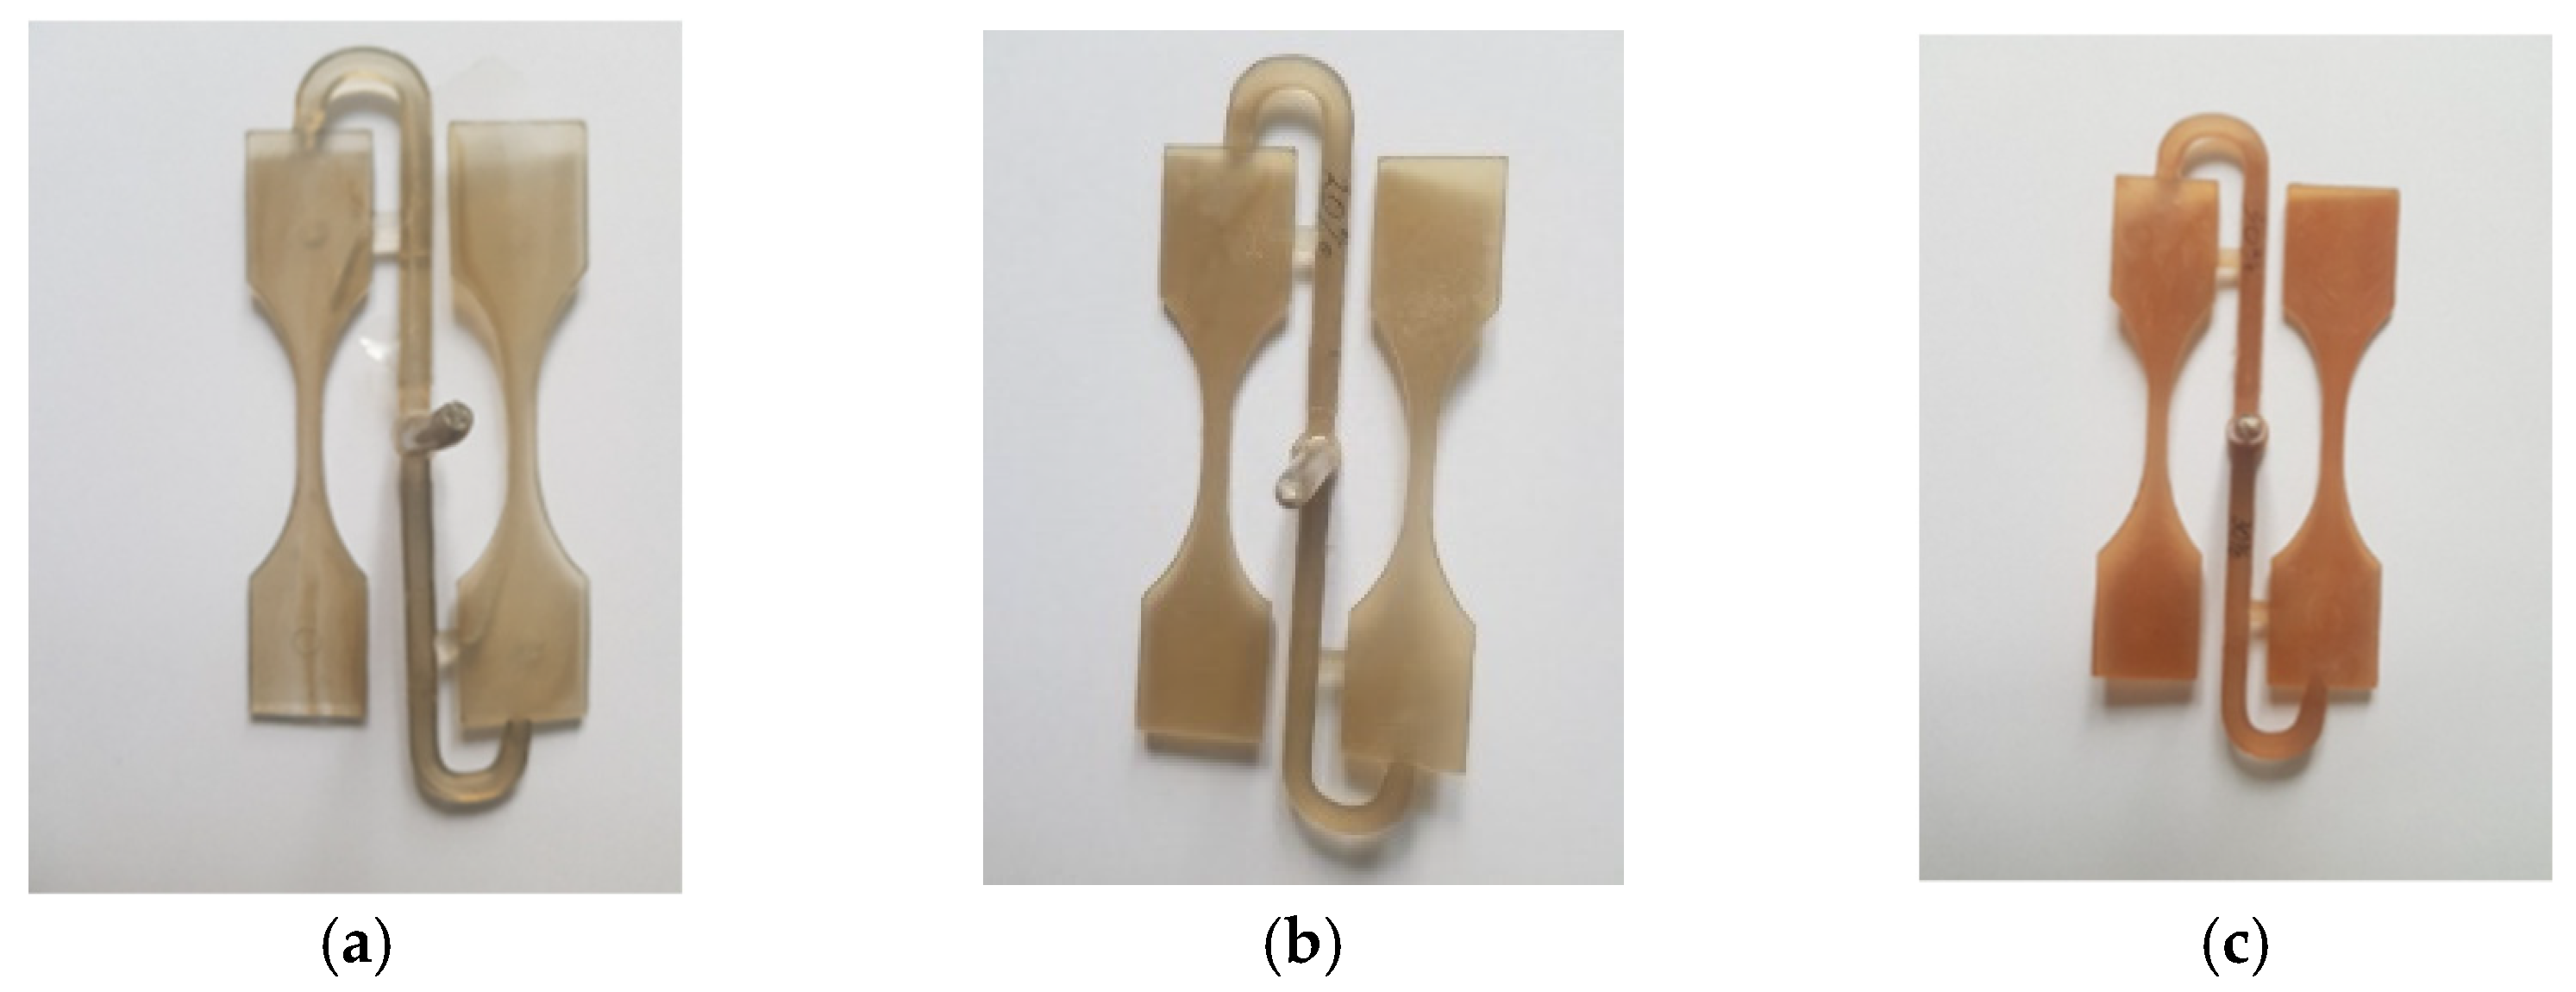
2.2. Mechanical Testing
2.3. Methods for Modeling and Calculating Deviations
- Mathematical expectation of the degradation of materials is as follows:where is the degradation time in the -th digit, h; is the number of sample breaks in the -th digit; is the number of digits.
- The dispersion scattering degradation of materials is:
- The material degradation standard deviation or scattering:
- The variation coefficient is:
- f(t) is the failure rate or the number of the samples that have failed by the time t per unit time;
- P(t) is the number of the samples that have not failed by the time t;
- n(t) is the number of the failed samples in the time interval from to ;
- Δt is the time interval;
- Nav is the average number of the properly working samples in the interval of ;
3. Results and Discussion
- Choosing the reliability level that is optimal in terms of economic expenditures for operation.
- Choosing the reliability level in terms of the inadmissibility of emergency situations associated with major man-made consequences and human injuries.
3.1. Study of Composite Material Properties with a Clearly Expressed Inhomogeneous Structure
- selection of a performance criterion based on the analysis of the product, its purpose, mode of operation, operating conditions, and type of expected failures;
- establishment of a set of mechanical and thermophysical characteristics of polymer composite materials based on the criterion of product performance;
- development of new methods and devices for determining mechanical and shrinkage characteristics, taking into account the characteristics of materials;
- development of probabilistic-statistical models for assessing the reliability of products made of polymer composite materials at the stages of design, production, and operation;
- study of the statistical variability of deformation-strength and shrinkage characteristics of the materials at the stages of the product life cycle;
- estimation of the relationships between the reliability and material characteristics included in the reliability model at the stages of design, production, and operation;
- possible reliability prediction, considering fully or partially the determining factors of the design, manufacture, and operation of the product.
3.2. Experimental Studies of Products Made of Polymer Composite Materials
4. Conclusions
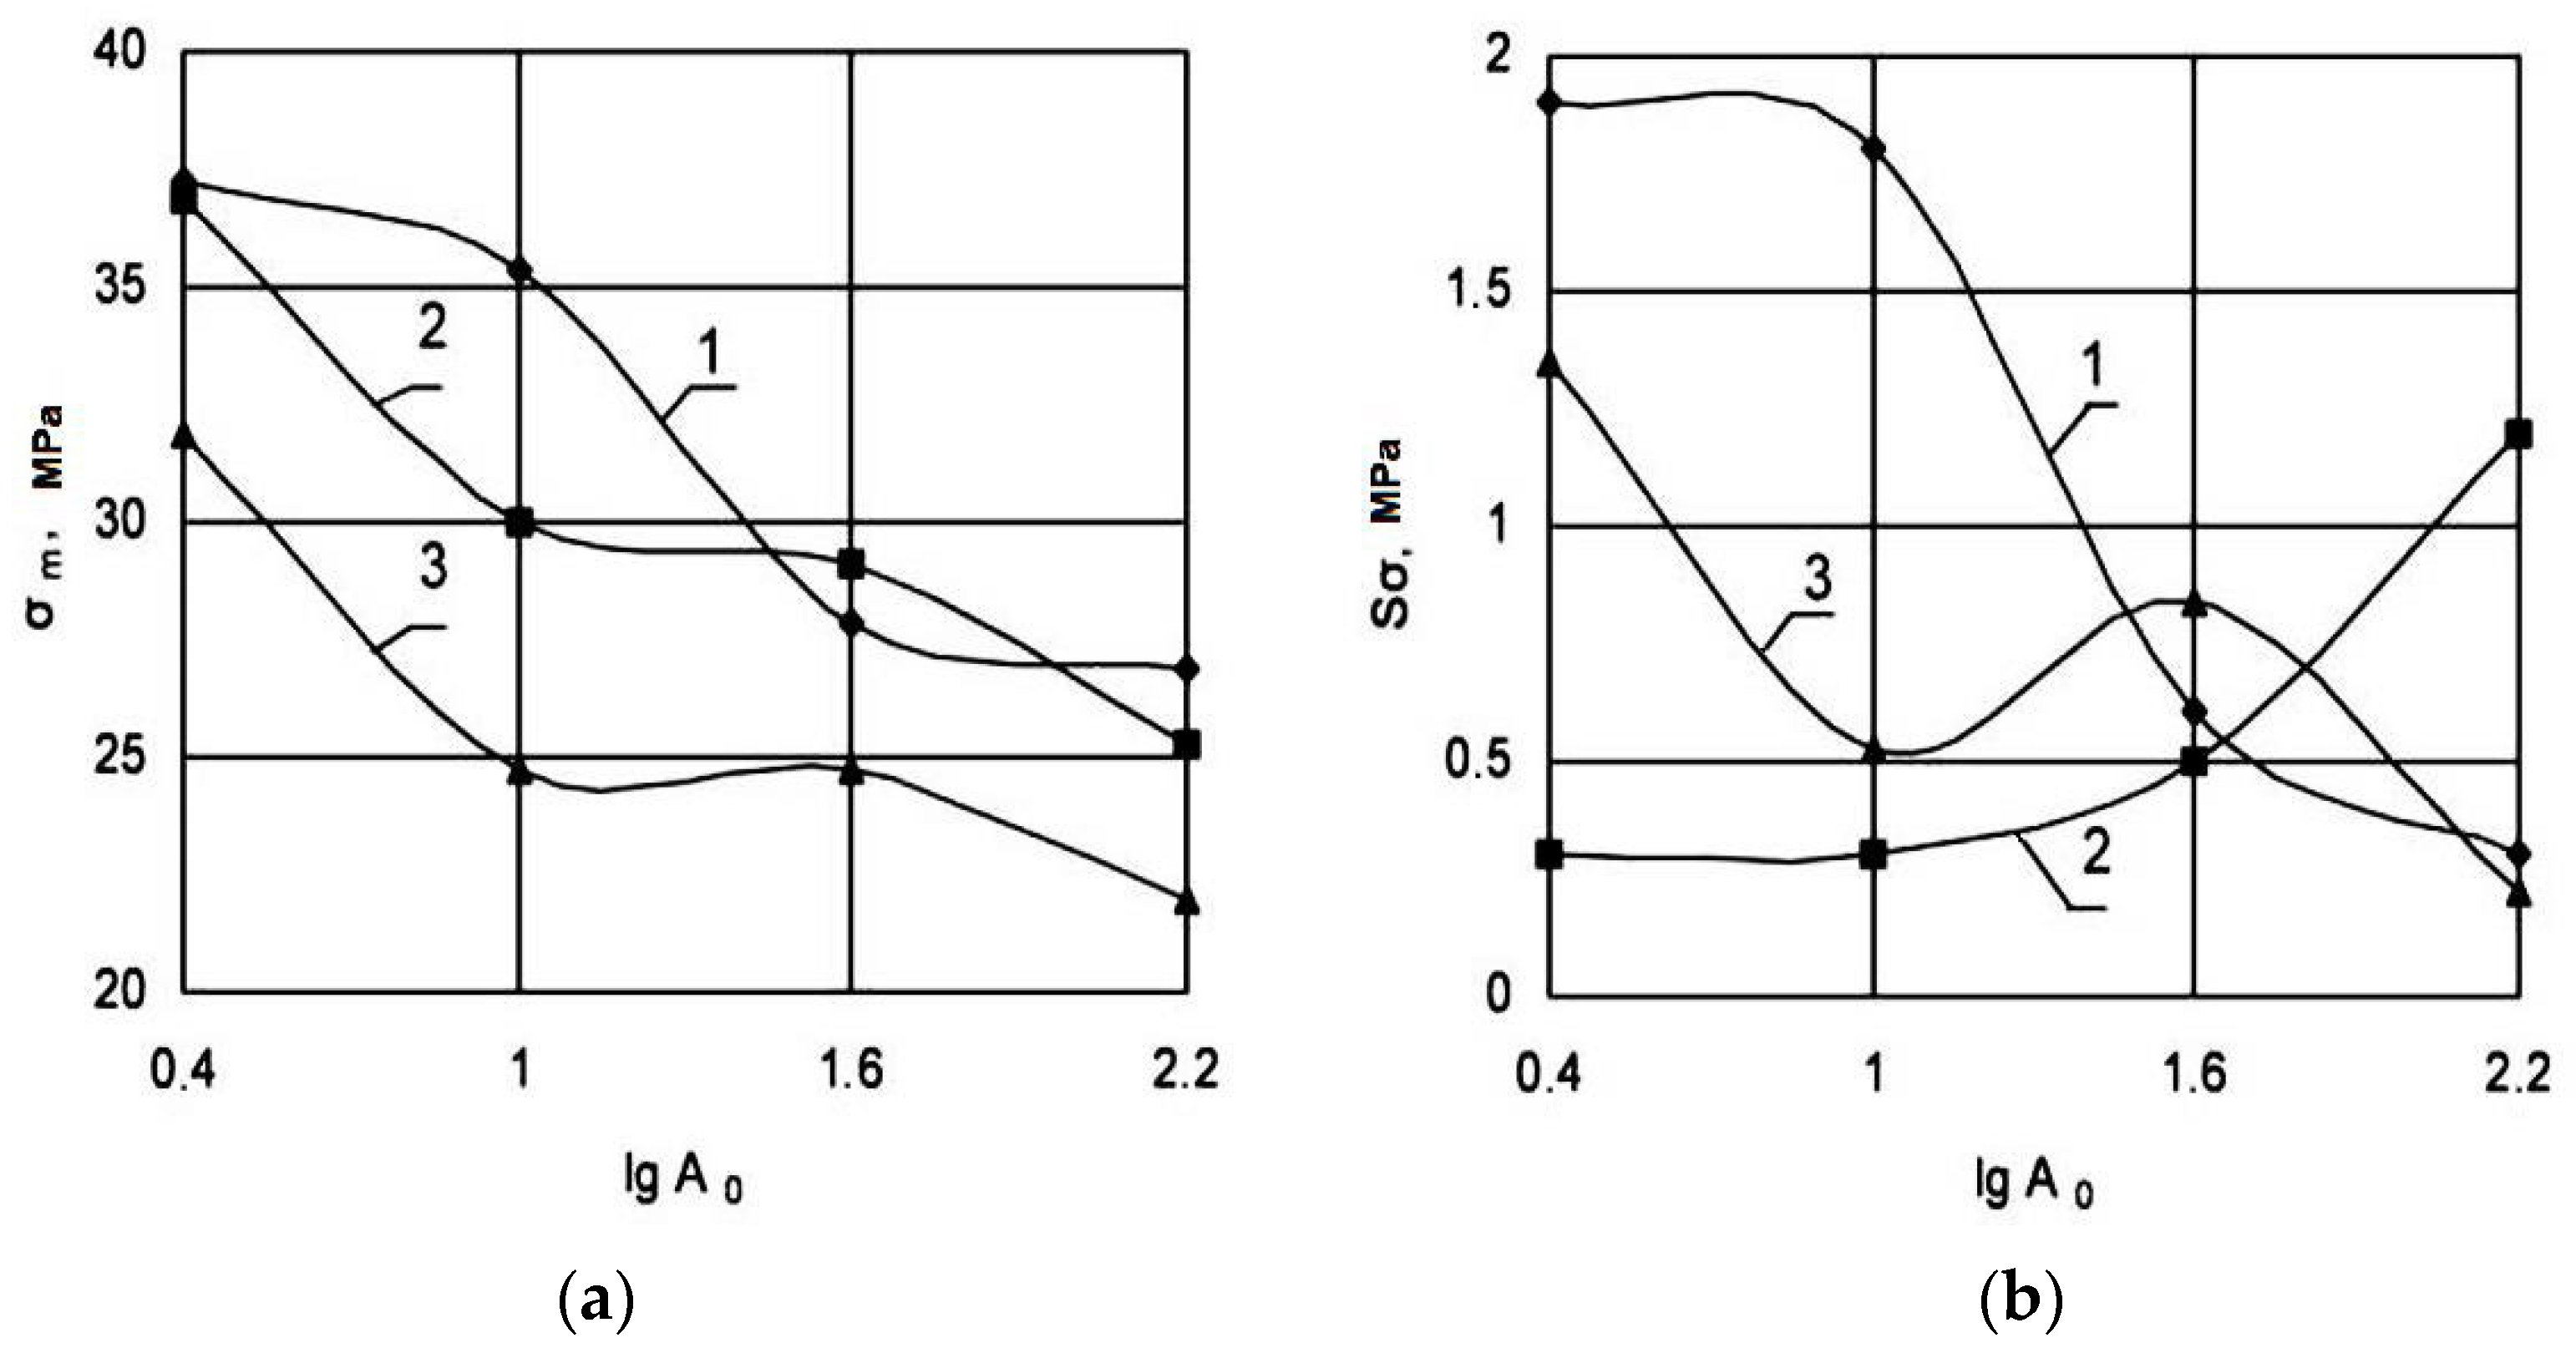
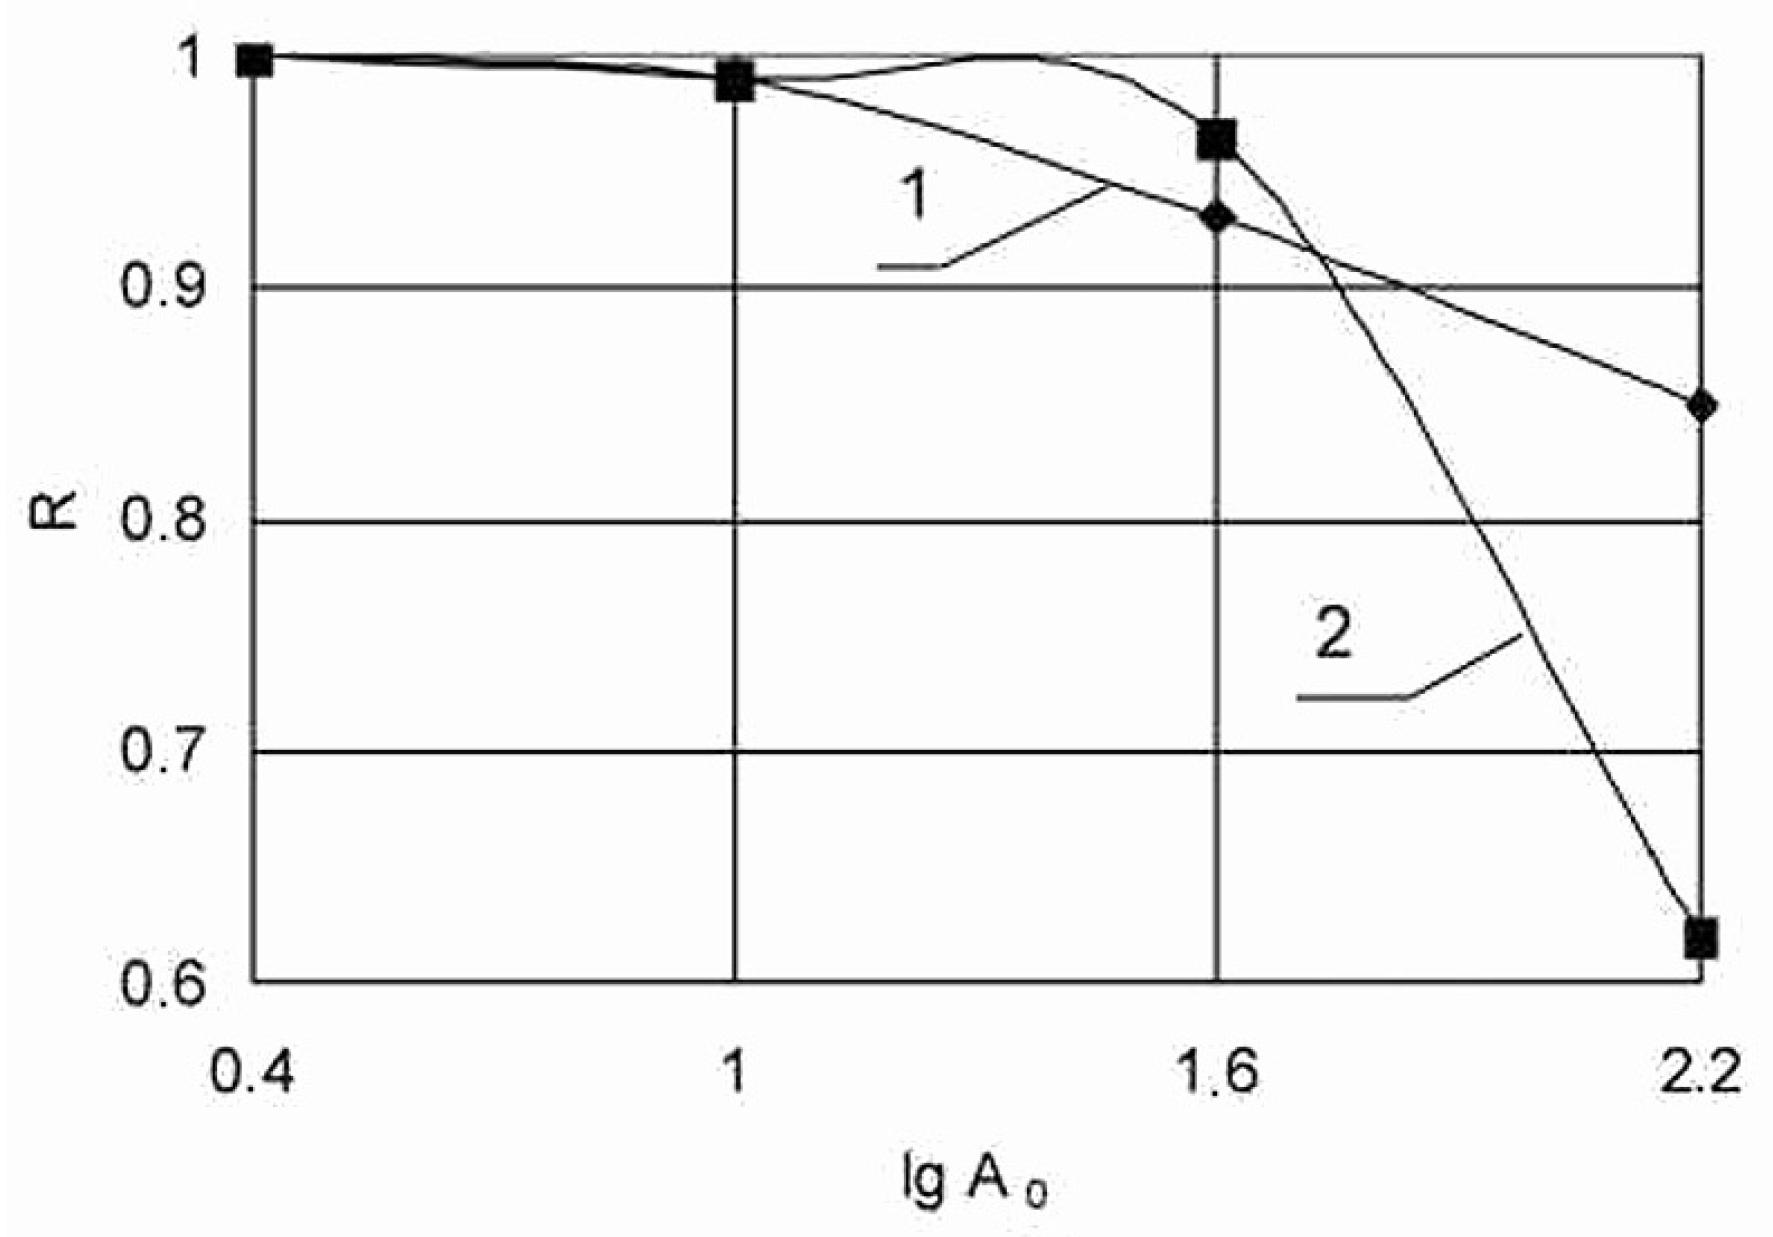
- Based on the probabilistic mathematical models, an increase in the cross-sectional area of the samples is shown to cause a decrease in the average value and a change in the standard deviation of the yield strength. At the same time, the failure-free operation probability of the studied thermoplastics decreases.
- Functional dependences of the influence of technological modes of processing thermoplastics by injection molding on the probability of their trouble-free operation are established and presented.
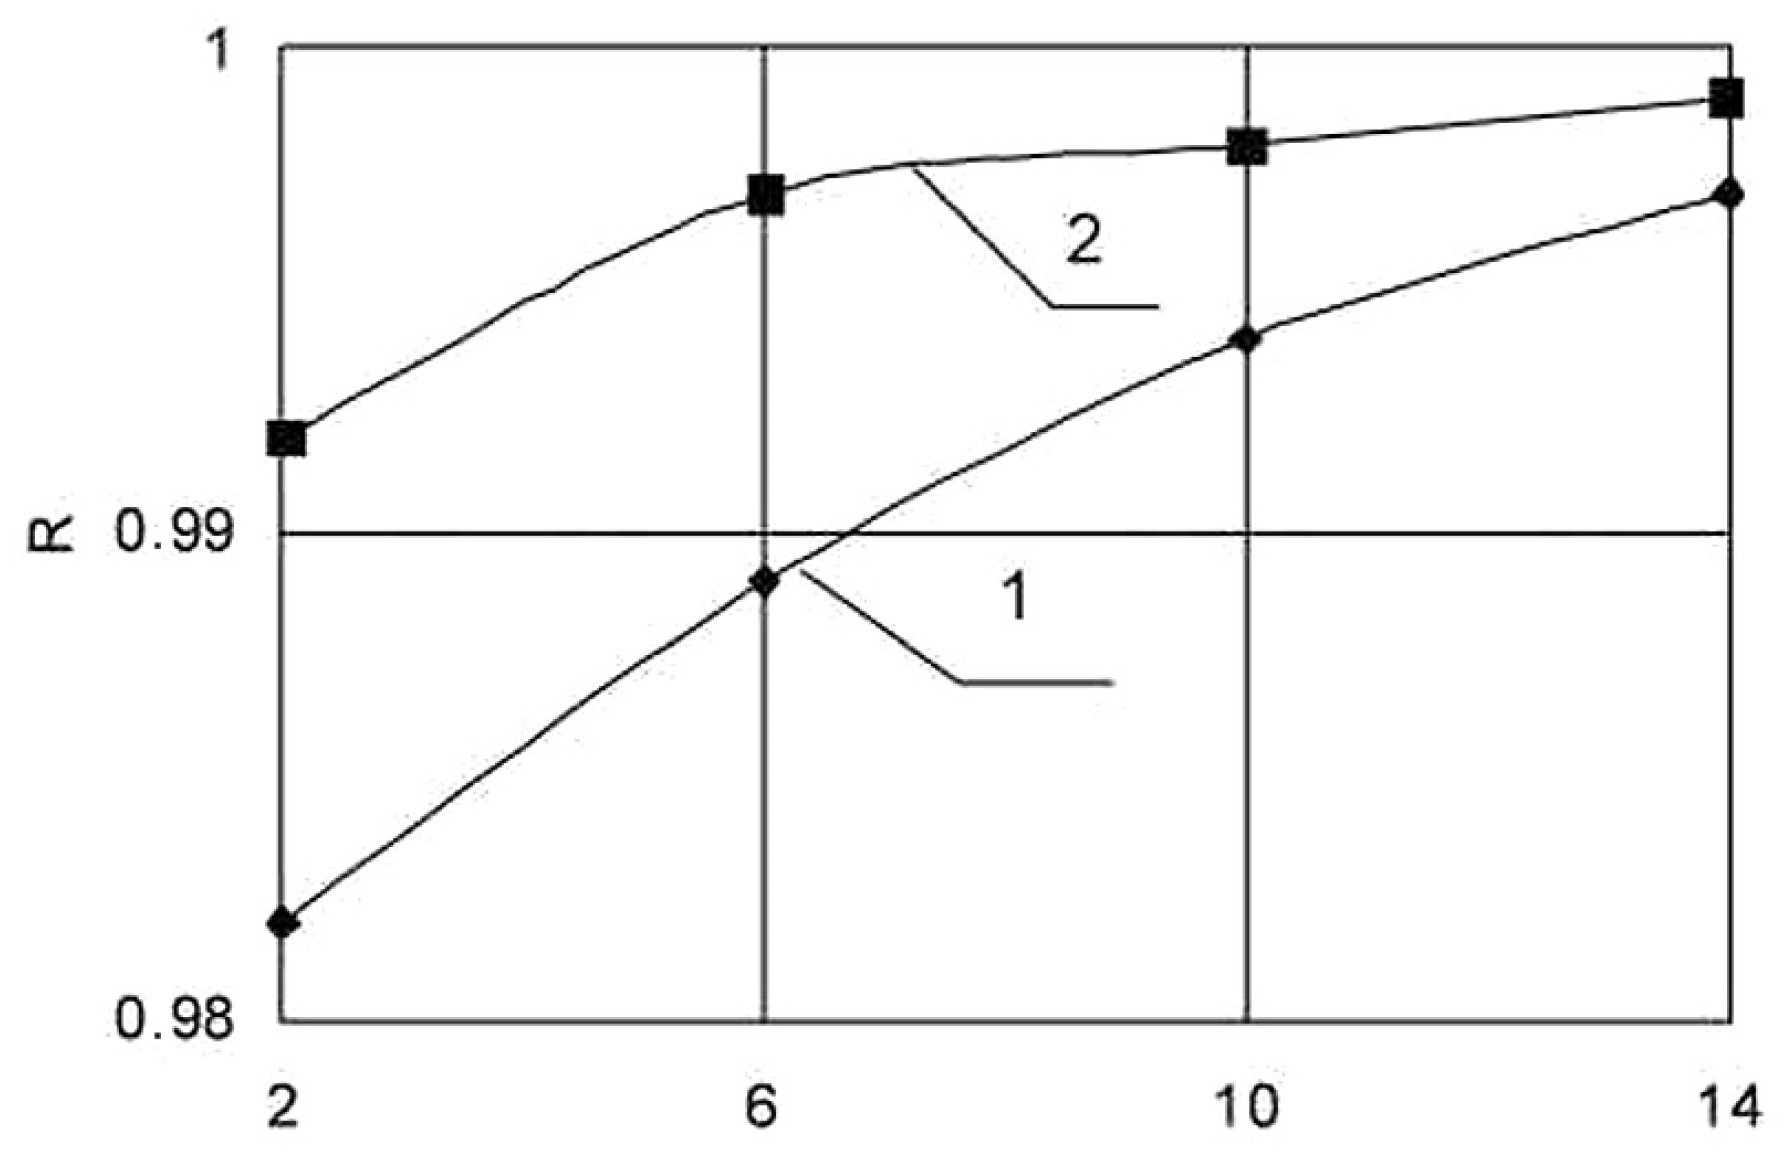
- Probabilistic modeling using the normal distribution law allows showing that with an increase in the thickness of the samples, the resistance of the material to aging and degradation increases, and the failure-free operation probability, as the main component of the material reliability, increases.
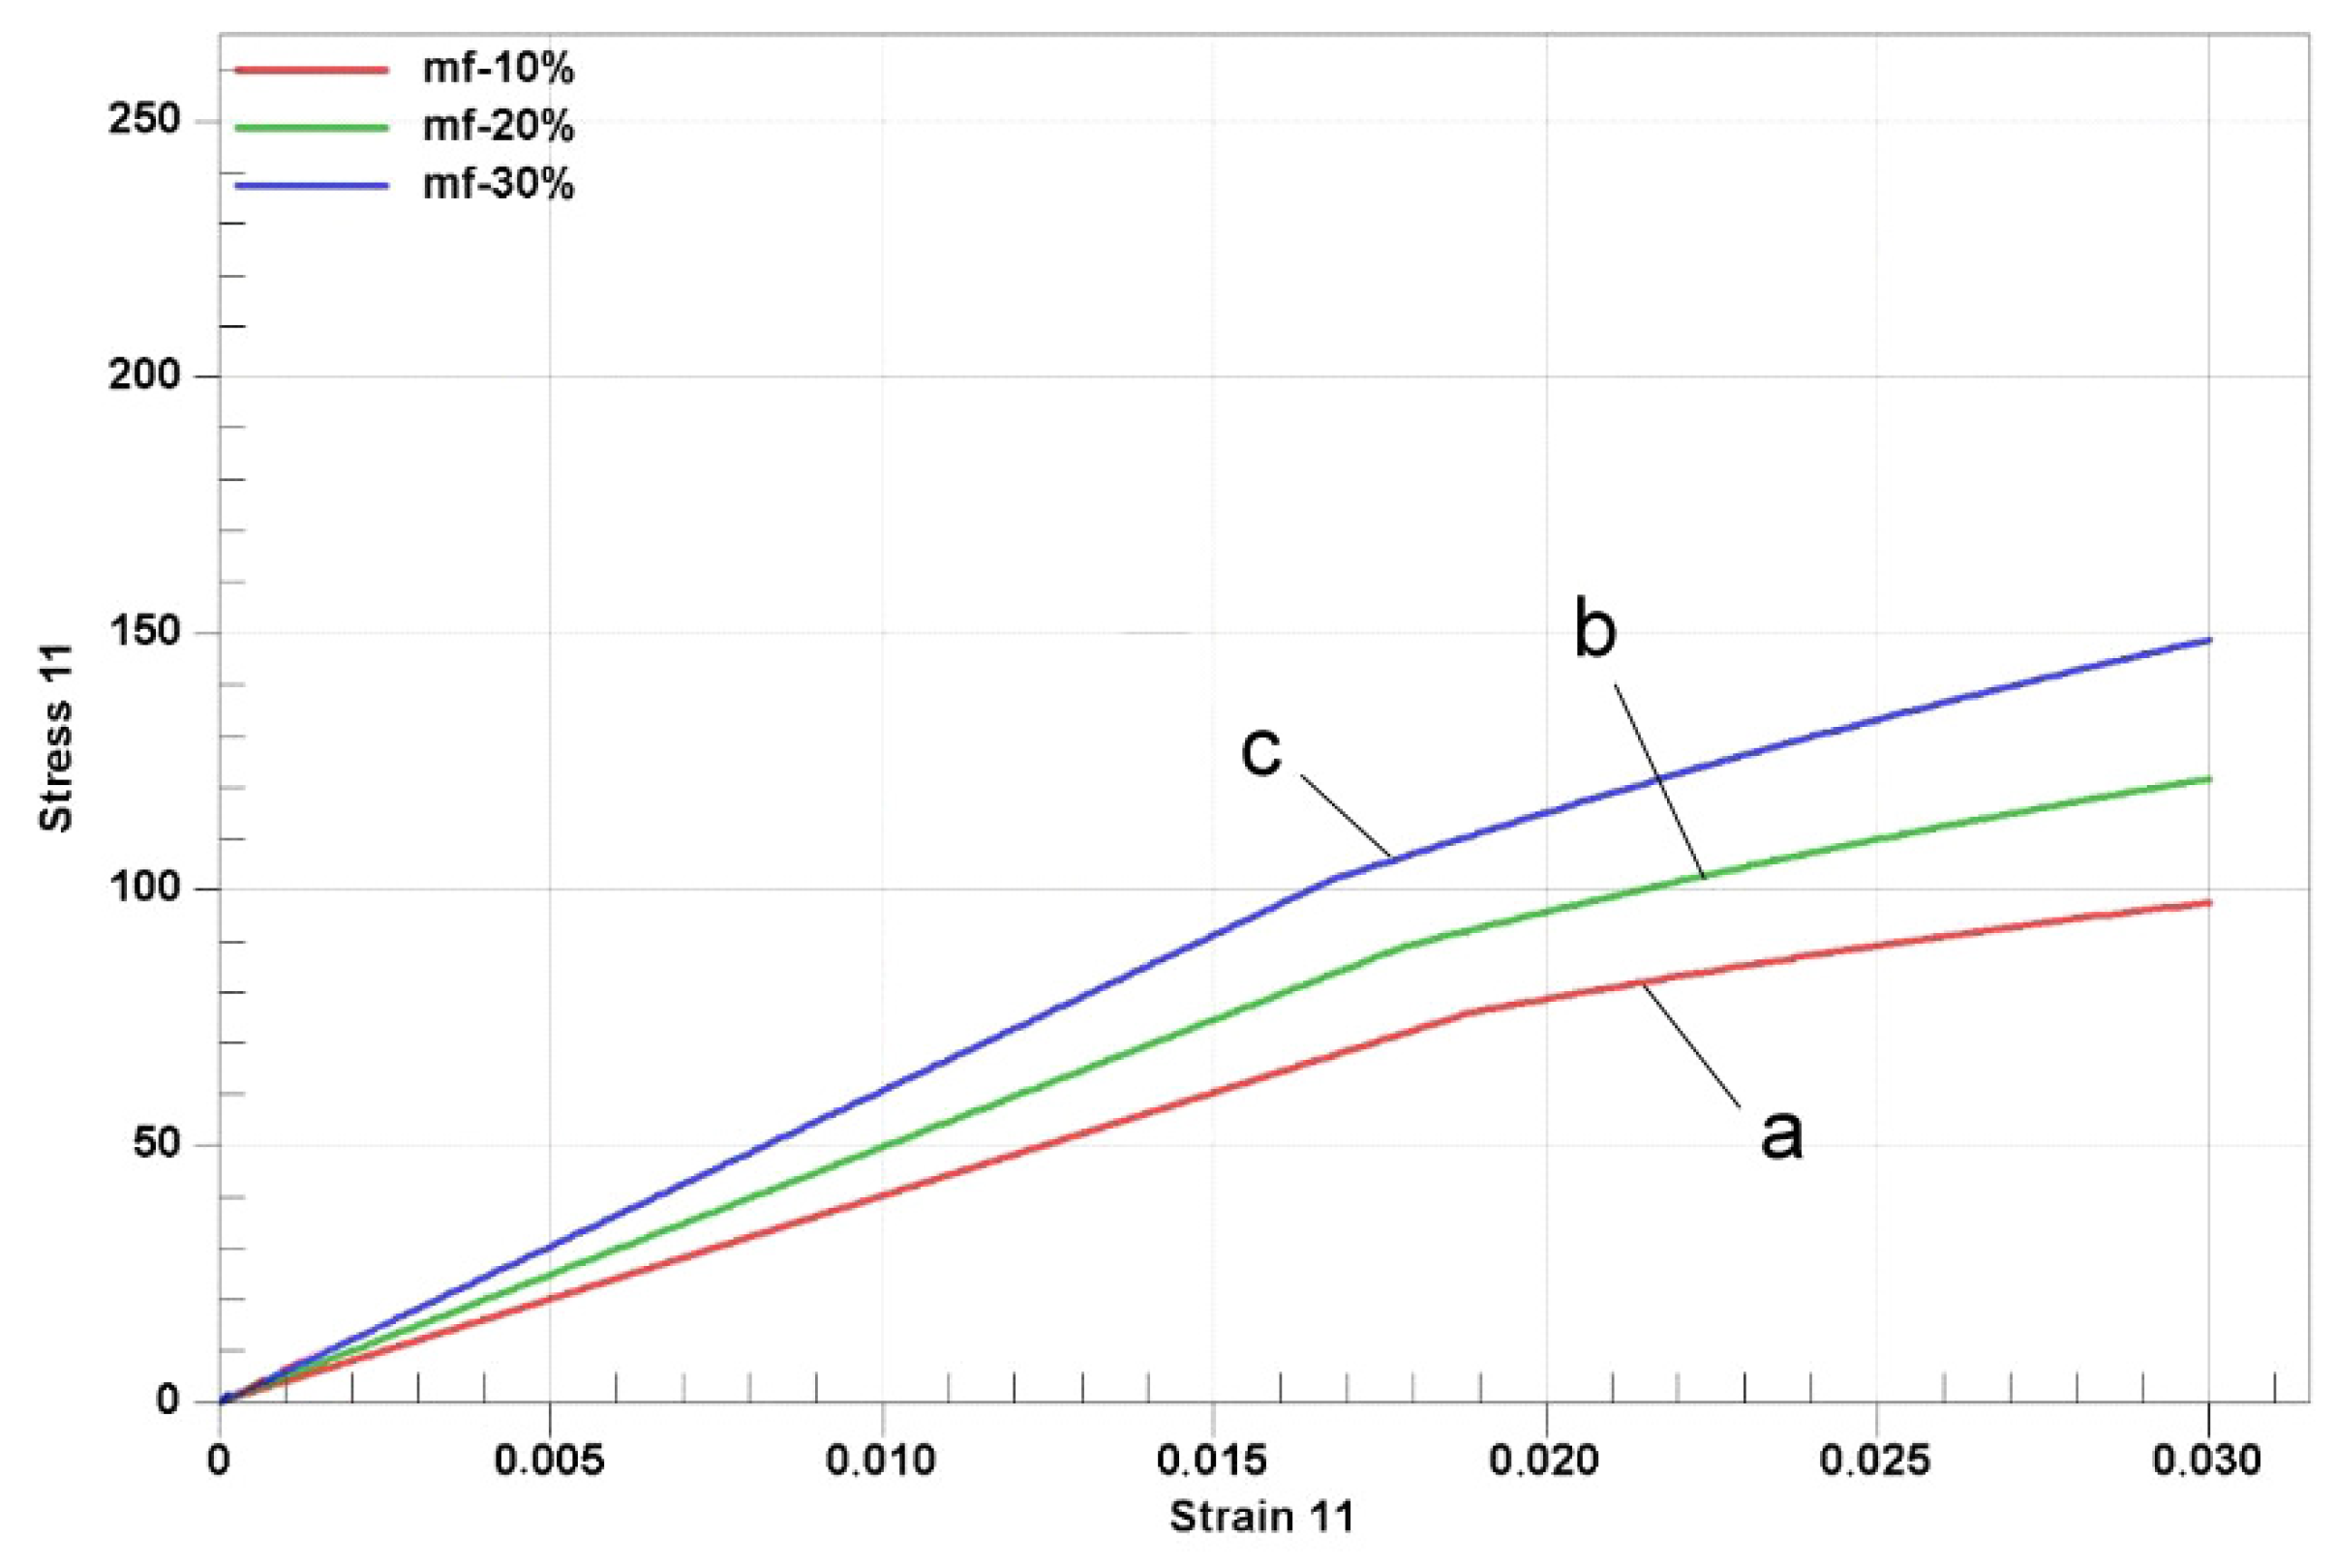
- A mathematical algorithm has been developed for modeling the mechanical characteristics of the composite materials based on the Eshebli theory and the Mori–Tanaka theorem by Tandom and Weng, considering the Cauchy stress tensor. The mathematical method that allows obtaining analytical estimates of the effective properties of the materials that affect their reliability has been established on its basis. The results of modeling by the analytical deterministic method and the probabilistic stochastic method are similar to discrepancies of no more than 10% in the region of high filler concentrations in PCM. The discrepancy in low filler concentrations is explained by the insufficient consideration of technological factors.
- An innovative attempt has been made to use a probabilistic mathematical apparatus not only for analyzing the mechanical properties of materials but also for a comparative assessment of the reliability parameters of these materials. With the development of the mathematical apparatus, including numerical methods for processing mathematical data, it is much more important to obtain native graphs of the functions of changing the source of materials depending on the factors of time, temperature, and other operational indicators, without linking these functions (sometimes with large errors) to the classical distribution laws of random quantities. This gives some flexibility to researchers and allows practical engineers to obtain more accurate results. They study the change in the reliability and degradation of the materials depending on changes in the operating factors in real conditions, as well as make a forecast of changes in the reliability in the future, extrapolating from the results. The authors will devote further study to mathematical and experimental models for predicting the degradation and reliability of composite materials and the creation of a universal mathematical methodology to forecast their sources.
Author Contributions
Funding
Institutional Review Board Statement
Informed Consent Statement
Data Availability Statement
Conflicts of Interest
References
- Berladir, K.; Zhyhylii, D.; Gaponova, O.; Krmela, J.; Krmelová, V.; Artyukhov, A. Modeling of Polymer Composite Materials Chaotically Reinforced with Spherical and Cylindrical Inclusions. Polymers 2022, 14, 2087. [Google Scholar] [CrossRef]
- Tsivolas, E.; Gergidis, L.N.; Paipetis, A.S. Crack Growth and Delamination Analysis in GFRP Composite Materials. Appl. Sci. 2022, 12, 1945. [Google Scholar] [CrossRef]
- Khodadadi, A.; Golestanian, H.; Aghadavoudi, F. Two modified multiscale modeling approaches for determination of two-phase and hybrid nanocomposite properties. Proc. Inst. Mech. Eng. Part C J. Mech. Eng. Sci. 2021, 236, 496–510. [Google Scholar] [CrossRef]
- Haghighi, M.; Golestanian, H.; Aghadavoudi, F. Determination of mechanical properties of two-phase and hybrid nanocomposites: Experimental determination and multiscale modeling. J. Polym. Eng. 2021, 41, 356–364. [Google Scholar] [CrossRef]
- Jiang, H.; Ren, Y.; Zhang, S.; Liu, Z.; Nie, L. Multi-scale finite element analysis for tension and ballistic penetration damage characterizations of 2D triaxially braided composite. J. Mater. Sci. 2018, 53, 10071–10094. [Google Scholar] [CrossRef]
- Nobeen, N.S.; Zhong, Y.; Francis, B.A.; Ji, X.; Chia, E.S.; Joshi, S.C.; Chen, Z. Constituent materials micro-damage modeling in predicting progressive failure of braided fiber composites. Compos. Struct. 2016, 145, 194–202. [Google Scholar] [CrossRef]
- Hameed, A.Z.; Aravind Raj, S.; Kandasamy, J.; Shahzad, M.A.; Baghdadi, M.A. 3D Printing Parameter Optimization Using Taguchi Approach to Examine Acrylonitrile Styrene Acrylate (ASA) Mechanical Properties. Polymers 2022, 14, 3256. [Google Scholar] [CrossRef]
- Gonçalves, P.T.; Arteiro, A.; Rocha, N.; Pina, L. Numerical Analysis of Micro-Residual Stresses in a Carbon/Epoxy Polymer Matrix Composite during Curing Process. Polymers 2022, 14, 2653. [Google Scholar] [CrossRef]
- Al Kassem, G.; Weichert, D. Micromechanical material models for polymer composites through advanced numerical simulation techniques. In PAMM: Proceedings in Applied Mathematics and Mechanics; Wiley Online Library: Hoboken, NJ, USA, 2009. [Google Scholar] [CrossRef]
- Chavoshi, S.Z.; Tagarielli, V.L.; Shi, Z.; Lin, J.; Wang, S.; Jiang, J.; Dear, J.P.; Nikbin, K. Predictions of the Mechanical Response of Sintered FGH96 Powder Compacts. J. Eng. Mater. Technol. 2019, 142, 021003. [Google Scholar] [CrossRef]
- Yakimov, S.B.; Ivanovsky, V.N.; Degovtsov, A.V.; Eliseev, D.B.; Aygishev, E.V. On the influence of the fraction composition of abrasive particles in produced fluid on the wear types of the elements of electric centrifugal pumps. Oil Gas Territ. 2017, 11, 32–38. Available online: https://www.neftegas.info/upload/iblock/4aa/4aa5a548746775ee8051eb0fec24a52b (accessed on 1 September 2022).
- Fragassa, C. Lightening structures by metal replacement: From traditional gym equipment to an advanced fiber-reinforced composite exoskeleton facta universitatis. Mech. Eng. 2021, 19, 155–174. [Google Scholar] [CrossRef]
- Ahmadifar, A.; Zamani, M.R.; Davar, A.; Jam, J.E.; Beni, M.H. Experimental and numerical buckling analysis of carbon fiber composite lattice conical structure before and after lateral impact. Appl. Comput. Mech. 2020, 6, 813–822. [Google Scholar] [CrossRef]
- Mallick, V. Thermoplastic composite-based processing technologies for high performance turbomachinery components. Compos. Part A Appl. Sci. Manuf. 2001, 32, 1167–1173. [Google Scholar] [CrossRef]
- Li, Q.; Piechna, J.; Mueller, N. Static, dynamic and failure behavior of a novel axial composite impeller for water chiller. ASME Int. Mech. Eng. Congr. Expo. 2010, 44298, 81–87. [Google Scholar]
- Palle, R.R.; Schuster, J.; Shaik Yu, P.; Kazmi, M. Fabrication and characterization of glass fiber with sic reinforced polymer composites. Open J. Compos. Mater. 2022, 12, 16–29. [Google Scholar] [CrossRef]
- Liu, Y.; Guo, Y.; Zhao, J.; Chen, X.; Zhang, H.; Hu, G.; Yu, X.; Zhang, Z. Carbon fiber reinforced shape memory epoxy composites with superior mechanical performances. Compos. Sci. Technol. 2019, 177, 49–56. [Google Scholar] [CrossRef]
- Toshitake, S.; Hiroshi, C.; Tadao, K. Sorption of water by bisphenol-a polycarbonate and polyoxyethylene multiblock copolymers with varying composition and block length. Polym. J. 1984, 16, 129–138. [Google Scholar] [CrossRef][Green Version]
- Nazarov, S.A. Eshelby’s theorem and the optimal pay problem. Algebra Janaliz 2009, 21, 155–195. [Google Scholar] [CrossRef]
- Barralab, M.; Chatzigeorgioua, G.; Meraghnia, F.; Leon, R. Homogenization using modified Mori-Tanaka and TFA framework for elastoplastic-viscoelastic-viscoplastic composites: Theory and numerical validation. Int. J. Plast. 2020, 127, 102632. [Google Scholar] [CrossRef]
- Singh, C.V.; Talreja, R. A multiscale approach to modeling of composite damage. In Modeling Damage, Fatigue and Failure of Composite Materials; Woodhead Publishing: Sawston, UK, 2016; pp. 329–345. [Google Scholar] [CrossRef]
- Laurin, F.; Carrere, N.; Maire, J.-F. Strength prediction methods for composite structures: Ensuring aeronautical design office requirements. In Numerical Modelling of Failure in Advanced Composite Materials; Woodhead Publishing: Sawston, UK, 2015; pp. 507–532. [Google Scholar] [CrossRef]
- Oskay, C. Multiscale modeling of the response and life prediction of composite materials. In Numerical Modelling of Failure in Advanced Composite Materials; Woodhead Publishing: Sawston, UK, 2015; pp. 351–375. [Google Scholar] [CrossRef]
- Beaumont, P.; Soutis, C.; Hodzic, A. Structural integrity and durability of advanced composites: Innovative modelling methods and intelligent design. In Structural Integrity and Durability of Advanced Composites: Innovative Modelling Methods and Intelligent Design; Woodhead Publishing: Sawston, UK, 2015; pp. 1–872. [Google Scholar]
- Roy, S. Multi-scale modeling of high-temperature polymer matrix composites for aerospace applications. In Structural Integrity and Durability of Advanced Composites: Innovative Modelling Methods and Intelligent Design; Woodhead Publishing: Sawston, UK, 2015; pp. 125–142. [Google Scholar] [CrossRef]
- Curiel-Sosa, J.L.; Brighenti, R.; Serna Moreno, M.C.; Barbieri, E. Computational techniques for simulation of damage and failure in composite materials. In Structural Integrity and Durability of Advanced Composites: Innovative Modelling Methods and Intelligent Design; Woodhead Publishing: Sawston, UK, 2015; pp. 199–219. [Google Scholar] [CrossRef]
- Chatzigeorgiou, G.; Meraghni, F.; Charalambakis, N. Multiscale Modeling Approaches for Composites. In Multiscale Modeling Approaches for Composites; Elsevier: Amsterdam, The Netherlands, 2021; pp. 1–345. [Google Scholar] [CrossRef]
- Liu, P. Damage Modeling of Composite Structures: Strength, Fracture, and Finite Element Analysis. In Damage Modeling of Composite Structures: Strength, Fracture, and Finite Element Analysis; Elsevier: Amsterdam, The Netherlands, 2020; pp. 1–384. [Google Scholar] [CrossRef]
- Carreras, L.; Guillamet, G.; Quintanas-Corominas, A.; Renart, J.; Turon, A. Mesoscale modelling of delamination using the cohesive zone model approach. In Multi-Scale Continuum Mechanics Modelling of Fibre-Reinforced Polymer Composites; Woodhead Publishing: Sawston, UK, 2020; pp. 555–577. [Google Scholar] [CrossRef]
- Bouhfid, N.; Raji, M.; Boujmal, R.; Essabir, H.; Bensalah, M.-O.; Bouhfid, R.; Qaiss, A.K. Numerical modeling of hybrid composite materials. In Modelling of Damage Processes in Biocomposites, Fibre-Reinforced Composites and Hybrid Composites; Woodhead Publishing: Sawston, UK, 2018; pp. 57–101. [Google Scholar] [CrossRef]
- Chokshi, S.; Gohil, P. Experimental Investigation and Mathematical Modeling of Longitudinally Placed Natural Fiber Reinforced Polymeric Composites including Interphase Volume Fraction. Fibers Polym. 2022, 23, 488–501. [Google Scholar] [CrossRef]
- Feoktistov, E.F.; Germashev, I.V.; Derbisher, V.E.; Derbisher, E.V.; Evdokimov, R.A. Selective system analysis tools for identifying the properties of active ingredients in polymer compositions. ChemChemTech 2022, 65, 6–18. [Google Scholar] [CrossRef]
- Kayiran, H.F. Numerical analysis of composite disks based on carbon/aramid-epoxy materials. Emerg. Mater. Res. 2021, 11, 155–159. [Google Scholar] [CrossRef]
- Lubecki, M.; Stosiak, M.; Bocian, M.; Urbanowicz, K. Analysis of selected dynamic properties of the composite hydraulic microhose. Eng. Fail. Anal. 2021, 125, 105431. [Google Scholar] [CrossRef]
- Tassi, N.; Bakkali, A.; Fakri, N.; Azrar, L. Regularized Micromechanical Modeling for the Prediction of Electro-Elastic Behavior of Reinforced Piezoelectric Composites. In Proceedings of the 2021 IEEE International Conference on Recent Advances in Mathematics and Informatics, ICRAMI, Tebessa, Algeria, 21–22 September 2021. [Google Scholar] [CrossRef]
- Chantieva, M.; Dzhabrailov, K.; Gematudinov, R.; Suvorov, D. Modern method of computer simulation of structures and physical properties of composite materials. In Advances in Intelligent Systems and Computing, 1259 AISC; Springer: Cham, Switzerland, 2005; pp. 553–561. [Google Scholar] [CrossRef]
- McCarthy, C.T.; McCarthy, M.A.; Gilchrist, M.D. Predicting Failure in Multi-Bolt Composite Joints Using Finite Element Analysis and Bearing-Bypass Diagrams. Key Eng. Mater. 2005, 293, 591–598. [Google Scholar] [CrossRef]
- Osman, M.A.; Atallah, A. Effect of the particle size on the viscoelastic properties of filled polyethylene. Polymer 2006, 47, 2357–2368. [Google Scholar] [CrossRef]


| Material | Description | E, MPa | µ | Ast, 10−6, 1/grad | Ave, 10−6, 1/grad | Tst, K |
|---|---|---|---|---|---|---|
| BSPE 22007-16 | Compositions of the frost-resistant propylene–ethylene copolymer with increased impact resistance BSPE 22007-16 are used to produce battery monoblocks, technical products, and car bumpers. They have increased impact resistance and can be made on the basis of the propylene–ethylene copolymer with the introduction of special additives that increase the impact strength. Compositions are produced colored and unpainted. | 1170/95 | 0.37/0.020 | - | 98/12 | - |
| MPP 15-04, colorless | Melt flow index: 1.0 g/10 min. Tensile yield strength: not less than 22.0 MPa. Elongation at break: not less than 130%. Charpy impact strength without notch at minus 50 °C: not less than 25 kJ/m2. Softening temperature: according to Vicat, at a load of 10 N: not less than 135 °C. Frost resistance: not higher than −50 °C. Frost resistance for painted grades: not higher than −40 °C. Granules of the same color, 2–5 mm in size. | 1110/77 | 0.36/0.018 | - | 104/14 | - |
| MPP 15-04-901 | It is frost-resistant polypropylene. Frost-resistant polypropylene compositions are intended for injection molding of automotive components, battery monoblocks, and technical products. | 1100/76 | 0.36/0.017 | - | 101/13 | - |
| SNP 21060-16-S30 | Melt flow index: 4.1−8.0 g/10 min. Spread of PFR: no more than ±8%. Number of inclusions: no more than 3 pcs. Mass fraction of ash: no more than 0.035%. Mass fraction of volatile substances: no more than 0.09%. Resistance to thermal-oxidative aging: not less than 360 h. Tensile yield strength: not less than 30 MPa. Elongation at break: not less than 500%. Granules of the same color, 2−5 mm in size. | 1500/114 | 0.26/0.016 | 15/2,7 | 30/3,2 | 272/2 |
| Material | Description | σrm, MPa | Sσrm, MPa | σrmc, MPa | Sσrmc, MPa | Ke |
|---|---|---|---|---|---|---|
| UPS 825 black | High-impact molded polystyrene. Grade 825 is a high impact injection molded polystyrene. The ability of this polymer to be molded with accelerated cycles with minimal stresses gives an exceptional property—the preservation of impact strength. | 27.3 | 0.58 | 25.9 | 0.76 | 1.05 |
| ABS 2020 | 2020 ABS plastic of the highest grade. Izod impact strength: not less than 24.5 kJ/m2 (25.0 kgf cm/cm2). Tensile yield strength: not less than 38.2 MPa (390 kgf/cm2). Elongation at break: not less than 22%. Vicat heat resistance: not lower than 100 °C. Melt flow index: within 10–12 g/10 min. Bending temperature under load: not less than 100 °C. Mass fraction of water: no more than 0.28%. | 40.7 | 0.65 | 36.2 | 0.9 | 1.12 |
| PA 610-1-108 | Polyamide PA 610-1-108 is a reliable and practical material in production. The material is a synthetic polymer product with high physical and chemical properties. The main advantages of the material over similar polyamides are low moisture absorption, excellent electrical insulation, and resistance to petrochemical attacks. When additives are added to the raw material composition of the product during the production process, there is no reaction of foaming, decomposition, and deformation of the original structure. The material perfectly tolerates thermal effects, as well as sudden changes in pressure levels. | 134.0 | 8.62 | 100.1 | 3.46 | 1.34 |
| Polycarbonate PK-2 | Melt flow index is within 4–11 g/10 min. Tensile yield strength: not less than 57 MPa. Elongation at break: not less than 60%. Impact strength of the sample with a notch: not less than 30 kJ/m2. Electrical strength: not less than 19 kV/mm. Polycarbonate is used for casting thin-walled parts of the complex configuration with metal fittings with increased resistance to high temperatures and humidity. | 62.2 | 1.19 | 52.0 | 2.46 | 1.20 |
| -Mass Fraction, % | , | , g/сm3 | σm, MPa | ||
|---|---|---|---|---|---|
| 10 | 1.26 | 90 | |||
| 20 | 1.33 | 120 | |||
| 30 | 0.32 | 1.415 | 150 |
| -Mass Fraction, % | 10 | 20 | 30 | |||
|---|---|---|---|---|---|---|
| Type of Experiment | Field | Model | Field | Model | Field | Model |
| Et, MPa | 5240 | 3200 | 5250 | 4029 | 6190 | 5060 |
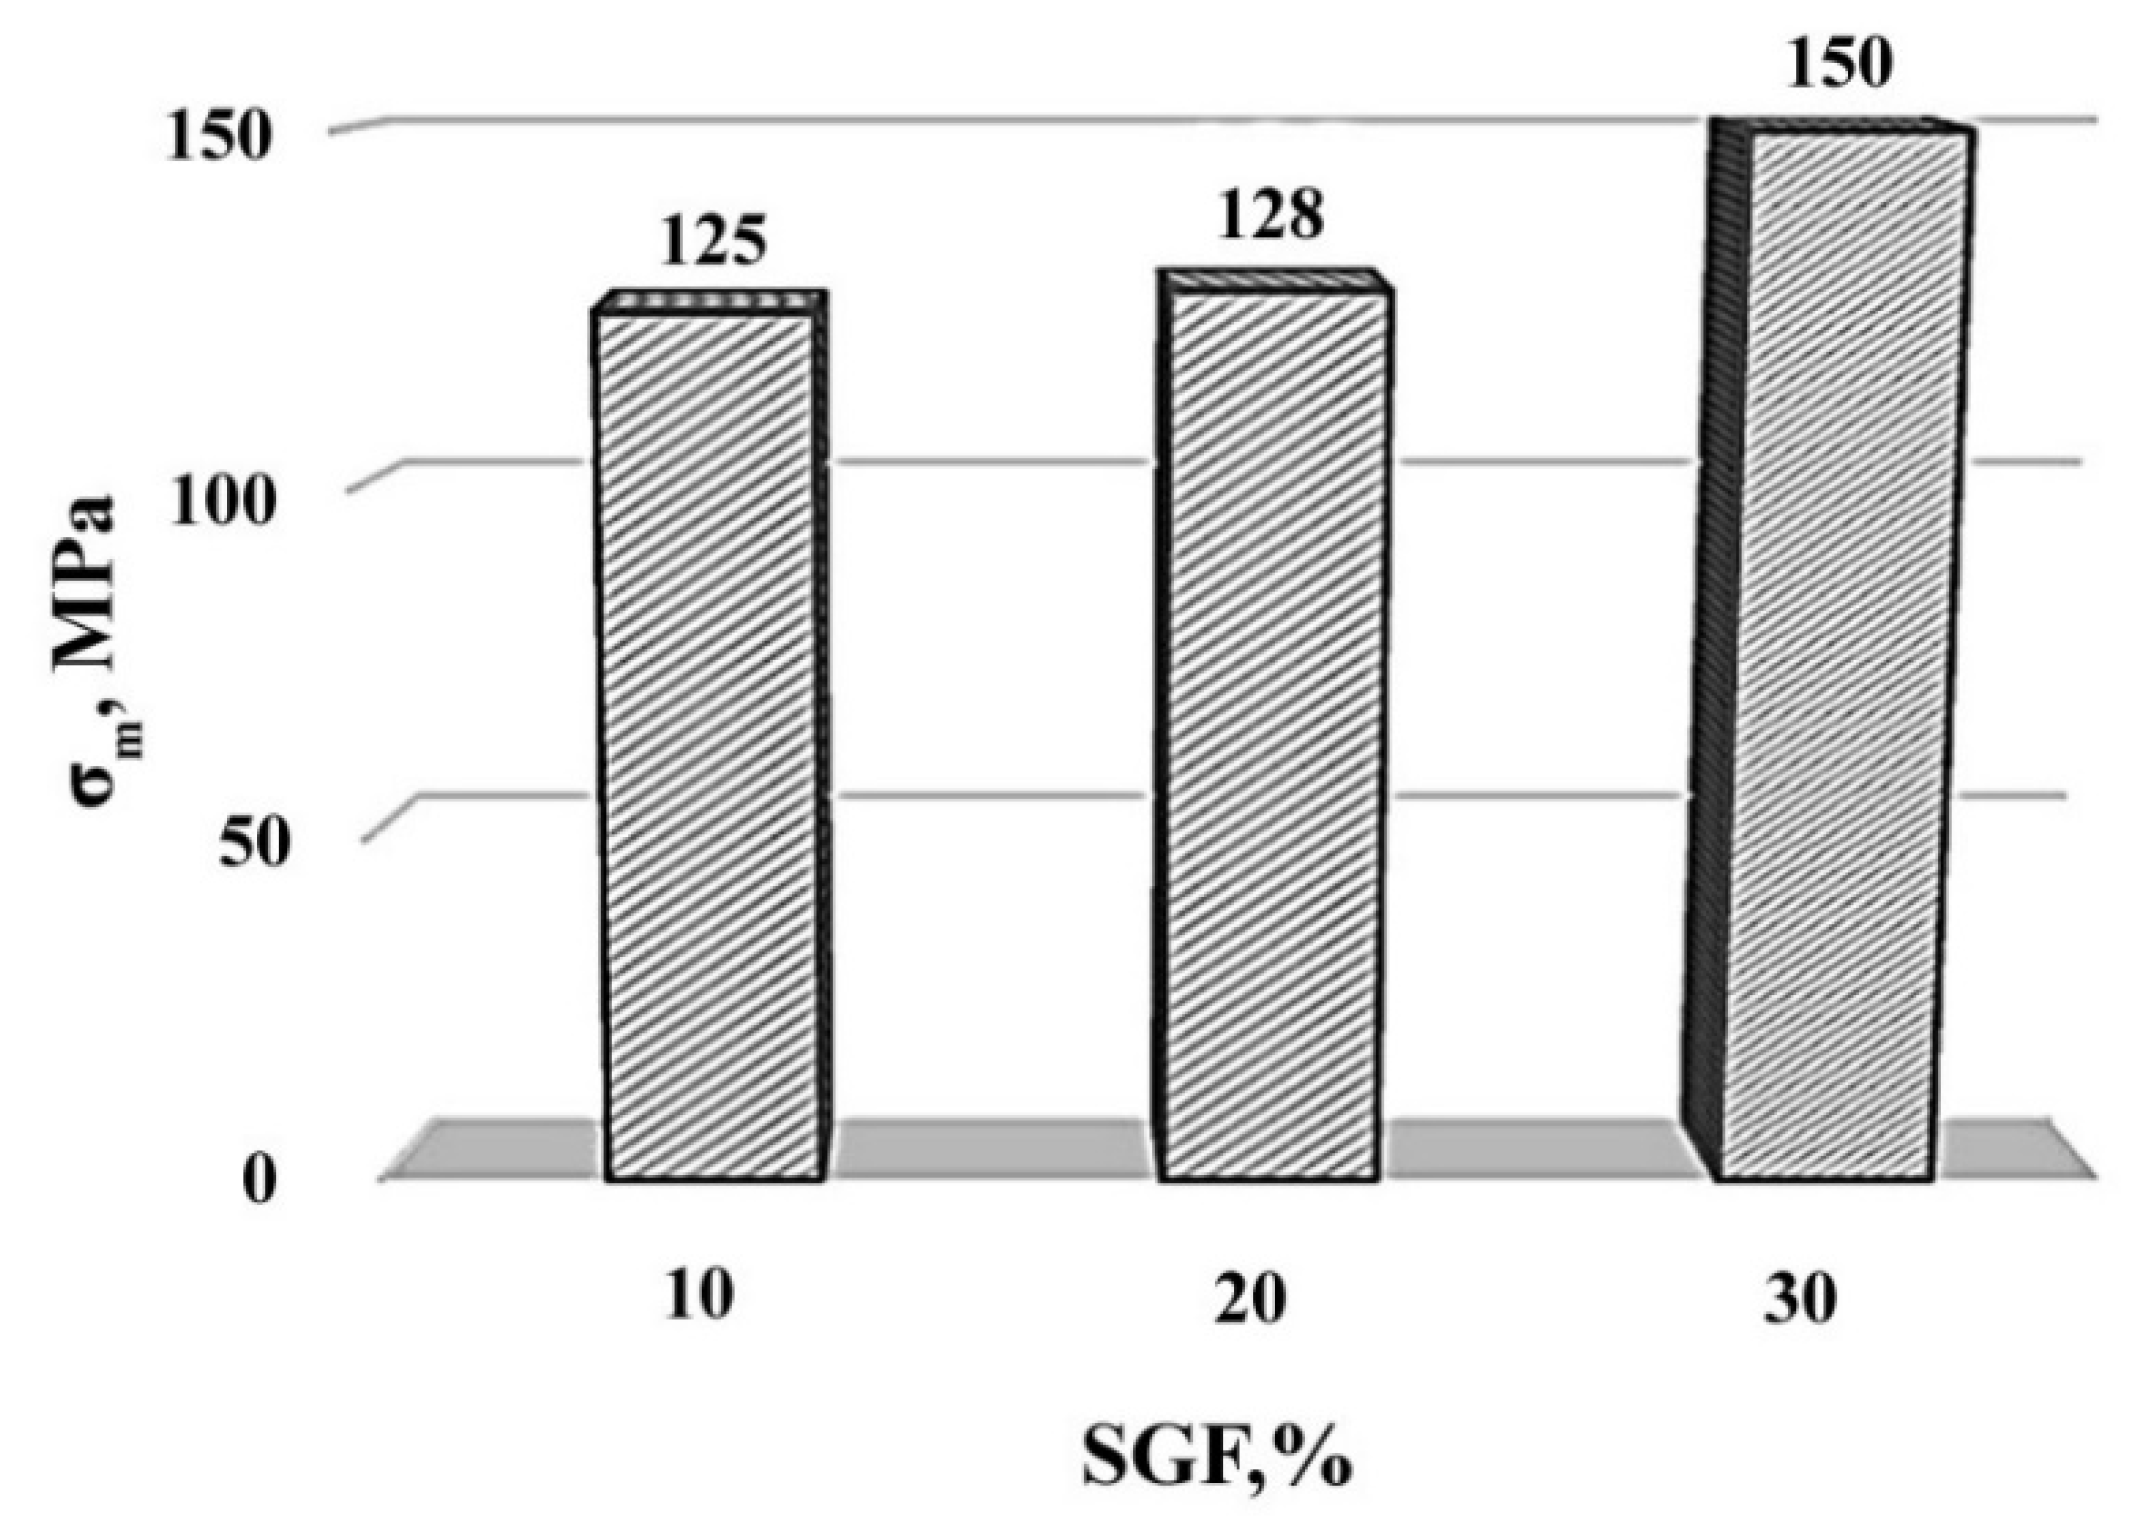
| σm, MPa | 125 | 90 | 128 | 120 | 150 | 150 |
Publisher’s Note: MDPI stays neutral with regard to jurisdictional claims in published maps and institutional affiliations. |
© 2022 by the authors. Licensee MDPI, Basel, Switzerland. This article is an open access article distributed under the terms and conditions of the Creative Commons Attribution (CC BY) license (https://creativecommons.org/licenses/by/4.0/).
Share and Cite
Isametova, M.E.; Nussipali, R.; Martyushev, N.V.; Malozyomov, B.V.; Efremenkov, E.A.; Isametov, A. Mathematical Modeling of the Reliability of Polymer Composite Materials. Mathematics 2022, 10, 3978. https://doi.org/10.3390/math10213978
Isametova ME, Nussipali R, Martyushev NV, Malozyomov BV, Efremenkov EA, Isametov A. Mathematical Modeling of the Reliability of Polymer Composite Materials. Mathematics. 2022; 10(21):3978. https://doi.org/10.3390/math10213978
Chicago/Turabian StyleIsametova, Madina E., Rollan Nussipali, Nikita V. Martyushev, Boris V. Malozyomov, Egor A. Efremenkov, and Aysen Isametov. 2022. "Mathematical Modeling of the Reliability of Polymer Composite Materials" Mathematics 10, no. 21: 3978. https://doi.org/10.3390/math10213978
APA StyleIsametova, M. E., Nussipali, R., Martyushev, N. V., Malozyomov, B. V., Efremenkov, E. A., & Isametov, A. (2022). Mathematical Modeling of the Reliability of Polymer Composite Materials. Mathematics, 10(21), 3978. https://doi.org/10.3390/math10213978