Article

Meta-Heuristic Optimization of LSTM-Based Deep Network for Boosting the Prediction of Monkeypox Cases

1
Faculty of Artificial Intelligence, Delta University for Science and Technology, Mansoura 35712, Egypt
2
Department of Communications and Electronics, Delta Higher Institute of Engineering and Technology, Mansoura 35111, Egypt
3
Department of Civil and Environmental Engineering, Florida International University, Miami, FL 33199, USA
4
Centre for Artificial Intelligence Research and Optimization, Torrens University Australia, Fortitude Valley, QLD 4006, Australia
5
Yonsei Frontier Lab, Yonsei University, Seoul 03722, Korea
6
Department of Chemistry and Biochemistry, University of Arkansas—Fayetteville, Fayetteville, AR 72701, USA
7
Department of System Programming, South Ural State University, Chelyabinsk 454080, Russia
8
Department of Computer Sciences, College of Computer and Information Sciences, Princess Nourah Bint Abdulrahman University, P.O. Box 84428, Riyadh 11671, Saudi Arabia
9
Department of Computer Science, College of Computing and Information Technology, Shaqra University, Shaqra 11961, Saudi Arabia
10
Department of Computer Science, Faculty of Computer and Information Sciences, Ain Shams University, Cairo 11566, Egypt
11
Computer Engineering and Control Systems Department, Faculty of Engineering, Mansoura University, Mansoura 35516, Egypt
12
Electrical Engineering Department, Faculty of Engineering, Benha University, Benha 13518, Egypt
13
Department of Food and Biotechnology, South Ural State University, Chelyabinsk 454080, Russia
*
Authors to whom correspondence should be addressed.
Mathematics 2022, 10(20), 3845; https://doi.org/10.3390/math10203845
Submission received: 8 September 2022 / Revised: 13 October 2022 / Accepted: 14 October 2022 / Published: 17 October 2022

Abstract

:
Recent technologies such as artificial intelligence, machine learning, and big data are essential for supporting healthcare monitoring systems, particularly for monitoring Monkeypox confirmed cases. Infected and uninfected cases around the world have contributed to a growing dataset, which is publicly available and can be used by artificial intelligence and machine learning to predict the confirmed cases of Monkeypox at an early stage. Motivated by this, we propose in this paper a new approach for accurate prediction of the Monkeypox confirmed cases based on an optimized Long Short-Term Memory (LSTM) deep network. To fine-tune the hyper-parameters of the LSTM-based deep network, we employed the Al-Biruni Earth Radius (BER) optimization algorithm; thus, the proposed approach is denoted by BER-LSTM. Experimental results show the effectiveness of the proposed approach when assessed using various evaluation criteria, such as Mean Bias Error, which is recorded as (0.06) using BER-LSTM. To prove the superiority of the proposed approach, six different machine learning models are included in the conducted experiments. In addition, four different optimization algorithms are considered for comparison purposes. The results of this comparison confirmed the superiority of the proposed approach. On the other hand, several statistical tests are applied to analyze the stability and significance of the proposed approach. These tests include one-way Analysis of Variance (ANOVA), Wilcoxon, and regression tests. The results of these tests emphasize the robustness, significance, and efficiency of the proposed approach.
MSC:
68T07; 68T10; 68T20

1. Introduction

After the global impact of COVID-19 in 2020, numerous countries reported that Monkeypox had emerged in 2022, presenting a new global health crisis. Even though the effects of COVID-19 on the worldwide economy and healthcare have been felt for over two years, a second recent viral outbreak is anticipated to emerge in the near future. The “Monkeypox virus” is the second etiological agent. The Zoonotic Orthopoxvirus, closely related to cowpox and smallpox, causes the contagious disease known as Monkeypox [1]. The Monkeypox is a member of the Poxviridae family and the Orthopoxvirus genus. Monkeypox is not a recent discovery; it was initially identified in 1958 in Copenhagen. When the virus was first identified in 1958 in monkeys in a Danish laboratory, it was given the name Monkeypox [2]. Although rodents and monkeys are the primary carriers, human-to-human transmission is also very common [3]. The first isolate was given the name Monkeypox [4]. In 1970, the Democratic Republic of the Congo (DRC) reported the first instance of zoonotic MPV transmission from animal to human [5]. Monkeypox typically affects many people who live close to tropical rain forests in Central and Western Africa. When a person comes into intimate touch with another infected individual, animal, or object, the virus itself spreads. Direct bodily contact, animal bites, respiratory droplets, or mucus from the eyes, nose, or mouth can all spread it [6]. Fever, physical aches, and exhaustion are a few early signs of Monkeypox infection in patients, with a red bump on the skin as the long-term result [7].
According to data collected thus far, Monkeypox is not nearly as contagious as COVID-19; however, the number of reported cases is climbing. In 1990, only 50 cases of Monkeypox were reported in West and Central Africa. By 2020, the number of reported incidents had increased to five thousand. In the past, Monkeypox was thought to only be found in Africa. However, in 2022, people in several countries outside Africa, including the United States and Europe, were found to have the virus [8]. Consequently, a widespread sense of excessive dread and fear is gradually developing among the general population; this is frequently reflected in the opinions expressed by individuals on social media. According to the Centers for Disease Control and Prevention (CDC) recommendations, there is currently no effective treatment for the Monkeypox virus. Many countries’ healthcare systems and experts are struggling under the pressure of a shortage of medical supplies due to a growing patient population [9]. Therefore, gaining knowledge of the pandemic’s growth and making accurate predictions regarding its future evolution is one of the most critical steps that can be taken to stop its progression. This is especially true in nations such as India, with a sizable population. The accuracy of forecasting patterns of the Monkeypox distribution can assist in predicting the pandemic outbreak and help governments become better equipped to tackle the pandemic. Additionally, precise forecasting can offer feedback on how well the implemented policy works to reduce the burden on that nation’s healthcare system [10]. The government can then assess the effectiveness of mitigation plans and implement policy regulations based on the predicted impact zones. For instance, researchers have effectively anticipated the reproduction parameter of COVID-19 in Indonesia using mathematical models such as the SIR and SEIR models, demonstrating the need for accurate forecasting methods [11].
Artificial intelligence (AI) has shown promising results as a decision support system to aid in detecting diseases and establishing accurate medical diagnoses in recent years, among many other applications. Researchers and governments have concentrated on machine learning (ML), a subset of AI that can learn from past data to solve a real-world problem and make accurate predictions about the number of pandemic cases, which is crucial for controlling the virus’s incubation and transmission. For example, in the COVID-19 pandemic challenge, ML can forecast the COVID-19 breakout by assessing the virus’s riskiness and then stepping up the level of the procedures used. When they utilize ML to detect COVID-19, many countries have seen a decline in the virus’s propagation. In summary, many academics have developed models and systems to predict diseases using ML and deep learning (DL) approaches. ML algorithms are widely applicable in the field of medical analysis; for example, in the prediction of COVID-19 [12], the progression of Alzheimer’s disease [13], brain tumor [14], breast cancer [15], and other diseases [16,17]. ML and DL are crucial in diagnosing diseases and finding solutions to health threats.
In this paper, we propose a new approach for boosting the prediction accuracy of Monkeypox infections. The proposed approach is based on LSTM deep network, where its parameters are optimized using BER optimization algorithm. The contributions of this work can be summarized as follows:
  • A new approach is proposed based on optimized LSTM prediction to improve the accuracy of Monkeypox infection prediction.
  • The proposed approach is compared with other ML models and optimization algorithms, and the results are recorded.
  • The recorded results are analyzed using statistical methods such as Wilcoxon’s rank-sum test and one-way analysis of variance to evaluate the statistical difference and significance of the proposed approach.
  • The proposed approach can be generalized and tested for other datasets.

2. Related Works

ML and DL are crucial in diagnosing diseases and finding solutions to health issues. Many academics have developed models and systems to predict different diseases using ML and DL approaches. Alzheimer’s disease cannot be diagnosed with a specific test. The clinical history, cognitive and laboratory tests, and electroencephalography (EEG) should be used to make the diagnosis. Therefore, new methods are required to ensure earlier and more precise diagnosis and to monitor treatment outcomes. With the goal of distinguishing Alzheimer’s disease patients from controls, authors in [17] employed a ML technique called support vector machine (SVM) to scour EEG epochs for distinguishing features. A quantitative EEG (qEEG) processing method was created for automatically differentiating patients with Alzheimer’s from healthy persons. The study that took each patient’s diagnosis into account had high accuracy.
Diseases of the heart rank among the world’s top five leading causes of death in the modern era. A significant problem in clinical data analysis is the prediction of cardiovascular disease. With ML, it has been demonstrated that it is possible to make predictions and judgments from the vast amount of data generated by the healthcare sector. The use of ML approaches to predict cardiac disease is only partially explored in several researches. A unique approach to improve the precision of cardiovascular disease prediction by identifying key features using ML techniques was proposed by authors in [18]. The prediction model is presented with a variety of feature combinations as well as a number of well-established classification methods. It is usual practice to establish a diagnosis of Parkinson’s disease (PD) on medical observations and an evaluation of clinical signs. This evaluation often involves the definition of a wide range of motor symptoms. However, there is a risk of misclassification with conventional diagnostic methods since they rely on the evaluation of motions that can be subtle to human eyes. In order to diagnose PD, ML also enables the combination of several modalities, such as magnetic resonance imaging (MRI) and single-photon emission computed tomography (SPECT) data [19]. In order to rely on these alternative measures to detect PD in preclinical stages or atypical forms, we may discover pertinent traits that are not often used in the clinical diagnosis of PD by applying ML algorithms.
A frequent clinical consequence that is linked to high morbidity and death is fatty liver disease (FLD). The potential to develop a suitable plan for prevention, early diagnosis, and therapy is given by an earlier prediction of FLD patients. Authors of [20] created a ML model that could predict FLD and help doctors identify high-risk patients, establish a new diagnosis, and prevent and manage FLD. To predict FLD, classification models including logistic regression, random forest, naive Bayes, and artificial neural networks (ANN) were created. The four models’ performance was compared using the area under the receiver operating characteristic curve (ROC). To accurately predict fatty liver disease, authors in [20] created and analyzed four classification algorithms in this study. Nevertheless, the random forest model performed better than other categorization methods. A random forest model could be used in the clinical setting to help doctors categorize patients with fatty livers for primary prevention, surveillance, early treatment, and management.
An increasing number of people worldwide are developing chronic kidney disease (CKD), which significantly impacts overall health and well-being. In the beginning stages of CKD, there are no noticeable symptoms; therefore, many people do not realize they have it. When CKD is diagnosed in its earliest stages, patients can receive medication that slows the disease’s progression. Due to their quick and precise recognition abilities, ML models can successfully help therapists accomplish this goal. Authors in [21] suggested a ML approach to CKD diagnosis. The University of California Irvine (UCI) [22] ML repository provided the CKD dataset, which contains a significant number of missing values. Since patients may overlook particular measurements for a variety of reasons, missing data are frequently observed in real-world medical settings. Six ML algorithms were employed to create models after completing the missing dataset. With a diagnosis accuracy rate of 99.75%, random forest outperformed the other ML models. An integrated model was suggested that combines logistic regression and random forest utilizing perceptron, which could reach an average accuracy of 99.83% after ten simulations by assessing the established models’ errors. We, therefore, hypothesized that this methodology would be applied to clinical data for more complex disease diagnoses. Authors in [23] presented a novel approach to ML that makes it possible to accurately diagnose coronary artery disease (CAD). Ten classic ML methods were evaluated. Data standardization and preprocessing were performed to increase the efficiency of these methods. Stratified ten-fold cross-validation was combined with a genetic approach, particle swarm optimization, and was employed for parallel feature selection and classifier parameter optimization. Results demonstrated that the proposed method could significantly improve ML models’ accuracy for clinical and research applications.
Recently, around the world, Monkeypox has become a rapidly spreading disease, with outbreaks already being documented in 75 different nations outside of Africa. The similarities between Monkeypox, chickenpox, and measles make early clinical diagnosis difficult. Monitoring and quick identification of infected patients with Monkeypox may be aided by computer-assisted detection of lesion morphology in circumstances when confirmatory Polymerase Chain Reaction (PCR) assays are not easily accessible. When enough training examples are available, DL techniques have been demonstrated to be useful for automatically detecting skin lesions. There was already a knowledge gap among medical experts worldwide due to the rarity of Monkeypox before the current outbreak. The accomplishments of supervised ML in the detection of COVID-19 serve as inspiration for scientists as they work to find a solution to this difficult problem. However, there is a shortage of data on Monkeypox skin photos, causing a bottleneck in applying ML to the detection of Monkeypox from patient skin photographs.
Authors in [24] presented the largest dataset of Monkeypox Skin Images in their research. Photographs of healthy and infected skin were gathered through web scraping to create a complete image database available to the public. Infected skin images included those with measles, cowpox, chickenpox, smallpox, Monkeypox, and chickenpox. Authors in [25] developed the Monkeypox Skin Lesion Dataset (MSLD), which includes pictures of skin lesions caused by measles, chickenpox, and Monkeypox. Most photographs have been gathered from websites, news portals, and case reports that are available to the general public. In the first phase, a three-fold cross-validation experiment is set up, and the sample size is increased through data augmentation. The second phase is categorizing diseases such as Monkeypox using several pretrained DL models, including VGG-16, ResNet50, and InceptionV3. ResNet50 achieves the highest overall accuracy. Authors in [26] proposed image data collection and implementation based on a DL model for detecting Monkeypox disease by using modified VGG16. The dataset was developed by gathering photos from various open-source and internet resources, providing a safer approach to utilizing and disseminating such data for developing and deploying any ML model. The modified VGG16 model was applied in two separate studies. According to their findings, this model correctly recognizes patients with Monkeypox disease with high accuracy for both studies. This model’s prediction and feature extraction helped to provide a deeper insight into specific features of the Monkeypox virus.

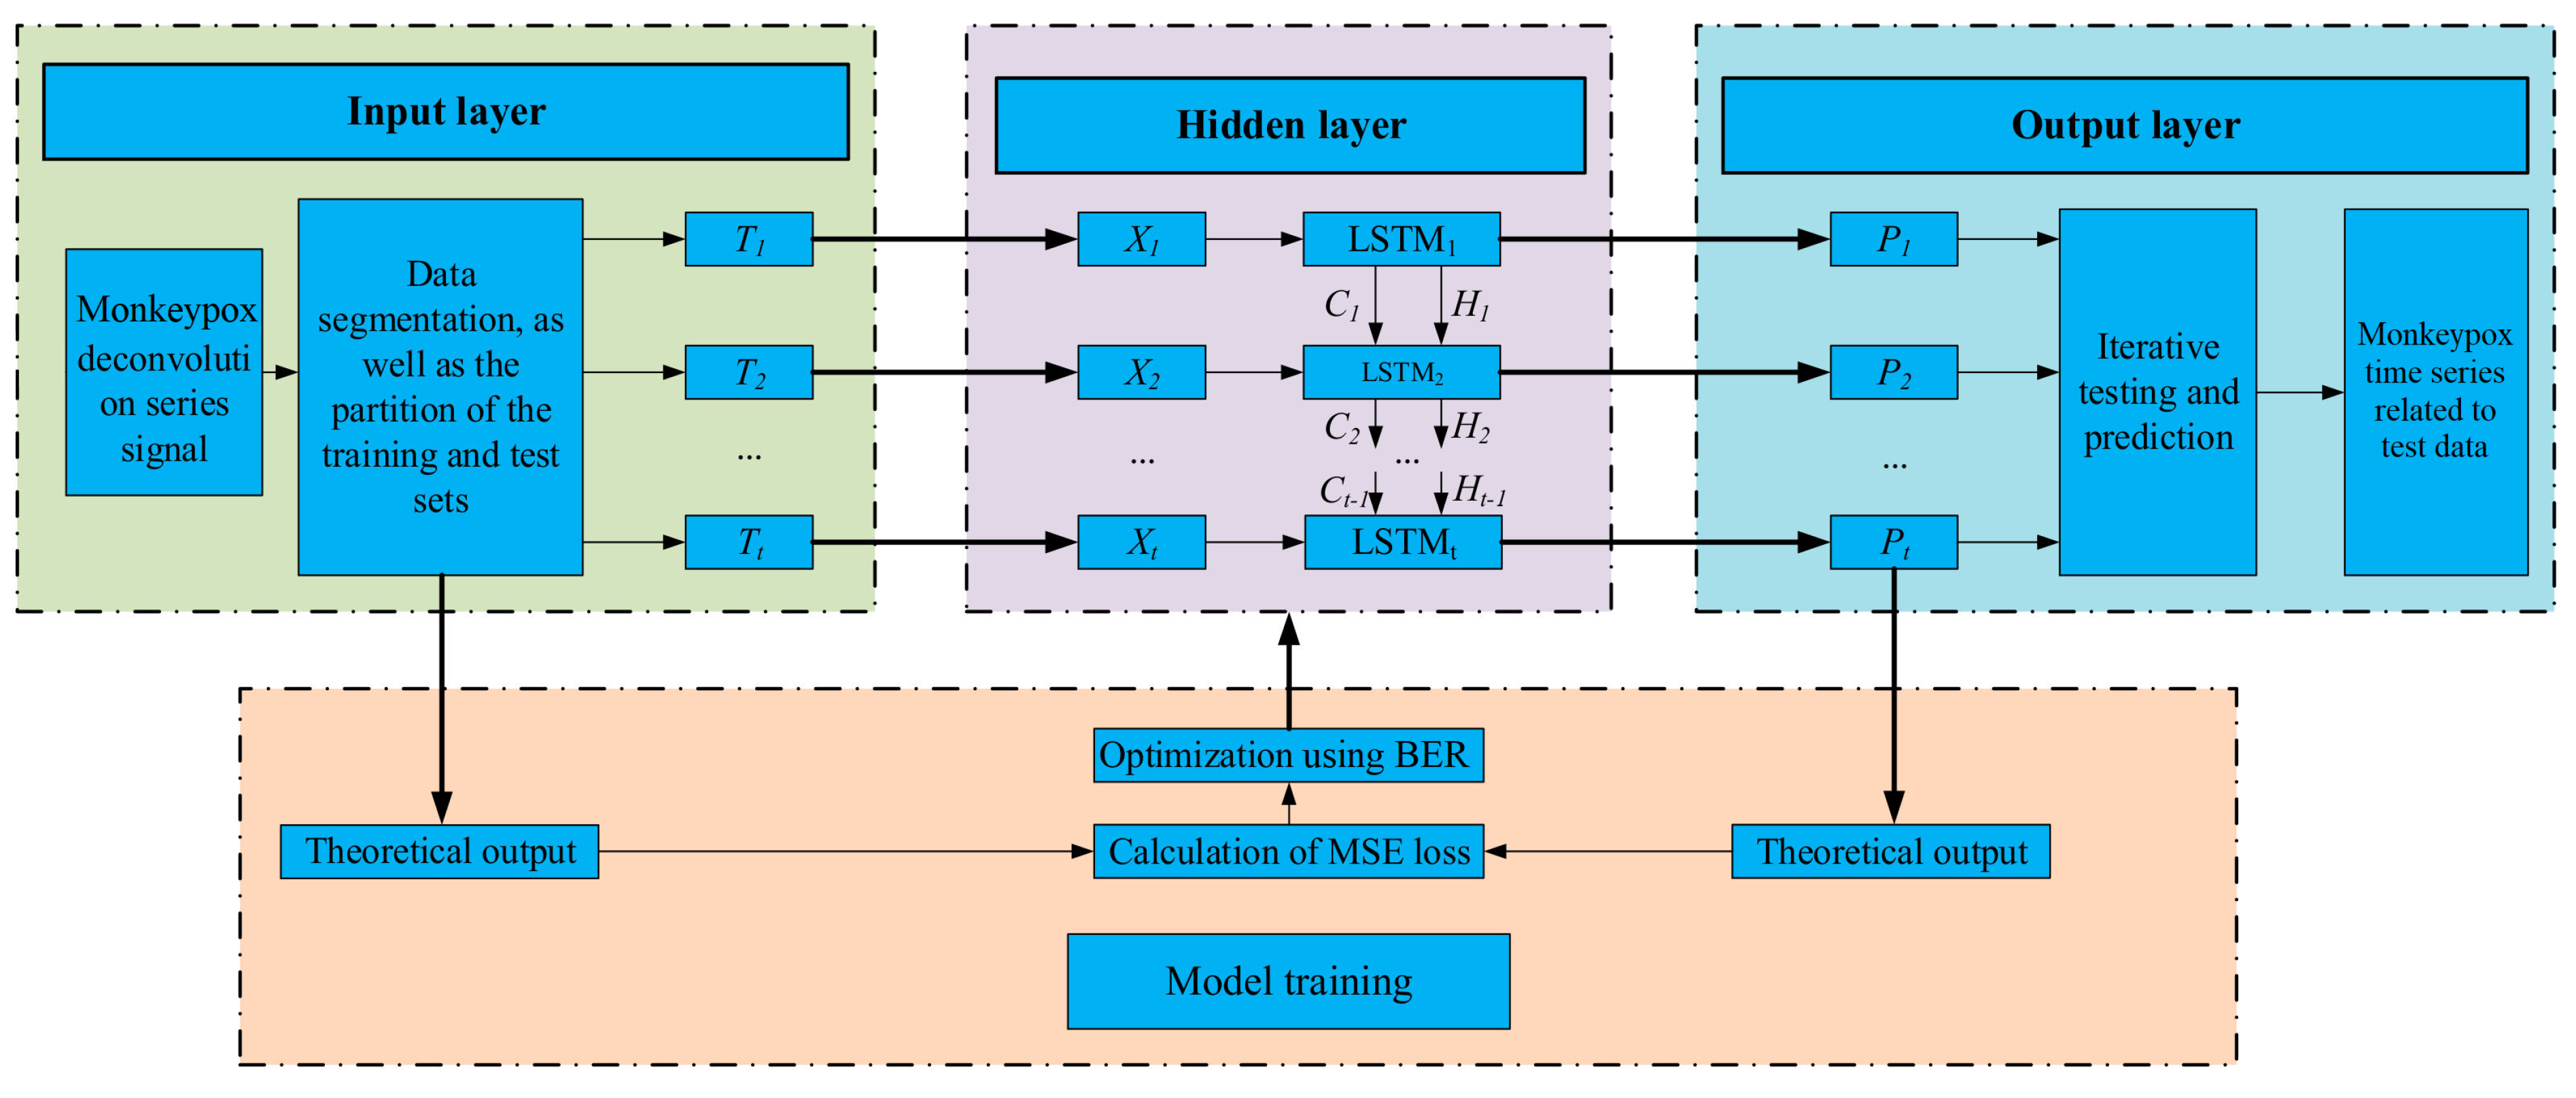
3. The Proposed Methodology

The LSTM-based neural network is an effective approach to handling time series. LSTM memory cells are responsible for facilitating efficient data transfer. Figure 1 depicts the overall framework of the LSTM prediction model developed in this paper, which consists of the following five functional modules: input layer, hidden layer, output layer, network training, and network prediction. This framework is developed by taking into account the data characteristics of finite sample points of Monkeypox infections time series and the design principle of simplifying the deep neural network. The LSTM cells are used to construct a single-layer neural network, which is then used to make predictions in the network’s output layer.
Once the prediction model has been specified, the optimizer is configured along with a loss function adoption to optimize the parameters of the LSTM model. The BER optimization algorithm is adopted to optimize the parameters of the LSTM model. Through the use of the loss function, the error values are calculated to control the fine-tuning of the model parameters. Once all of the settings have been adjusted, training data are collected in batches and fed into the model for analysis in iterations. Algorithm 1 provides the pseudocode for the proposed methodology.
Algorithm 1: The proposed prediction algorithm of Monkeypox confirmed cases.
1:
Input Monkeypox dataset
2:
Output Graph representing test and predicted values
3:
Prerequisites Import required libraries
4:
Globals:
E : Number of epochs
N : LSTM Network
G : TimeSeriesGenerator()
Batch size : N
split() : split given dataset into two parts
5:
D r e a d ( d a t a )
6:
K G ( t r a i n d a t a )
7:
L G ( t e s t d a t a )
8:
Initialize layers, input shape, optimizer, and loss function to define N
9:
for k = 1 to E do
10:
   Train(N, K)
11:
end for
12:
P p r e d i c t i o n s ( N , L )
13:
M e a n S q u a r e E r r o r ( t e s t d a t a , P )
14:
G r a p h ( t e s t d a t a , P )

3.1. LSTM

To represent a time series, recurrent neural networks (RNNs) have emerged as a popular choice. To better predict future states at the output layer, RNNs implement a context layer that works as memory. Elman RNNs have been used to describe temporal sequences and dynamical systems, despite being just one of several RNN designs. Getting started with RNN training has been difficult. RNNs have been trained using iterations of the backpropagation technique called backpropagation-through-time (BPTT). To achieve a more complex network design with states determined by time, BPTT uses gradient descent with backpropagation of error. The time-evolving RNN looks a lot like a multilayer perceptron with several discrete ”hidden“ layers. Learning long-term dependencies in the face of disappearing and exploding gradients has been a significant challenge for BPTT applied to basic RNNs. In response to this shortcoming, the LSTM network included a layer of hidden memory cells to improve its ability to recall the long-term dependencies [27]. As can be seen in Figure 2, the memory cells are useful for keeping track of the long-term relationships in data.
Traditional RNNs and LSTMs only use the context state from the past to predict the future. In contrast, bidirectional RNNs (BD-RNNs) process data in both ways by using two independent hidden layers that each transmit information to a single output layer. As a result, two separate RNNs are combined in order to provide both forward and backward sequence information at each time step. By repeatedly iterating the backward layer from t = T to t = 1 , and the forward layer from t = 1 to t = T , we are able to calculate the forward hidden sequence hf, the backward hidden sequence hb, and the output sequence y. Like BD-RNNs, BD-LSTM may retrieve long-term context or state from both directions. A number of practical sequence processing issues, including phoneme classification, continuous voice recognition, and speech synthesis, have benefited from the use of BD-LSTM networks since their first proposal for word embedding in natural language processing. Since it is important to keep track of future state information, BD-LSTM networks take data in two directions—forward, from the present to the future, and backward, from the future to the past—in order to do so. When the network is given two hidden states that are joined at any one time, it can store data from both the past and the future. The hidden state output h t is calculated in LSTM based on the following formulas:
f t = σ ( x t U f + h t 1 W f ) i t = σ ( x t U i + h t 1 W i ) C ^ t = t a n h ( x t U c + h t 1 W c ) o t = σ ( x t U o + h t 1 W o ) C t = σ ( f t C t 1 + i t C ^ t ) h t = t a n h ( C t ) o t
where at time t, i t denotes the input gate, f t denotes the forget gate, and o t denotes the output gate. The memory cell is referred to as c. The number of hidden units is denoted by h t , and the input feature count is x t . Learning also involves adjusting the bias b and weight matrices W and U. Keep in mind that the size of the concealed state determines the dimensions d h of each gate. In this context, C t refers to the present cell’s memory, while C ^ t stands for the intermediate cell state. Initial conditions at time zero are specified by C o = 0 and h o = 0 .

3.2. Al-Biruni Earth Radius Optimization Algorithm

It is the goal of optimization algorithms to find the best possible solution to a problem given limitations. When using the BER optimization algorithm, an individual from the population may be shown in the form of a S vector, S = S 1 , S 2 , . . . , S d R , where S d is the size of the search space and d is the parameter or feature in the optimization problem [28,29]. It is suggested that the fitness function F be utilized in order to assess a person’s performance up to a predetermined point. These steps of the optimization technique are used to search populations for an optimal vector S * that optimizes the fitness. The method begins by selecting a random group of people from the population (solutions). The fitness function, the lower and higher limits for each solution, the dimension, and the population size are all required before BER can begin the optimization process. The optimization algorithm used to optimize the parameters of LSTM is depicted in Algorithm 2.
Algorithm 2: BER optimization algorithm.
1:
Initialize BER population S i ( i = 1 , 2 , . . . , d ) with size d, iterations M a x i t e r , fitness function F n , t = 1 , BER parameters
2:
Calculate fitness function F n for each S i
3:
Find best solution as S *
4:
while  t M a x i t e r  do
5:
   for ( i = 1 : i < n 1 + 1 ) do
6:
     Update  r = h c o s ( x ) 1 c o s ( x )
7:
     Calculate  D = r 1 ( S ( t ) 1 )
8:
     Update positions to head toward best solution as
 
        S ( t + 1 ) = S ( t ) + D ( 2 r 2 1 )
9:
   end for
10:
   for ( i = 1 : i < n 2 + 1 ) do
11:
     Calculate  D = r 3 ( L ( t ) S ( t ) )
12:
     Update positions Elitism of best solution as
 
         S ( t + 1 ) = r 2 ( S ( t ) + D )
13:
     Calculate  k = 1 + 2 × t 2 M a x i t e r 2
14:
     Update positions Investigating area around best solution as
 
          S ( t + 1 ) = r ( S * ( t ) + k )
15:
     Compare  S ( t + 1 ) and S ( t + 1 ) to select best solution S *
16:
     if best fitness is not changed for last two iterations then
17:
        Mutate solution as S ( t + 1 ) = k z 2 h c o s ( x ) 1 c o s ( x )
18:
     end if
19:
   end for
20:
   Update the fitness function F n for each S i
21:
   Update BER parameters, t = t + 1
22:
end while
23:
Return  S *

3.2.1. Exploration Operation

Exploration is responsible for both identifying interesting regions of the search space and avoiding local optimum stagnation via forward progress towards the optimal solution, as will be explained more below.
  • Moving towards the best solution : Using this strategy, the lone explorer in the group will look for promising new areas to explore in the immediate vicinity of where it now is. This is achieved by iteratively looking for a better choice (in terms of fitness) among the many possible alternatives in the immediate area. To do so, the BER study makes use of the following equations:
    r = h c o s ( x ) 1 c o s ( x )
    D = r 1 ( S ( t ) 1 )
    S ( t + 1 ) = S ( t ) + D ( 2 r 2 1 )
    where 0 < x 180 , h is a number that is randomly selected from the range [ 0 , 2 ] , r 1 and r 2 are coefficient vectors whose values are measured by Equation (2), S ( t ) is the solution vector at iteration t, and D is the diameter of the circle in which the search agent will look for promising areas.

3.2.2. Exploitation Operation

It is the responsibility of the exploitation group to enhance already-in-place answers. At the end of each cycle, the BER algorithm determines who has the highest fitness and rewards them accordingly. Two distinct methods, described below, are used by the BER to accomplish the goal of exploitation.
  • Moving towards the best solution: To move in the direction of the best solution, the following equation is employed.
    S ( t + 1 ) = r 2 ( S ( t ) + D )
    D = r 3 ( L ( t ) S ( t ) )
    where r 3 is a random vector calculated using Equation (2) that controls the movement steps towards the best solution, S ( t ) is the solution vector at iteration t, L (t) is the best solution vector, and D refers to the distance vector.
  • Searching the area around the best solution: The area around the best answer is the most promising option (leader). This leads some people to look for improvements by exploring areas close to the optimal answer. The BER uses the following equation to carry out the aforementioned procedure.
    S ( t + 1 ) = r ( S * ( t ) + k )
    k = 1 + 2 × t 2 M a x i t e r 2
    where S * ( t ) refers to the best solution. After comparing S ( t + 1 ) and S ( t + 1 ) , the best solution S * can be selected. If the best fitness is not changed for the last two iterations, the solution is mutated by the following equation:
    S ( t + 1 ) = k z 2 h c o s ( x ) 1 c o s ( x )
    where z is a random number in the range [ 0 , 1 ] and t is the iteration number.

3.2.3. Selection of the Best Solution

The BER selects the best one to use in the following cycle to guarantee that the solutions are of high quality. However, multimodal functions may converge too quickly because of the elitism approach’s increased efficiency [30,31,32]. The BER provides outstanding exploration capabilities by using a mutation approach and looking around members of the exploration group. Strong exploration capabilities allow the BER to delay convergence. It is possible to see the BER pseudocode in Algorithm 2. We begin by feeding the BER some information, such as the population size, mutation rate, and the number of iterations. The BER then divides the participants into two groups: those who do exploratory work and those who do exploitative work. During the iterative process of finding the optimal solution, the BER algorithm dynamically adjusts the size of each group. Each team uses two methods to perform their tasks. In between iterations, the BER shuffles the order of the answers to guarantee variety and deep investigation. For example, a solution part of the exploration group in one iteration might move to the exploitation group in the next. The elitist approach taken by the BER ensures that the leader is not replaced during the process.

4. Experimental Results
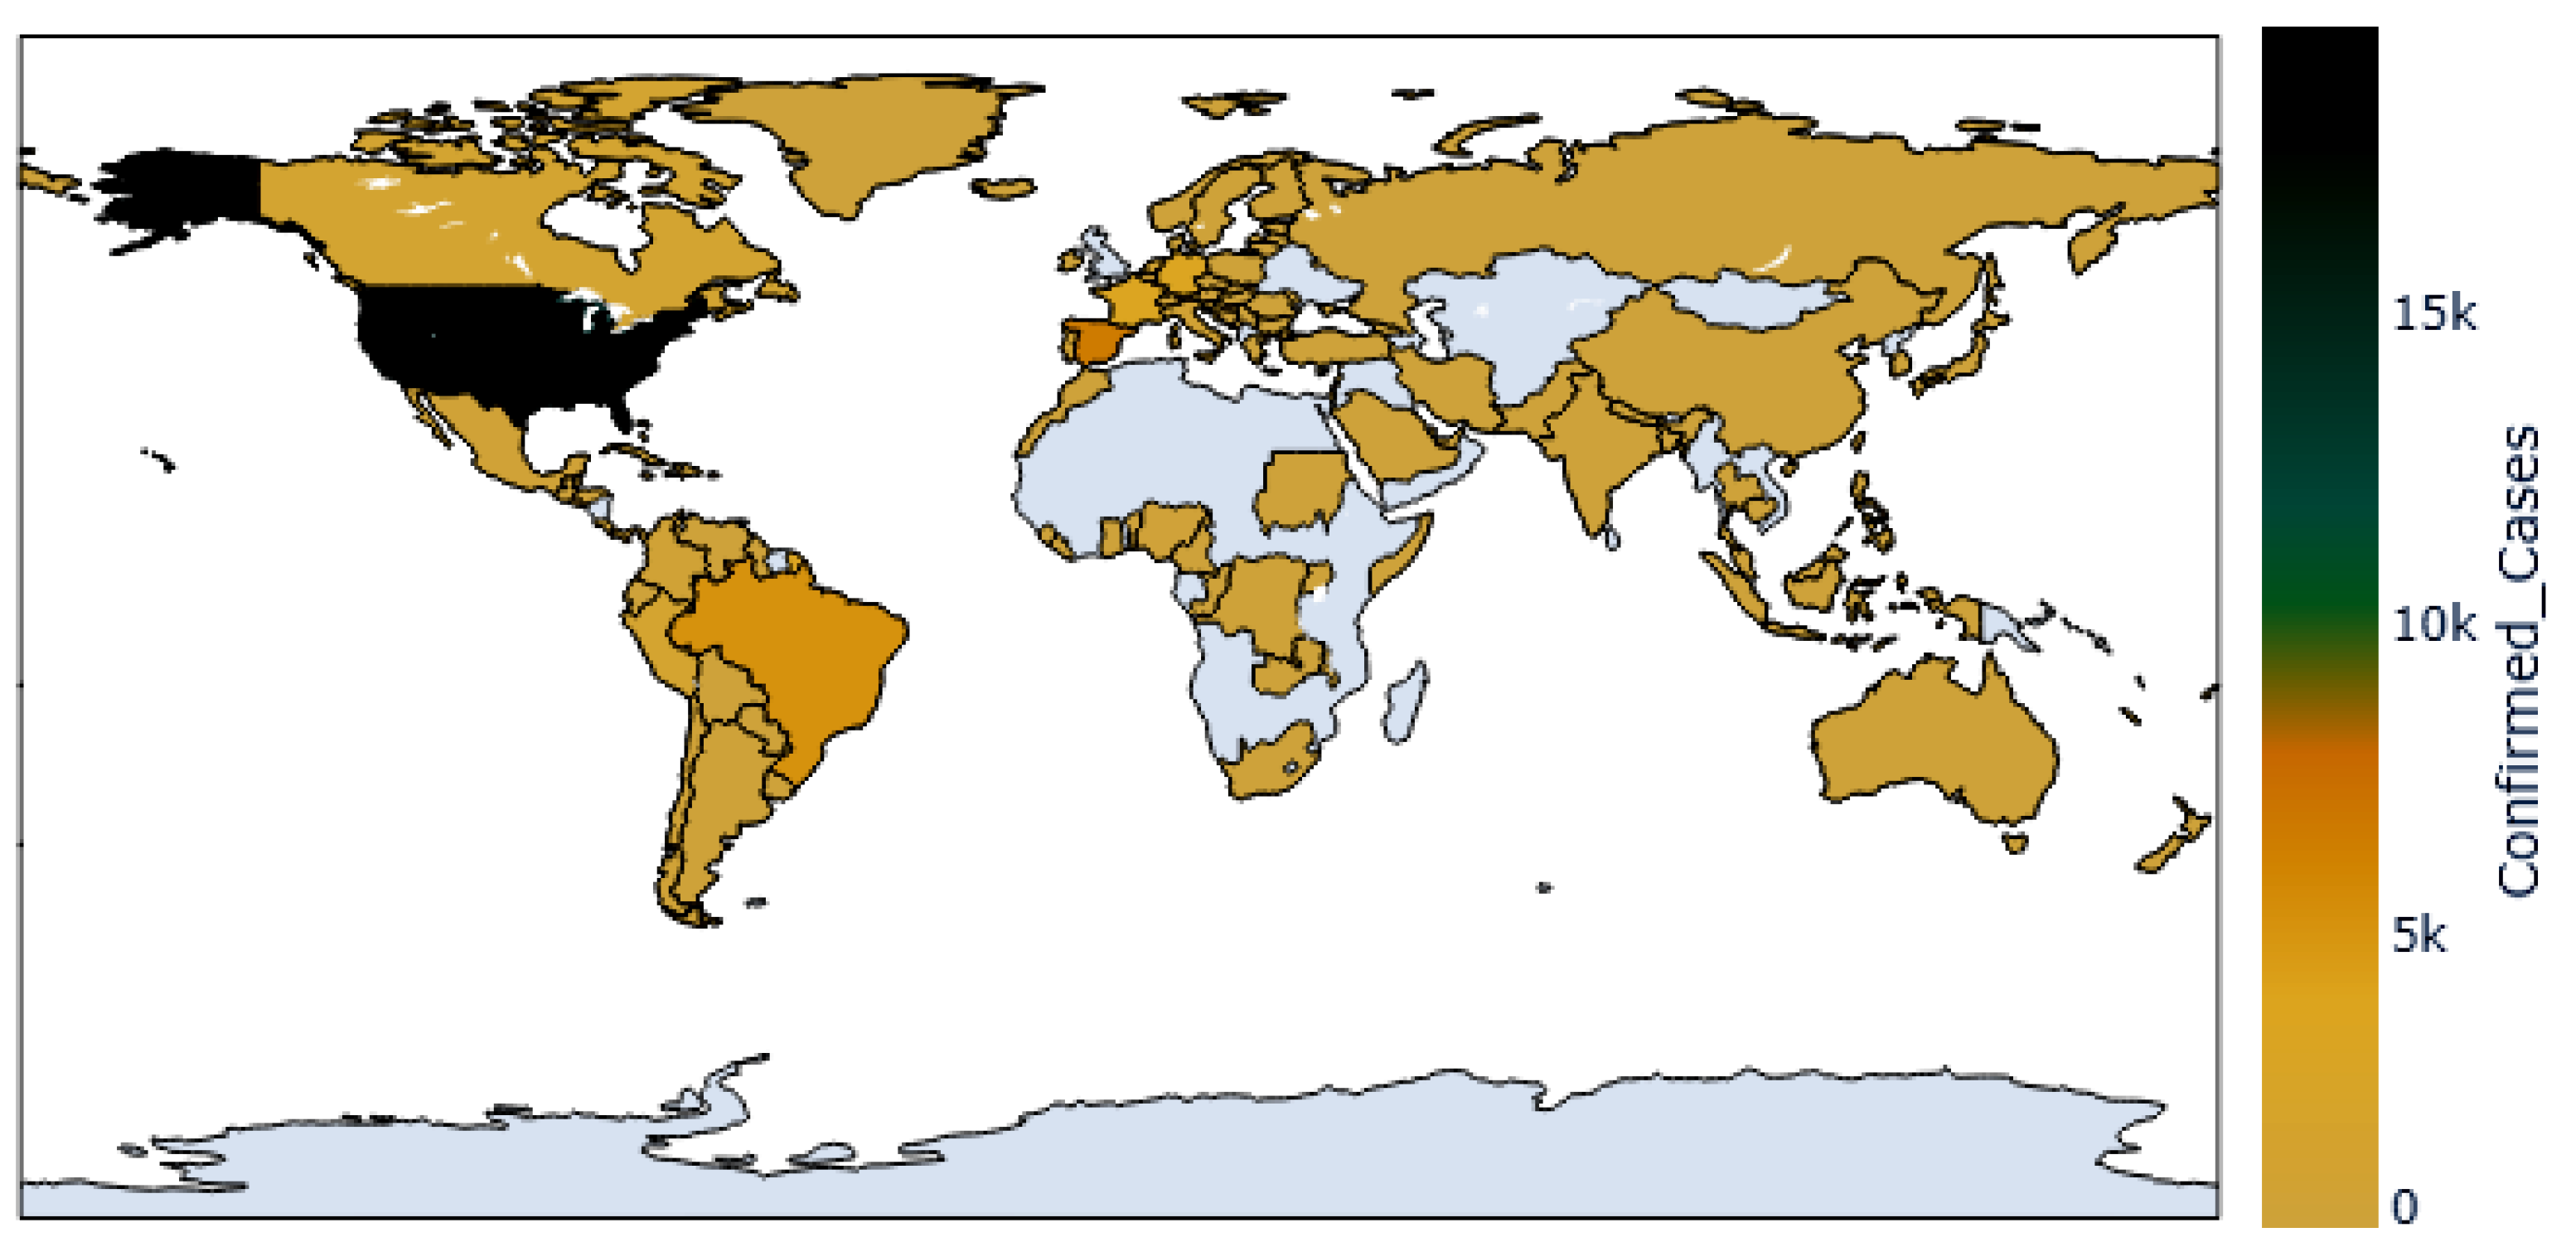
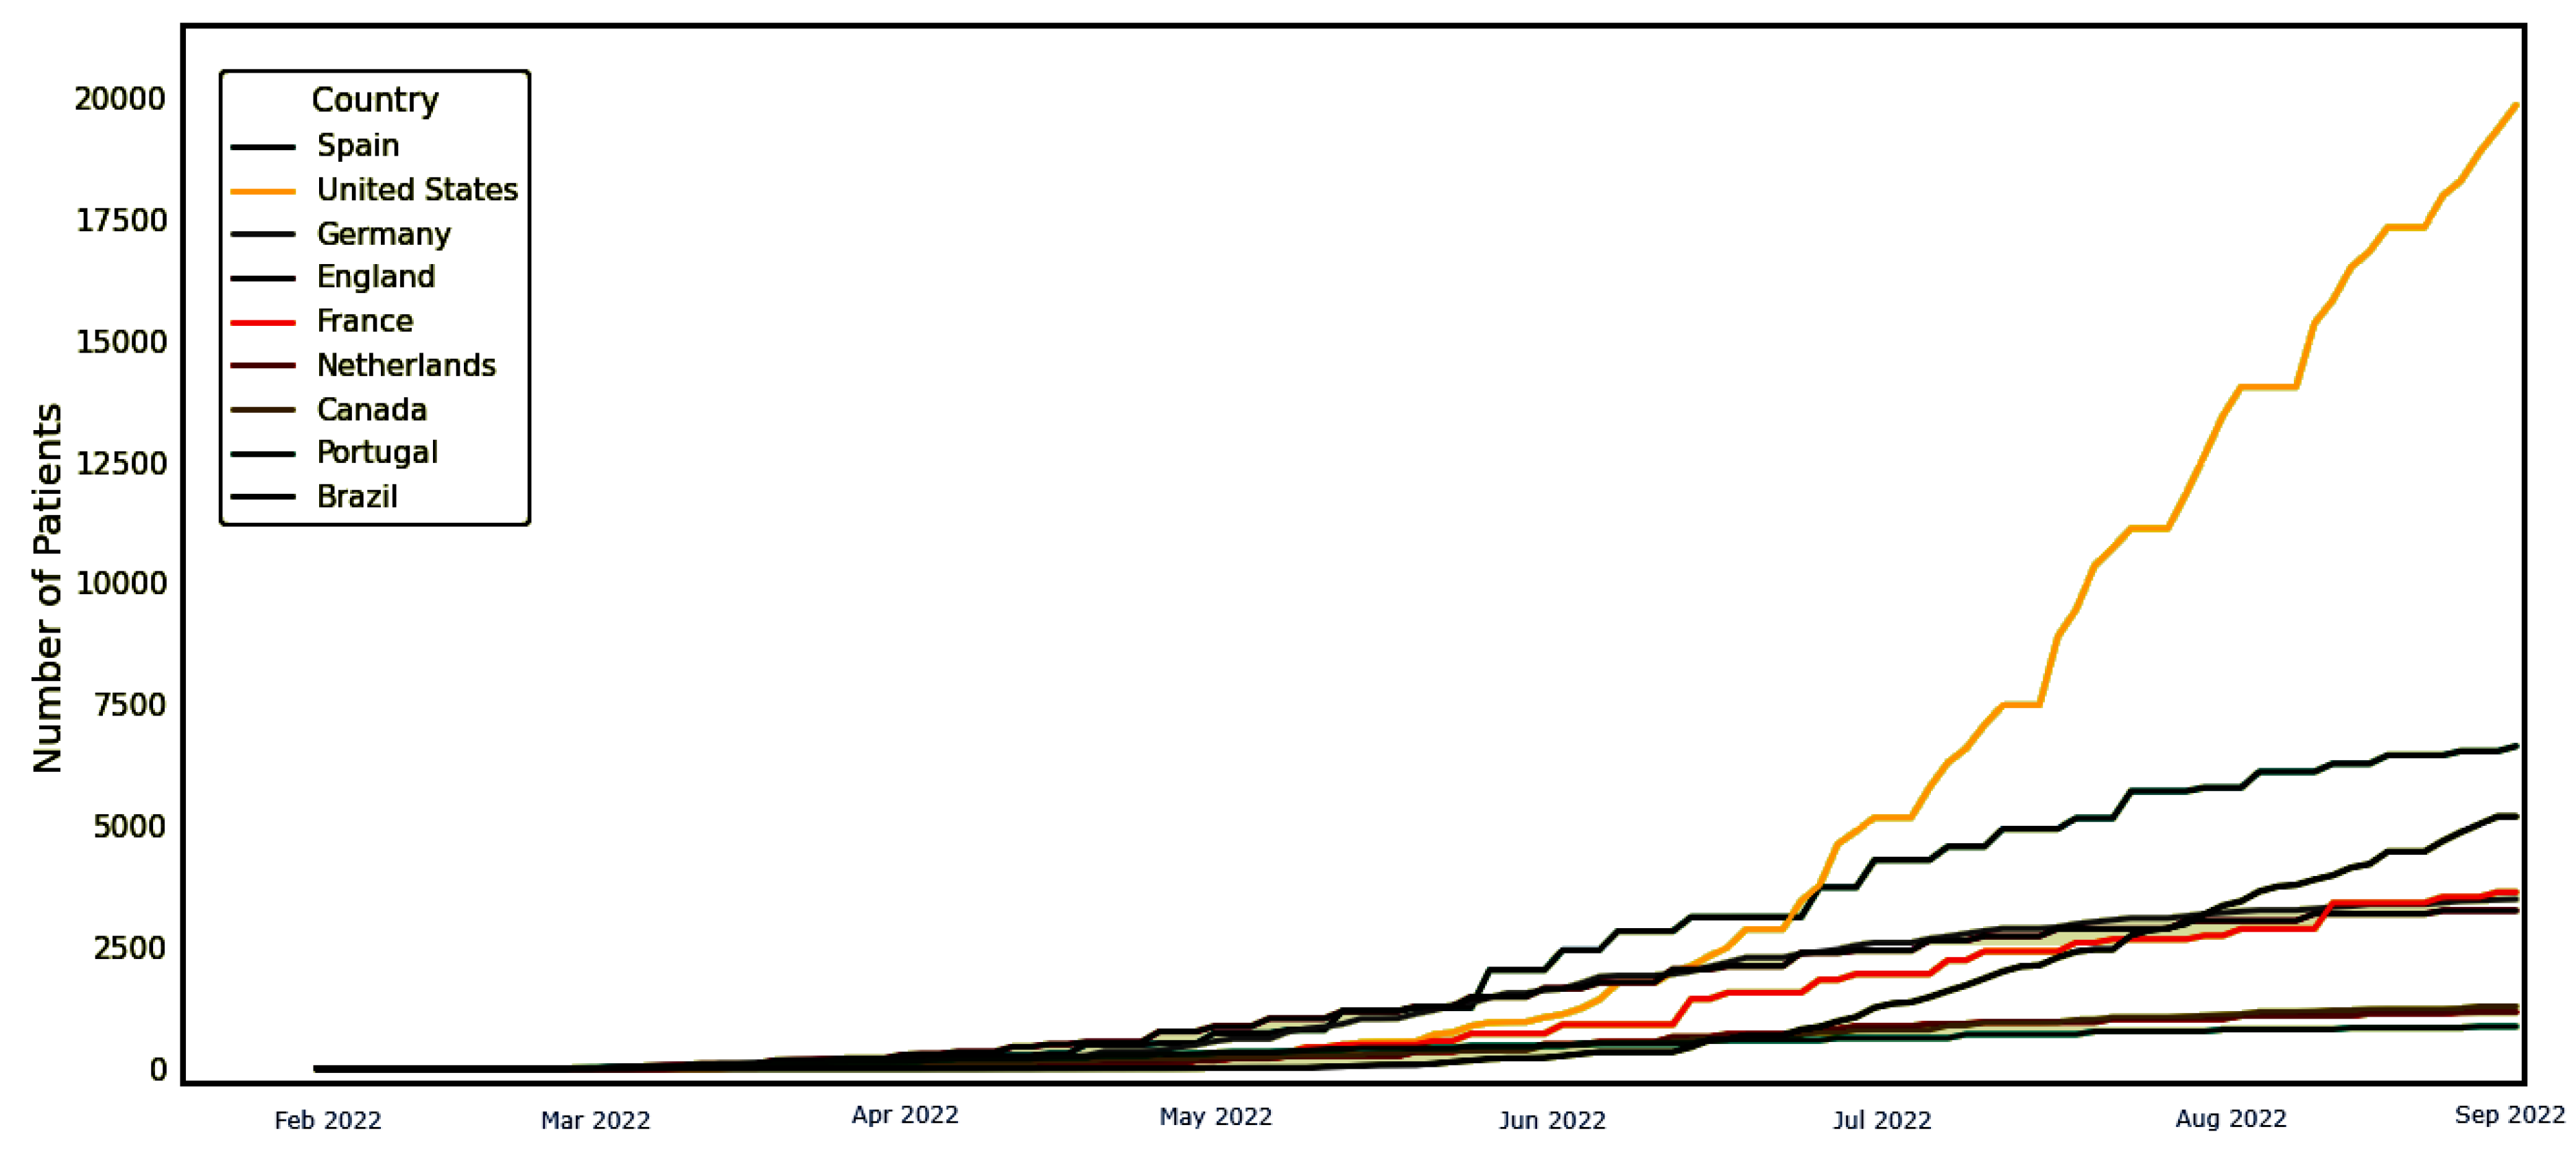
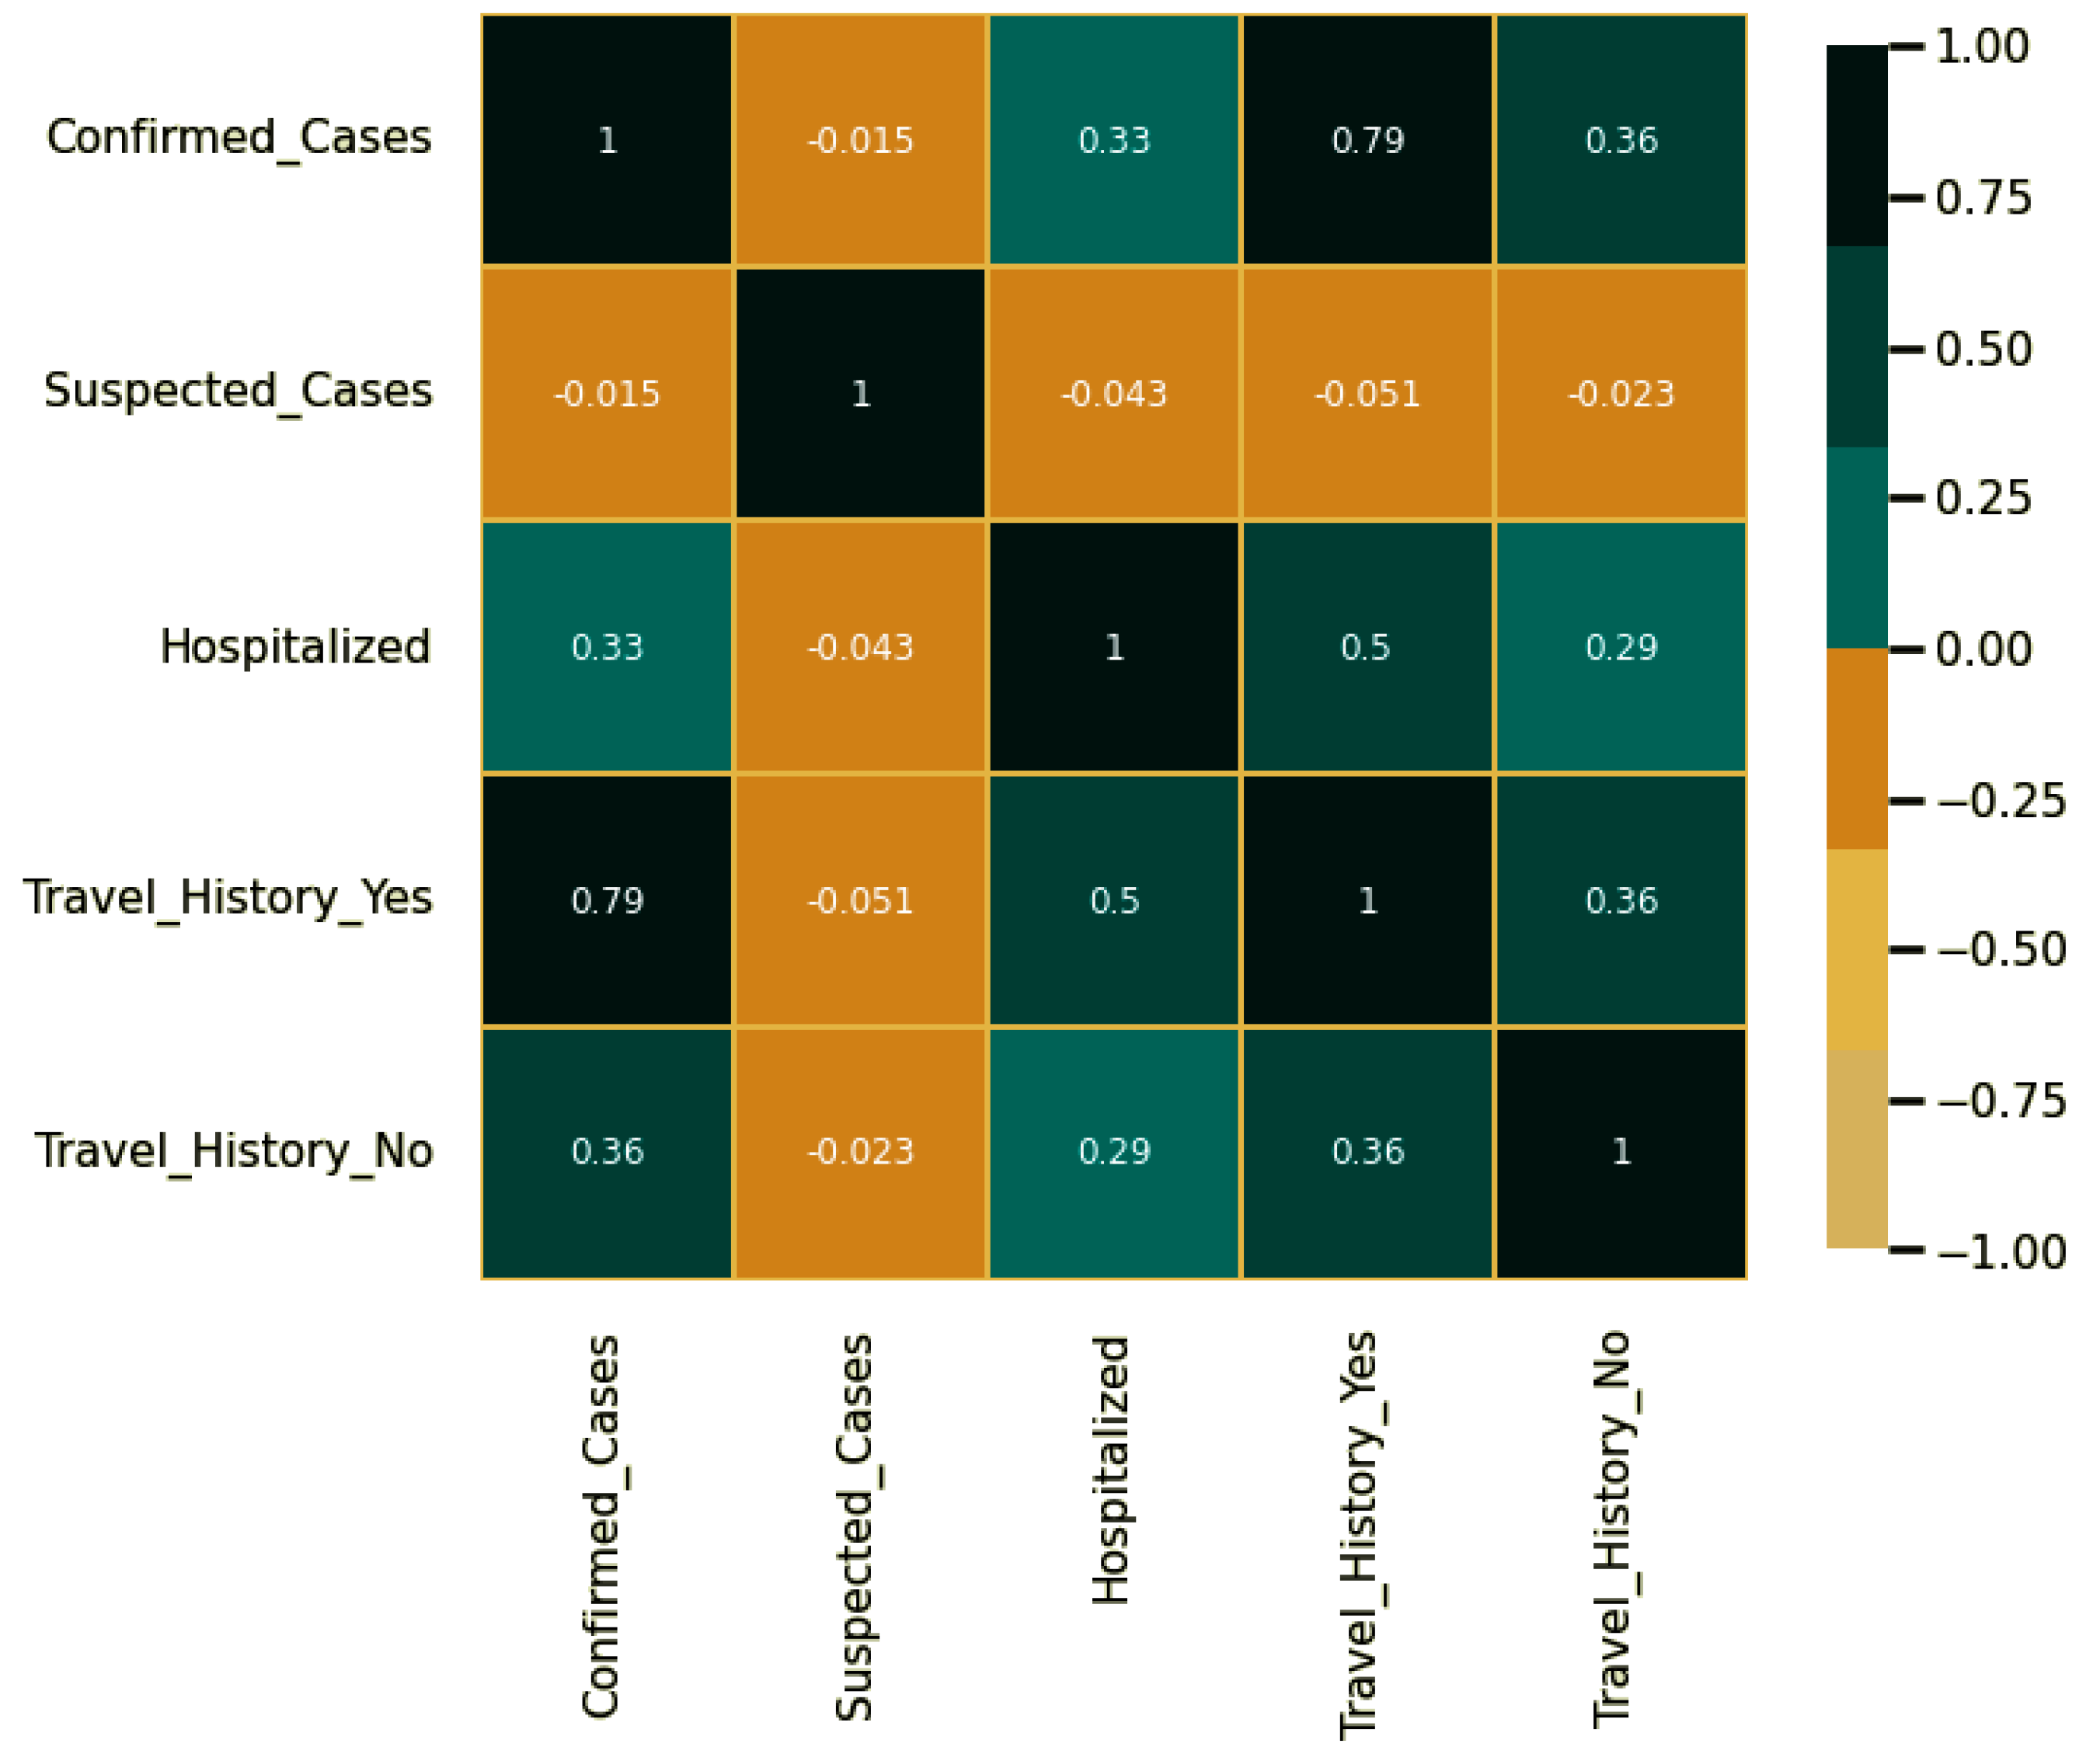
In this paper, we conducted a set of experiments to prove the effectiveness and superiority of the proposed BER-LSTM approach in predicting Monkeypox cases. To justify the achieved results, a set of ML models along with four optimization algorithms were incorporated into the conducted experiments. The next sections present the dataset employed in the conducted experiments, discuss the achieved results, and then conclude the established comparisons.
Platform hardware specifications for the experiments performed are as follows: Intel Core i7 CPU, GeForce RTX2070 Super GPU (graphics processing unit) with 8 GB of RAM, and 16 GB of DDR4 RAM for general processing and data storage. Platform is Ubuntu 20.04 with CUDA 9.0, Cudnn 7.1, TensorFlow 1.15, Spider IDE with Python 3.7, and so on for the software. In order to complete the model training process quickly, trials are run with a batch size ≥16.

4.1. Dataset

The dataset employed in the conducted experiments is publicly available on Kaggle [33]. The records of this dataset are updated daily to include the up-to-date confirmed cases around the world. Figure 3 shows the world map, with colored regions showing spread infections of the Monkeypox virus. In addition, the timeline shown in the plot in Figure 4 for the confirmed cases with respect to the date of the infections up to the date of writing this article. As shown in this plot, the number of confirmed cases is increasing, which demands an accurate prediction for helping governments to get ready with the necessary precautions.
On the other hand, the Pearson correlation of the features recorded in the dataset is shown in Figure 5. In this figure, there is a high correlation between the travel history and the number of confirmed cases, which indicates the relevant features that affect the accurate prediction of the confirmed cases.

4.2. Configuration Parameters

To assess the proposed approach and prove its superiority, four optimization algorithms were included in the conducted experiments to optimize the parameters of the LSTM-based deep network. The configuration parameters of these optimization algorithms, along with the proposed BER-based algorithm, are presented in Table 1. These parameters are used to setup the operation of each algorithm to achieve the best prediction results.

4.3. Optimization of Parameters in LSTM

In this work, we adopted the BER algorithm to optimize the parameters (including the number of hidden layers, hidden nodes, and the learning rate) of the neural network in the LSTM model. In the BER algorithm, we set the number of iterations as 500, the number of runs as 30, mutation probability as 0.5 , exploration percentage as 20, and K as 1. Figure 6 exhibits the objective function value at each iteration step, and the algorithm finds the best objective function value as 4.21 at the 15th iteration step. The set of upper bound and lower bound of the search area for the three parameters are presented in Table 2.

4.4. Evaluation Criteria

The evaluation of the proposed approach is performed in terms of the metrics listed in Table 3. This table presents the formulas used to calculate each metric. The metrics presented in the table are Root Mean Error (RMSE), Relative RMSE (RRMSE), Mean Absolute Error (MAE), Mean Bias Error (MBE), Pearson’s correlation coefficient (r), Nash Sutcliffe Efficiency (NSE), coefficient of determination (R2), determine agreement (WI), where N is the number of observations in the dataset, ( V n ^ ) and ( V n ) are the nth estimated and observed bandwidth, and ( V n ) and ( V n ^ ¯ ) are the arithmetic means of the observed and estimated values [38,39].

4.5. The Achieved Results

To evaluate the performance of the proposed approach, the evaluation metrics were calculated for the prediction results achieved by the proposed BER-LSTM model and six other models, namely, standard LSTM [41], bidirectional LSTM (BILSTM) [42], gated recurrent unit (GRU) [43], multiple LSTMs [44], multiple BILSTMs [42], and convolutional LSTMs (CONVLSTMs) [45]. The achieved results are presented in Table 4 using the training set. As shown in this table, the values of all metrics using the proposed approach outperform those achieved by the other six models. These results prove the superiority of the proposed approach over the standard approaches in predicting confirmed Monkeypox cases.
On the other hand, the achieved results using the testing set are presented in Table 5. The evaluated value of MSE, for instance, using the proposed approach is (480.53), whereas the best value of this metric using the other standard approaches was (503.24) based on the BILSTMs. Similarly, the achieved values of the different evaluation metrics using the proposed approach are better than those of the standard approaches when working on the testing set of the Monkeypox cases.
On the other hand, the proposed approach is studied from the statistical perspective, and the results are shown in Table 6. The python packages and programs used in this statistical analysis include SciPy, Matplotlib, OriginPro, and DataMelt, in addition to SPSS. For a fair comparison, the results presented in this table were calculated using the average of eight runs of the proposed approach, and the predictions of the results were analyzed. A total of 20 iterations for each run, M a x i t e r in Algorithm 2, is used to ensure the statistical significance of the proposed approach when compared with the other competing approaches in the ANOVA and Wilcoxon rank-sum tests. The proposed approach is compared with different algorithms, and the ANOVA test results are presented in Table 7 to determine the statistical significance of the differences between them. The dependent variable in the ANOVA test is RMSE. The hypothesis testing is formulated here using two hypotheses: the null hypothesis (H0: μ A = μ B = μ C = μ D = μ E ), where A is the BER-LSTM algorithm, B is the PSO-LSTM algorithm, C is the GWO-LSTM algorithm, D is the GA-LSTM algorithm, and E is the WOA-LSTM algorithm. The alternate hypothesis (H1: means are not all equal).
In addition, Wilcoxon’s rank-sum statistical analysis of the proposed algorithm in comparison with other algorithms is shown in Table 8. Hypothesis testing is formulated by two hypotheses: the null hypothesis (H0: μ BER - LSTM = μ PSO - LSTM , μ BER - LSTM = μ GWO - LSTM , μ BER - LSTM = μ GA - LSTM , and μ BER - LSTM = μ WOA - LSTM ); the alternate hypothesis (H1: means are not all equal). The dependent variable in the Wilcoxon’s rank-sum test is RMSE. This shows the superiority and indicates the statistical significance of the BER-LSTM algorithm; p-value < 0.05 demonstrating the significant superiority. Thus, the alternate hypothesis H1 is accepted.
When it comes to the reliability and effectiveness of the currently implemented features, regression testing bears the primary responsibility. To ensure that the proposed approach remains robust in terms of ongoing updates to the feature values, regression testing is performed after a series of updates to feature values. Modifications to the features might cause unintended consequences, such as broken features or reliance on a faulty dependency. The regression test results of the BER-LSTM with respect to compared methods are shown in Table 9. As shown in this table, the regression testing shows a reliable performance of the proposed BER-LSTM algorithm.
Tukey’s honest significant test (HSD), also known as the Tukey test, is a post hoc statistical test used to determine if there is a statistically significant difference between the means of two sets of data. Once an ANOVA has found a significant difference in the means of three or more sets of data, this test is carried out based on the standardized range distribution. The average RMSE with the Tukey test is shown in Figure 7. In this figure, the proposed approach could achieve the smallest value of RMSE, which reflects its effectiveness in predicting the Monkeypox cases robustly.
The visual plots depicted in Figure 8, on the other hand, highlight the performance of the proposed approach in predicting the Monkeypox cases. In this figure, four plots are shown, namely, residual, homoscedasticity, quartile–quartile (QQ), and heatmap plots. Typically, this is performed by charting the quantiles of each distribution and evaluating the differences between them. Distributions of QQ points are shown to roughly follow the straight line in the illustration. As a result, the linear relationship between the observed and predicted residuals supports the claimed effectiveness of the advised BER-LSTM. The depicted results confirm the superiority and effectiveness of the proposed approach.
The histogram of RMSE values for the BER-LSTM and compared algorithms is shown in Figure 9. A sample ROC curve based on the proposed BER-LSTM approach versus one of the competing approaches, namely, PSO-LSTM, is shown in Figure 10. This curve confirms the superiority and effectiveness of the proposed approach.
One more experiment was conducted to show the smooth convergence time of the algorithm parameters versus the other competing algorithms. The results of this experiment are depicted in Figure 11. These results confirm the superiority of the proposed algorithm in predicting the Monkeypox cases efficiently.

5. Conclusions

Using a publicly available and daily updated Monkeypox dataset, this research proposed a new approach to accurately predict the confirmed cases of Monkeypox infection. The proposed approach is based on optimizing the parameters of the LSTM-based deep network using the BER optimization algorithm. The better balance between exploration and exploitation of the BER algorithm allows for better optimization of the network parameters, thus achieving better performance. Eight evaluation criteria were considered to assess the performance of the proposed approach. The recorded values of these criteria show the effectiveness of the proposed approach. In addition, to prove the superiority of the proposed approach, six different ML models and four optimization methods were included in the conducted experiments. On the other hand, the statistical significance of the proposed approach was studied using ANOVA, Wilcoxon, and regression tests. The recorded results of these tests confirmed the proposed approach’s robustness, significance, and effectiveness. The limitation of the proposed approach is that when tested on a large dataset, the balance between exploration and exploitation processes of the optimization algorithm consumes time. This limitation is currently under investigation to be considered in future work on the BER optimization algorithm.

Author Contributions

Data curation, A.K.; Formal analysis, M.M.E., N.K. and A.A.A.; Investigation, A.H.A. and A.K.; Methodology, E.-S.M.E.-K.; Project administration, E.-S.M.E.-K. and S.M.; Resources, M.M.E., E.K., A.I., G.M.A., A.K. and D.S.K.; Software, M.M.E., E.-S.M.E.-K. and E.K.; Supervision, S.M.; Validation, N.K., E.K. and A.H.A.; Visualization, A.A.A., A.I. and G.M.A.; Writing—original draft, N.K., M.A., A.H.A. and D.S.K.; Writing—review & editing, S.M., A.A.A. and A.I. All authors have read and agreed to the published version of the manuscript.

Funding

Princess Nourah bint Abdulrahman University Researchers Supporting Project number (PNURSP2022R120), Princess Nourah bint Abdulrahman University, Riyadh, Saudi Arabia.

Acknowledgments

The authors would like to thank the Deanship of Scientific Research at Shaqra University for supporting this work.

Conflicts of Interest

The authors declare that they have no conflicts of interest to report regarding the present study.

References

  1. Banerjee, I.; Robinson, J.; Sathian, B. Global re-emergence of human monkeypox: Population on high alert. Nepal J. Epidemiol. 2022, 12, 1179–1181. [Google Scholar] [CrossRef] [PubMed]
  2. Rogers, J.V.; Parkinson, C.V.; Choi, Y.W.; Speshock, J.L.; Hussain, S.M. A Preliminary Assessment of Silver Nanoparticle Inhibition of Monkeypox Virus Plaque Formation. Nanoscale Res. Lett. 2008, 3, 129–133. [Google Scholar] [CrossRef] [Green Version]
  3. Alakunle, E.; Moens, U.; Nchinda, G.; Okeke, M.I. Monkeypox Virus in Nigeria: Infection Biology, Epidemiology, and Evolution. Viruses 2020, 12, 1257. [Google Scholar] [CrossRef]
  4. Breman, J.G.; Kalisa-Ruti, N.; Steniowski, M.V.; Zanotto, E.; Gromyko, A.I.; Arita, I. Human monkeypox, 1970–79. Bull. World Health Organ. 1980, 58, 165–182. [Google Scholar] [PubMed]
  5. Nguyen, P.Y.; Ajisegiri, W.S.; Costantino, V.; Chughtai, A.A.; MacIntyre, C.R. Reemergence of Human Monkeypox and Declining Population Immunity in the Context of Urbanization, Nigeria, 2017–2020. Emerg. Infect. Dis. 2021, 27, 1007. [Google Scholar] [CrossRef] [PubMed]
  6. Perkins, K.M.; Reddy, S.C.; Fagan, R.; Arduino, M.J.; Perz, J.F. Investigation of healthcare infection risks from water-related organisms: Summary of CDC consultations, 2014–2017. Infect. Control Hosp. Epidemiol. 2019, 40, 621–626. [Google Scholar] [CrossRef] [PubMed]
  7. Hill, B. The 2022 multinational monkeypox outbreak in non-endemic countries. Br. J. Nurs. 2022, 31, 664–665. [Google Scholar] [CrossRef]
  8. Miethke-Morais, A.; Cassenote, A.; Piva, H.; Tokunaga, E.; Cobello, V.; Rodrigues Gonçalves, F.A.; dos Santos Lobo, R.; Trindade, E.; Carneiro D’Albuquerque, L.A.; Haddad, L. COVID-19-related hospital cost-outcome analysis: The impact of clinical and demographic factors. Braz. J. Infect. Dis. 2021, 25, 101609. [Google Scholar] [CrossRef]
  9. Xu, L.; Magar, R.; Barati Farimani, A. Forecasting COVID-19 new cases using deep learning methods. Comput. Biol. Med. 2022, 144, 105342. [Google Scholar] [CrossRef]
  10. Annas, S.; Isbar Pratama, M.; Rifandi, M.; Sanusi, W.; Side, S. Stability analysis and numerical simulation of SEIR model for pandemic COVID-19 spread in Indonesia. Chaos Solitons Fractals 2020, 139, 110072. [Google Scholar] [CrossRef]
  11. El-Kenawy, E.S.M.; Ibrahim, A.; Mirjalili, S.; Eid, M.M.; Hussein, S.E. Novel Feature Selection and Voting Classifier Algorithms for COVID-19 Classification in CT Images. IEEE Access 2020, 8, 179317–179335. [Google Scholar] [CrossRef] [PubMed]
  12. For Alzheimer’s Disease Neuroimaging Initiative; Lee, G.; Nho, K.; Kang, B.; Sohn, K.A.; Kim, D. Predicting Alzheimer’s disease progression using multi-modal deep learning approach. Sci. Rep. 2019, 9, 1952. [Google Scholar] [CrossRef] [PubMed] [Green Version]
  13. Sharma, K.; Kaur, A.; Gujral, S. Brain Tumor Detection based on Machine Learning Algorithms. Int. J. Comput. Appl. 2014, 103, 7–11. [Google Scholar] [CrossRef]
  14. Agrawal, M.; Jain, V. Prediction of Breast Cancer based on Various Medical Symptoms Using Machine Learning Algorithms. In Proceedings of the 2022 6th International Conference on Trends in Electronics and Informatics (ICOEI), Tirunelveli, India, 28–30 April 2022; pp. 1242–1245. [Google Scholar] [CrossRef]
  15. Rabbi, M.F.; Mahedy Hasan, S.M.; Champa, A.I.; AsifZaman, M.; Hasan, M.K. Prediction of Liver Disorders using Machine Learning Algorithms: A Comparative Study. In Proceedings of the 2020 2nd International Conference on Advanced Information and Communication Technology (ICAICT), Dhaka, Bangladesh, 28–29 November 2020; pp. 111–116. [Google Scholar] [CrossRef]
  16. Swain, D.; Pani, S.K.; Swain, D. A Metaphoric Investigation on Prediction of Heart Disease using Machine Learning. In Proceedings of the 2018 International Conference on Advanced Computation and Telecommunication (ICACAT), Bhopal, India, 28–29 December 2018; pp. 1–6. [Google Scholar] [CrossRef]
  17. Zhu, W.; Sun, L.; Huang, J.; Han, L.; Zhang, D. Dual Attention Multi-Instance Deep Learning for Alzheimer’s Disease Diagnosis With Structural MRI. IEEE Trans. Med. Imaging 2021, 40, 2354–2366. [Google Scholar] [CrossRef]
  18. Chandra, M.M.G. Effective Heart Disease Prediction Using Hybrid Machine Learning Techniques. Int. J. Sci. Res. Eng. Manag. 2022, 6. [Google Scholar] [CrossRef]
  19. Wang, Z.; Zhu, X.; Adeli, E.; Zhu, Y.; Nie, F.; Munsell, B.; Wu, G. Multi-modal classification of neurodegenerative disease by progressive graph-based transductive learning. Med. Image Anal. 2017, 39, 218–230. [Google Scholar] [CrossRef] [Green Version]
  20. Wu, C.C.; Yeh, W.C.; Hsu, W.D.; Islam, M.M.; Nguyen, P.A.A.; Poly, T.N.; Wang, Y.C.; Yang, H.C.; Li, Y.C. Prediction of fatty liver disease using machine learning algorithms. Comput. Methods Programs Biomed. 2019, 170, 23–29. [Google Scholar] [CrossRef]
  21. Qin, J.; Chen, L.; Liu, Y.; Liu, C.; Feng, C.; Chen, B. A Machine Learning Methodology for Diagnosing Chronic Kidney Disease. IEEE Access 2020, 8, 20991–21002. [Google Scholar] [CrossRef]
  22. Khan, M.M.R.; Arif, R.B.; Siddique, M.A.B.; Oishe, M.R. Study and Observation of the Variation of Accuracies of KNN, SVM, LMNN, ENN Algorithms on Eleven Different Datasets from UCI Machine Learning Repository. In Proceedings of the 2018 4th International Conference on Electrical Engineering and Information & Communication Technology (iCEEiCT), Dhaka, Bangladesh, 13–15 September 2018; pp. 124–129. [Google Scholar] [CrossRef] [Green Version]
  23. Abdar, M.; Książek, W.; Acharya, U.R.; Tan, R.S.; Makarenkov, V.; Pławiak, P. A new machine learning technique for an accurate diagnosis of coronary artery disease. Comput. Methods Programs Biomed. 2019, 179, 104992. [Google Scholar] [CrossRef]
  24. Islam, T.; Hussain, M.A.; Chowdhury, F.U.H.; Islam, B.M.R. A Web-scraped Skin Image Database of Monkeypox, Chickenpox, Smallpox, Cowpox, and Measles. bioRxiv 2022. [Google Scholar] [CrossRef]
  25. Monkeypox Skin Images Dataset (MSID). Available online: https://www.kaggle.com/datasets/dipuiucse/monkeypoxskinimagedataset (accessed on 1 September 2022).
  26. Ahsan, M.M.; Uddin, M.R.; Farjana, M.; Sakib, A.N.; Momin, K.A.; Luna, S.A. Image Data collection and implementation of deep learning-based model in detecting Monkeypox disease using modified VGG16. arXiv 2022, arXiv:2206.01862. [Google Scholar] [CrossRef]
  27. Abdelhamid, A.A.; El-Kenawy, E.S.M.; Alotaibi, B.; Amer, G.M.; Abdelkader, M.Y.; Ibrahim, A.; Eid, M.M. Robust Speech Emotion Recognition Using CNN+LSTM Based on Stochastic Fractal Search Optimization Algorithm. IEEE Access 2022, 10, 49265–49284. [Google Scholar] [CrossRef]
  28. El-kenawy, E.S.M.; Abdelhamid, A.A.; Ibrahim, A.; Mirjalili, S.; Khodadad, N.; duailij, M.A.A.; Alhussan, A.A.; Khafaga, D.S. Al-Biruni Earth Radius (BER) Metaheuristic Search Optimization Algorithm. Comput. Syst. Sci. Eng. 2023, 1–18, in press. [Google Scholar] [CrossRef]
  29. Abdelhamid, A.A.; El-Kenawy, E.S.M.; Khodadadi, N.; Mirjalili, S.; Khafaga, D.S.; Alharbi, A.H.; Ibrahim, A.; Eid, M.M.; Saber, M. Classification of Monkeypox Images Based on Transfer Learning and the Al-Biruni Earth Radius Optimization Algorithm. Mathematics 2022, 10, 3614. [Google Scholar] [CrossRef]
  30. Nasser AlEisa, H.; El-kenawy, E.S.M.; Ali Alhussan, A.; Saber, M.; Abdelhamid, A.; Sami Khafaga, D. Transfer Learning for Chest X-rays Diagnosis Using Dipper Throated Algorithm. Comput. Mater. Contin. 2022, 73, 2371–2387. [Google Scholar]
  31. Eid, M.M.; El-kenawy, E.S.M.; Ibrahim, A. A binary Sine Cosine-Modified Whale Optimization Algorithm for Feature Selection. In Proceedings of the 2021 National Computing Colleges Conference (NCCC), Taif, Saudi Arabia, 27–28 March 2021; pp. 1–6. [Google Scholar]
  32. El-Kenawy, E.S.M.; Mirjalili, S.; Ghoneim, S.S.M.; Eid, M.M.; El-Said, M.; Khan, Z.S.; Ibrahim, A. Advanced Ensemble Model for Solar Radiation Forecasting Using Sine Cosine Algorithm and Newton’s Laws. IEEE Access 2021, 9, 115750–115765. [Google Scholar] [CrossRef]
  33. Rajasthan, J. Monkeypox. 2019. Available online: https://www.kaggle.com/datasets/deepcontractor/monkeypox-dataset-daily-updated (accessed on 7 September 2022).
  34. Awange, J.L.; Paláncz, B.; Lewis, R.H.; Völgyesi, L. (Eds.) Particle Swarm Optimization. In Mathematical Geosciences: Hybrid Symbolic-Numeric Methods; Springer International Publishing: Cham, Switzerland, 2018; pp. 167–184. [Google Scholar] [CrossRef]
  35. Mirjalili, S.; Mirjalili, S.M.; Lewis, A. Grey Wolf Optimizer. Adv. Eng. Softw. 2014, 69, 46–61. [Google Scholar] [CrossRef] [Green Version]
  36. Immanuel, S.D.; Chakraborty, U.K. Genetic Algorithm: An Approach on Optimization. In Proceedings of the 2019 International Conference on Communication and Electronics Systems (ICCES), Tamil Nadu, India, 17–17 July 2019; pp. 701–708. [Google Scholar] [CrossRef]
  37. Mirjalili, S.; Lewis, A. The Whale Optimization Algorithm. Adv. Eng. Softw. 2016, 95, 51–67. [Google Scholar] [CrossRef]
  38. El-Kenawy, E.S.M.; Mirjalili, S.; Alassery, F.; Zhang, Y.D.; Eid, M.M.; El-Mashad, S.Y.; Aloyaydi, B.A.; Ibrahim, A.; Abdelhamid, A.A. Novel Meta-Heuristic Algorithm for Feature Selection, Unconstrained Functions and Engineering Problems. IEEE Access 2022, 10, 40536–40555. [Google Scholar] [CrossRef]
  39. Abdel Samee, N.; El-Kenawy, E.S.M.; Atteia, G.; Jamjoom, M.M.; Ibrahim, A.; Abdelhamid, A.A.; El-Attar, N.E.; Gaber, T.; Slowik, A.; Shams, M.Y. Metaheuristic Optimization Through Deep Learning Classification of COVID-19 in Chest X-ray Images. Comput. Mater. Contin. 2022, 73, 4193–4210. [Google Scholar]
  40. Khafaga, D.S.; Alhussan, A.A.; El-Kenawy, E.S.M.; Ibrahim, A.; Eid, M.M.; Abdelhamid, A.A. Solving Optimization Problems of Metamaterial and Double T-Shape Antennas Using Advanced Meta-Heuristics Algorithms. IEEE Access 2022, 10, 74449–74471. [Google Scholar] [CrossRef]
  41. Hamayel, M.J.; Owda, A.Y. A Novel Cryptocurrency Price Prediction Model Using GRU, LSTM and bi-LSTM Machine Learning Algorithms. AI 2021, 2, 477–496. [Google Scholar] [CrossRef]
  42. Zhao, H.; Hou, C.; Alrobassy, H.; Zeng, X. Recognition of Transportation State by Smartphone Sensors Using Deep Bi-LSTM Neural Network. J. Comput. Netw. Commun. 2019, 2019, e4967261. [Google Scholar] [CrossRef]
  43. Yamak, P.T.; Yujian, L.; Gadosey, P.K. A Comparison between ARIMA, LSTM, and GRU for Time Series Forecasting. In Proceedings of the 2019 2nd International Conference on Algorithms, Computing and Artificial Intelligence (ACAI 2019), Sanya, China, 20–22 December 2019; Association for Computing Machinery: New York, NY, USA, 2019; pp. 49–55. [Google Scholar] [CrossRef]
  44. Alex, S.A.; Jhanjhi, N.; Humayun, M.; Ibrahim, A.O.; Abulfaraj, A.W. Deep LSTM Model for Diabetes Prediction with Class Balancing by SMOTE. Electronics 2022, 11, 2737. [Google Scholar] [CrossRef]
  45. Chang, V.; Bailey, J.; Xu, Q.A.; Sun, Z. Pima Indians diabetes mellitus classification based on machine learning (ML) algorithms. Neural Comput. Appl. 2022, 1–17. [Google Scholar] [CrossRef] [PubMed]
Figure 1. The proposed methodology.
Mathematics 10 03845 g001
Figure 2. The structure of a neural network based on LSTM cells.
Mathematics 10 03845 g002
Figure 3. The confirmed Monkeypox cases across the countries.
Mathematics 10 03845 g003
Figure 4. The timeline of the confirmed cases to the date of this article.
Mathematics 10 03845 g004
Figure 5. Pearson’s correlation of features.
Mathematics 10 03845 g005
Figure 6. Plot of the objective function values versus the number of iterations.
Mathematics 10 03845 g006
Figure 7. The average RMSE with Tukey test for the BER-LSTM and compared algorithms.
Mathematics 10 03845 g007
Figure 8. Visual analysis of the results achieved by the BER-LSTM and compared algorithms.
Mathematics 10 03845 g008
Figure 9. Histogram of RMSE values for the BER-LSTM and compared algorithms.
Mathematics 10 03845 g009
Figure 10. ROC curve for the BER-LSTM and PSO-LSTM algorithms.
Mathematics 10 03845 g010
Figure 11. Smoothness of convergence time of BER-LSTM parameters with respect to other methods.
Mathematics 10 03845 g011
Table 1. Configuration parameters of the competing algorithms.
AlgorithmParameterValue
Al-Biruni Earth Radius (BER)Iterations500
Number of runs30
Mutation probability0.5
Exploration percentage70
K (decreases from 2 to 0)1
Particle Swarm Optimization (PSO) [34]Acceleration constants[2, 12]
Inertia W m a x , W m i n [0.6, 0.9]
Particles10
Iterations80
Grey Wolf Optimizer (GWO) [35]a2 to 0
Iterations80
Wolves10
Genetic Algorithm (GA) [36]Cross over0.9
Mutation ratio0.1
Selection mechanismRoulette wheel
Iterations80
Agents10
Whale Optimization Algorithm (WOA) [37]r[0, 1]
Iterations80
Whales10
a2 to 0
Table 2. The optimized set of parameters of the LSTM model.
Learning RateHidden NodesHidden Layers
Lower bound 1 × 10 5 11
Upper bound 1 × 10 1 2010
Optimized values 3 × 10 2 72
Table 3. Performance evaluation metrics [40].
MetricValue
RMSE 1 N n = 1 N ( V n ^ V n ) 2
RRMSE R M S E n = 1 N V n ^ × 100
MAE 1 N n = 1 N | V n ^ V n |
NSE 1 n = 1 N ( V n V n ^ ) 2 n = 1 N ( V n V n ^ ¯ ) 2
MBE 1 N n = 1 N ( V n ^ V n )
R2 1 n = 1 N ( V n V n ^ ) 2 n = 1 N ( n = 1 N V n ) V n 2
WI 1 n = 1 N | V n ^ V n | n = 1 N | V n V n ¯ | + | V n ^ V n ^ ¯ |
r n = 1 N ( V n ^ V n ^ ¯ ) ( V n V n ¯ ) n = 1 N ( V n ^ V n ^ ¯ ) 2 n = 1 N ( V n V n ¯ ) 2
Table 4. Prediction results using the training set.
ModelMSERMSEMAER2RRMSErMBENSE
BER-LSTM (Proposed)646.4125.1416.390.71.330.84−3.750.65
LSTM655.3327.3118.60.591.660.8333.790.59
BILSTM704.6428.2820.680.551.380.827.030.55
GRU643.1527.0817.620.611.330.831.790.61
LSTMs618.2226.5717.510.631.30.850.50.63
BILSTMs637.826.9716.90.611.320.83−0.650.61
CONVLSTMs728.2828.7317.410.531.410.80.720.53
Table 5. Prediction results using the test set.
ModelMSERMSEMAER2RRMSErMBENSE
BER-LSTM (Proposed)480.5320.8215.250.731.360.830.060.61
LSTM586.0626.0919.240.451.4860.787.670.45
BILSTM670.6927.83220.351.580.7912.360.35
GRU519.4224.717.510.531.410.816.160.53
LSTMs568.0725.7518.230.471.470.744.490.47
BILSTMs503.2424.3416.720.551.390.814.120.55
CONVLSTMs571.0925.8118.150.461.520.722.980.46
Table 6. Statistical analysis of the achieved Monkeypox prediction results compared with the results achieved by the other approaches.
BER-LSTMPSO-LSTMGWO-LSTMGA-LSTMWOA-LSTM
Num. values88888
Range01.91.822.3
Maximum20.8222.823.123.924.2
Minimum20.8220.921.321.921.9
Mean20.8221.8922.3322.923.58
Median20.8221.922.322.923.9
Mean std. error00.17970.1790.1890.2769
Std. dev.00.50830.50640.53450.7833
25% Percentile20.8221.922.322.923.13
75% Percentile20.8221.922.622.924.05
Sum166.6175.1178.6183.2188.6
Table 7. Results of the one-way analysis of variance (ANOVA) test.
ANOVA TableSSDFMSF (DFn, DFd)p Value
Treatment (between columns)34.7748.694F (4, 35) = 30.74p < 0.0001
Residual (within columns)9.899350.2828--
Total44.6739---
Table 8. Results of Wilcoxon’s signed rank test for the BER-LSTM and compared algorithms.
μ BER - LSTM = μ PSO - LSTM μ BER - LSTM = μ GWO - LSTM μ BER - LSTM = μ GA - LSTM μ BER - LSTM = μ WOA - LSTM
p value (two tailed)0.00780.00780.00780.0078
Exact or estimate?ExactExactExactExact
Significant (alpha = 0.05)?YesYesYesYes
Table 9. Regression test results of the BER-LSTM with respect to compared methods.
PSO-LSTMGWO-LSTMGA-LSTMWOA-LSTM
GaussianAmbiguousAmbiguousAmbiguousAmbiguous
Best-fit values
Amplitude21.8922.3322.923.58
Mean  20.82  20.82  20.82  20.82
SD  2.465 × 10 32   2.465 × 10 32   2.465 × 10 32   2.465  × 10 32
95% CI (profile likelihood)
Std(Very wide)(Very wide)(Very wide)(Very wide)
Mean(Very wide)(Very wide)(Very wide)(Very wide)
Goodness of Fit
Degrees of Freedom5555
R squared0000
Sum of Squares1.8091.79524.295
Sy.x0.60150.59920.63250.9268
Constraints
SDSD > 0SD > 0SD > 0SD > 0
Publisher’s Note: MDPI stays neutral with regard to jurisdictional claims in published maps and institutional affiliations.

