Article

Electric Vehicle Fire Risk Assessment Based on WBS-RBS and Fuzzy BN Coupling

School of Resources and Safety Engineering, Central South University, Changsha 410083, China
*
Author to whom correspondence should be addressed.
Mathematics 2022, 10(20), 3799; https://doi.org/10.3390/math10203799
Submission received: 12 July 2022 / Revised: 26 August 2022 / Accepted: 12 October 2022 / Published: 14 October 2022

Abstract

:
(1) Background: In recent years, electric vehicle fire accidents have occurred frequently. Studying the risk factors leading to electric vehicle fire can take corresponding safety measures to reduce the occurrence of electric vehicle fire accidents. (2) Methods: The Work Breakdown Structure (WBS) was constructed to decompose the electric vehicle system, the Risk Breakdown Structure (RBS) was constructed to decompose the risk of electric vehicle fire accidents, a WBS-RBS coupling matrix was built to identify the risk factors that lead to electric vehicle fire accidents in the electric vehicle system, and the fuzzy Bayesian network was used to evaluate the risk of electric vehicle fire accidents. (3) Results: In this study, the electric vehicle was divided into four systems, and 15 risk factors leading to electric vehicle fire were found. The first risk factor was external collision ignition, followed by battery failure, artificial modification, battery-pack flooding, and charging equipment failure, and safety measures were proposed; (4) Conclusions: The results show that the WBS-RBS and fuzzy BN coupling research method can identify the risk factors leading to an electric vehicle fire, and the risk factors were ranked, providing a reference for the safety protection of electric vehicles.
MSC:
82-11

1. Introduction

With the development of the automobile industry, the energy and environmental problems caused by fuel vehicles are becoming more and more serious. The development of electric vehicles has become an important measure to improve the current problems all over the world. Especially under the current “carbon neutral” trend, the development of electric vehicles is an important measure. In the outline of the national medium and long-term scientific and technological development plan (2006–2020) and the guiding opinions on accelerating the promotion and application of new energy vehicles, China has proposed several tasks for the development of electric vehicles. In order to make the corresponding policies, the country has increased its investment in electric vehicles during the 13th five-year plan period and implemented the key projects of “new energy vehicles”. With the encouragement of relevant policies, the output and sales of electric vehicles in China have shown an overall upward trend. During the first “13th five-year plan” period (2016–2020), China produced about 5.19 million electric vehicles, as shown in Figure 1, and sold about 5.113 million electric vehicles. As shown in Figure 2, China’s market share of electric vehicles in these five years exceeded 50% of the global total. Although the rapid growth of the electric vehicle market share effectively reduces the pressure on energy and the environment, it also brings more and more electric vehicle fire accidents.
In order to reduce the risk of electric vehicle fire accidents, many scholars have researched electric vehicle fire accidents from different aspects. By focusing on the risk to the power supply system, Lao Zhongjian et al. [1] proposed to use of a multi-sensor to warn the power battery fire according to the early physical parameters (solid and gas) of power battery fire. Given the risk of thermal runaway diffusion of power batteries, lvzhiqiang et al. [2] analyzed the changes in battery temperature, voltage, and vehicle characteristics caused by different reasons. Gaoqing et al. [3] proposed spraying the liquid coolant directly on the surface of the power battery to reduce the temperature of the power battery and optimize the injection time, pulse injection duty cycle, injection frequency, etc. Chang Runze et al. [4] proposed using the pre-oxidized silk aerogel gel insulation layer to suppress the thermal runaway spread of the power battery. Given the risk of power battery flooding, Xinjiang et al. [5] proposed a power battery sealing the structure from the power battery box structure. By focusing on the collision risk of electric vehicles, Sunzhipeng et al. [6] explored the performance changes in power batteries after mechanical damage; Yujunwei [7] proposed a mechanical protective structure for the outer layer of the battery box; Huang Min et al. [8] proposed a crashworthy body structure topology with a clear force transmission path and uniform material distribution by integrating five collision conditions. By focusing on the risk of power battery charging, Zhang Yuanxing et al. [9] proposed a fault monitoring model during electric vehicle charging. Among foreign scholars regarding battery abuse, R. Spotnitz et al. [10] summarized the published descriptions of lithium-ion battery and module abuse tests and built various battery abuse behavior models. Finally, it was found that fluorinated binders played little role in battery thermal runaway. For the safety of the battery itself, Meike Fleischhammer et al. [11] used accelerated rate calorimetry (ARC) and synchronous thermal analysis (STA) to compare the safety behavior differences between the high-power 18650 lithium-ion batteries without aging and aging. The results show that the aging history has a great impact on the safety of the battery, and lithium plating on the battery anode greatly increases the risk of thermal runaway of the battery. For the charging safety of electric vehicles, the German ZSW Research Center [12] showed through the analysis of experimental data that the lithium dendrite formed in the battery during the charging process was the primary cause of thermal runaway of electric vehicle batteries. Van den Broek and Fabian et al. [13] believe that building the communication connection between electric vehicle charging stations can better improve the charging safety of electric vehicles.
The above research on the fire risk of electric vehicles is based on a single fault, exploring the causes of the fault and putting forward measures. However, there is no quantitative evaluation of the risk level of the fault, and there is no clear risk level for a single risk factor. It is impossible to compare the risk levels among various risk factors, and it is impossible for us to take measures against the risk factors according to the fault risk ranking. At the same time, when an electric vehicle accident occurs, we cannot check the major risk factors the first time and delay the progress of the accident investigation. Therefore, some scholars proposed using a quantitative risk assessment model to evaluate the fire risk factors of electric vehicles. Wang Xiaoqiang et al. [14] established a comprehensive evaluation system for the electrical, mechanical, and safety performance of electric vehicles by using the FAHP method and applied the evaluation system to evaluate the performance of a 50 kW off-board charger. The influence of the weight coefficient on the evaluation results was compared and analyzed, and the effectiveness of the evaluation system was verified by an example. Zhao Mingyu et al. [15] analyzed the risk factors such as personnel, equipment, and environment in the mechanical system and electrical system of the electric vehicle battery replacement station by establishing the grey correlation degree and grey entropy evaluation model and concluded that person has the greatest impact on the safety of the mechanical system, and equipment and personnel have a greater impact on the safety of the electrical system. Based on the fuzzy comprehensive evaluation method, Yin Aihua et al. [16] fuzzified the battery diagnosis parameters such as single voltage peak, voltage range, temperature peak, temperature range, and insulation resistance and established a fuzzy comprehensive evaluation model for the battery fault of electric vehicles. Through several groups of battery data with different energy states, the fault diagnosis model was verified by examples, and the results were analyzed, which proved the feasibility and accuracy of the diagnosis model. In terms of the whole vehicle, Abdurrahman et al. [17] conducted a comprehensive risk assessment of the electric vehicle from the aspects of braking safety, driving and steering safety, battery safety, electrical safety, and auxiliary system safety by using fuzzy AHP and expert scoring weight calculation method. The above risk assessment methods are limited to a certain part (such as studying the battery and charger of electric vehicles alone), or the assessment methods adopted are relatively simple (such as only using the AHP to assess the risk of electric vehicles). Electric vehicles are wholely composed of multiple systems. In order to better determine the main factors leading to electric vehicle fires, the research should start from the whole system, so it is necessary to propose a systematic and comprehensive fire risk assessment model for electric vehicles.
In terms of system risk identification, the WBS-RBS method is widely used in various fields. WBS refers to the Work Breakdown Structure, and RBS refers to the Risk Breakdown Structure. Combining WBS and RBS can decompose the whole project or system into a single sub-operation or subsystem and comprehensively identify the risk factors in the sub-operation or subsystem. For example, Zhenggang et al. [18] used the WBS-RBS method to identify the risks in the process of iron highway water combined transport of automobile parts, and Xie Jinhui et al. [19] used the WBS-RBS method to identify the risks in the process of water installation of umbilical cables. At the same time, the fuzzy Bayesian network structure, which combines fuzzy mathematics theory with a Bayesian network, has also played a successful role in the quantitative analysis of variables. Lu Ying et al. [20] used the fuzzy BN to predict the fire risk of the subway, Song Yinghua et al. [21] applied the fuzzy BN to study the business interruption risk of enterprises under the background of flood disaster, and Monidipa Das et al. [22] used the fuzzy BN to predict variable climate and flood disasters.
The WBS-RBS method and fuzzy BN have many successful applications in other fields, but there is no relevant research on the application of WBS-RBS and fuzzy BN to the fire risk analysis of electric vehicles. Therefore, the quantitative analysis method combining WBS-RBS structure and fuzzy Bayesian network was adopted in this study. On the one hand, WBS-RBS is used to comprehensively decompose the electric vehicle system and analyze the risk factors leading to the electric vehicle fire to ensure the comprehensiveness of the analysis. On the other hand, according to the risk factors obtained from the analysis, the electric vehicle fire accidents in recent years are counted, combined with expert comments, and used for Bayesian network quantitative analysis to reduce the subjectivity of the results in a single evaluation method. The specific method was to systematically decompose the electric vehicle through WBS (Work Breakdown Structure) and risk decompose the electric vehicle fire accident through RBS (Risk Breakdown Structure) to obtain the WBS-RBS coupling matrix of the electric vehicle fire accident and the risk factors leading to the electric vehicle fire. These risk factors were taken as nodes, the logical relationship among the risk factors was analyzed, the logical relationship between the risk factors was mapped and input into the Bayesian network, and the prior probability of the electric vehicle fire risk event based on the expert language evaluation and historical investigation data were obtained. Through the calculation of the Bayesian network, the importance of each risk was analyzed to clarify the sequence of risk events, the corresponding safety protection measures were proposed to reduce the risk of electric vehicle fire accidents, and some reference for future electric vehicle fire prevention was provided.

2. Materials and Methods

2.1. WBS-RBS Breakdown Structure

The WBS-RBS structure was first proposed and applied by American PMI experts [23]. WBS refers to the Work Breakdown Structure; that is, a task is divided into sub-tasks according to certain principles, and each sub-task is further divided into independent work packages until it cannot be divided [24]. RBS refers to the Risk Breakdown Structure, which is based on the risk management theory, and through the risk classification of the operation, the operation risk classification and the sub-operation risk classification can be obtained [25]. Through WBS and RBS analysis of the operating system, a WBS-RBS matrix can be formed, and the risk can be identified systematically and comprehensively by judging the risk of matrix elements. The analysis steps of the WBS-RBS method are as follows: build WBS → build RBS → build WBS-RBS matrix with the simplest operation of WBS as the matrix column and the lowest risk of RBS as the matrix row [26]. Among them, the intersection of rows and columns is a possible risk in the operation process. The WBS breakdown structure is shown in Figure 3, and the RBS breakdown structure is shown in Figure 4.
Through the analysis of combining the WBS breakdown and RBS breakdown of the project, a WBS-RBS cross-coupling matrix can be formed with the unit operation formed by WBS breakdown as the column and the sub-risks breakdown by RBS as the row. As shown in Figure 5, the point where the row and column intersect in the matrix is the possible risk in the operation process, where the number 1 indicates the existence of cross risk and the number 0 indicates the possibility of no cross risk [27].

2.2. Bayesian Network Model

Bayesian network, also known as a belief network [28], is a directed acyclic graph (DAG) model based on a network graph and combined with uncertain knowledge of probability theory, which is represented by t = < (Xi, T), p>, where (Xi, T) is the set of nodes in the directed acyclic graph, Xi is the combination of nodes, and T is the set of directed edges. It indicates that there is a dependency or causal relationship between related variables (the parent node points to the child node, the one without the parent node is called the root node, the one without the child node is called the leaf node, and there is independence between the child node and other unrelated nodes) [29]. BN can effectively express and handle the correlation and uncertainty of variables and use conditional probability to bring relevant information into the same network structure [30], which is more intuitive and closer to people’s thinking modes [31]. Compared with traditional fault tree, event tree analysis, and other methods, BN can realize not only two-way analysis but also perform common cause factor analysis [32], which is suitable for analyzing the risk of complex systems. Its theoretical basis is the Bayesian theorem and joint probability distribution, as shown in Equations (1)–(4).
For random events A and B:
P ( A B ) = P ( A ) P ( B | A )
P ( A B ) = P ( B ) P ( A | B )
According to Equations (1) and (2), the Bayes theorem can be obtained:
P ( A | B ) = P ( B | A ) P ( A ) P ( B )
where P(A|B) is the probability of event A when event B occurs, P(B|A) is the probability of event B when event A occurs, P(A) is the probability of occurrence of event A, and P(B) is the probability of occurrence of event B.
Joint probability distribution:
P ( x 1 , x 2 , x 3 , , x m ) = i = 1 m P ( x i | x 1 , x 2 , x 3 , , x i 1 )
According to the Bayesian network, the change value of the occurrence probability of the result event caused by the unit change in the occurrence probability of the probability change in each cause event can also be obtained, that is, the probability importance. As shown in Equation (5), the probability importance, the occurrence probability of the cause event, and the occurrence probability of the result event can be calculated by Equation (6), and the key importance of the basic event can be obtained; that is, the probability change rate of the occurrence of the cause event to the occurrence of the result event, which can characterize the impact of the cause event on the result event.
I P r x i = P ( x T = 1 | x i = 1 ) P ( x T = 1 | x i = 0 )
I C r x i = P ( x i = 1 ) [ P ( x T = 1 | x i = 1 ) P ( x T = 1 | x i = 0 ) ] P ( x T = 1 )
where xi is the cause event, xT is the result event, IPrXi is the probability importance of the cause event xi, ICrxi is the critical importance of causal event xi, 1 represents the occurrence of the event, and 0 represents the nonoccurrence of the event.
When the probability of occurrence of basic events is different, it is easier to change the events with a high probability of occurrence than the events with a low probability of occurrence. However, the importance of the probability of basic events does not reflect this, so it cannot reflect the importance of basic events in essence. The key importance combines the probability and sensitivity of the basic events themselves, so it can accurately reflect the importance of basic events. Therefore, this study used critical importance to accurately evaluate the results of basic events in Bayesian networks.

2.3. Construction of Fuzzy Bayesian Network

2.3.1. The Concept of Fuzzy Numbers

The fuzzy set theory was first proposed by American cybernetics expert L. A. Zadeh [33]. The fuzzy set refers to the set used to represent things with specific properties with unclear boundaries. Its basic idea is to flexibly activate the absolute membership relationship in the classical set, and the membership degree is no longer limited to taking 0 and 1 but can take any value between 0 and 1. Triangular fuzzy numbers and trapezoidal fuzzy numbers are commonly used. For triangular fuzzy numbers f(u, m, d), the membership function f(x) is shown in Equation (7).
F ( x ) = { 0 , x < u x u m u , u x < m x m m d , m x d 0 , x > d
where the λ cut set is fλ = [(mu)λ + u,(md)λ + d].
For trapezoidal fuzzy numbers f(u, m, d, k), the membership function f(x) is shown in Equation (8):
F ( x ) = { 0 , x < u x u m u , u x m 1 , m < x d k x k d , d < x k 0 , x > k
where the λ cut set is fλ = [(mu)λ + u,−(kd)λ + k].

2.3.2. Fuzzy Number Processing Based on Expert Weight

In some cases, for the fuzzy state where it is difficult to give specific values, language variables can be introduced to more intuitively express the expert evaluation results. Wickens [34] divided the occurrence probability of events into seven levels, which are very high (VH), high (H), high (FH), medium (M), low (FL), low (L), and very low (VL), and their fuzzy numbers and corresponding cut sets are shown in Table 1.
In order to make the evaluation results more fair and objective, the evaluation results of multiple experts are generally used. Therefore, the arithmetic average method was used for the evaluation results of multiple experts, and the evaluation results of n experts are shown in Equation (9).
P i = f i 1 + f i 2 + f i 3 + + f i n n
where fin refers to the evaluation result of the nth expert on the ith element, n refers to the number of experts, and Pi refers to the probability of occurrence of event i.

2.3.3. Fuzzy Number Solution

For the solution of fuzzy numbers, there is a barycentric method, full integral method, integral value method, etc. The integral value method is simple and easy to calculate. In this study, the integral value method was used to solve fuzzy numbers. The integral value method uses λ, the cut set solves the fuzzy number, and the specific calculation formula is shown in Equation (10).
I = α μ R ( P ) + ( 1 α ) μ L ( P )
where I is the defuzzification value, α is the optimistic coefficient, α ∈ [0,1]. When α is 0 and 1, I corresponds to the upper and lower bounds of the fuzzification value, respectively. When α is 0.5, I is the representative value of the P defuzzification value. μR(P) and μL(P) are the integral values of the left and right membership functions of the fuzzification value P, respectively. The calculation formula is shown in Equation (11) and Equation (12), respectively.
μ R ( P ) = 1 2 [ λ = 0.1 1 m λ Δ λ + λ = 0 0.9 m λ Δ λ ]
μ L ( P ) = 1 2 [ λ = 0.1 1 n λ Δ λ + λ = 0 0.9 n λ Δ λ ]
where mλ and nλ are the upper and lower bounds of the cut set of fuzzy number P; λ is 0, 0.1, 0.2,…, 0.9; Δλ is 0.1.

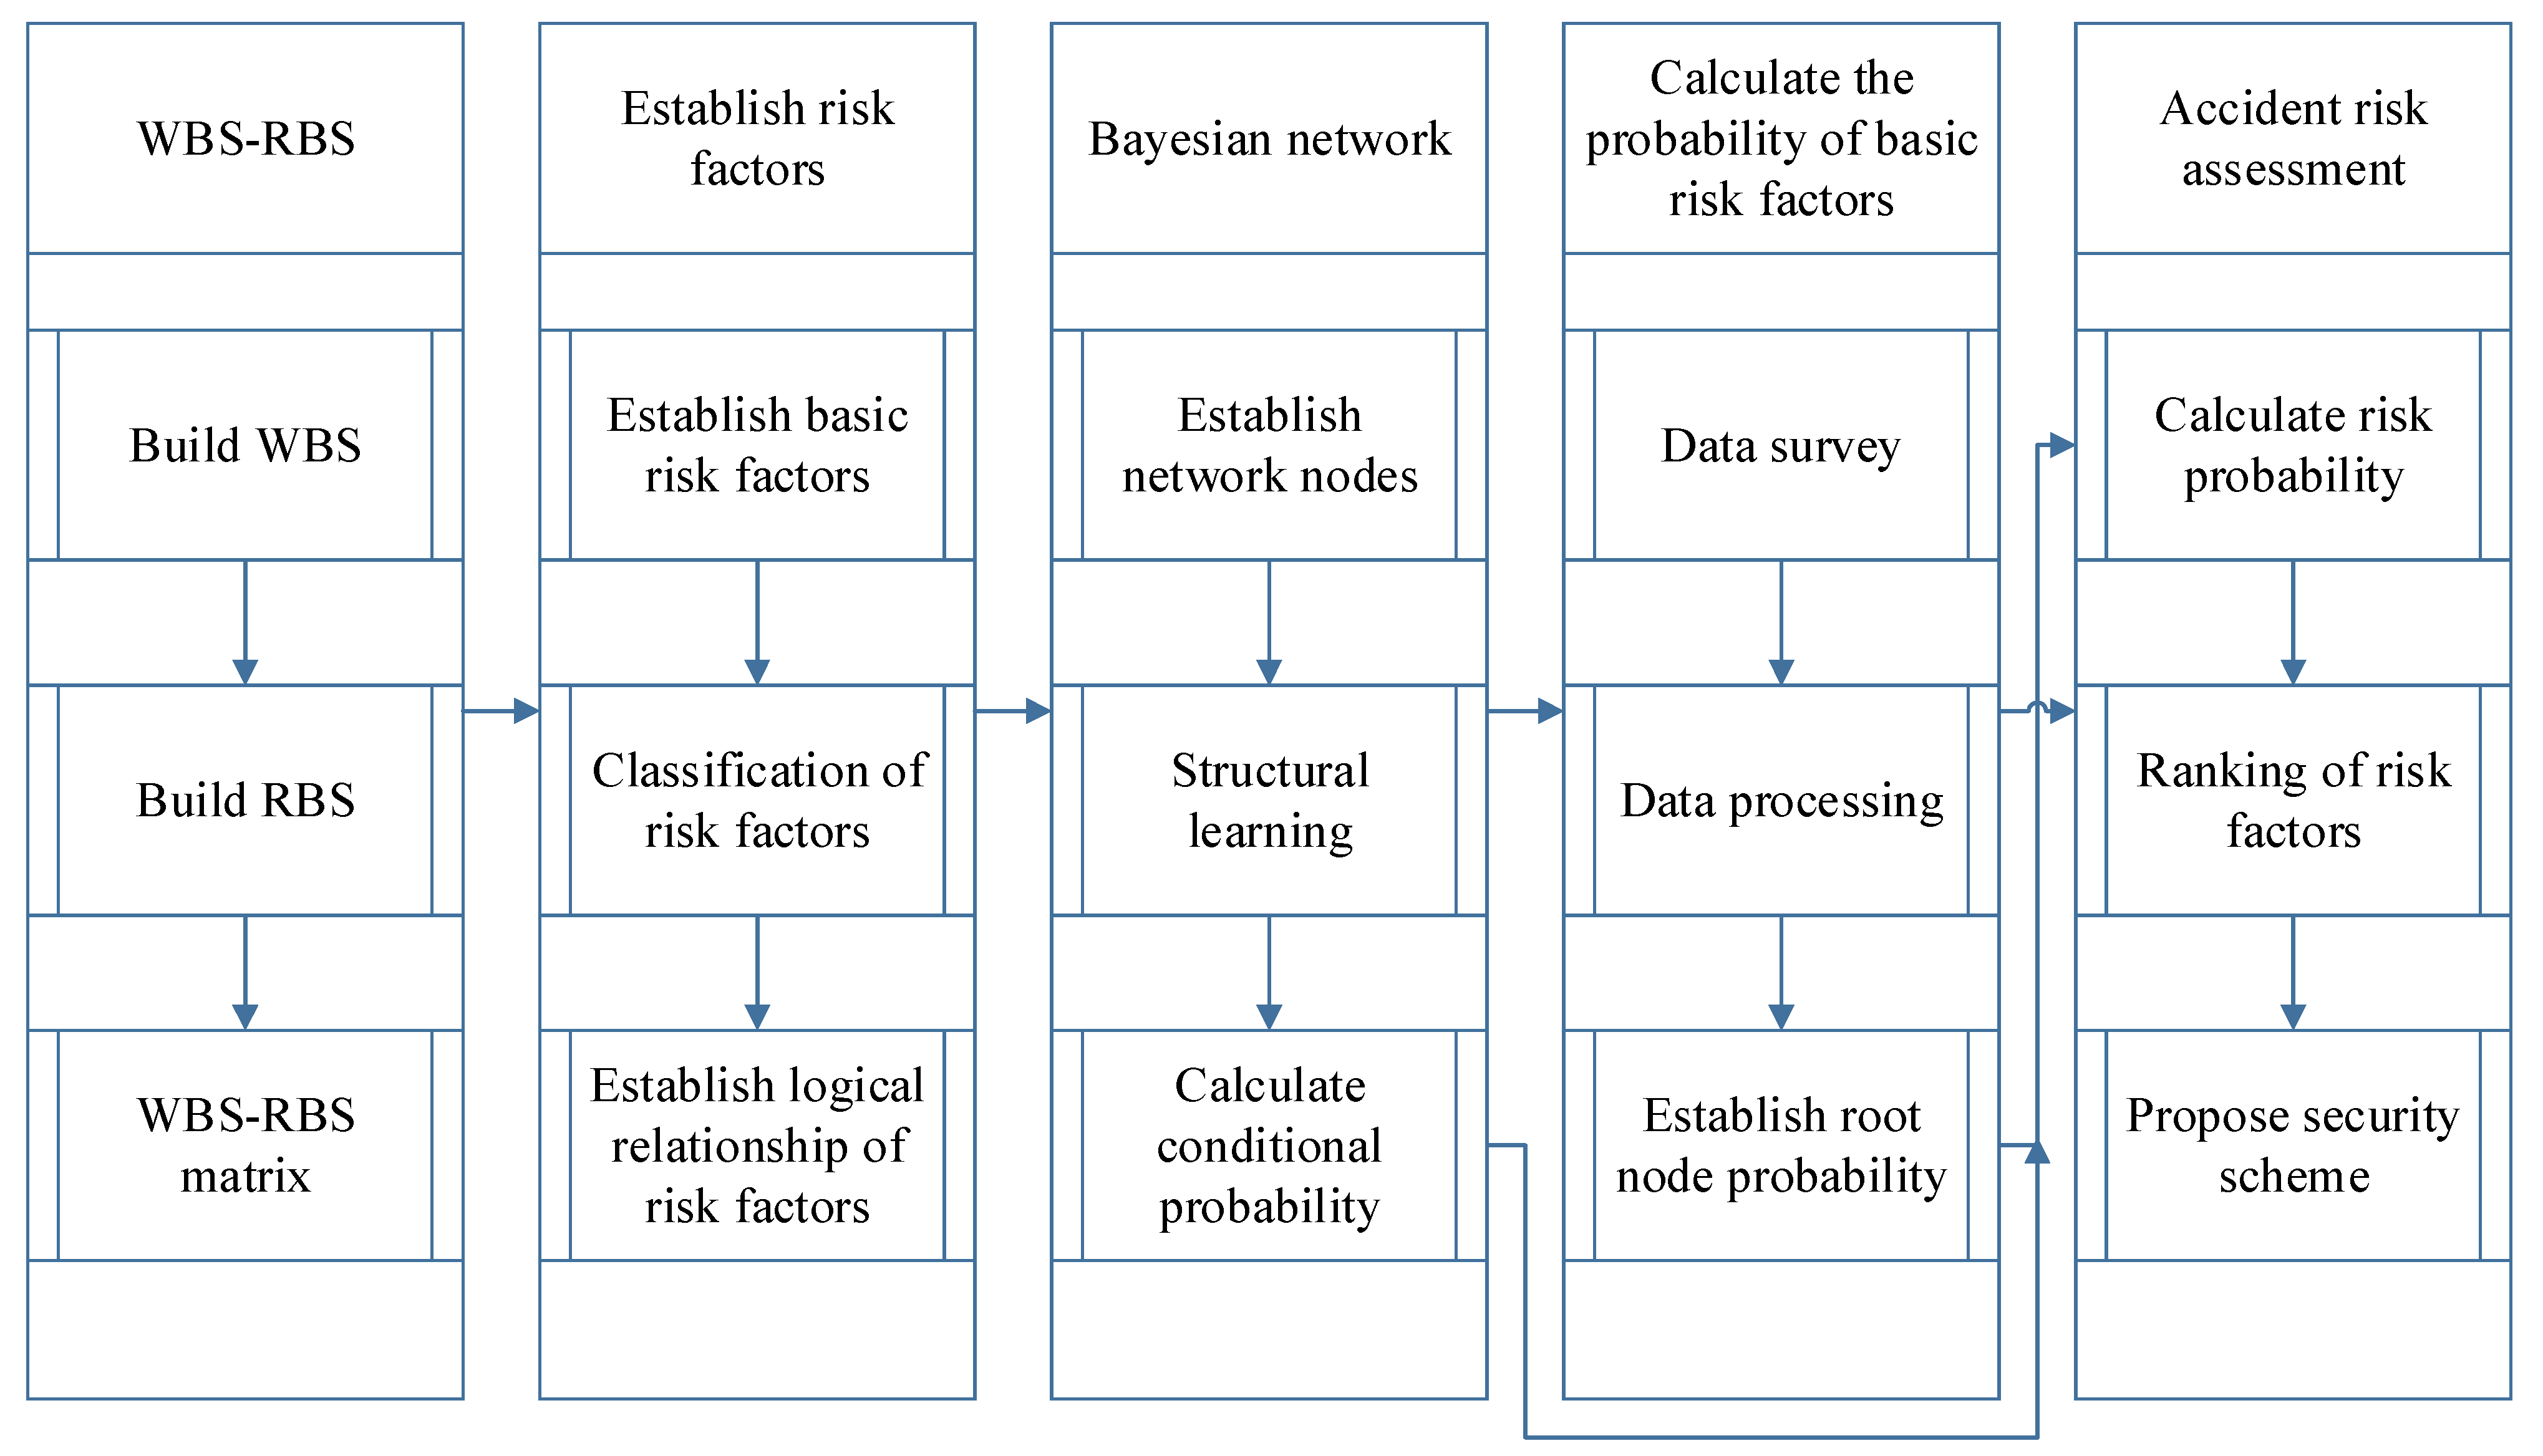
2.4. WBS-RBS-BN Analysis Process

When using the WBS-RBS analysis method alone, it is easy to be affected by subjective factors, resulting in too subjective and biased analysis results. The results are not objective and clear enough. When using the WBS-RBS-BN quantitative analysis model, combining the WBS-RBS analysis structure and Bayesian network can reduce the project risk analysis error as much as possible [35], and the objective ranking of the sensitivity of the project risk factors can be obtained to formulate the safety plan better. The analysis steps of the WBS-RBS and BN coupling analysis model are as follows:
(1)
Collect information and be familiar with the composition and operation mode of each major system of the electric vehicle;
(2)
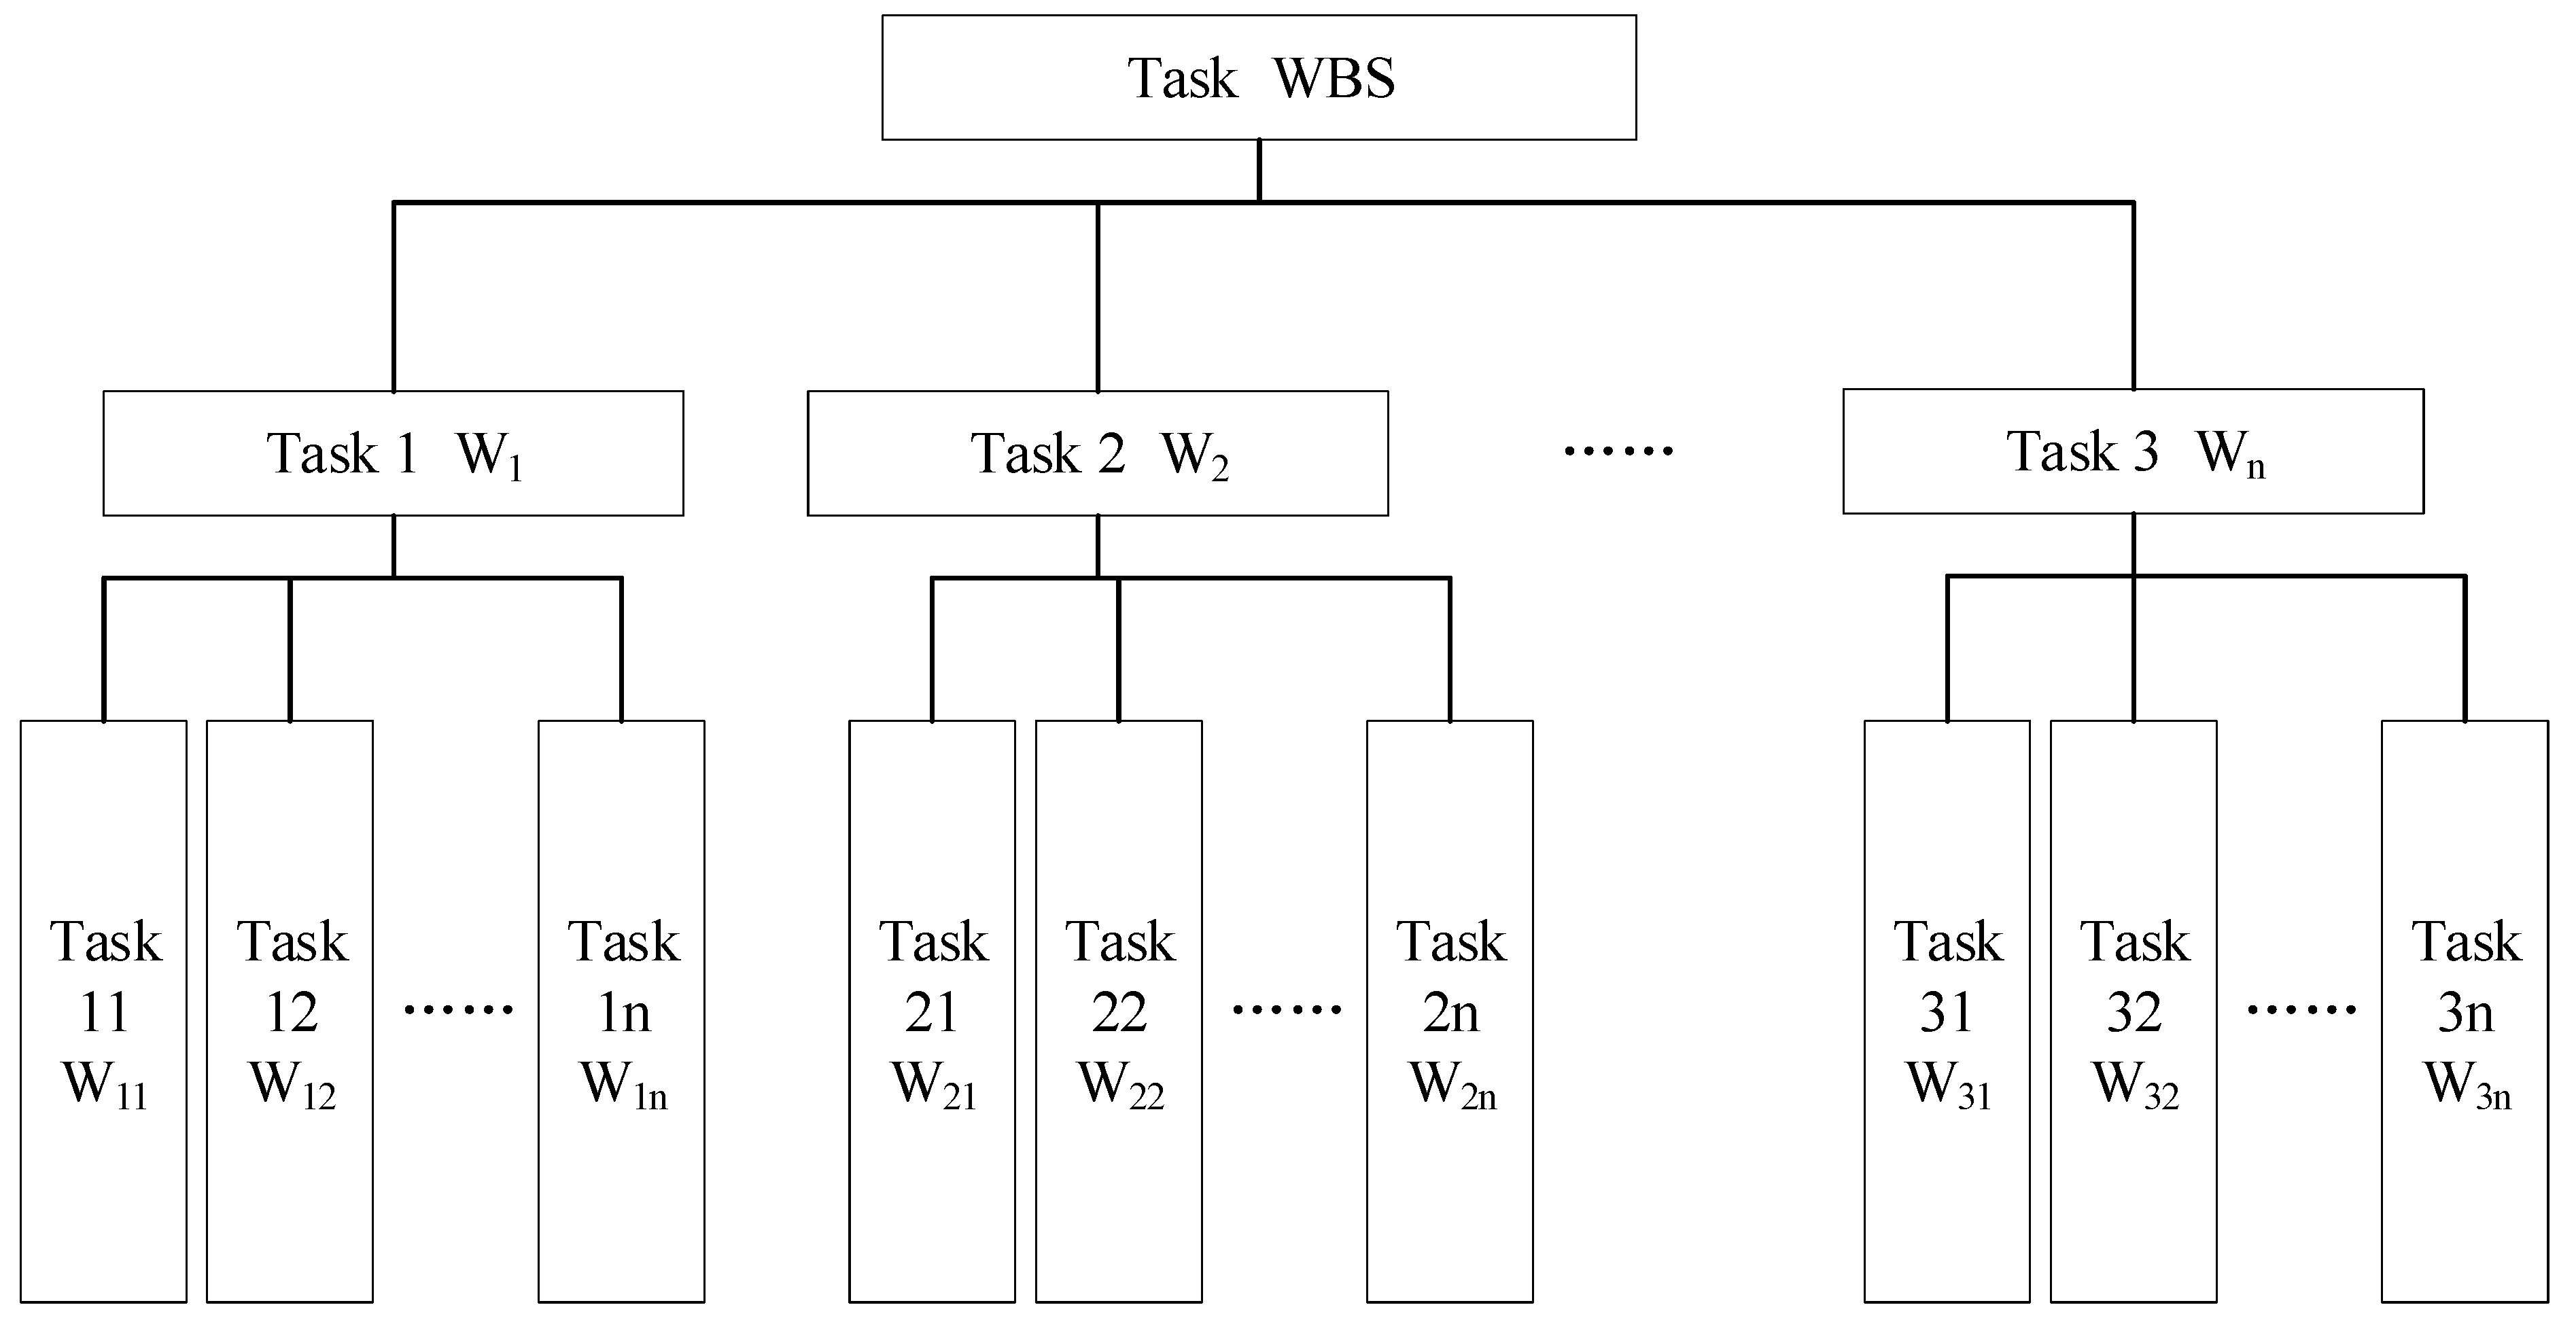
The electric vehicle is decomposed at the system level according to the composition of each major system to obtain the WBS structure;
(3)
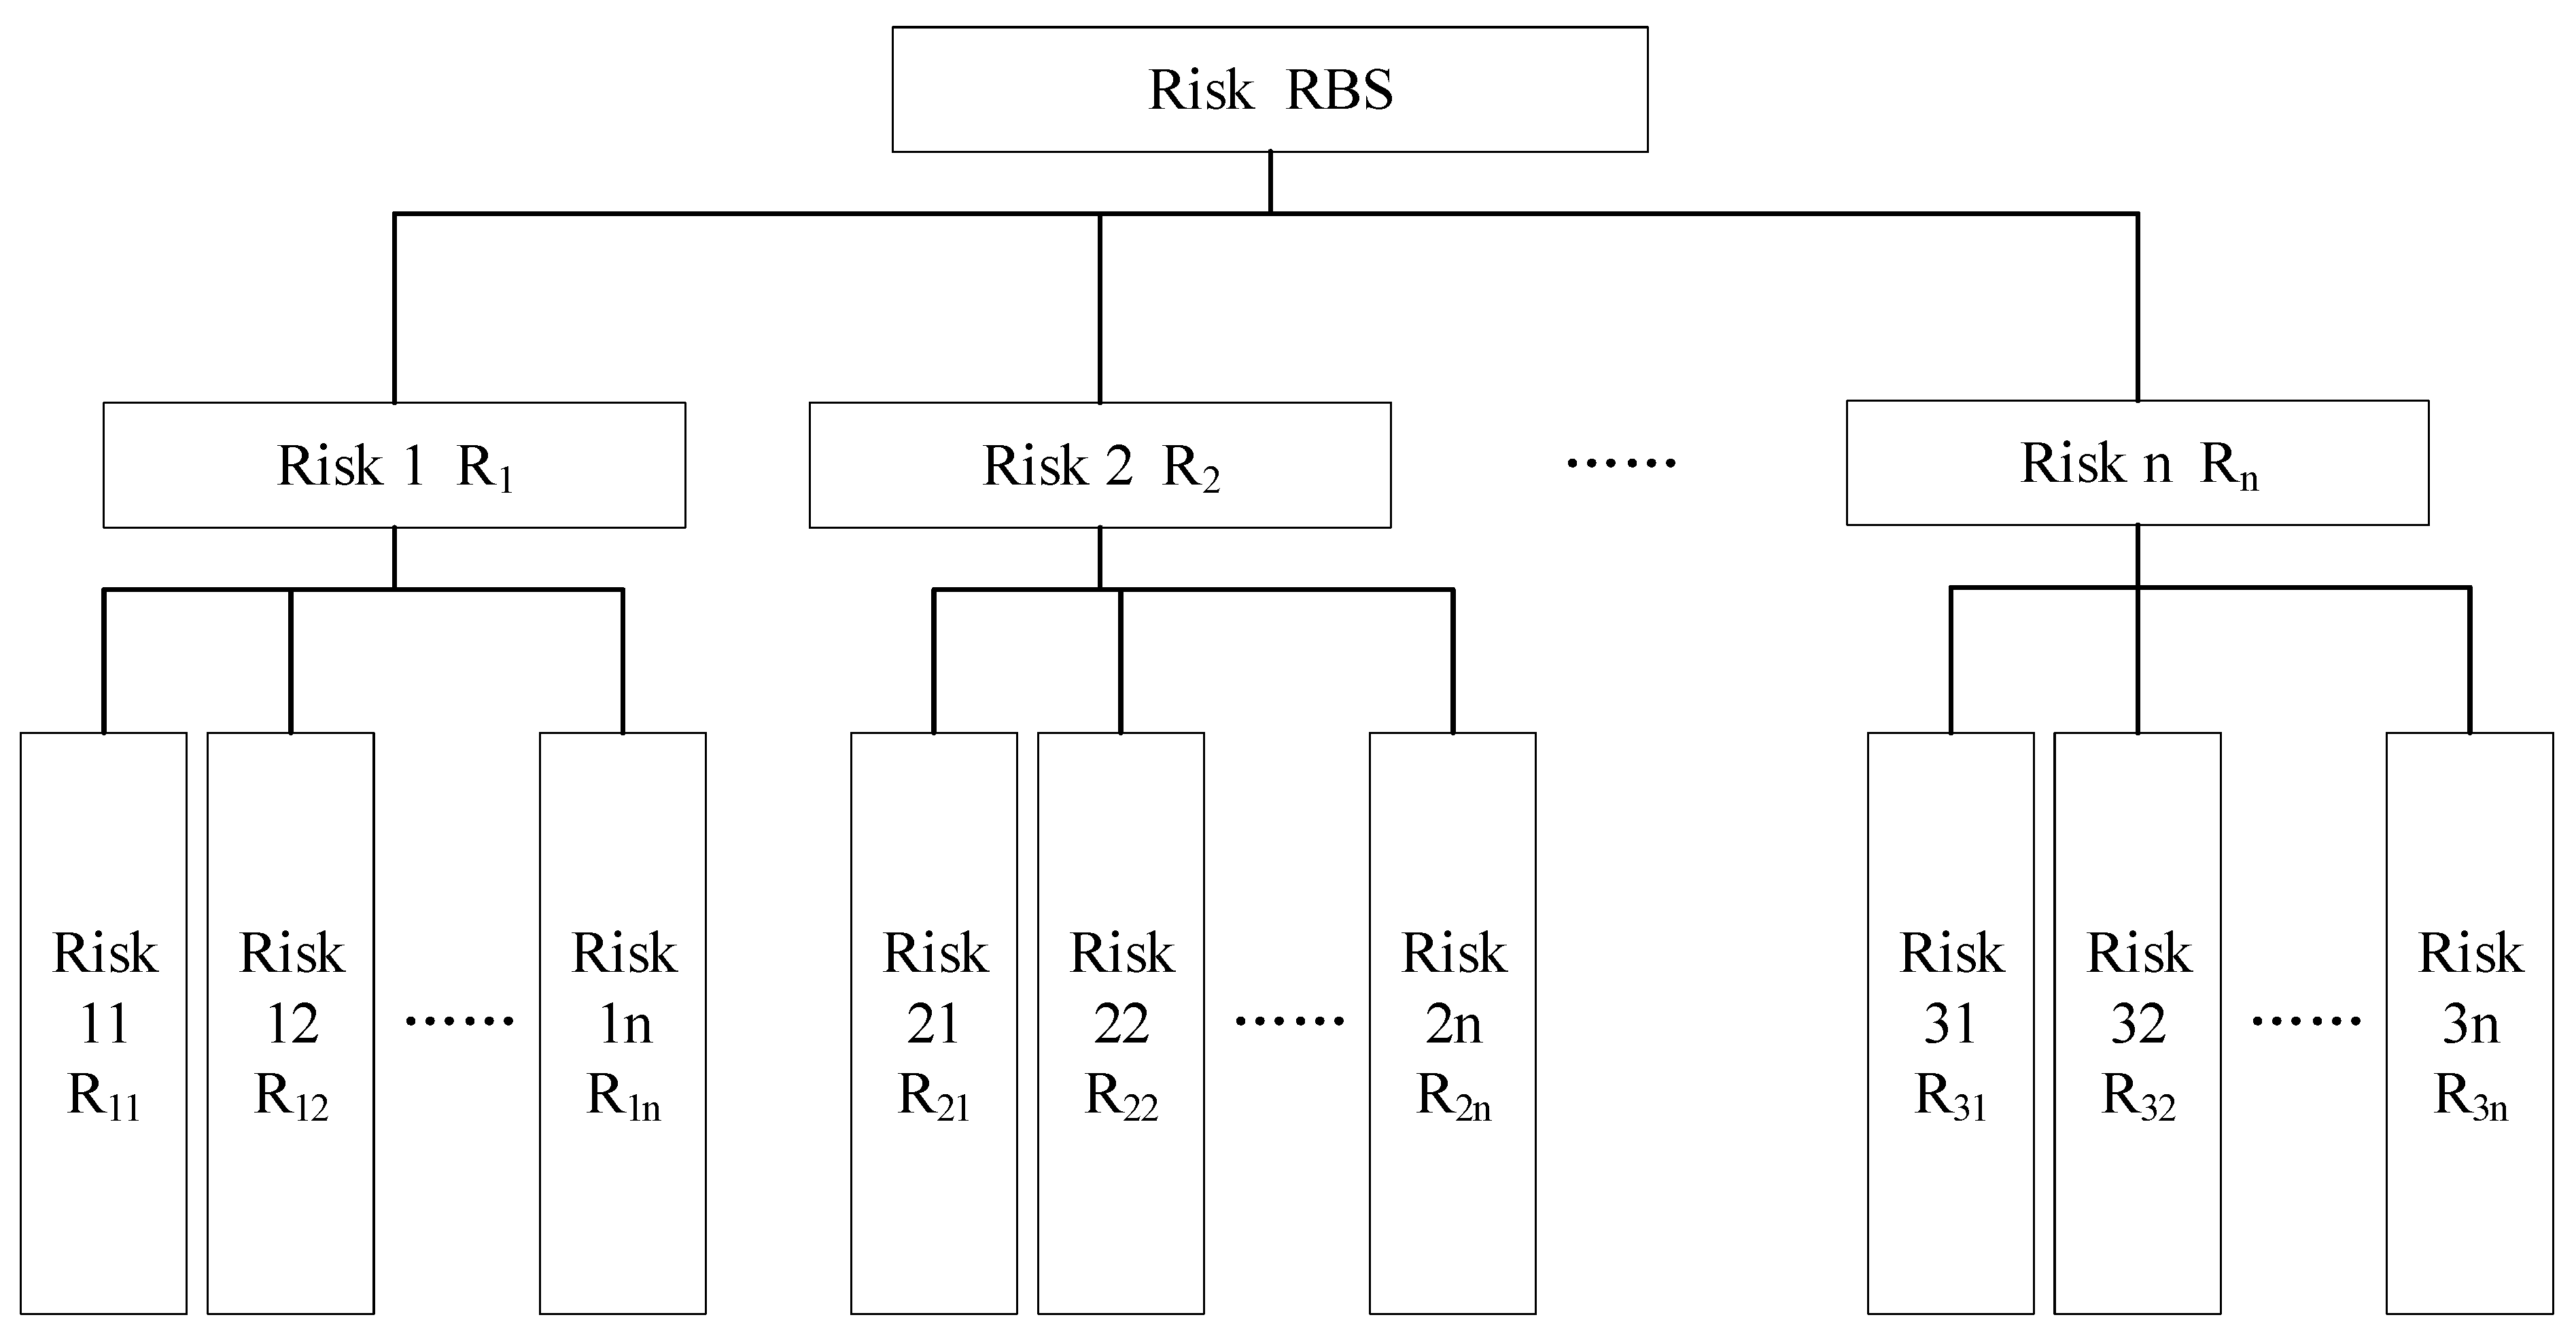
The risk factors in the electric vehicle fire accident are decomposed into a risk hierarchy, and the RBS structure is obtained;
(4)
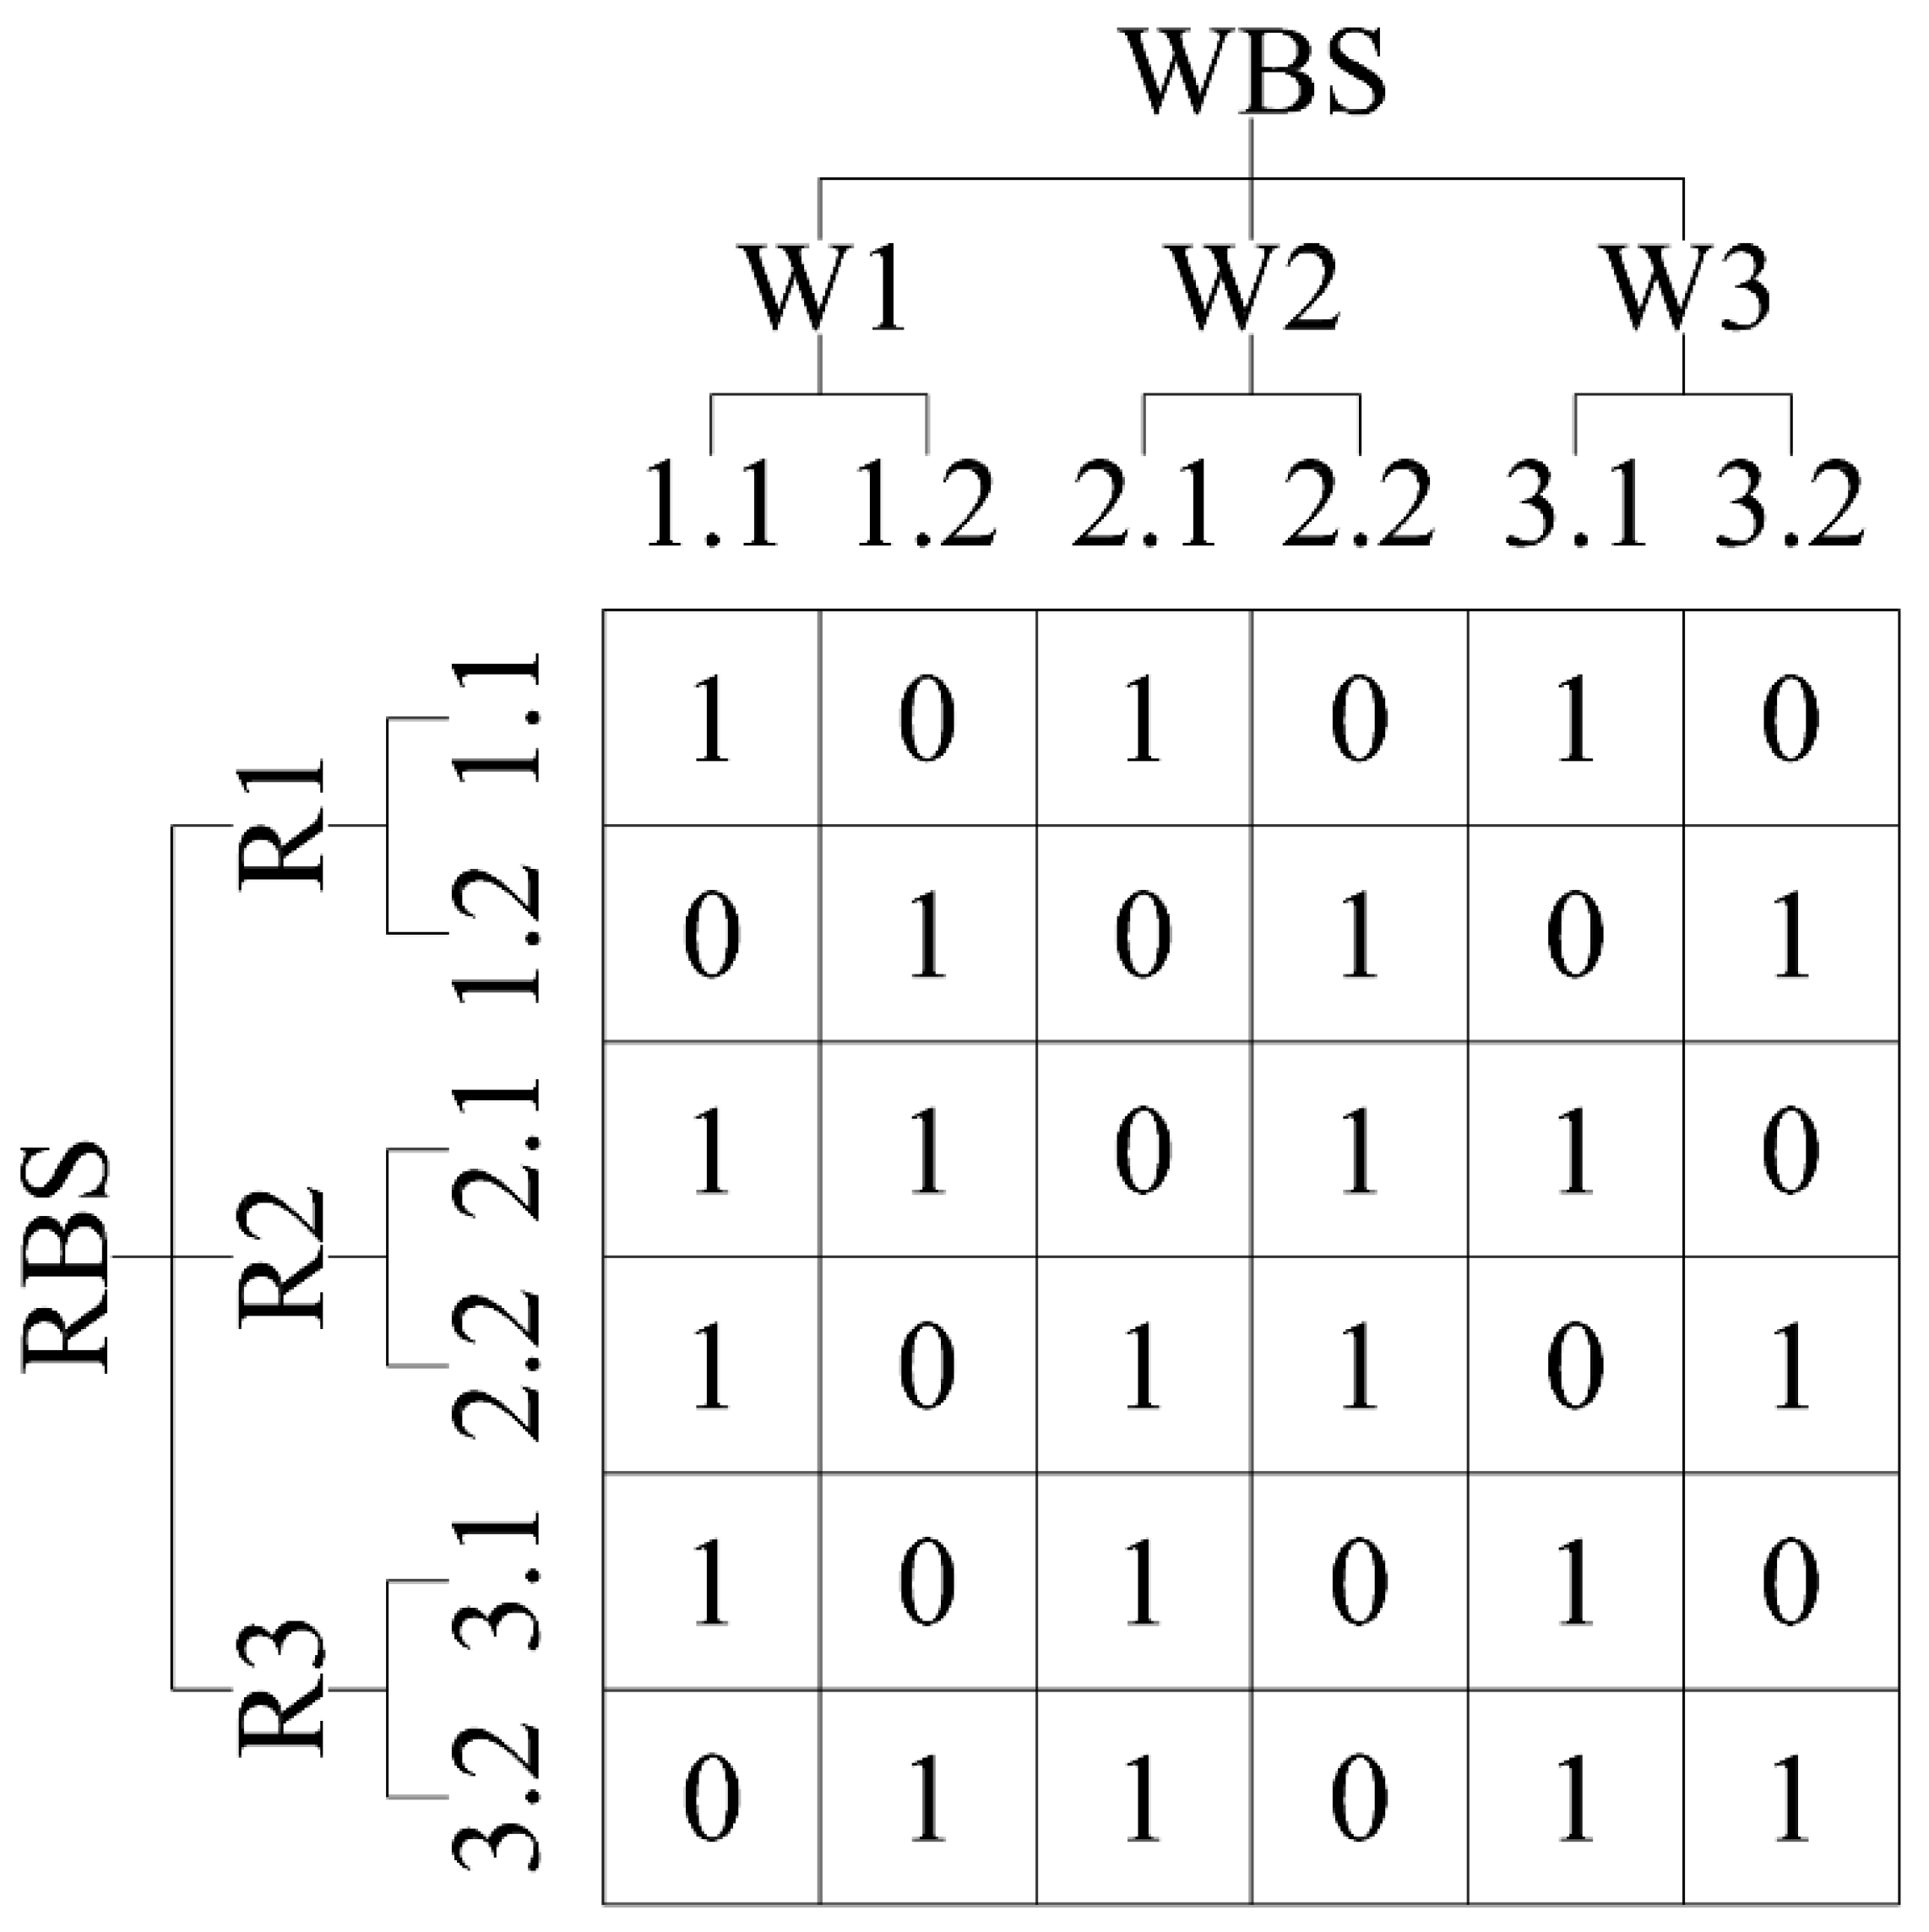
The WBS-RBS matrix is obtained by taking the system structure obtained by WBS decomposition as the column and the risk factor set obtained by RBS decomposition as the row to analyze the risk events in the matrix;
(5)
The analyzed risk event is regarded as the parent node in the Bayesian network;
(6)
The risk event, target event, and the logical relationship of each event are transformed into the Bayesian network nodes and node connection relationship. Regarding historical data, combined with expert evaluation, the probability of various risk events is taken as the prior probability of the parent node in the Bayesian network;
(7)
Calculate the posterior probability, calculate the importance of risk factors, and infer the ranking of risk events according to the magnitude of posterior probability and the ranking of importance;
(8)
Take corresponding safety protection measures according to the sequence of inferred risk events;
The WBS-RBS-BN analysis model process is shown in Figure 6.

3. Electric Vehicle Fire Risk Identification

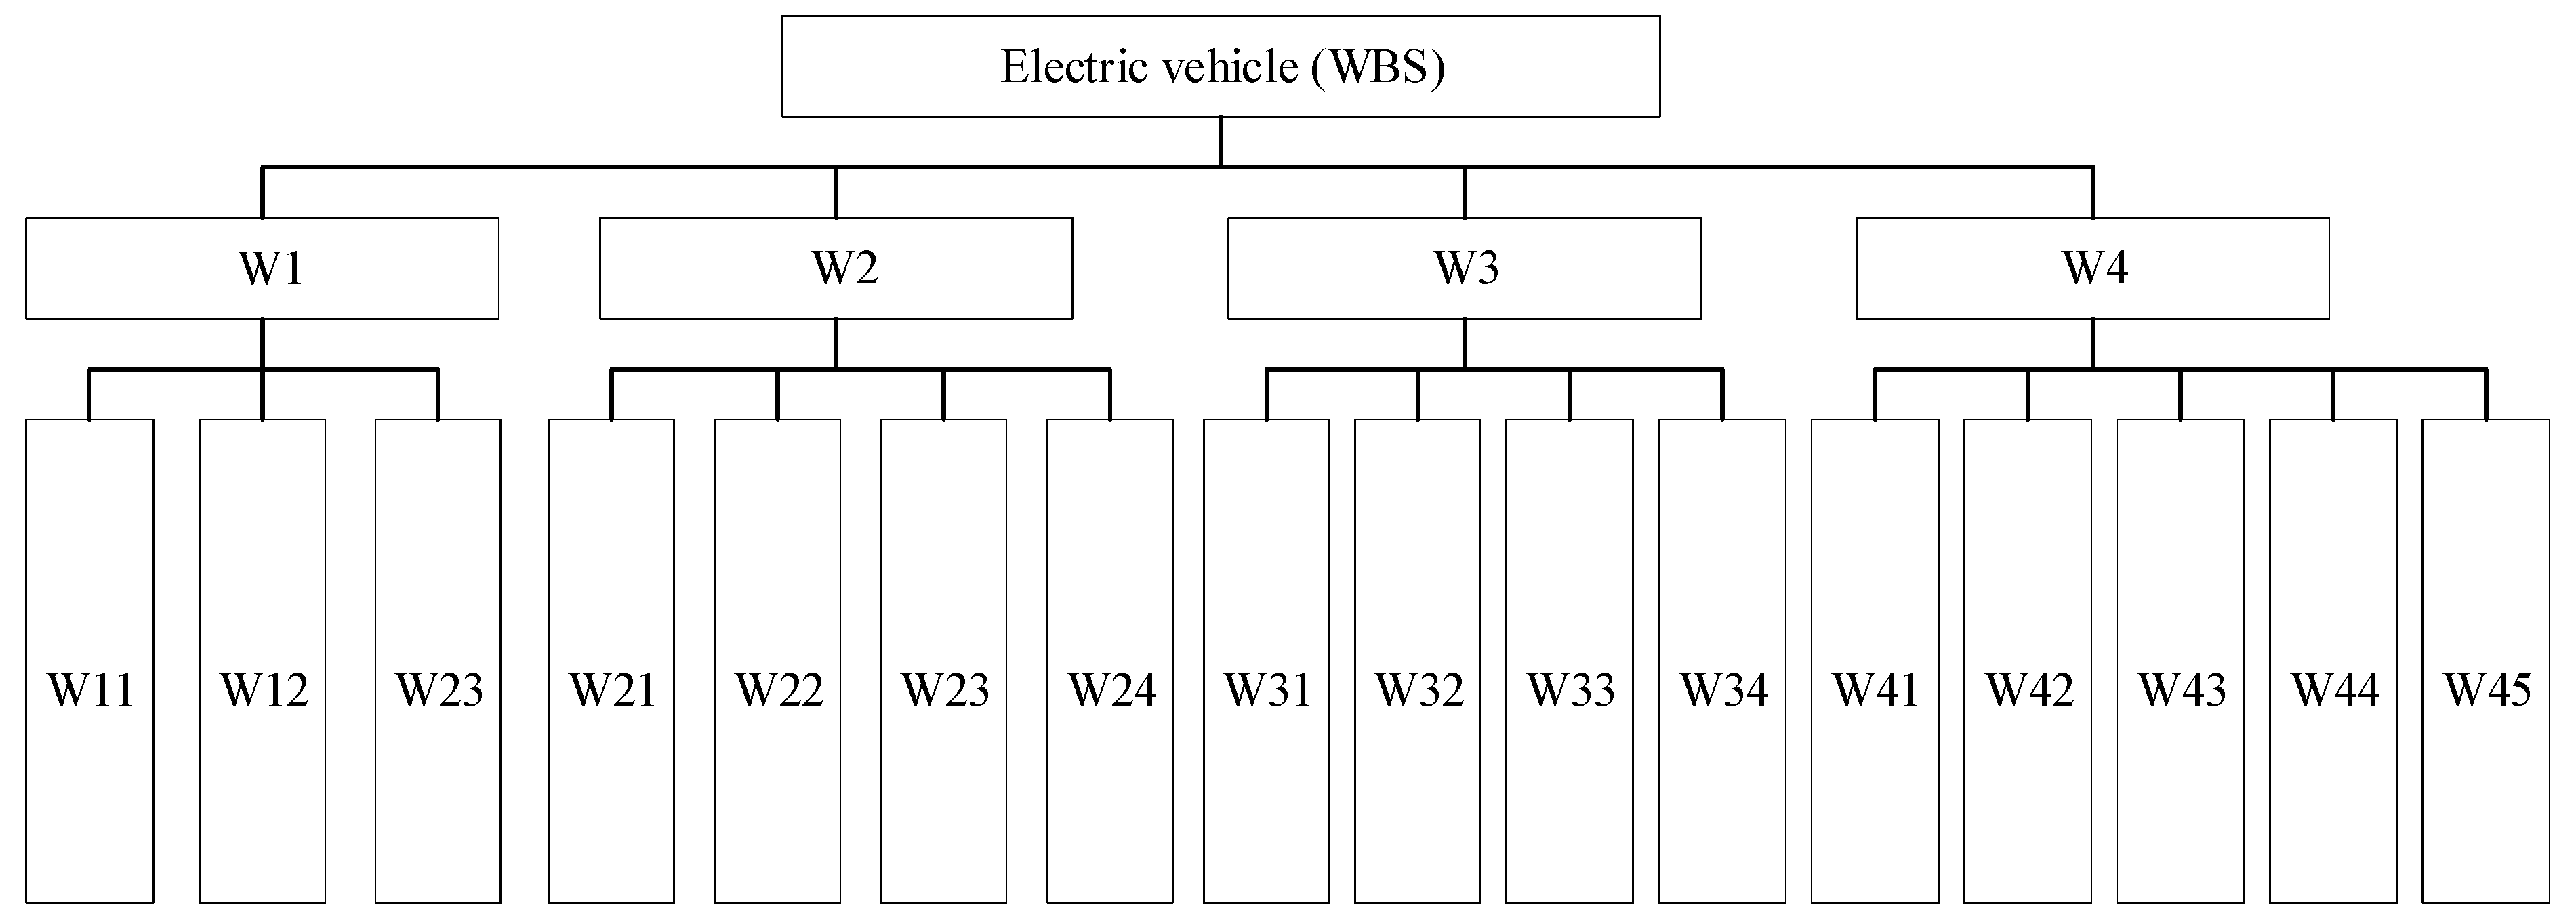
3.1. Construction of Electric Vehicle WBS Structure

The body and interior of electric vehicles and traditional fuel vehicles are the same. The main difference lies in their power assemblies. Since electric vehicles use power batteries to provide power, they do not have the engine and gearbox of traditional fuel vehicles. Instead, they use power batteries and electric motors since the power batteries are generally installed on the chassis of electric vehicles, and the battery weight is relatively light. Therefore, the center of gravity of electric vehicles is lower than that of fuel vehicles. There are a variety of sensors and electronic systems on the electric vehicle. These sensors and electronic systems work together to control the electric vehicle as a whole.
The WBS structure is built based on the system principle. Through the WBS structure, the overall structure of the electric vehicle can be decomposed layer by layer into more refined and easier-to-analyze system units. According to the electric vehicle design specifications and relevant research results, the overall structure of the electric vehicle is divided into four main systems: the whole vehicle control system, the power supply system, the electric drive system, and the auxiliary system, and then the four main systems are subdivided. The electric vehicle WBS decomposition structure tree was obtained, as shown in Figure 7. The system name corresponding to each system number is shown in Table 2.

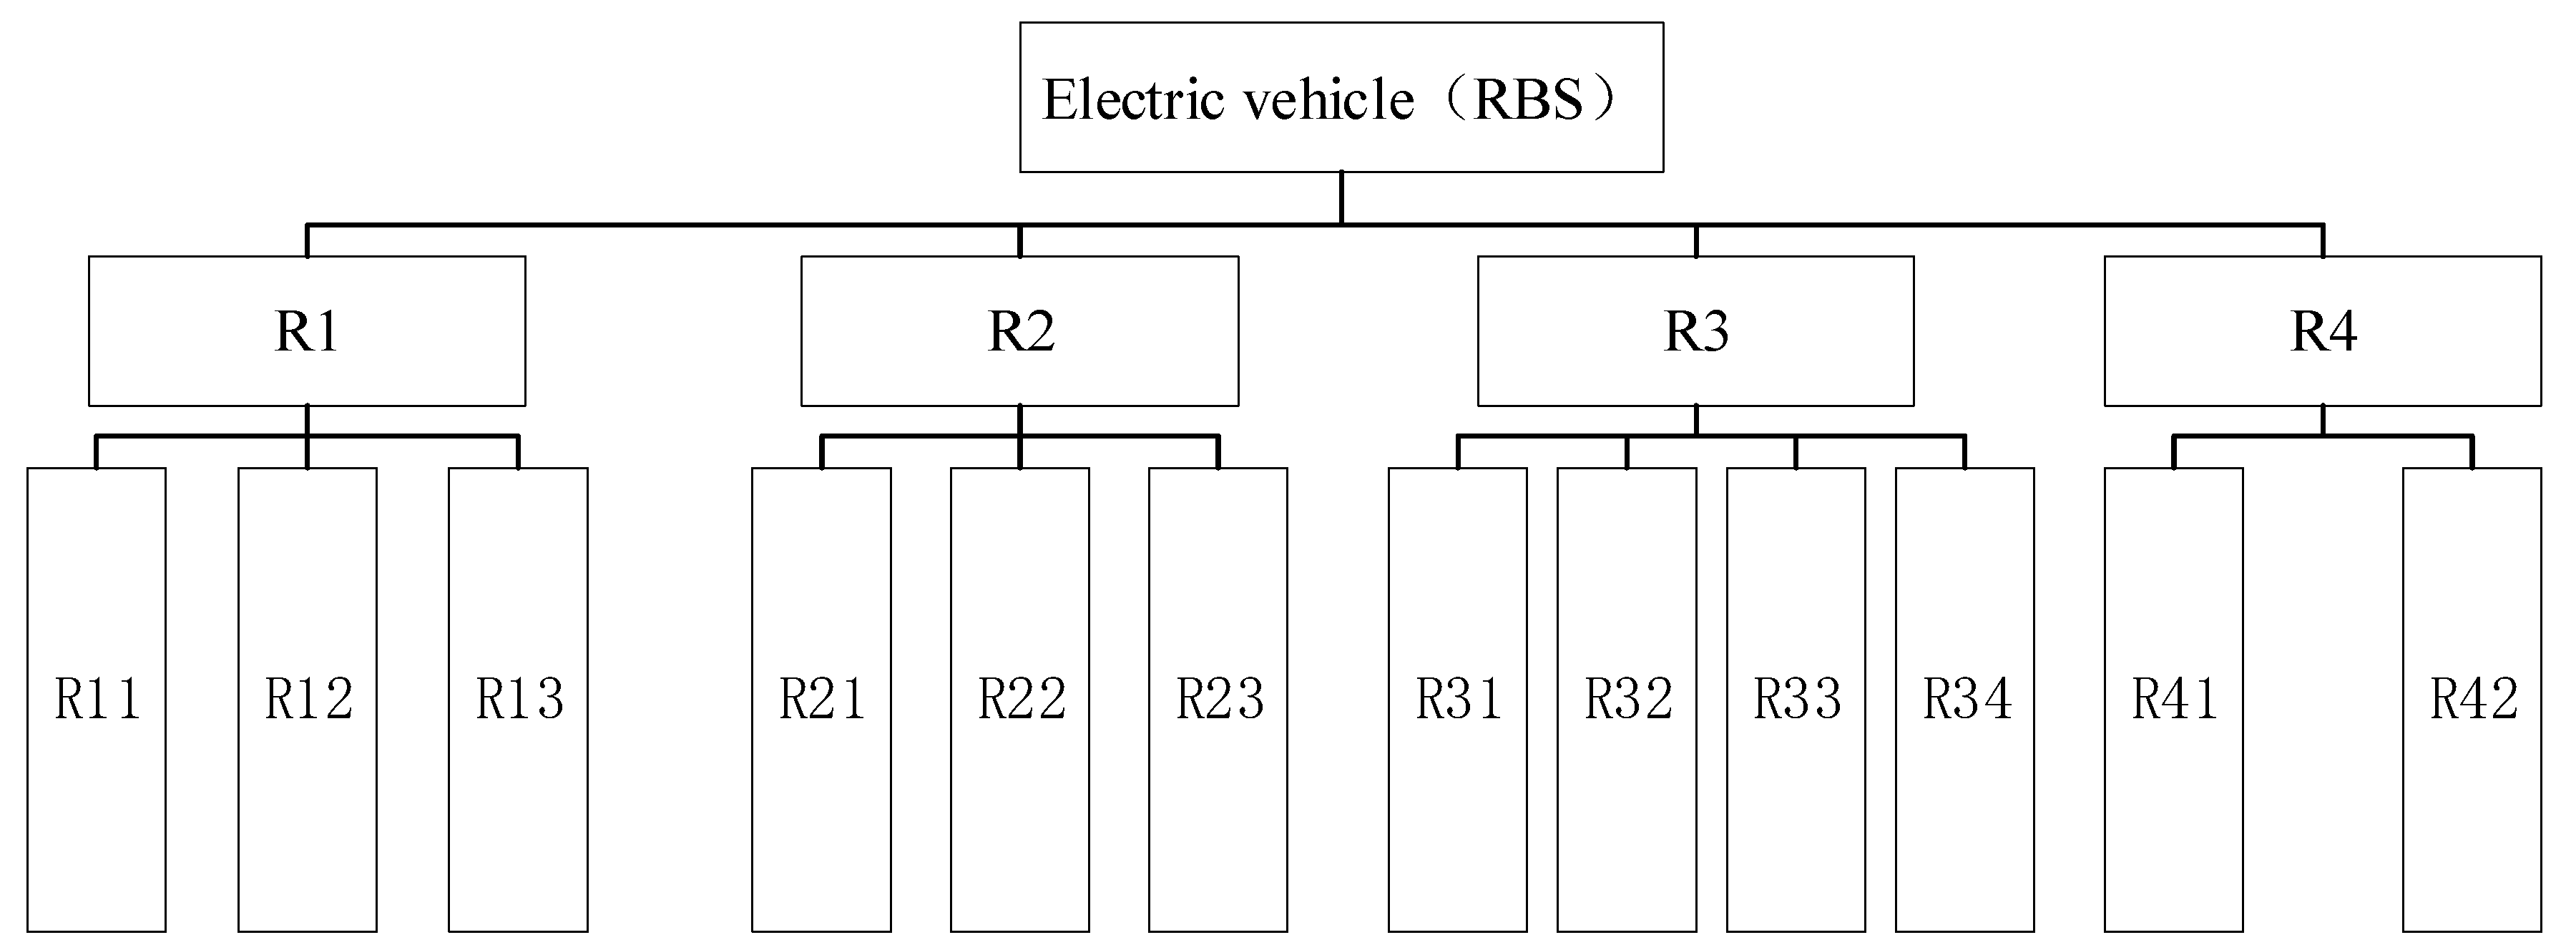
3.2. Building RBS Structure of the Electric Vehicle

The risk factors leading to electric vehicle fires are complex and diverse. According to the relevant examples of the electric vehicle fire, the electric vehicle fire risk is divided into four aspects, human factors, object factors, mechanical factors, and environmental factors, and the secondary factors are further divided to construct the RBS structure of electric vehicles, as shown in Figure 8. See Table 3 for the names of risk factors in the RBS structure tree.
Human factor refers to human thought, behavior, and other human-related risk factors that lead to electric vehicle fire during the use of electric vehicles. Object factor refers to various objects that cause vehicle fire when the electric vehicle is running or standing, such as road stones, combustibles around the vehicle, and other vehicles or objects that may collide. Mechanical factors include the failure of the vehicle itself due to design and manufacturing technical problems or the aging and failure of the vehicle body due to long-term use. The environmental factors include two aspects, one is the climate conditions where the vehicle is located, and the other is the road conditions where the vehicle is running. Both of them jointly affect the vehicle status of electric vehicles.

3.3. WBS-RBS Matrix and Risk Identification of Electric Vehicle Fire

In combination with the actual electric vehicle fire situation, the WBS-RBS matrix of electric vehicles is constructed by taking the most basic electric vehicle system decomposed by WBS as the row and the electric vehicle fire risk factors decomposed by RBS as the column, as shown in Table 4.
According to the WBS-RBS coupling matrix, there are different risk factors in different systems of electric vehicles. The matrix was studied from each type of risk factor as follows:
(1)
From the perspective of human factors, the risk factors that can cause electric vehicle fires are mainly divided into refitting and arson of the vehicle body, ignoring the early fire of the vehicle body, and not being equipped with fire-fighting equipment. Body modification and arson include body and instrument modification (W12R11, W13R11), power system modification (W21R11, W24R11), motor and transmission device modification (W33R11, W34R11), auxiliary equipment modification (W41R11, W42R11, W43R11, W44R11), ignition on the body (w12r12), battery damage arson (W21R12), and arson on the external structure of the body (W34R12, W43R12). The neglect of early fire includes the fire on the vehicle body (W12R13), the fire on the power supply system (W21R13, W24R13), fire occurring in the transmission system (W33R13, W34R13), and fire occurring in various electrical systems and equipment, and fire-fighting equipment (W12R13) was not equipped on the vehicle body;
(2)
Material factors include the ignition of the vehicle body and vehicle tire set (W12R21, W31R21) by an external fire source; the vehicle fire caused by external impact, including the impact of material on the vehicle body (W12R22); the damage of impact on power system (W21R22, W22R22, W23R22, W24R22); the damage of impact on transmission system; the vehicle out of control and fire (W33R22, W34R22, W41R22); the damage of impact on the electrical system; and the internal short circuit of vehicle electrical (W45R22). The failure of charging equipment includes the ignition of the vehicle body and vehicle tire (W12R23, W34R23) due to the fire of charging equipment and the fire caused by battery failure due to unqualified charging equipment (W21R23);
(3)
The machine factors include the fire caused by the congenital fault of the power supply due to the unqualified design (W21R31, W22R31, W23R31, W24R31), the fire caused by the operation error of the vehicle controller (W11R32) or the quality problem of the electrical equipment itself or the fault of long-term use (W31R32, W32R32, W33R32, W42R32, W43R32, W44R32, W45R32), the fire caused by short circuit of power transmission lines in the power system (W21R33, W24R33) and short circuit of internal power transmission lines in the vehicle body (W33R33, W42R33, W43R33, W44R33, W45R33), a high-temperature fire caused by blockage of vehicle body exhaust pipe (W12R34), and fire caused by long-term aging of power supply and electrical (W21R34, W42R34, W43R34, W44R34);
(4)
Environmental factors include a high temperature of the vehicle body (W12R41) caused by high-temperature weather, which leads to high temperature of the battery (W21R42) and excessive water accumulation on the road, which penetrates into the vehicle body (W12R42), thus soaking the battery and causing a fire (W21R42).

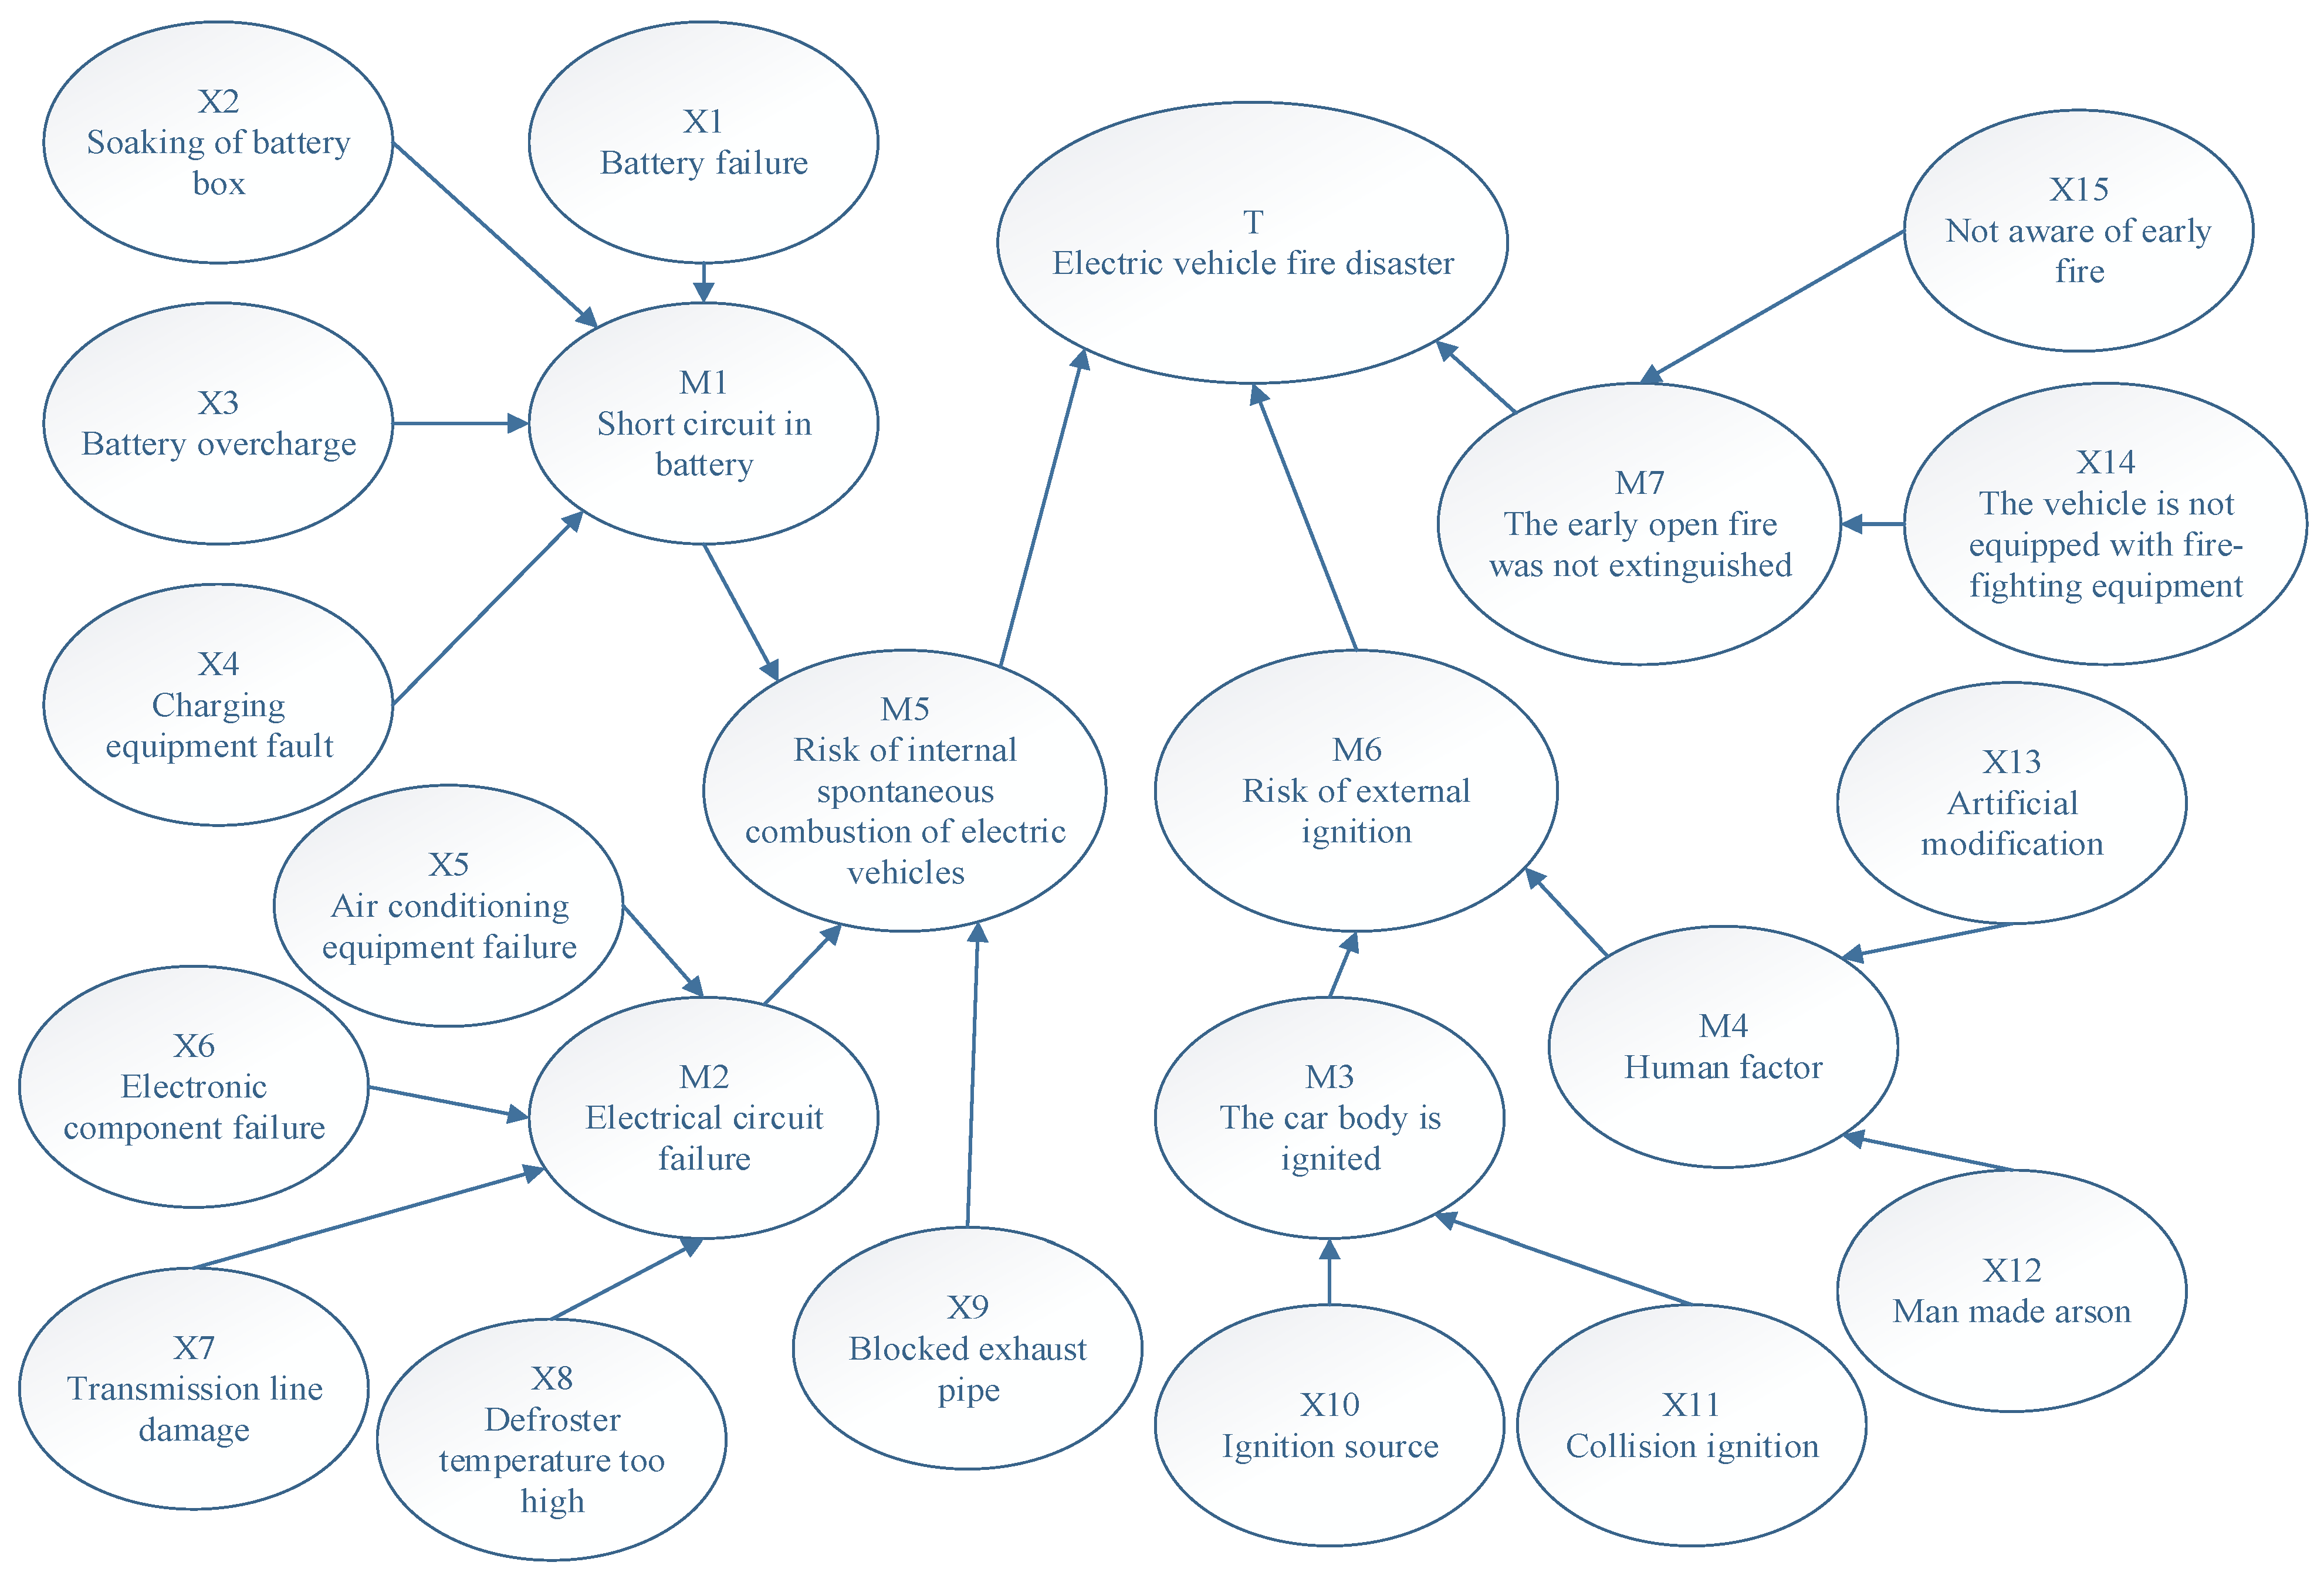
3.4. Bayesian Network Structure and Data Processing

The risk factors of electric vehicle fire analyzed by the WBS-RBS coupling matrix were classified and summarized, and the electric vehicle fire disaster was divided into three aspects: the risk of internal thermal runaway of the vehicle, the risk of external ignition, and the failure of the early open fire to be extinguished. The risks of thermal runaway in the vehicle include short circuits in the power system, electrical circuit failure, and exhaust pipe blockage. The short circuit in the power supply system includes battery quality failure, battery overcharge, charging equipment failure, and battery pack flooding. Electrical circuit failures include air conditioning failures, electronic component failures, transmission line damage, and excessive temperature of the defroster. The risks of external ignition include external open fire, vehicle body ignition caused by collision ignition, and artificial modification and arson. If the early open fire is not extinguished, it includes that the early fire is not found and the vehicle is not equipped with fire-fighting equipment. Therefore, there are 15 basic risk factors leading to electric vehicle fire disasters. The logical relationship between the risk factors was clarified; the Bayesian network structure of electric vehicle fire disaster was constructed, as shown in Figure 9; and the Bayesian network structure enabled the relationship between electric vehicle fire accidents to be clearly and intuitively expressed.
In order to calculate the Bayesian network, five experts in relevant fields were invited to conduct a linguistic assessment of the probability of these 15 risk factors according to the probability of occurrence of each risk factor. The risk levels were divided into seven levels: VL, L, FL, M, H, FH, and VH, as shown in Table A1. The expert evaluation results were fuzzified, and then the fuzzy number was solved to obtain the prior probability of each risk factor.
According to incomplete statistics, the number of electric vehicle retention in China from 2016 to 2021 was 0.741 million, 1.81 million, 2.444 million, 3.349 million, 4.92 million, and 7.84 million, respectively, of which the number of electric vehicle fire accidents from 2016 to 2020 was 43, 18, 52, 132, and 124, respectively. In 2021, according to the statistics of the Ministry of emergency management, the number of electric vehicle fires nationwide surged to 3000. However, since the official did not set up a special database for electric vehicle fires, we only counted 122 electric vehicle accidents with cause reports from major news reports. In these 122 accidents, the frequency of accidents caused by various risk factors was obtained by screening with each major risk factor as the keyword, and the accident probability caused by each risk factor was obtained by using Equation (13). As shown in Table A2, the risk probability was homogenized to obtain the homogenized probability, which is used as the node conditional probability for Bayesian network calculation.
P ( X i ) = n i N
where ni is the accident frequency of risk factor Xi, N is the total number of accidents, and P(Xi) is the accident probability caused by risk factor i.

4. Results and Discussion

4.1. Probability Analysis of Electric Vehicle Fire

By using Equation (14) to calculate the number of electric vehicle fires and electric vehicle retention data in China from 2016 to 2021, we established that the probability of electric vehicle fires in 2016–2021 is 0.0058%, 0.0010%, 0.0021%, 0.0039%, 0.0025%, and 0.0383%, respectively. Combined with the number of electric vehicle fires and electric vehicle ownership data in 2016–2021, we established the number of electric vehicles and electric vehicle ownership in China from 2016 to 2021. The changing trend of electric vehicle fire number and electric vehicle fire probability is shown in Figure 10.
P ( F ) = n f N s
where nf is the number of electric vehicle fires in that year, Ns is the number of electric vehicles in that year, and P(F) is the probability of electric vehicle fires in that year.
It can be concluded that the average probability of electric vehicle fire in China from 2016 to 2021 is 0.0089%. As can be seen from Figure 10, the change in electric vehicle fire probability from 2016 to 2020 is relatively stable, fluctuating above and below the average probability of 0.0031%, but from 2020 to 2021, the probability of electric vehicle fire increased significantly. Compared with the fire probability of traditional fuel vehicles of 0.01% to 0.02%, the average fire probability of electric vehicles from 2016 to 2020 is far lower than that of traditional fuel vehicles, but the fire probability of electric vehicles in 2021 is higher than that of 0.01% to 0.02%. Therefore, electric vehicle fires deserve our attention.

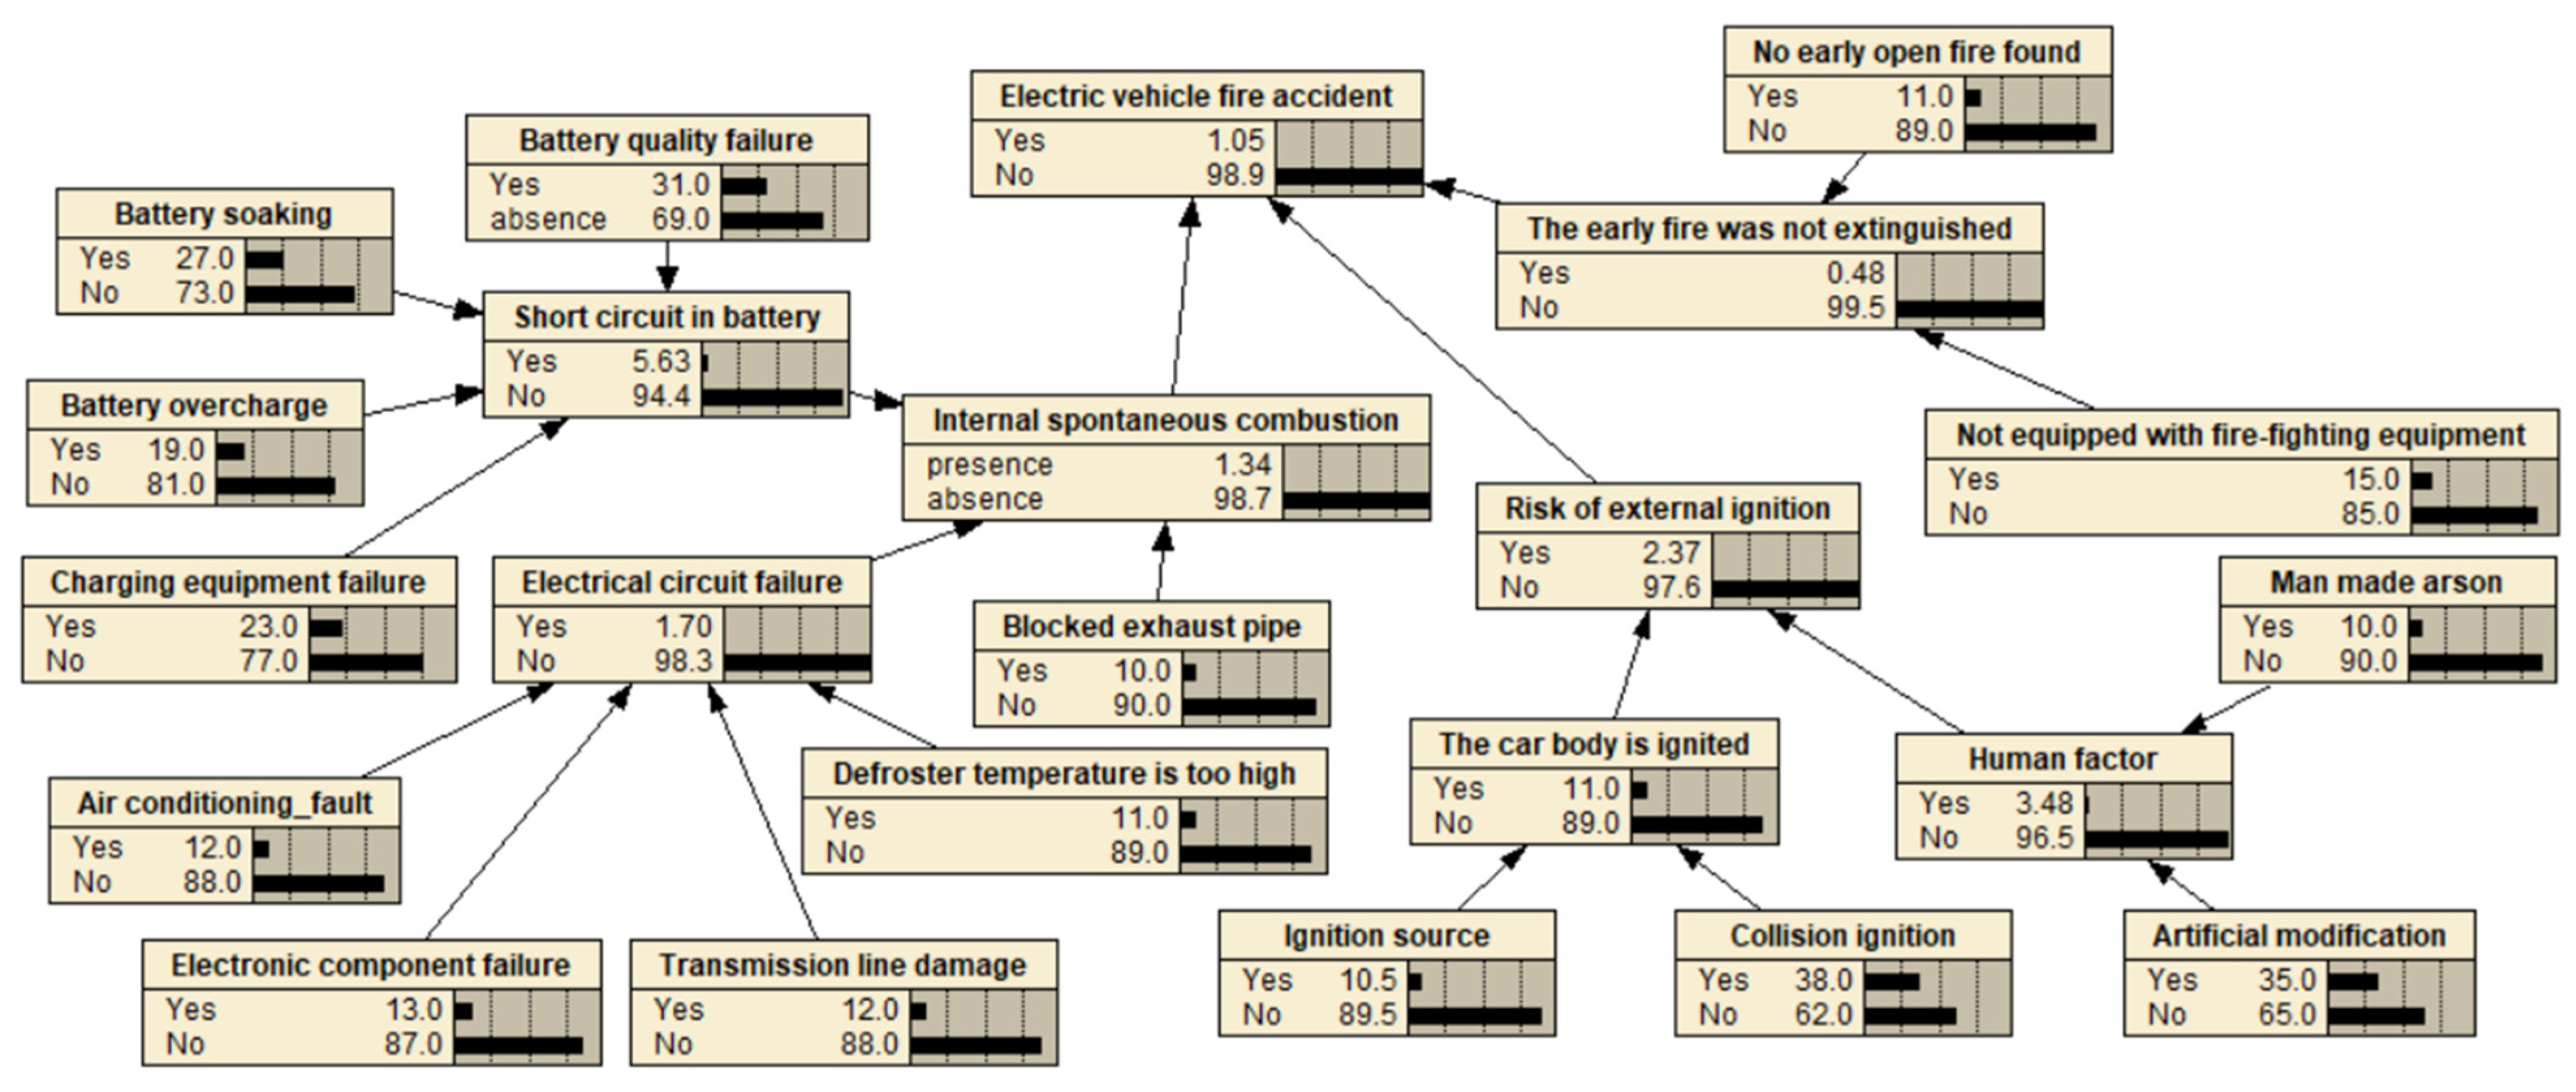
4.2. Calculation of Bayesian Network

For the fuzzy evaluation of the experts on each risk factor in Table A1, according to the corresponding relationship between the fuzzy value and the cut set in Table 1, the corresponding fuzzy number was transformed into the cut set, and the cut set of the fuzzy number of each risk factor was obtained by formula 5. By taking the risk factor X1 as an example, the cut set expression of X1 can be obtained from Equation (9) as follows:
P X 1 = f F L + f F L + f F L + f F L + f F L 5   = [ 4 × ( 0.1 λ + 0.2 , 0.1 λ + 0.5 ) + ( 0.1 λ + 0.1 , 0.1 λ + 0.2 ) ] 5   = [ 0.1 λ + 0.18 , 0.1 λ + 0.44 ]
Equations (10)–(12) were used to solve the fuzzy number. When the optimistic coefficient α is 0.5, the representative value of blur value PX1 is:
I = α μ R ( P ) + ( 1 α ) μ L ( P )   = 0.5 × ( 0.1 + 0.18 ) + 0.5 × ( 0.1 + 0.44 )   = 0.31
From the calculation results, we obtained P (X1 = Yes) = 0.31, P (X1 = No) = 0.69. Similarly, we obtained the prior probability of other nodes (see Table A3). The conditional probabilities of other nodes in the Bayesian network structure can be obtained according to the statistical data in Table A2. See Table A4, Table A5, Table A6, Table A7, Table A8, Table A9, Table A10 and Table A11 for the conditional probabilities of nodes.
The obtained node parameters were substituted into the Bayesian network structure for calculation, as shown in Figure 11. Compared with the fault tree, the Bayesian network structure has a conditional probability between 0 and 1, and a risk factor is no longer an absolute event. All nodes are represented by relative probability [36], which is more convincing.
According to the calculation of the Bayesian network, the fire accident rate of electric vehicles is about 0.0105. Because the node probability is evaluated by expert language and processed by fuzzy numbers, and all-electric vehicle fire data cannot be counted, the calculation probability will be higher than the actual probability. From the results, it can be seen that the risk of ignition from the outside is slightly higher than the risk of spontaneous combustion inside the vehicle.
In order to further evaluate the risk factors, assuming that the electric vehicle fire accident has occurred, that is, the probability of “Electric vehicle fire accident” is adjusted to 100%, the posterior probabilities of each risk factor were inversely inferred by the Bayesian network, and the results are shown in Table 5.
From the posterior probability, it can be seen that external collision and battery problems are the first two factors leading to electric vehicle fires. The posterior probabilities are 0.700 and 0.406, respectively, while the posterior probabilities of artificial modification, battery-pack flooding, and charging equipment failure are 0.382, 0.293, and 0.239, respectively, which are also prone to electric vehicle fires. In the investigation of electric vehicle fire accidents, we should pay attention to these factors.

4.3. Importance Analysis

The results obtained only by a priori probability, or a posteriori probability may not be accurate. Therefore, “Electric vehicle fire accident” was selected as the result event, and each basic risk factor was selected as the cause event. Each cause event in the Bayesian network structure was adjusted to occur (xi = 1) and not occur (xi = 0) to obtain the probability of “Electric vehicle fire accident” when each cause event occurs or does not occur. According to the calculation results of the Bayesian network, the critical importance of each cause event was calculated by Equations (5) and (6). The calculation results are shown in Table 6.
It can be seen that the top five risk factors leading to electric vehicle fire accidents are x11, x1, x13, x2, and x4, namely, collision ignition, battery quality failure, artificial modification, battery pack flooding, and charging equipment failure, which is consistent with the calculation results of Bayesian network. Therefore, it is necessary to take safety measures for these five risk factors.

4.4. Safety Protection Measures

According to Bayesian network inference, the top five risk factors causing electric vehicle fires are external collision ignition, battery failure, artificial modification, battery-pack flooding, and charging equipment failure. Therefore, given these risk factors, the corresponding safety protection measures were proposed.
The collision of electric vehicles mainly comes from the front, rear, both sides, and bottom of the vehicle. The collision protection of the front and rear of the vehicle is the same as that of traditional fuel vehicles. Anti-collision beams can be installed at the front and rear of the vehicle. The anti-collision of both sides of the vehicle can be realized by fixing the side beams of the vehicle and the battery box. Due to the special layout of the battery box of the electric vehicle, the chassis of the electric vehicle is usually low. With the increase in the output of the electric vehicle, the fire caused by the collision at the bottom of the electric vehicle also increases. In order to solve the problem of the protection of the chassis of the electric vehicle, the protective plate at the bottom of the battery box can be improved, and the single-layer thick chassis can be replaced by the double-layer or multi-layer sandwich composite chassis, which can be made of high-strength, light-weight composite materials [37] to improve the anti-collision ability of the vehicle chassis. In addition, adding electronic anti-collision equipment such as rear-view radar to electric vehicles in daily life can also reduce the occurrence of electric vehicle collision accidents [38].
The main causes of electric vehicle fire caused by battery failure are the unreasonable battery structure and electrode materials, which lead to battery thermal runaway and vehicle body combustion. The manufacturer should continuously optimize the battery structure, eliminate backward battery materials, and upgrade the diaphragm materials between battery packs to prevent thermal runaway caused by collision. A collision automatic power-off device on the battery box can be added. If the battery is prone to short circuits, replacing the electrode material should be considered, such as spinel lithium titanate as the negative electrode [39]. At the same time, the manufacturer should mark the battery voltage, current, resistance limit, and other parameters.
The artificial modification requires the joint efforts of the government, electric vehicle manufacturers, and society. The government should formulate specifications and standards for electric vehicles, parts, and components and enforce them. Public opinion should play a supervisory role and strengthen the safety supervision of electric vehicles. At the same time, individuals should also develop a good sense of safety, not modify in violation of regulations, and develop good driving habits.
In order to prevent the battery pack from soaking in water, the electric vehicle should be maintained regularly to find the vehicle’s fault in time. The manufacturer should seal the battery box, improve the structural strength of the vehicle body, and prevent the battery from flooding due to the cracks in the vehicle body and battery box caused by scratching and collision.
Although the output of electric vehicles has increased year by year, the supporting charging equipment is not perfect and unqualified. Poor charging equipment causes great damage to electric vehicle batteries. Standardizing and standardizing charging equipment and improving the information connection between charging equipment will help to reduce the occurrence of electric vehicle accidents caused by charging equipment.

5. Conclusions

This research used the WBS-RBS structure to identify the risk of electric vehicle fire accidents, established the risk factors leading to electric vehicle fire accidents, established the logical relationship between risk factors, and used BN to analyze the risk of electric vehicle fire accidents:
(1)
The WBS structure was constructed, and the electric vehicle was divided into four main systems: vehicle control system, power supply system, electric drive system, and auxiliary system;
(2)
The RBS structure was constructed, and four main risks in electric vehicle fire accidents were obtained: human factors, physical factors, mechanical factors, and environmental factors. On this basis, 12 lower-level risks were divided;
(3)
The WBS-RBS coupling matrix was constructed to identify 15 risk factors that can lead to an electric vehicle fire in different systems of electric vehicles;
(4)
The concept of a fuzzy set was combined with BN, and the prior probability and posterior probability of each risk factor were clarified by using the fuzzy BN. The importance of each risk factor was analyzed, and the conclusion was that external collision is the first risk factor leading to an electric vehicle fire, followed by battery failure, artificial modification, battery pack flooding, and charging equipment failure;
(5)
According to the four risk factors, the corresponding safety protection measures were proposed.
This study shows the feasibility of WBS-RBS and fuzzy BN coupling for electric vehicle fire risk analysis, which has certain reference significance for the prevention and control of electric vehicle fire, but it also has limitations. Because of the lack of an official database, it is impossible to further analyze the disaster risk, such as subdividing the fire risk study of electric vehicles of different models under different driving conditions. Moreover, with the change in technology and the increasingly complex driving environment, more risk factors leading to electric vehicle fire may appear. Therefore, under the background of the upgrading of electric vehicle power battery materials, the change in power battery structure, the application of body composite materials, and the emergence of vehicle automatic driving technology, subdividing the fire risk of different types of electric vehicles under different driving conditions is the next research content. In addition, the risk analysis of electric vehicle fires caused by new materials and new technologies is also the key research content in the future.

Author Contributions

Conceptualization, J.C. and K.L.; methodology, K.L.; software, K.L.; validation, J.C., K.L. and S.Y.; formal analysis, K.L.; data curation, K.L.; writing—original draft preparation, K.L.; writing—review and editing, S.Y.; supervision, S.Y.; project administration, J.C and S.Y. All authors have read and agreed to the published version of the manuscript.

Funding

This research was funded by the National Natural Science Foundation Project of China under Grant No. 52274163.

Institutional Review Board Statement

Not applicable.

Informed Consent Statement

Not applicable.

Data Availability Statement

Data is contained within the article.

Acknowledgments

The authors would like to express their thanks to the National Natural Science Foundation.

Conflicts of Interest

The authors declare no conflict of interest.

Appendix A

Table A1. Expert language assessment.
Risk FactorExpert 1Expert 2Expert 3Expert 4Expert 5
X1FLLFLFLFL
X2FLLFLLFL
X3LLFLLL
X9FLLFLLL
X5VLVLLVLL
X6LLVLVLL
X7LVLVLLVL
X8VLLVLVLVL
X9VLVLVLVLVL
X10LLLLL
X11FLFLMFLFL
X12VLVLVLVLVL
X13FLFLFLFLFL
X14LLLLL
X15VLVLLVLVL
Table A2. Expert language assessment.
NumberRisk Factors Risk FrequencyProbabilityHomogenization Probability
1Battery failure119.02%15.08%
2Battery soaking64.92%8.23%
3Battery overcharge21.64%2.74%
4Charging equipment ignition54.09%6.84%
5Air conditioning fault32.46%4.11%
6Electrical equipment failure43.28%5.48%
7Transmission line damage54.10%6.86%
8Defroster temperature too high10.82%1.37%
9Blocked exhaust pipe10.82%1.37%
10Ignition source31.62%2.71%
11Collision ignition2117.20%28.76%
12Artificial modification75.74%9.60%
13Man-made arson21.64%2.74%
14The vehicle is not equipped with fire-fighting equipment10.82%1.37%
15No one is aware of the fire21.64%2.74%
Table A3. Node prior probability.
Node NumberPrior Probability
X10.31
X20.27
X30.19
X40.23
X50.12
X60.13
X70.12
X80.11
X90.10
X100.105
X110.38
X120.10
X130.35
X140.15
X150.11
Table A4. Conditional probability of node M1.
X1X2X3X4YesNo
YesYesYesYes10.6289.38
YesYesYesNo9.2090.80
YesYesNoYes10.3989.61
YesNoYesYes8.5791.43
NoYesYesYes3.7196.29
NoNoYesYes1.6598.35
NoYesNoYes3.4896.52
NoYesYesNo2.2997.71
YesNoNoYes8.3491.66
YesNoYesNo7.1492.86
YesYesNoNo8.9791.03
YesNoNoNo15.0884.92
NoYesNoNo8.2391.77
NoNoYesNo2.7497.26
NoNoNoYes6.8493.16
NoNoNoNo0100
Table A5. Conditional probability of node M2.
X5X6X7X8YesNo
YesYesYesYes5.3894.62
YesYesYesNo5.2794.73
YesYesNoYes2.7497.26
YesNoYesYes3.6996.31
NoYesYesYes4.4395.57
NoNoYesYes2.7497.26
NoYesNoYes1.7998.21
NoYesYesNo4.3295.68
YesNoNoYes1.0598.95
YesNoYesNo3.8996.11
YesYesNoNo2.6397.37
YesNoNoNo4.1195.89
NoYesNoNo5.4894.52
NoNoYesNo6.8693.14
NoNoNoYes1.3798.63
NoNoNoNo0100
Table A6. Conditional probability of node M5.
M1M2X9YesNo
YesYesYes1585
YesYesNo14.9585.05
YesNoYes10.2289.78
NoYesYes4.8295.18
YesNoNo19.6780.33
NoYesNo10.6689.34
NoNoYes1.3798.63
NoNoNo0100
Table A7. Conditional probability of node M3.
X10X11YesNo
YesYes25.5074.50
YesNo2.7197.29
NoYes28.7671.24
NoNo0100
Table A8. Conditional probability of node M4.
X12X13YesNo
YesYes8.0891.92
YesNo9.6090.40
NoYes2.7497.26
NoNo0100
Table A9. Conditional probability of node M6.
M3M4YesNo
YesYes16.3283.68
YesNo19.6780.33
NoYes7.3892.62
NoNo0100
Table A10. Conditional probability of node M7.
X14X15YesNo
YesYes2.2897.72
YesNo1.3798.63
NoYes2.7497.26
NoNo1000
Table A11. Conditional probability of Top event T.
M5M6M7YesNo
YesYesYes17.0885
YesYesNo17.0185.05
YesNoYes9.7689.78
NoYesYes7.3895.18
YesNoNo31.1580.33
NoYesNo27.0589.34
NoNoYes2.4698.63
NoNoNo0100

References

  1. Lao, Z.; Zhang, Y.; Qiu, J.; Liang, Z.; Lian, B. Fire detection system for lithium battery of electric vehicle based on multi-sensor data fusion. Autom. Inf. Eng. 2021, 42, 16–19. [Google Scholar]
  2. Lv, Z.; Jiang, T.; Xiao, C. Experimental study on thermal diffusion of pure electric vehicle lithium ion power battery. China Auto 2021, 8, 24–30. [Google Scholar]
  3. Gao, Q.; Wang, H.; Liu, Y.; Jin, S.; Chen, Y. Experimental analysis on spray mode of power battery emergency cooling. J. Jilin Univ. (Eng. Technol. Ed.) 2021, 52, 1–9. [Google Scholar] [CrossRef]
  4. Chang, R.; Zheng, B.; Feng, X.; Xu, C.; Wang, H.; Chen, L.; Wang, Y. Experimental Study on the Effects of Thermal Insulation Layers on the PropagationCharacteristics of Thermal Runaway in Lithiumion Battery Module. Automot. Eng. 2021, 43, 1448–1456. [Google Scholar] [CrossRef]
  5. Xie, J.; Shao, J.; Huang, Z.; Wang, F.; Meng, X. Seal Structure Design of Power Battery Box. Auto Time 2021, 126–127. [Google Scholar]
  6. Sun, Z.; Chen, L.; Bu, X.; Liu, P.; Liu, S. Study on performance evolution of power battery after mechanical damage caused by extrusion. Chin. J. Power Sources 2020, 44, 964–966+1039. [Google Scholar]
  7. Yu, J.; Yang, X.; Zhang, X. Discussion on crash accident characteristics and battery restraint safety design of electric vehicles. Mach. Build. Autom. 2016, 45, 63–65. [Google Scholar] [CrossRef]
  8. Huang, M.; Lei, Z.; Sun, H.; Chen, X. Topology optimization method for Crashworthiness of frontal anti-collision structure of pure electric vehicle. J. Hefei Univ. Technol. (Nat. Sci.) 2019, 42, 7–12. [Google Scholar]
  9. Zhang, Y.; Li, B.; Yan, X.; Wang, L.; Jiang, L.; Diao, X.; Li, T. Monitoring and early warning method of EV charging failure based on a battery model. Power Syst. Prot. Control 2021, 49, 143–154. [Google Scholar] [CrossRef]
  10. Spotnitz, R.; Franklin, J. Abuse behavior of high-power, lithium-ion cells. J. Power Sources 2003, 113, 81–100. [Google Scholar] [CrossRef]
  11. Fleischhammer, M.; Waldmann, T.; Bisle, G.; Hogg, B.-I.; Wohlfahrt-Mehrens, M. Interaction of cyclic ageing at high-rate and low temperatures and safety in lithium-ion batteries. J. Power Sources 2015, 274, 432–439. [Google Scholar] [CrossRef]
  12. Pannala, S.; Turner, J.A.; Allu, S.; Elwasif, W.R.; Kalnaus, S.; Simunovic, S.; Kumar, A.; Billings, J.J.; Wang, H.; Nanda, J. Multiscale modeling and characterization for performance and safety of lithium-ion batteries. J. Appl. Phys. 2015, 118, 072017. [Google Scholar] [CrossRef]
  13. Van den Broek, F.; Poll, E.; Vieira, B. Securing the Information Infrastructure for EV Charging. In Proceedings of the 7th International Conference on Wireless and Satellite Systems (WiSATS), Bradford, UK, 6–7 July 2015; pp. 61–74. [Google Scholar]
  14. Wang, X.; Niu, L.; Huang, W.; Jiang, J. Electrical and safety performance evaluation of electric vehicle chargers. Chin. J. Power Sources 2014, 38, 734–736+744. [Google Scholar]
  15. Zhao, M.; Zhang, N.; Zhang, H.; Chen, L. Analysis of Safety Evaluation on EV Battery Replacement Station Based on Grey Theory. Power Syst. Clean Energy 2017, 33, 103–106+114. [Google Scholar]
  16. Yin, A.; Zuo, F.; Yang, L.; Li, Z. Research on Fault Diagnosis of Pure Electric Vehicle Power Battery Based on Fuzzy Algorithm. Modern Vehicle Power 2019, 1–6. [Google Scholar] [CrossRef]
  17. Abdurahim, M.; Wang, Y.; Xiao, L.; Dong, H.; Huang, G. Electric Vehicle Safety Evaluation Based on Fuzzy Analytic Hierarchy Process. Stand. Sci. 2018, 45–52. [Google Scholar] [CrossRef]
  18. He, Z.; Guo, J.; Xu, J. On the safety risk assessment of the multimodal transportation network based on the WBS-RBS and PFWA operator. J. Saf. Environ. 2020, 20, 441–446. [Google Scholar] [CrossRef]
  19. Xie, J.; Xiao, L.; Wang, Q.; Yang, K.; Wang, Y. Risk assessment of subsea umbilical installation based on WBS-RBS and FAHP. J. Saf. Environ. 2021, 1–9. [Google Scholar] [CrossRef]
  20. Lu, Y.; Li, Q.; Zhou, Z. Safety risk prediction of subway operation based on Fuzzy Bayesian network. J. Southeast Univ. (Nat. Sci. Ed.) 2010, 40, 1110–1114. [Google Scholar]
  21. Song, Y.; Ma, L.; Yang, L.; Jiang, X. Business interruption risk analysis based on fuzzy BN: A case study of flood disaster. China Saf. Sci. J. 2019, 29, 1–6. [Google Scholar] [CrossRef]
  22. Das, M.; Ghosh, S.K. FB-STEP: A Fuzzy Bayesian Network based Data-Driven Framework for Spatio-temporal Prediction of Climatological Time Series Data. Expert Syst. Appl. 2018, 117, 211–227. [Google Scholar] [CrossRef]
  23. Rafele, C.; Hillson, D.; Grimaldi, S. Understanding Project Risk Exposure Using the Two-Dimensional Risk Breakdown Matrix; Project Management Institute: Newtown Square, PA, USA, 2005. [Google Scholar]
  24. Ye, M. Application of work breakdown structure in Faurecia project management. Proj. Manag. Technol. 2008, 205–207. [Google Scholar]
  25. Zhang, Z.; Wang, W. Improvement and application of project risk identification method based on WBS-RBS matrix. Proj. Manag. Technol. 2010, 8, 74–78. [Google Scholar]
  26. Fang, B. Risk identification and evaluation of intelligent die casting Island integration project. Master’s Thesis, College of engineering management and information technology, University of Chinese Academy of Sciences, Beijing, China, 2016. [Google Scholar]
  27. Cui, P.; Chen, X.; Shan, C.; Cao, Y.; Hu, Y.; Wang, X.; Zhang, T. Risk Identification and Analysis of Grain StorageOperation Based on WBS -R BS and BN. J. Chin. Cereals Oils Assoc. 2019, 34, 82–89. [Google Scholar]
  28. Guo, W.; Wang, H. Risk assessment of tunnel construction by using fuzzy comprehensive evaluation method based on bayesian networks. J. Railw. Sci. Eng. 2016, 13, 401–406. [Google Scholar] [CrossRef]
  29. Li, Z.; Sun, J.; Chen, L. Risk assessment for tunnel collapse based on fault tree analysis and Bayesian network. Coal Eng. 2020, 52, 130–136. [Google Scholar]
  30. Wang, J. Commercial bank comprehensive risk early warning system based on Bayesian network. Master’s Thesis, Chongqing University, Chongqing, China, 2011. [Google Scholar]
  31. Zhong, F.; Zhang, H.; Jia, H. Evaluation of Parking Pricing Policy Based on Bayesian Network. J. South China Univ. Technol. (Nat. Sci. Ed.) 2010, 38, 78–83. [Google Scholar]
  32. Liu, G.; Li, B.; Xu, J.; Xia, X.; Zhang, Y. Application of Bayesian network to identifying principal risk factors in deepwater well control. China Saf. Sci. J. 2015, 25, 157–163. [Google Scholar] [CrossRef]
  33. Gupta, M.M.; Ragade, R.K.; Fuzhong, Z.; Julian, S. A review of fuzzy set theory and Its Applications. Syst. Eng. Electron. 1981, 13–22. [Google Scholar]
  34. Wickens, C.D.; Hollands, J.; Nbury, S.; Rasuraman, R. Engineering Psychology and Human Performance; HarperCollins Publishers: New York, NY, USA, 1992; pp. 211–257. [Google Scholar] [CrossRef]
  35. Wang, Y.; Xu, K.; Li, L.; Zhang, J. Study on Hydrogen Fire and Explosion Accident in Battery-Charging Area Based on WBS-RBS-BN. J. Northeast. Univ. (Nat. Sci.) 2018, 39, 886–891. [Google Scholar]
  36. Shujie, L.; Xiangfang, L.; Yue, Z.; Jianchun, F. Reliability analysis of deepwater drilling safety barrier based on Bayesian-LOPA method. J. Saf. Sci. Technol. 2014, 10, 187–191. [Google Scholar]
  37. Wang, G.; Yu, H.; He, E.; Li, J. Design of Front Bottom Collision Condition and Optimization battery Pack Protection for Electric Vehicles. Chin. J. Automot. Eng. 2022, 12, 294–300. [Google Scholar]
  38. Li, N.; Wei, D.; Cao, Y.; Tian, B.; Li, J. Obstacle avoidance control algorithm for self-driving electric vehicles. Chin. J. Sci. Instrum. 2021, 42, 199–207. [Google Scholar] [CrossRef]
  39. Su, X.; Zhuang, Y.; Dai, H. Study on risk of new energy vehicle burning-explosion and control measure. China Saf. Sci. J. 2018, 28, 92–98. [Google Scholar] [CrossRef]
Figure 1. China’s electric vehicle output from 2016 to 2020.
Mathematics 10 03799 g001
Figure 2. Sales of electric vehicles in China from 2016 to 2020.
Mathematics 10 03799 g002
Figure 3. WBS structure example diagram.
Mathematics 10 03799 g003
Figure 4. RBS structure example diagram.
Mathematics 10 03799 g004
Figure 5. WBS-RBS coupling matrix.
Mathematics 10 03799 g005
Figure 6. WBS-RBS-BN model analysis flow chart.
Mathematics 10 03799 g006
Figure 7. Electric vehicle WBS decomposition structure tree.
Mathematics 10 03799 g007
Figure 8. RBS structure tree of the electric vehicle fire.
Mathematics 10 03799 g008
Figure 9. BN structure diagram of electric vehicle fire.
Mathematics 10 03799 g009
Figure 10. Change trend of electric vehicle retention, electric vehicle fire number, and fire probability from 2016 to 2021.
Mathematics 10 03799 g010
Figure 11. Bayesian model deduction of electric vehicle fire.
Mathematics 10 03799 g011
Table 1. Event probability fuzzy numbers and Cut set.
Fuzzy NumbersCut Set
fVL = (0, 0, 0.1, 0.2)fλVL = [0.1λ + 0, −0.1λ + 0.2]
fL = (0.1, 0.2, 0.3)fλL = [0.1λ + 0.1, −0.1λ + 0.2]
fFL = (0.2, 0.3, 0.4, 0.5)fλFL = [0.1λ + 0.2, −0.1λ + 0.5]
fM = (0.4, 0.5, 0.6)fλM = [0.1λ + 0.4, −0.1λ + 0.6]
fFH = (0.5, 0.6, 0.7, 0.8)fλFH = [0.1λ + 0.5, −0.1λ + 0.8]
fH = (0.7, 0.8, 0.9)fλH = [0.1λ + 0.7, −0.1λ + 0.9]
fVH = (0.8, 0.9, 1.0)fλVH = [0.1λ + 0.8, −0.1λ + 1.0]
Table 2. Name of electric vehicle system corresponding to each number in WBS tree.
NumberSystem CodeSystem Name
1W1Vehicle control system
2W1The power supply system
3W3Electric drive system
4W4Auxiliary system
5W11Vehicle controller
6W12Car body
7W13Instrument
8W21Battery
9W22Power management system
10W23Battery charger
11W24Auxiliary power supply
12W31Motor controller
13W32Power converter
14W33Motor
15W34Mechanical transmission device and wheelset
16W41Power steering system
17W42Air conditioning unit
18W43lighting unit
19W44Defrosting unit
20W45The auxiliary electrical and electronic system
Table 3. Names of electric vehicle fire risk factors in RBS tree.
NumberRisk NumberRisk Name
1R1Human factors
2R2Object factor
3R3Machine factor
4R4Environmental factor
5R11Weak awareness of human security
6R12Human illegal and criminal acts
7R13Fire not found in time
8R21External hot object
9R22Objects with collision risk
10R23Unqualified charging equipment
11R31Substandard power supply system
12R32Unqualified electrical equipment
13R33Unqualified transmission equipment
14R34Vehicle parts aging
15R41Severe weather conditions
16R42Poor driving conditions
Table 4. WBS-RBS coupling matrix of the electric vehicle fire.
RBSWBS
W1W2W3W4
W
11
W
12
W
13
W
21
W
22
W
23
W
24
W
31
W
32
W
33
W
34
W
41
W
42
W
43
W
44
W
45
R1R110111001001101111
R120101000000100100
R130101001001101101
R2R210100000000100000
R220101111001110001
R230101000000100100
R3R310001111000000001
R321000000111001111
R330001001001001111
R340101000000001110
R4R410101000000000000
R420101000000000000
Table 5. Prior probability and posterior probability of each risk factor.
Node NumberRisk FactorsPrior ProbabilityPosterior Probability
X1Battery quality failure0.3100.406
X2Battery soaking0.2700.293
X3Battery overcharge0.1900.176
X4Charging equipment failure0.2300.239
X5Air conditioning fault0.1200.126
X6Electrical equipment failure0.1300.140
X7Transmission line damage0.1200.133
X8Defroster temperature is too high0.1100.111
X9Blocked exhaust pipe0.1000.117
X10Ignition source0.1050.107
X11Collision ignition0.3800.700
X12Man-made arson0.1000.102
X13Artificial modification0.3500.382
X14No early open fire found0.1500.152
X15The vehicle is not equipped with fire-fighting equipment0.1100.114
Table 6. Critical importance of each risk factor.
Node NumberCritical Importance (ICrxi)Node NumberCritical Importance (ICrxi)
X113.88X91.90
X23.09X100.20
X31.45X1151.75
X41.97X120.19
X50.69X135.00
X61.24X140.29
X71.49X150.42
X80.10
Publisher’s Note: MDPI stays neutral with regard to jurisdictional claims in published maps and institutional affiliations.

