1. Introduction
Currently, several specialized benchmarks are used to test the performance of clusters, based on which lists of the most productive systems are created: the high-performance conjugate gradient (HPCG) benchmark [
1,
2], NAS parallel benchmark (NPB) [
3], and Graph 500 [
4]. However, the Linpack high-performance benchmark [
5] remains the most popular, despite fair criticism, and is from which the TOP500 list is formed. Inclusion in this list is still very prestigious and characterizes the general level of development of high-performance computing in the country.
Unfortunately, benchmarking a cluster is a complex and expensive procedure. The availability of special tools to automate this process [
6] only slightly reduces the testing cost. Therefore, the problem of obtaining simple formulae that allow calculating the performance of a cluster with an acceptable error (up to 3%) and studying the dependence of this performance on its main parameters without resorting to a real testing procedure is very relevant.
An analysis of the TOP500 lists shows that they include both clusters with accelerators (Nvidia in most cases) and clusters without accelerators. It is important to note that the share of clusters with accelerators is gradually changing upwards. For example, in the November 2014 TOP500, it was about 13%, and in the June 2021 TOP500, it reached 35%. However, clusters without accelerators still dominate the TOP500. Note that the Fugaku supercomputer, which ranked first in the June 2021 TOP500, does not use accelerators. Therefore, this study is devoted to evaluate the performance of this kind of cluster.
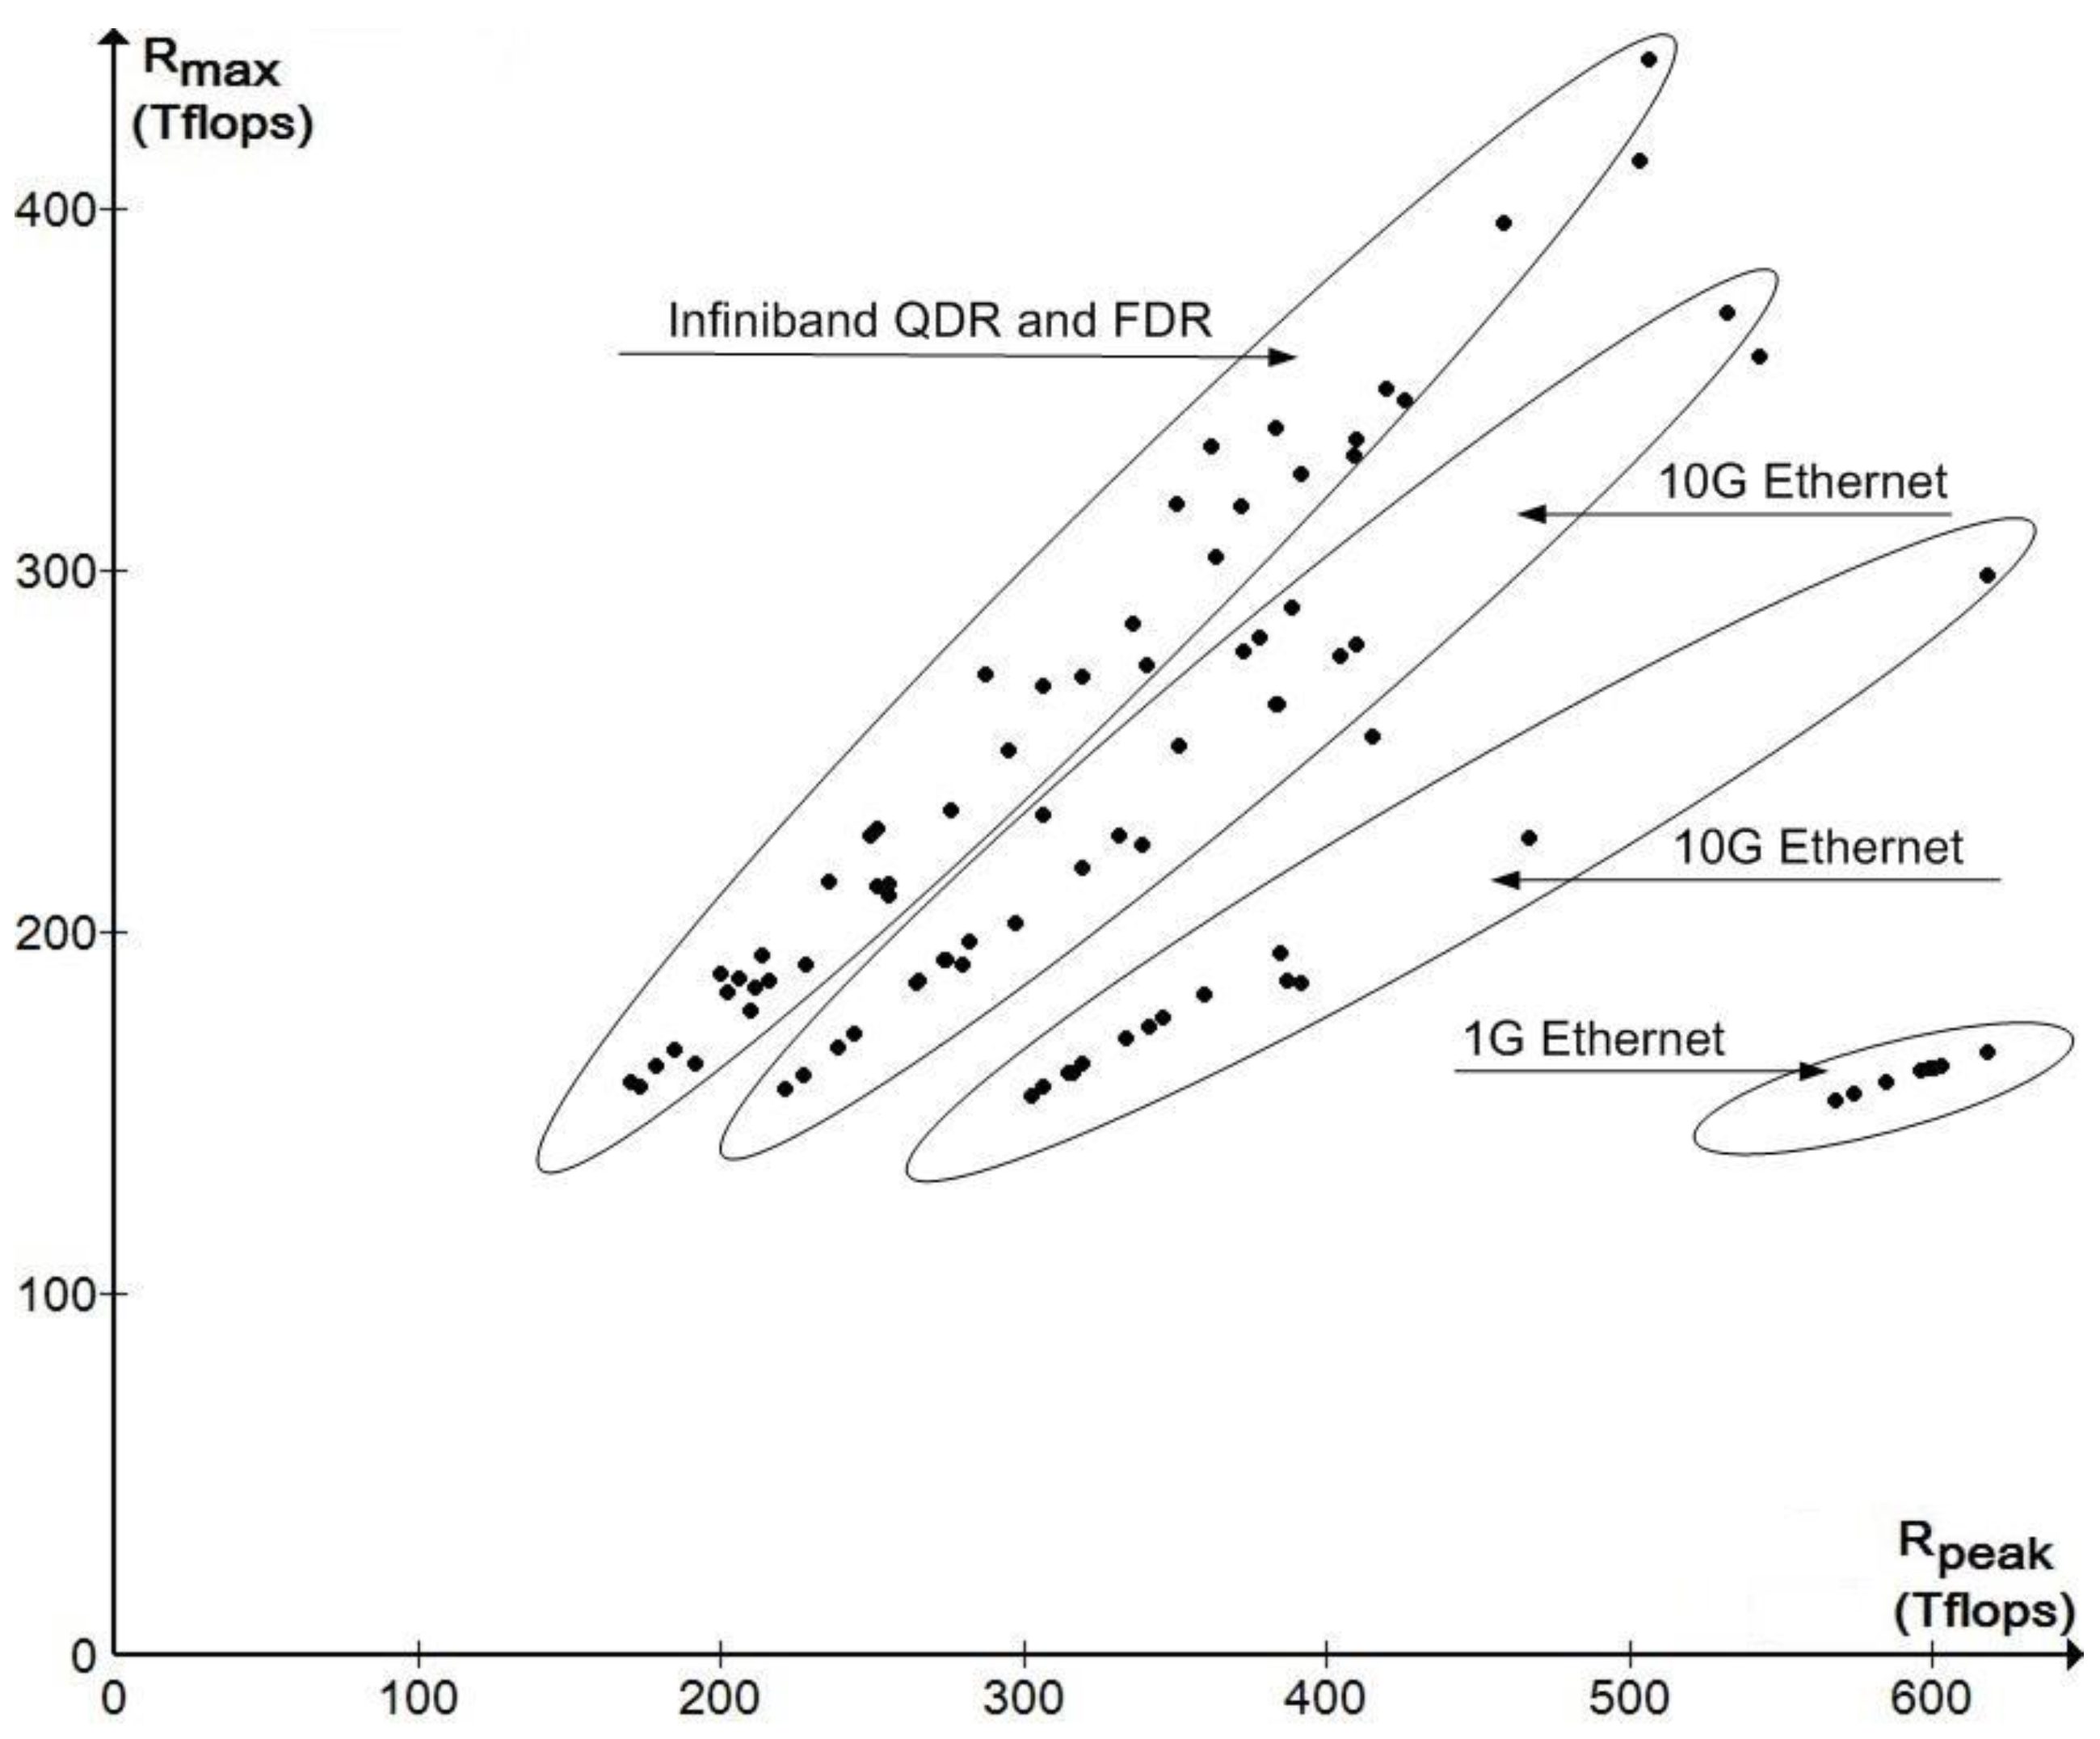
Figure 1 shows the measured performance R
max of clusters based on the Intel Xeon E5-2670 processor without accelerators compared to their peak performance R
peak with different system interconnect organization (November 2014 TOP500). The choice of this particular processor is explained by the large number of clusters based on it in the given list, which made it possible to show an explicit functional dependence of R
max on R
peak and the throughput of the system interconnect.
The aim of this study was to identify this dependence in order to obtain calculated ratios for the estimation of Rmax from the cluster parameters. It is clear that Rmax depends on a large number of parameters, among which the following can be distinguished:
processor performance
node performance
number of nodes
system connectivity (Ethernet, InfiniBand, Omni-Path, etc.)
network topology (Fat Tree [
6], Dragonfly [
7], Jellyfish [
8], 6D Torus [
9], etc.)
network interface bandwidth
encoding (8b/10b, 64b/66b)
number of network interface cards (NICs) in the node
number of network interfaces in the NICs
use of remote direct memory access (RDMA)/RDMA over converged Ethernet (RoCE) mode
PCI-E bus bandwidth
version of the operating system (Red Hat EL, Ubuntu, CentOS Linux, etc.)
MPI library version (Fujitsu Software Technical Computing Suite, OpenMPI, Intel MPI, etc.)
It is rather difficult to reveal the actual dependence of Rmax on the listed parameters, since some of them cannot be determined numerically. Therefore, the task is to obtain an estimate of this dependence that allows, with an acceptable error for practical use (up to 3%), determination of the performance of a cluster based on its main parameters: node performance, number of nodes, and system interconnect throughput. The presence of such an estimate makes it possible to predict the change in cluster performance based on the listed parameters without having to resort to a complex and expensive testing procedure. It should be noted that no such studies were found in the publications available to the author.
2. Materials and Methods
To approximate the real dependence of R
max on cluster parameters, it is proposed to use the following relationship:
where Ψ(R
peak) defines the performance loss compared to the theoretical peak R
peak.
For research purposes, it is more convenient to consider the dependence of R
max not on R
peak, but on the number of nodes N in the cluster, i.e.,:
where P
peak is the theoretical peak performance of a cluster node according to the Linpack benchmark.
For dual-processor nodes prevailing in TOP500 lists, N = M/(2 × L), where M is the total number of processor cores in the cluster and L is the number of cores in the processor. Then, Ppeak = Rpeak/N.
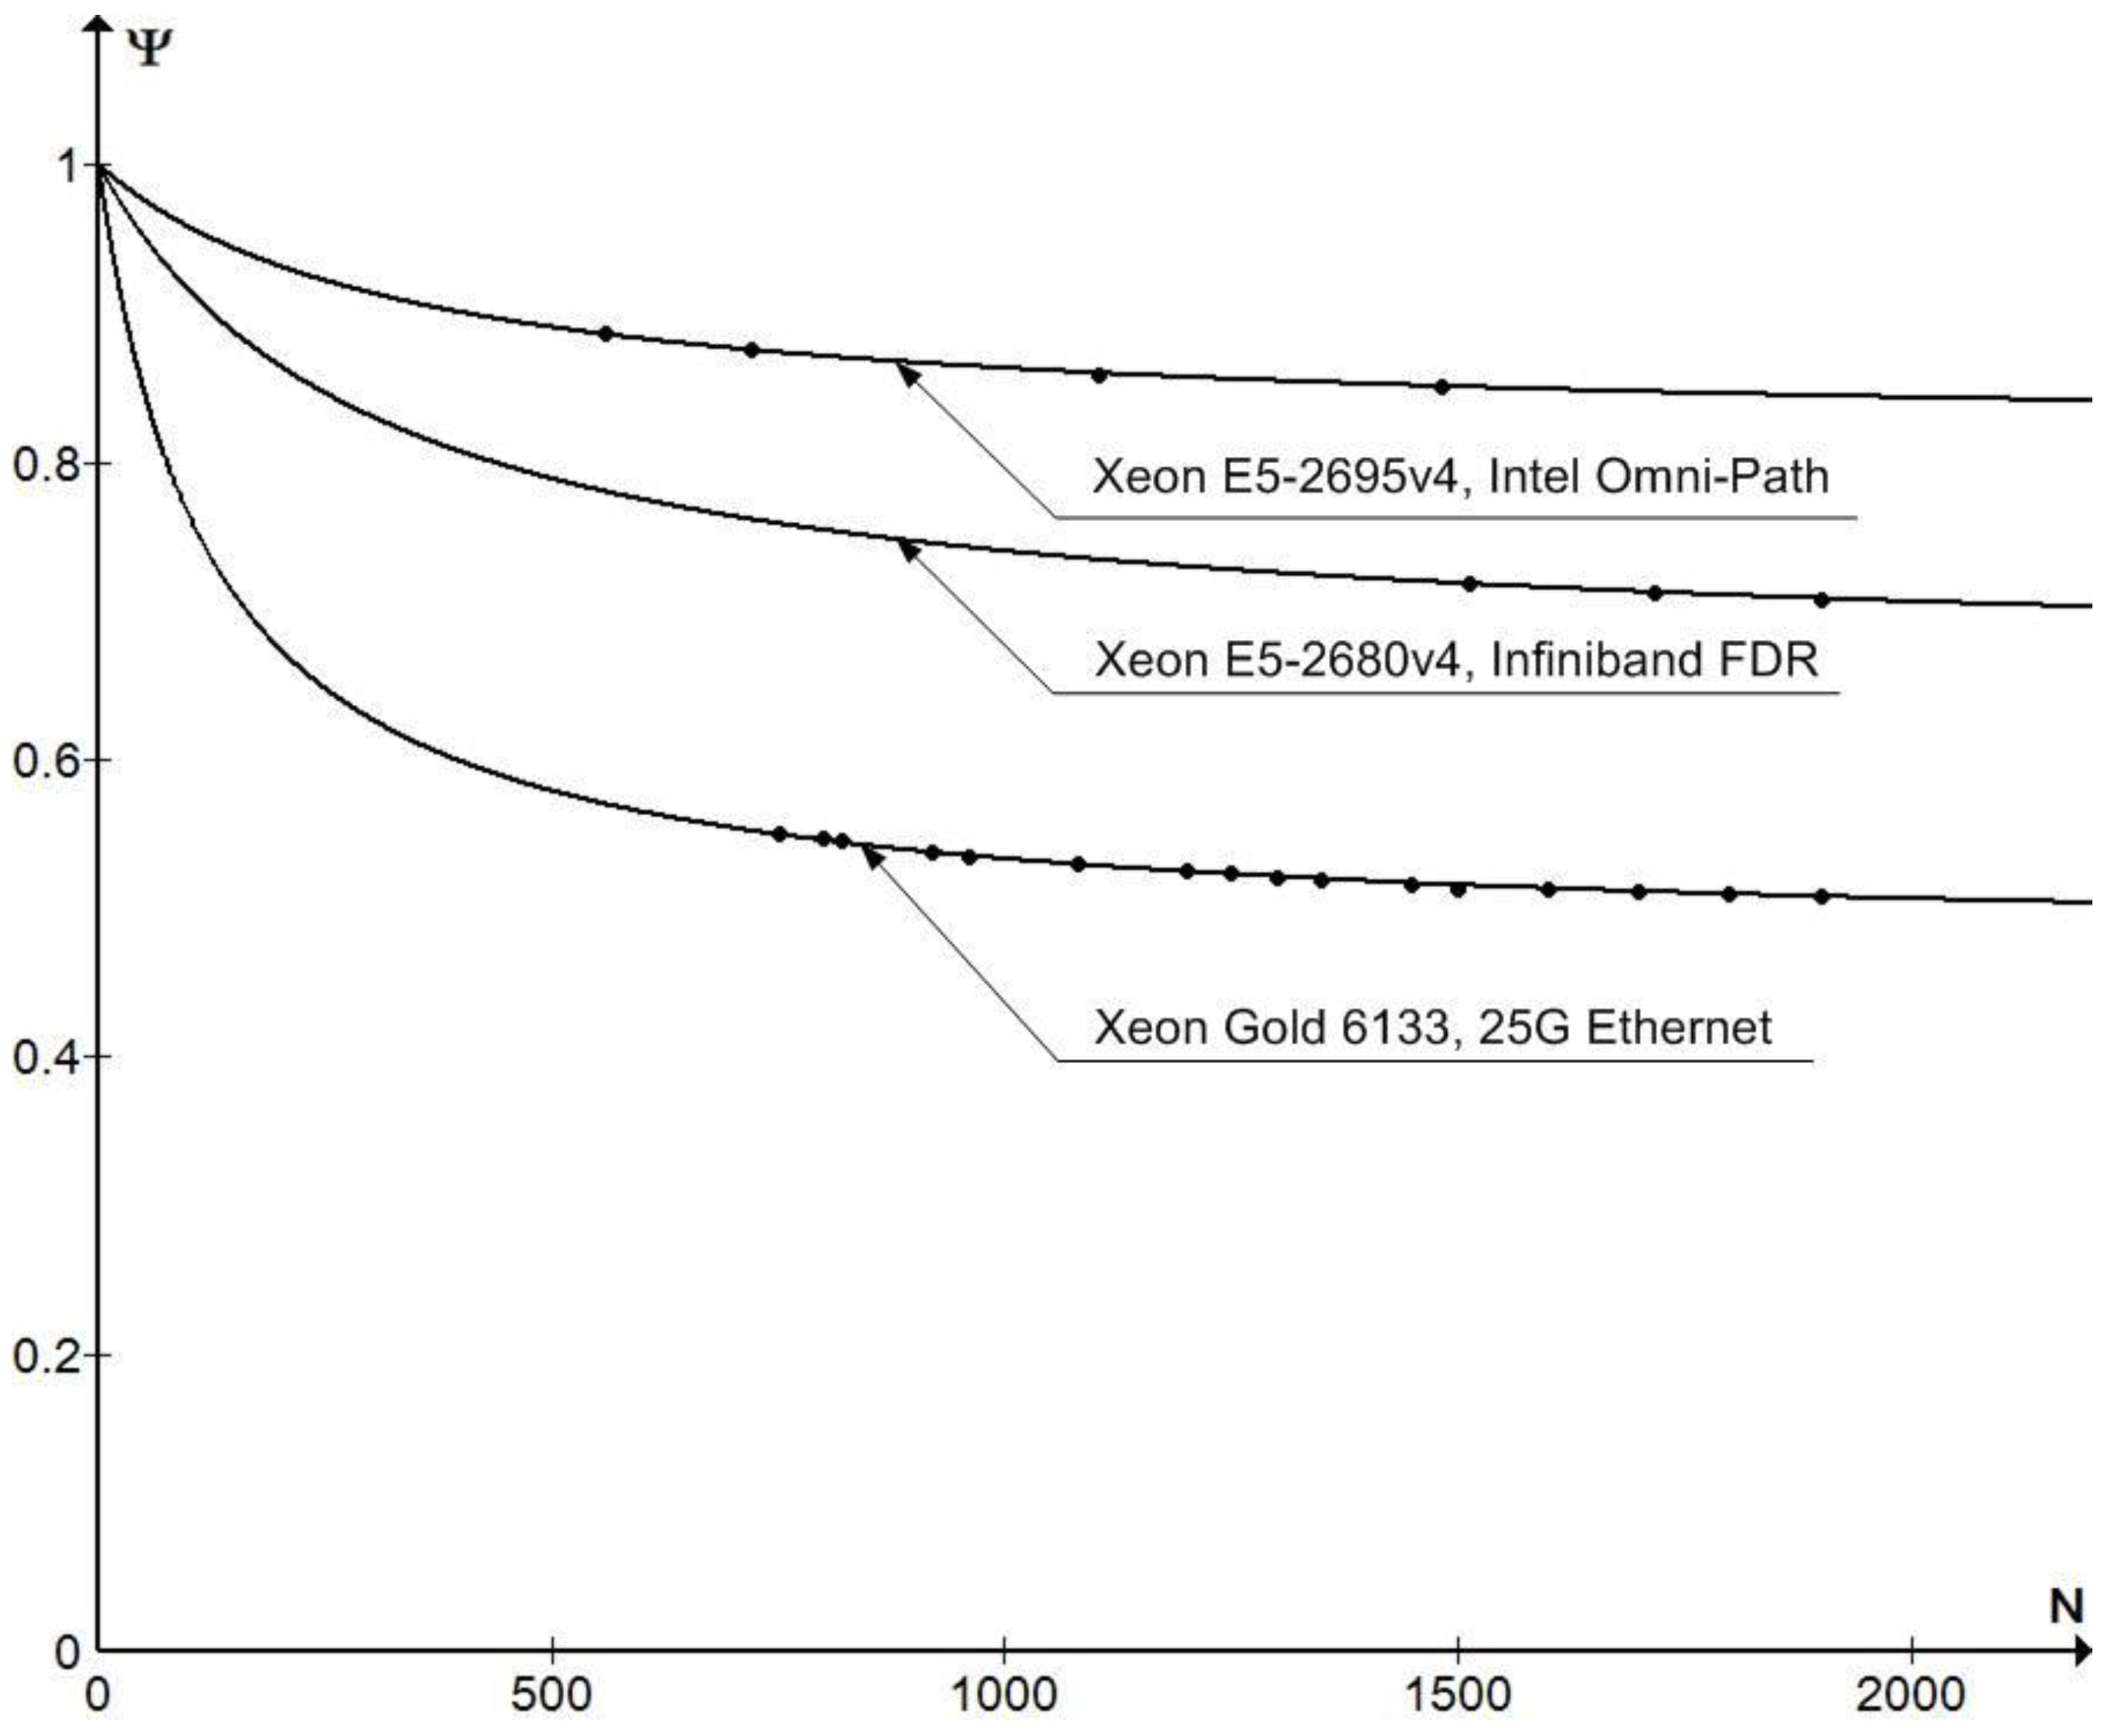
Figure 2 shows a typical dependence of Ψ(N) for some processors and system interconnects (November 2020 TOP500).
It is reasonable to assume that when N = 0, there are no losses and the coefficient Ψ(0) = 1. Considering this assumption, the dependence Ψ(N) is well approximated by a function of the form
Let us determine the coefficients A and B by the key parameters of the cluster and to enter the following notations:
Ppeak—peak performance of a cluster node by Linpack (Gflops);
Ssys—actual throughput of the system interconnect for a node (Gbits/s);
K—number of NICs (network interface cards) in the node;
Slan—throughput of all active network interfaces in the NIC (Gbits/s);
Spci-e—throughput of the PCI-E interface in the node through which the NIC is connected (Gbits/s).
Then, A is determined by the following relationship:
Since network throughput is measured in Gbits/s, and Linpack evaluates cluster performance (Gflops) on double-precision (64-bit) floating point operations, the Ppeak/64 ratio determines the number of floating point operations per second per 1 bit.
In turn, the real system link throughput for a cluster node is determined as follows:
The summation is done over all NICs (the NIC index i is omitted).
When using the RDMA mode, a data block is transferred directly from the RAM of the source node to the RAM of the destination one. In this case, the delay for the transmission of a data block is determined by the overall speed of the node’s network interfaces Slan.
If the RDMA mode is not used, different NICs (single-port, dual-port, quad-port with 1x, 4x, 8x or 16x PCI-E 2.0/3.0/4.0) can be installed simultaneously in the cluster nodes, resulting in many possible configurations. Without the RDMA mode, the data block is first written from the source node’s RAM to the NIC transfer buffer via PCI-E and only then transferred to the destination node via the network, i.e., the block transfer delay is the sum of the buffering delay, which is determined by the PCI-E bandwidth, and the network transfer delay.
The coefficient ξlan determines the proportion of useful information in a frame. Each Ethernet frame contains an interframe gap, preamble, start and end symbols, Ethernet header, including IEEE802.1q tag, frame check sequence, IP header, TCP header, and application header, which are more than 100 bytes in total. For a frame of maximum length, this is about 7%. Thus, for the Ethernet frame without the RDMA/RoCE mode, ξeth ≈ 0.93. If the RDMA/RoCE mode is used, ξeth ≈ 0.91 (additional 28-byte header according to RFC5040 is inserted). For the InfiniBand frame, ξIB ≈ 0.99. The difference is due to the format and the maximum frame size.
The calculation of B in (2) is performed according to the following formula:
The coefficient k = 3.6 was determined empirically.
Thus, Formulae (1)–(5) allow us to obtain the function max(N) and to study the dependence of the cluster performance on its main parameters.
3. Results and Discussion
Before discussing the examples of calculations, it should be noted that TOP500 lists do not contain detailed information about the configuration of the network interfaces in the cluster nodes. Therefore, the Ssys values given below, calculated by Slan and Spci-e, are the most likely (in the author’s opinion) reconstruction of the real configurations. At the same time, in some cases, with different options for the organization of a system interconnection, approximately the same results (with an error of up to 3%) can be obtained.
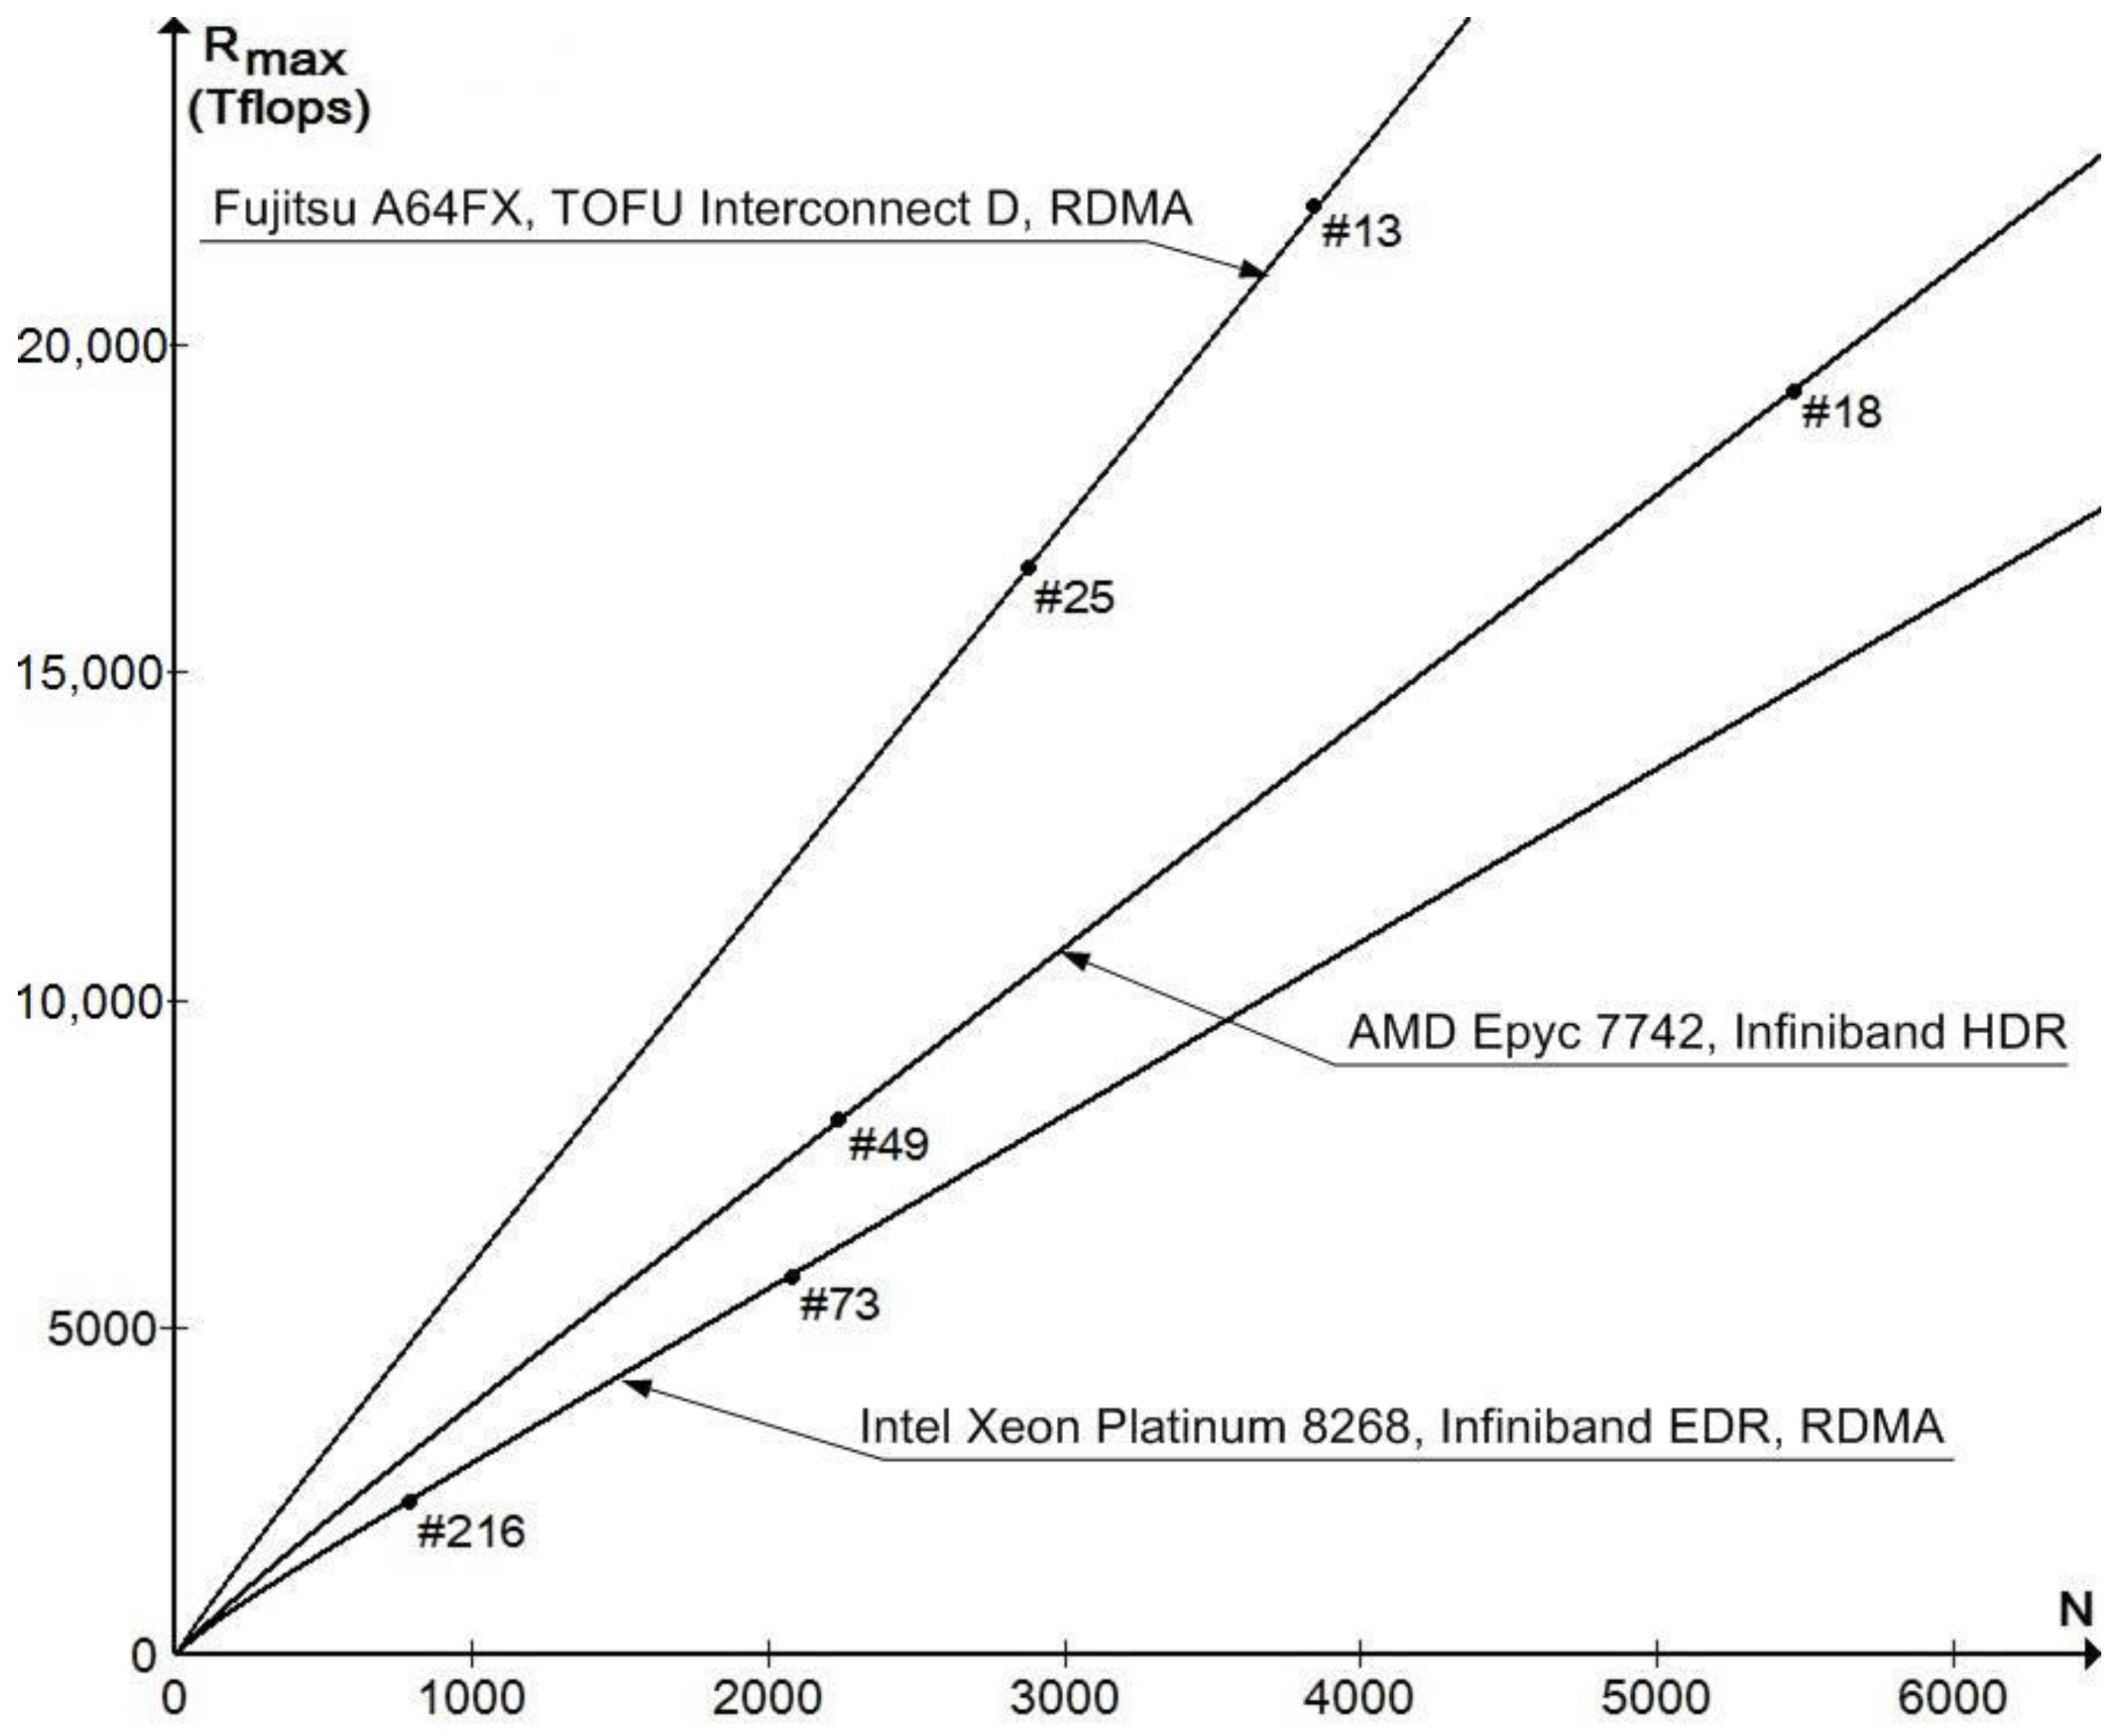
Let us look at the clusters based on the Intel Xeon Platinum 8268 CPU, 1 NIC InfiniBand EDR 4x, PCI-E 3.0 16x, RDMA mode.
Then, the function
max(N) has the form:
The plot of
max(N) is shown in
Figure 3.
Calculation error ε = |(Rmax − max)/Rmax| × 100% in comparison with the Rmax values given in the June 2021 TOP500 for clusters 73 and 216 does not exceed 2%.
Consider clusters based on the AMD Epyc 7742 processor, 2 NIC InfiniBand HDR 4x, PCI-E 4.0 16x, and RDMA mode not used. Note that instead of the two specified NICs, two dual-port InfiniBand HDR100 4x NICs can be installed.
Then, the function
max (N) has the form:
The plot of
max(N) is shown in
Figure 3. The computational error ε compared to the R
max values reported in the June 2021 TOP500 for clusters 18 and 49 is still no more than 2%.
Let us consider the PrimeHPC FX1000 cluster [
10] based on the Fujitsu A64FX processor (ARM architecture) with Tofu Interconnect D, the RDMA mode. Since Tofu Interconnect D is a proprietary technology of Fujitsu, let us discuss it in more detail.
An important feature of the PrimeHPC FX1000 cluster is that Tofu Interconnect D is integrated with the A64FX processor, which implements 10 ports with a nominal throughput of 28.05 Gbits/s and 64b/66b encoding [
10]. Since the maximum frame size of Tofu is about 2000 bytes, i.e., have the maximum InfiniBand frame size, the coefficient ξ
TOFU ≈ 0.98.
A dedicated network is required to manage and access the cluster, which, with 10 Tofu ports, can hardly be organized with any other network technology. Therefore, it is reasonable to assume that to establish a system connection (6D Torus topology [
10,
11]), 9 out of 10 Tofu ports are used in each processor and one port is dedicated to the control network. In this way, the system interconnect throughput with the RDMA mode for a dual-processor cluster node can be calculated:
To calculate coefficient B, you need to determine the bandwidth of the connection between the Tofu ports and the processor cores. Since the A64FX processor implements the PCI-E 3.0 interface, the RDMA mode support requires four PCI-E 3.0 16x interfaces. Therefore, for dual-processor nodes:
Then B ≈ 3.6 × 1008 × (1 − 0.82) ≈ 65 and the resulting relation takes the form:
The plot of
max (N) can be seen in
Figure 3. The computational error ε in comparison with the R
max values reported in the June 2021 TOP500 for clusters 13 and 25 is again no more than 2%.
If we increase the number of dual-processor nodes to 79,488, then max ≈ Tflops, which corresponds to the Fugaku system occupying the first row in the June 2021 TOP500 with Rmax = 442,010 Tflops. Calculation error ε < 1%.
Figure 4 shows examples of the
max(N) dependence for the Intel Xeon Gold processor family, which is most popular in building clusters today. Note that the computational error does not exceed 2% for any clusters considered.
Table 1 contains the results of calculations for various clusters from June 2021 TOP500, which are not shown in
Figure 3 and
Figure 4, specifically selecting clusters from different parts of the TOP500 table with processors of different generations and different system connections.
4. Conclusions
The study of the TOP500 results made it possible to show the dependence of the performance of clusters without accelerators on their main parameters: the theoretical peak performance of a cluster node, the number of nodes, and the throughput of the system interconnect. At the same time, the estimation error does not exceed 2%, which makes it possible to predict the performance for the cluster configurations that do not belong to the TOP500 with an accuracy acceptable for practice.
This does not mean at all that other parameters have no influence on the result and can be neglected when constructing clusters. For example, an unfortunate network topology or MPI library version can lead to a significantly worse result. The obtained results make it possible to predict the performance of a cluster with the specified accuracy only if the most common topologies, versions of operating systems, software libraries, and compilers are used. On the other hand, if a now-common topology (e.g., Fat Free) is replaced by a more complex one (e.g., 6D Torus), only a slight improvement in performance can be obtained on the Linpack benchmark.
The author is continuing research towards a generalization of the obtained results to clusters with different types of accelerators.


