Article

A Simple Stability Analysis for a Mathematical Model of Migration Due to Noise and Resources

by
Carlos Ramirez-Carrasco
1,*,
Fernando Córdova-Lepe
1 and
Nelson Velásquez
2
1
Departamento de Matemática, Física y Estadística, Facultad de Ciencias Básicas, Universidad Católica del Maule, Talca 3460000, Chile
2
Departamento de Biología y Química, Facultad de Ciencias Básicas, Universidad Católica del Maule, Talca 3460000, Chile
*
Author to whom correspondence should be addressed.
Mathematics 2022, 10(19), 3485; https://doi.org/10.3390/math10193485
Submission received: 26 July 2022 / Revised: 13 September 2022 / Accepted: 14 September 2022 / Published: 23 September 2022

Abstract

:
This research studies a metapopulation model where each patch is considered a form of fragmentation of the environment produced by the spatio-temporal variability of anthropogenic noise. A deterministic mathematical model is proposed that describes two processes of migration between patches. The first process consists of migration due to chronic critical noise produced by an anthropogenic and biological source (self-generated acoustic signals of higher intensity, due to the Lombard effect). The second process consists of migration due to a higher level of stain occupancy. A simple and classical analysis of the local stability of the model is performed. The results indicate that no subpopulation goes extinct; in fact, a necessary condition for long-term stabilization of the size of the subpopulations is that the noise attenuation rate is higher. Moreover, as long as the noise is of low intensity the differences in the carrying capacity of each patch do not produce substantial, long-term differences in the sizes of the subpopulations. However, as the noise intensity increases, the difference in carrying capacities produce noticeable, long-term differences between subpopulation sizes. Finally, the results are corroborated by numerical simulations.
MSC:
34D20; 92B05; 92D25; 92D40

1. Introduction

Biologists have explored a variety of population models that incorporate spatial characteristics. One such model is called a metapopulation model. This term was proposed in 1969 by the mathematical ecologist R. Levins when he observed that the effectiveness of any insect pest control program is inevitably complicated by environmental heterogeneity [1]. This produces a fragmentation of the environment into a group of subpopulations, linked and distributed in a set of spatially discrete habitats or patches, called a metapopulation [2,3]. Currently, several researchers use the metapopulation approach to study, for example, the persistence of local populations [4,5,6,7].
In a metapopulation, the subpopulation occupying different patches is linked through exchanges of individuals (migration) [8,9]. Migration is a consequence of different factors such as the season of the year, competition, or a lack of some resource relevant to survival [10,11,12,13].
Patches with different noise intensity levels can be seen as a form of fragmentation of the environment due to the spatio-temporal variability of noise. Thus, animals are exposed to a large number of different acoustic environments within which they must survive with the resources of each environment [14,15,16]. One of the effects, little studied, on animal behavior is migration to avoid noisier patches [17] because noise acts as a sound that masks biologically relevant acoustic signals of animals, negatively affecting communication, distribution, mate searching, foraging and even survival [18,19,20,21,22,23,24,25,26]. For example, in birds, anthropogenic noise affects migration rates to wintering grounds as some species avoid noisier stopover sites [27,28], and it has been observed that chronic traffic noise affects embryo growth and mortality rates in zebra finches [29]. In marine animals, such as whales, migration is diverted in response to the avoidance of noise sources [30]. Ship noise negatively affects the survival of beaked whales, damselfish, and marine invertebrates, thereby increasing their mortality rates [31,32,33,34]. In amphibians, traffic noise causes physiological stress and impairs breeding migratory behavior in frogs.
In response to noise, animals tend to increase the intensity of acoustic signals (a phenomenon known as “Lombard effect”) [35,36,37] so that acoustic signals relevant to the survival of the population are not masked by noise and are recognized by their target receptors [38,39,40,41]. However, when anthropogenic noise is chronic and critical (i.e., because of its long duration and high intensity, it positively affects the mortality rate), increasing the intensity of acoustic signals favors both the negative effects of anthropogenic noise and the energetic [42,43,44,45,46,47,48], behavioral [49,50], and predation costs [51,52,53,54]. Therefore, sounds generated by the use of higher intensity acoustic signals as a consequence of the Lombard effect together with chronic and critical anthropogenic noise negatively affect population survival [55,56].
Another factor that may increase migration rates is the transient availability and changing location of resources [57]. Since higher occupancy levels (which is the proportion between the size of the subpopulation and the carrying capacity of the patch) decrease resource availability, patch occupancy can play a crucial role in promoting migration. There are, however, few studies that have investigated migration as a process that depends on the level of occupation [58,59]. Nevertheless, there is evidence of an increase in the rate of migration with increasing occupancy level [60,61,62].
In this sense, this research studies, by means of a new deterministic mathematical model, the effects of noise and lack of resource on two processes of population migration, complementing the model proposed in Ramírez Carrasco et al. [56], where the effects of noise on population persistence are studied. The first is a unidirectional migration of the population towards the nearest patch with lower noise intensity level. The noise is fed from two sources: an anthropogenic source and the use of higher amplitude acoustic signals self-generated by the population and caused by the Lombard effect. The second is a random migration in search of the patch with the lowest occupancy level. The objective of this research is to obtain sufficient conditions on the model parameters to characterize the asymptotic values of the subpopulation sizes. Finally, the theoretical results are corroborated by numerical simulations.

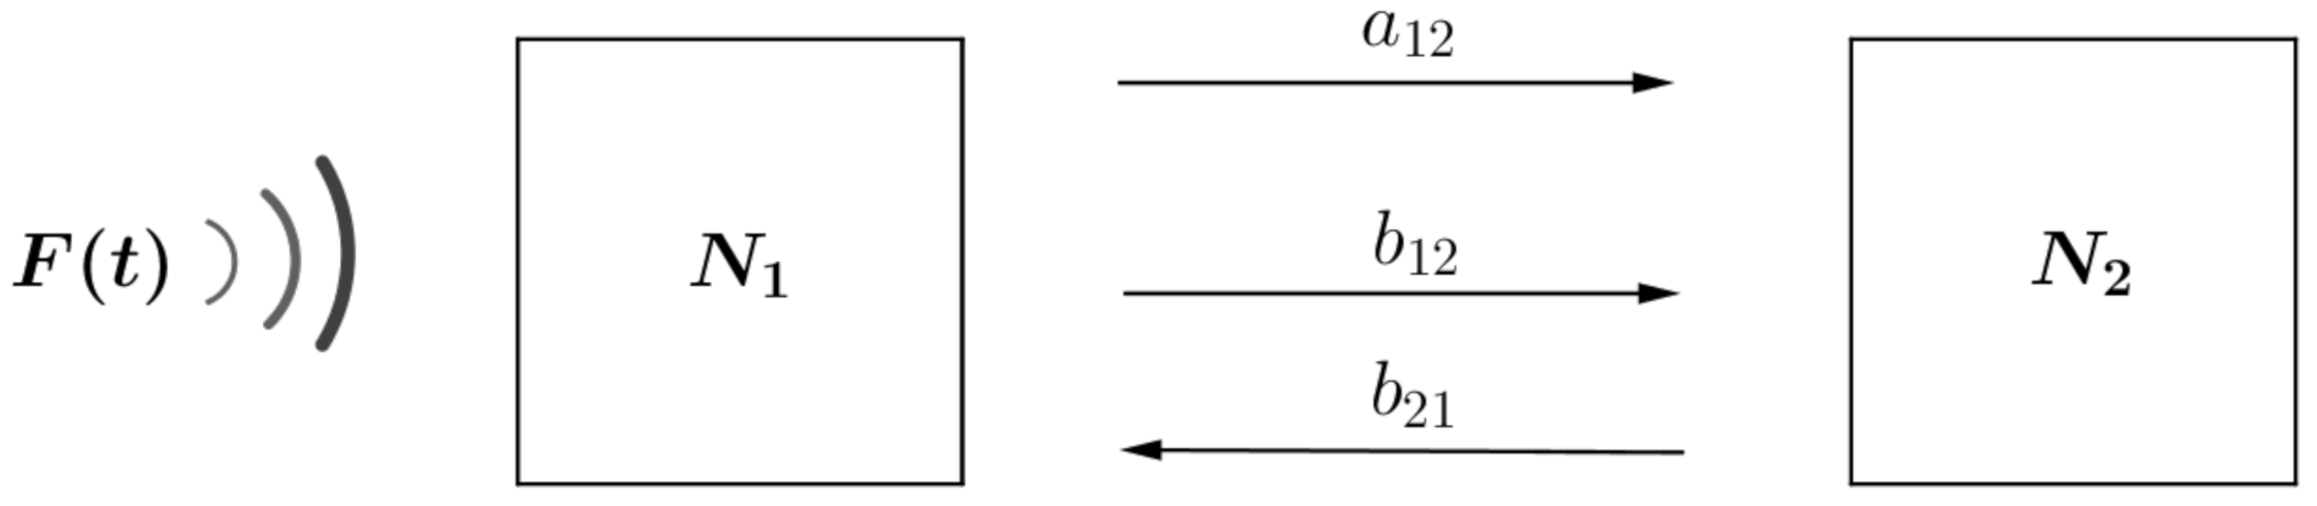
2. Model Formulation

A single species population is considered where individuals are identical and distributed in n discrete patches in a noisy environment. The state variables of the model are non-negative functions of time N i ( t ) and I i ( t ) , which denote the population density and noise intensity in patch i at time t, respectively. Each patch is characterized by two dynamics, the internal one of birth-death, and the migratory one that links it to other patches and that is associated with a noise dynamic fed by an anthropogenic source and the use of higher intensity acoustic signals, due to the Lombard effect, by the population. Migration is the population response to the high noise and higher occupancy level in each patch, so that each patch may act as a source of individuals to, and can be colonized by individuals coming from, any other patches. A general model ( Z ) that describes this phenomenon in patch i, i { 1 , 2 , , n } is given by:
( Z ) N i ( t ) = f i ( N i ( t ) ) N i ( t ) j = 1 j i n M i j + k = 1 k i n M k i + , I i ( t ) = α i F ( t ) + β ( I i ( t ) ) N i ( t ) γ I i ( t ) ,
where f is the per capita growth rate in patch i in the absence of migration; M i j = ( a i j ( I i ( t ) ) + b i j ) N i ( t ) is the emigration rate from patch i to patch j defined by per capita rates a i j ( I i ) and b i j due to noise and occupancy level, respectively; M k i + = ( a k i ( I k ( t ) ) + b k i ) N k ( t ) is the immigration rate towards patch i from patch k, given by per capita rates a k i ( I k ) and b k i , due to noise and occupancy level respectively; F is a non-negative, continuous, bounded function denoting the noise emitted by an anthropogenic source; α i is the rate of anthropogenic noise in patch i; γ is the rate of noise attenuation by various atmospheric factors such as variation in temperature, humidity and wind speed [63,64]; and β is a non-decreasing, non-negative, continuous, bounded function denoting the acoustic signals emitted by the population in response to anthropogenic noise, due to the Lombard effect.
The nature of the migration processes depends largely on the behavior of the individual and the quality of the habitat inhabited by the population. The model ( Z ) , by appropriate choice of coefficients a i j and b i j , can accommodate a wide range of different migration processes. This research assumes that all patches are aligned, equally spaced, and distributed along a gradient in which noise decreases linearly. Furthermore, each subpopulation grows with logistic dynamics. Two migration processes between patches are considered, where individuals move only between adjacent patches:
  • Unidirectional dependent on noise level. Individuals migrate towards patches with decreasing anthropogenic noise rate. For this, the migration rate is considered proportional to the noise as
    a i j = a I i ,
    where, to simplify calculations, the value of a > 0 is considered the same for all patches.
  • Random dependent on the difference between occupation levels. Individuals migrate towards patch with lower occupancy level (independent of subpopulation sizes). For this, the migration rates is considered inversely proportional to the carrying capacity of each patch as
    b i j = b K i ,
    where b > 0 is the marginal rate of migration, which for simplicity, in the calculations, is considered the same value for all patches.
Therefore, for n = 2 (Figure 1), the following system of equations is obtained:
( M ) N 1 ( t ) = r 1 1 N 1 K 1 N 1 + b N 2 K 2 N 1 K 1 a I 1 N 1 N 2 ( t ) = r 2 1 N 2 K 2 N 2 b N 2 K 2 N 1 K 1 + a I 1 N 1 I i ( t ) = α i F ( t ) + β ( I i ( t ) ) N i ( t ) γ I i ( t ) , i = 1 , 2 ,
where α 1 > α 2 ; r i > 0 and K i > 0 are the intrinsic growth rate and carrying capacity of the population in patch i, respectively.

3. Model Analysis

To simplify the analysis of the ( M ) model, it is assumed that the level of noise intensity emitted by the anthropogenic source and the acoustic signals self-generated by the population are always constant. That is, F ( t ) = F 0 > 0 and β ( I ) = β 0 > 0 . In addition, the ( M ) model can be expressed in dimensionless quantities to reduce the number of parameters describing the system.
The following substitutions are used:
x i = N i K i , I i = y i , δ i = b r K i , ρ = a r , k = K 1 K 2
λ i = α i r , η i = K i r , μ = γ r τ = r t , i = 1 , 2 .
Since only the noise dynamics in the patch closest to the source is of interest, y 1 = y is considered. The dimensionless quantities are substituted into the model ( M ) and the following system of equations is obtained:
( M ) x 1 ( t ) = x 1 1 x 1 + δ 1 x 2 x 1 ρ y x 1 x 2 ( t ) = x 2 1 x 2 δ 2 x 2 x 1 + k ρ y x 1 y ( t ) = λ F 0 + η β 0 x 1 μ y .

3.1. The Existence of Equilibrium Points

The model ( M ) is discussed, and it is observed that it has the following equilibrium points:
  • E 0 = 0 , 0 , λ F 0 μ , which represents the extinction of the population in both patches.
  • E 1 = x 1 * , x 2 * , λ F 0 μ + η β 0 x 1 * μ , which represents the persistence of the population in both patches.
With
x 2 * = x 1 * δ 1 ρ η β 0 γ + 1 x 1 * 1 δ 1 ρ λ F 0 μ ,
and x 1 * being a root of the following polynomial
D 3 z 3 + D 2 z 2 + D 1 z + D 0 = 0 ,
where
D 3 = 1 δ 1 ρ η β 0 μ + 1 2 , D 2 = 2 δ 1 2 ρ η β 0 μ + 1 1 δ 1 ρ λ F 0 μ , D 1 = 1 δ 1 ρ η β 0 μ + 1 δ 2 1 δ 1 1 δ 1 ρ λ F 0 μ 2 and D 0 = 1 δ 1 δ 2 1 δ 1 ρ λ F 0 μ ;
Since every polynomial of odd degree has at least one real root and by Descartes’ sign criterion, x 1 * is the unique positive real root of the equation, provided that
0 < 1 δ 1 ρ λ F 0 μ < δ 2 and 1 δ 1 ρ λ F 0 μ ρ η β 0 μ + 1 1 < x 1 * .

3.2. Local Stability Analysis

In this part, the local stability of the model ( M ) is analyzed for each of the equilibrium points.
Theorem 1.
The equilibrium point E 0 is unstable.
Proof. 
The Jacobian matrix of the model ( M ) at point E 0 is calculated is obtained:
J ( E 0 ) = 1 δ 1 ρ λ F 0 μ δ 1 0 δ 2 + k ρ λ F 0 μ 1 δ 2 0 η β 0 0 μ
and the characteristic equation is given by
( ξ 2 A 1 ξ + A 0 ) ( ξ + μ ) = 0 ,
where
A 1 = 1 + 1 δ 1 ρ λ F 0 μ δ 2 and A 0 = 1 δ 1 ρ λ F 0 μ δ 2 .
Using the Routh–Hurwitz criterion, the characteristic polynomial has roots with negative real parts if and only if A 1 < 0 and A 0 > 0 . However, if A 0 > 0 then A 1 < 0 is impossible. Therefore, the result is obtained. □
The above result indicates that, despite the noise, the subpopulations in each of the two patches never become extinct.
Theorem 2.
The equilibrium point E 1 is stable if B 2 > 0 , B 1 > 0 , B 0 > 0 and ( B 2 B 1 B 0 ) > 0 , where
B 2 = μ [ ( 1 2 x 2 * δ 2 ) + ( 1 2 x 1 * δ 1 ρ y ) ] B 1 = η β ρ x 1 * μ [ ( 1 2 x 2 * δ 2 ) + ( 1 2 x 1 * δ 1 ρ y ) ] + [ ( 1 2 x 2 * δ 2 ) ( 1 2 x 1 * δ 1 ρ y ) δ 1 δ 2 δ 1 k ρ y ] B 0 = μ [ ( 1 2 x 2 * δ 2 ) ( 1 2 x 1 * δ 1 ρ y ) δ 1 δ 2 δ 1 k ρ y ] η β ρ x 1 * [ δ 1 k 2 x 2 * δ 2 1 ]
Proof. 
The Jacobian matrix of the model ( M ) at point E 1 is calculated and is obtained:
J ( E 1 ) = 1 2 x 1 * δ 1 ρ y δ 1 ρ x 1 * δ 2 + k ρ y 1 2 x 2 * δ 2 k ρ x 1 * η β 0 0 μ
and the characteristic polynomial is given by
p ( ξ ) = ξ 3 + B 2 ξ 2 + B 1 ξ + B 0 = 0 ,
Using the Routh–Hurwitz criterion, the result is obtained. □
The previous result indicates that a necessary condition for the populations in both patches to stabilize is that B 2 > 0 . That is, the noise attenuation rate must be high.

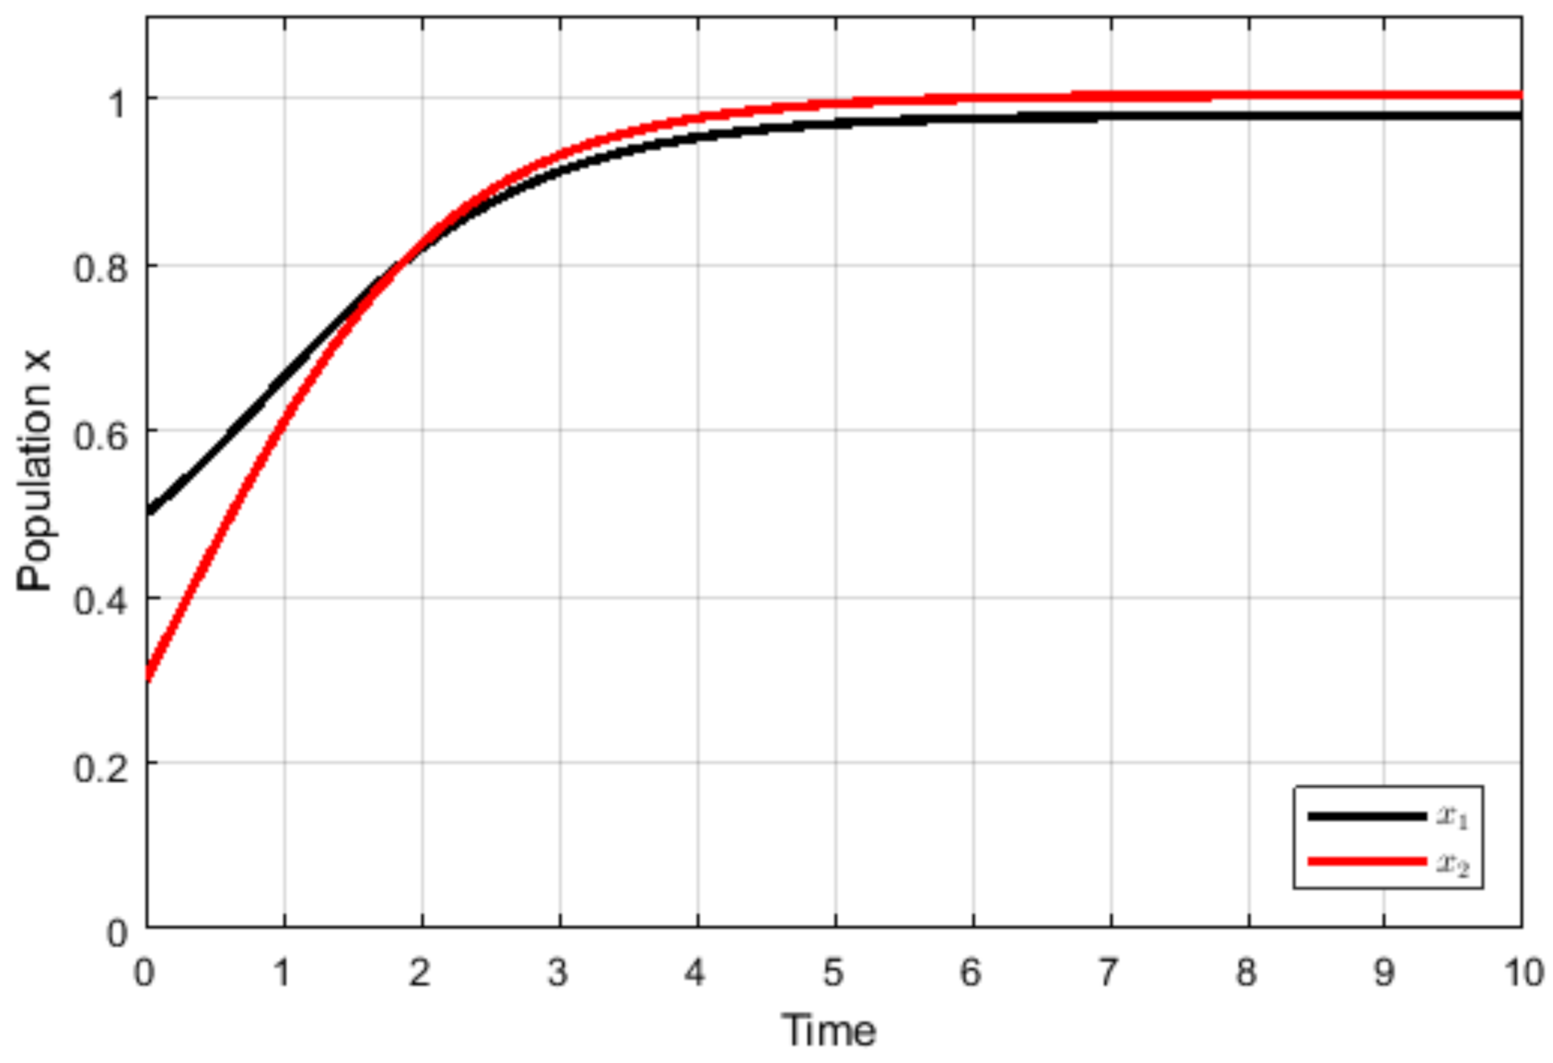
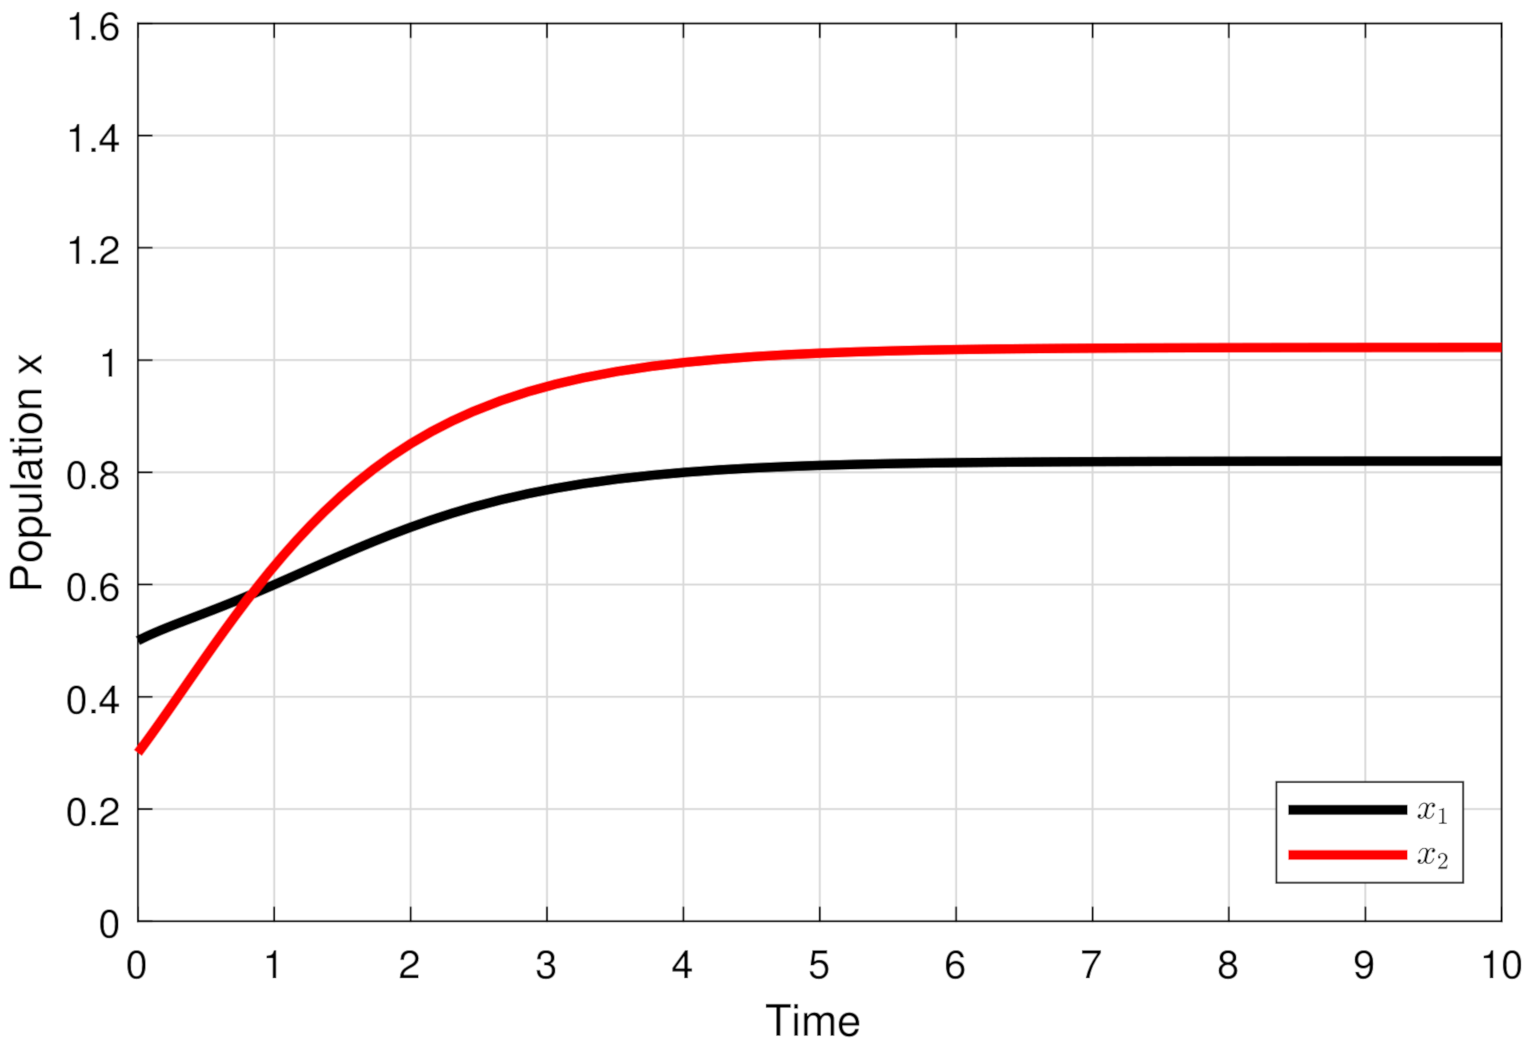
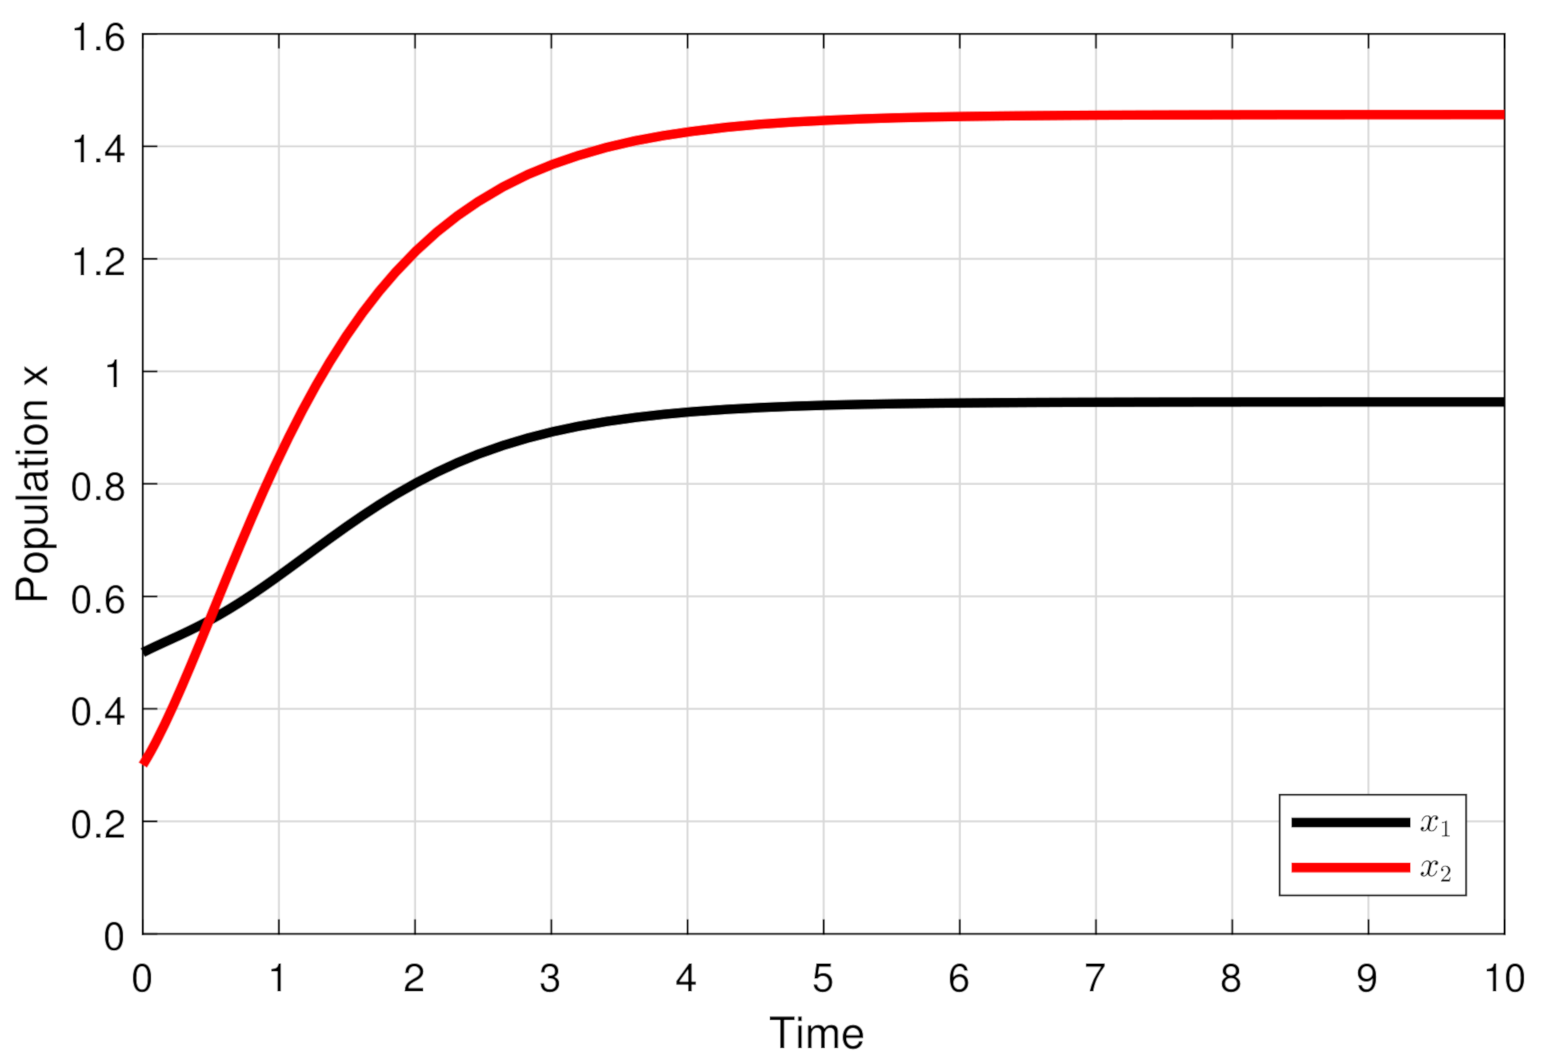
4. Numerical Simulations

In this section, MATLAB software is used to numerically explore the dynamic behavior of the system ( M ) . To obtain the real values of the intrinsic growth rate ( r 0 ), the intraspecific competition coefficient ( λ ), and the attenuation rates ( α , γ ), an empirical study is needed, with a concrete species and a controlled noisy environment. For the purposes of our research, we illustrate the results of our theoretical model using arbitrary selected values.
Let the values of the following parameters be δ 1 = 0.5 , δ 2 = 0.5 , ρ = 0.5 , λ = 1 , η = 1 , μ = 2 and the initial conditions x 1 ( 0 ) = 0.5 , x 2 ( 0 ) = 0.3 , y ( 0 ) = 0.1 , F 0 = β 0 = 0.1 .
Note that Figure 2 and Figure 3 show that as long as the noise is of low intensity, the differences in the carrying capacity of each patch do not produce substantial, long-term differences in the sizes of the subpopulations F 0 = β 0 = 1 .
Note that Figure 4 and Figure 5 show that when noise intensity is high, the loading capacities of each patch are relevant produce more marked difference in the subpopulations. When K 1 < K 2 (Figure 4), there is a relatively moderate difference in favor of the subpopulation in the second patch. When K 1 > K 2 (Figure 5), the difference between the two subpopulations is more marked.

5. Discussion and Conclusions

There are stochastic [65,66,67,68] and deterministic [56] mathematical models that study noise as an important factor in the persistence of populations. However, to our knowledge there are no deterministic models that study noise as a cause of population migration. This research responds to this need in the literature and analyzes a metapopulation model using a system of equations that describes two migration processes between two patches. The first is a unidirectional migration of the population from the noisy patch to the less noisy patch. The noise is considered constant, chronic, and critical and originates from two sources, one anthropogenic and one biological (self-generated as a consequence of the Lombard effect). The second is a random migration in search of the patch with the lowest occupancy level.
The results are consistent with many empirical studies showing that in many terrestrial and aquatic animals, both anthropogenic noise and the occupancy level cause migration due to their potential detrimental effect on population survival [17,27,28,29,30,31,32,33,34,57,58,59,60,61,62]. These results indicate that, despite the noise, subpopulations in each patch never go extinct. This may be because the process of random migration in search of the patch with the lowest occupancy level constantly moves individuals towards the noisy patch (Theorem 1)). Furthermore, a sufficient condition for the long-term stabilization of the subpopulation sizes of both patches is that the noise attenuation rate is high (Theorem 2). When the noise intensity is low (Figure 2 and Figure 3), the differences in the carrying capacity of each patch do not produce substantial long-term differences in the size of the subpopulations. However, when the noise is high (Figure 4 and Figure 5), the effects of difference in the loading capacities of each patch are relevant, thus producing a marked difference in subpopulation sizes. In both cases, the entire population increases until the asymptote, but the difference in size between the subpopulations in favor of the second population is more marked when K 1 > K 2 .
In conclusion, the results of this research suggest that to conserve a high abundance of a species in noisy environments, proper management in reducing the level of anthropogenic noise intensity or otherwise increasing the rate of noise attenuation is necessary. For terrestrial species, such as birds, it may be useful to extend the surface of green spaces, which can be considered as vegetative noise screens [69,70,71], while for marine species avoiding or taxing high noise levels in naval sonars may be recommended [72,73].
Finally, it is noted that the literature with deterministic mathematical models describing this phenomenon is almost nonexistent. Therefore, this research opens a new line of study and confirms many empirical results on the detrimental potential of noise on species abundance.

Author Contributions

Conceptualization, N.V.; methodology, C.R.-C. and F.C.-L.; Software, C.R.-C.; validation, C.R.-C. and F.C.-L.; formal analysis, C.R.-C.; Investigation, C.R.-C.; writing—original draft preparation, C.R.-C.; writing—review and editing, C.R.-C.; and supervision, F.C.-L. and N.V. All authors have read and agreed to the published version of the manuscript.

Funding

This research received no external funding.

Institutional Review Board Statement

Not applicable.

Informed Consent Statement

Not applicable.

Data Availability Statement

Not applicable.

Acknowledgments

C. Ramirez-Carrasco would like to thank the Vicerrectoría de Investigación y Postgrado de la Universidad Católica del Maule, Chile. This research is part of C. Ramirez-Carrasco’s Ph.D. thesis in the Program Doctorado en Modelamiento Matemático Aplicado.

Conflicts of Interest

The authors declare no conflict of interest.

References

  1. Levins, R. Some demographic and genetic consequences of environmental heterogeneity for biological control. Am. Entomol. 1969, 15, 237–240. [Google Scholar] [CrossRef]
  2. Skellam, J.G. Random dispersal in theoretical populations. Biometrika 1951, 38, 196–218. [Google Scholar] [CrossRef] [PubMed]
  3. McCullough, D.R. Metapopulations and Wildlife Conservation; Island Press: Washington, DC, USA, 1996. [Google Scholar]
  4. Dalpasso, A.; Ficetola, G.F.; Giachello, S.; Lo Parrino, E.; Manenti, R.; Muraro, M.; Falaschi, M. Similar species, different fates: Abundance dynamics in spatially structured populations of common and threatened frogs. Divers. Distrib. 2022, 28, 770–781. [Google Scholar] [CrossRef]
  5. Hanski, I.A.; Gaggiotti, O.E. (Eds.) Ecology, Genetics and Evolution of Metapopulations; Academic Press: Cambridge, MA, USA, 2004. [Google Scholar]
  6. Keymer, J.E.; Marquet, P.A.; Velasco-Hernández, J.X.; Levin, S.A. Extinction thresholds and metapopulation persistence in dynamic landscapes. Am. Nat. 2000, 156, 478–494. [Google Scholar] [CrossRef]
  7. Bertassello, L.E.; Jawitz, J.W.; Bertuzzo, E.; Botter, G.; Rinaldo, A.; Aubeneau, A.F.; Rao, P.S.C. Persistence of amphibian metapopulation occupancy in dynamic wetlandscapes. Landsc. Ecol. 2022, 37, 695–711. [Google Scholar] [CrossRef]
  8. Holstein, D.M.; Smith, T.B.; van Hooidonk, R.; Paris, C.B. Predicting coral metapopulation decline in a changing thermal environment. Coral Reefs 2022, 41, 1–12. [Google Scholar] [CrossRef]
  9. Dingle, H.; Drake, V.A. What is migration? Bioscience 2007, 57, 113–121. [Google Scholar] [CrossRef]
  10. Al-Darabsah, I.; Tang, X.; Yuan, Y. A prey-predator model with migrations and delays. Discrete Contin. Dyn. Syst.-B 2016, 21, 737–761. [Google Scholar] [CrossRef]
  11. Olli, K. Diel vertical migration of phytoplankton and heterotrophic flagellates in the Gulf of Riga. J. Mar. Syst. 1999, 23, 145–163. [Google Scholar] [CrossRef]
  12. Andersen, V.; Gubanova, A.; Nival, P.; Ruellet, T. Zooplankton community during the transition from spring bloom to oligotrophy in the open NW Mediterranean and effects of wind events. 2. Vertical distributions and migrations. J. Plankton Res. 2001, 23, 243–261. [Google Scholar] [CrossRef] [Green Version]
  13. El Abdllaoui, A.; Auger, P.; Kooi, B.W.; De la Parra, R.B.; Mchich, R. Effects of density-dependent migrations on stability of a two-patch predator–prey model. Math. Biosci. 2007, 210, 335–354. [Google Scholar] [CrossRef] [PubMed]
  14. Rice, A.N.; Tielens, J.T.; Estabrook, B.J.; Muirhead, C.A.; Rahaman, A.; Guerra, M.; Clark, C.W. Variation of ocean acoustic environmentsalong the western north Atlantic coast: A case study in context of the rightwhale migration route. Ecol. Inf. 2014, 21, 89–99. [Google Scholar] [CrossRef]
  15. Hildebrand, J.A. Anthropogenic and natural sources of ambient noisein the ocean. Mar. Ecol. Prog. Ser. 2009, 395, 5–20. [Google Scholar] [CrossRef]
  16. Pijanowski, B.C.; Villanueva-Rivera, L.J.; Dumyahn, S.L.; Farina, A.; Krause, B.L.; Napoletano, B.M.; Gage, S.H.; Pieretti, N. Soundscape ecology: The science of sound in the landscape. BioScience 2011, 61, 203–216. [Google Scholar] [CrossRef]
  17. Ware, H.E.; McClure, C.J.; Carlisle, J.D.; Barber, J.R. A phantom road experiment reveals traffic noise is an invisible source of habitat degradation. Proc. Natl. Acad. Sci. USA 2015, 112, 12105–12109. [Google Scholar] [CrossRef]
  18. Slabbekoorn, H.; Dooling, R.J.; Popper, A.N.; Fay, R.R. Effects of Anthropogenic Noise on Animals; Springer: New York, NY, USA, 2018. [Google Scholar]
  19. Dooling, R.J.; Leek, M.; West, E. Predicting the effects of masking noise on communication distance in birds. J. Acoust. Soc. Am. 2009, 125, 2517. [Google Scholar] [CrossRef]
  20. Erbe, C.; Reichmuth, C.; Cunningham, K.; Lucke, K.; Dooling, R. Communication masking in marine mammals: A review and research strategy. Mar. Pollut. Bull. 2016, 103, 15–38. [Google Scholar] [CrossRef]
  21. Römer, H. Masking by noise in acoustic insects: Problems and solutions. In Animal Communication and Noise; Springer: Berlin/Heidelberg, Germany, 2013; pp. 33–63. [Google Scholar]
  22. Sueur, J.; Farina, A. Ecoacoustics: The ecological investigation and interpretation of environmental sound. Biosemiotics 2015, 8, 493–502. [Google Scholar] [CrossRef]
  23. De Vincenzi, G.; Micarelli, P.; Viola, S.; Buffa, G.; Sciacca, V.; Maccarrone, V.; Corrias, V.; Reinero, F.R.; Giacoma, C.; Filiciotto, F. Biological Sound vs. Anthropogenic Noise: Assessment of Behavioural Changes in Scyliorhinus canicular Exposed to Boats Noise. Animals 2021, 11, 174. [Google Scholar] [CrossRef]
  24. Goldbogen, J.A.; Southall, B.L.; DeRuiter, S.L.; Calambokidis, J.; Friedlaender, A.S.; Hazen, E.L.; Tyack, P.L. Blue whales respond to simulated mid-frequency military sonar. Proc. R. Soc. B Biol. Sci. 2013, 280, 20130657. [Google Scholar] [CrossRef] [Green Version]
  25. Goodwin, S.E.; Shriver, W.G. Effects of traffic noise on occupancy patterns of forest birds. Conserv. Biol. 2011, 25, 406–411. [Google Scholar] [CrossRef] [PubMed]
  26. Popper, A.N.; Hawkins, A. (Eds.) The Effects of Noise on Aquatic Life II; Springer: New York, NY, USA, 2016; p. 1292. [Google Scholar]
  27. McClure, C.J.; Ware, H.E.; Carlisle, J.; Kaltenecker, G.; Barber, J.R. An experimental investigation into the effects of traffic noise on distributions of birds: Avoiding the phantom road. Proc. R. Soc. B Biol. Sci. 2013, 280, 20132290. [Google Scholar] [CrossRef] [PubMed]
  28. McClure, C.J.W.; Ware, H.E.; Carlisle, J.D.; Barber, J.R. Noise from a phantom road experiment alters the age structure of a community of migrating birds. Anim. Conserv. 2017, 20, 164–172. [Google Scholar] [CrossRef]
  29. Potvin, D.A.; MacDougall-Shackleton, S.A. Traffic noise affects embryo mortality and nestling growth rates in captive zebra finches. J. Exp. Zool. Part A Ecol. Genet. Physiol. 2015, 323, 722–730. [Google Scholar] [CrossRef]
  30. Malme, C.I.; Miles, P.R.; Clark, C.W.; Tyack, P.; Bird, J.E. Investigations of the Potential Effects of Underwater Noise from Petroleum-Industry Activities on Migrating Gray-Whale Behavior. Phase 2: January 1984 Migration (No. PB-86-218377/XAB; BBN-5586); Bolt, Beranek and Newman, Inc.: Cambridge, MA, USA, 1984. [Google Scholar]
  31. Filadelfo, R.; Mintz, J.; Michlovich, E.; D’Amico, A.; Tyack, P.L.; Ketten, D.R. Correlating military sonar use with beaked whale mass strandings: What do the historical data show? Aquat. Mamm. 2009, 35, 435–444. [Google Scholar] [CrossRef]
  32. Simpson, S.D.; Radford, A.N.; Nedelec, S.L.; Ferrari, M.C.; Chivers, D.P.; McCormick, M.I.; Meekan, M.G. Anthropogenic noise increases fish mortality by predation. Nat. Commun. 2016, 7, 10544. [Google Scholar] [CrossRef]
  33. Nedelec, S.L.; Radford, A.N.; Simpson, S.D.; Nedelec, B.; Lecchini, D.; Mills, S.C. Anthropogenic noise playback impairs embryonic development and increases mortality in a marine invertebrate. Sci. Rep. 2014, 4, 5891. [Google Scholar] [CrossRef]
  34. Tennessen, J.B.; Parks, S.E.; Langkilde, T. Traffic noise causes physiological stress and impairs breeding migration behaviour in frogs. Conserv. Physiol. 2014, 2, cou032. [Google Scholar] [CrossRef]
  35. Lombard, E. The signs of increasing the voice. Ann. Malad. l’Oreille Larynx, 37, 101-119. Biosemiotics 1911, 8, 493–502. [Google Scholar]
  36. Sinnott, J.M.; Stebbins, W.C.; Moody, D.B. Regulation of voice amplitude by the monkey. J. Acoust. Soc. Am. 1975, 58, 412–414. [Google Scholar] [CrossRef]
  37. Katti, M.; Warren, P.S. Tits, noise and urban bioacoustics. Trends Ecol. Evol. 2004, 19, 109–110. [Google Scholar] [CrossRef] [PubMed]
  38. Luo, J.; Hage, S.R.; Moss, C.F. The Lombard effect: From acoustics to neural mechanisms. Trends Neurosci. 2018, 41, 938–949. [Google Scholar] [CrossRef] [PubMed]
  39. Holt, D.E.; Johnston, C.E. Evidence of the Lombard effect in fishes. Behav. Ecol. 2014, 25, 819–826. [Google Scholar] [CrossRef]
  40. Holt, M.M.; Noren, D.P.; Veirs, V.; Emmons, C.K.; Veirs, S. Speaking up: Killer whales (Orcinus orca) increase their call amplitude in response to vessel noise. J. Acoust. Soc. Am. 2009, 125, EL27–EL32. [Google Scholar] [CrossRef] [PubMed]
  41. Helble, T.A.; Guazzo, R.A.; Martin, C.R.; Durbach, I.N.; Alongi, G.C.; Martin, S.W.; Henderson, E.E. Lombard effect: Minke whale boing call source levels vary with natural variations in ocean noise. J. Acoust. Soc. Am. 2020, 147, 698–712. [Google Scholar] [CrossRef]
  42. Brackenbury, J.H. Power capabilities of the avian sound-producing system. J. Exp. Biol. 1979, 78, 163–166. [Google Scholar] [CrossRef]
  43. Calder, W.A., III. The scaling of sound output and territory size: Are they matched? Ecology 1990, 71, 1810–1816. [Google Scholar] [CrossRef]
  44. Oberweger, K.; Goller, F. The metabolic cost of birdsong production. J. Exp. Biol. 2001, 204, 3379–3388. [Google Scholar] [CrossRef]
  45. Warren, P.S.; Katti, M.; Ermann, M.; Brazel, A. Urban bioacoustics: It’s not just noise. Anim. Behav. 2006, 71, 491–502. [Google Scholar] [CrossRef]
  46. Barber, J.R.; Crooks, K.R.; Fristrup, K.M. The costs of chronic noise exposure for terrestrial organisms. Trends Ecol. Evol. 2010, 25, 180–189. [Google Scholar] [CrossRef]
  47. Read, J.; Jones, G.; Radford, A.N. Fitness costs as well as benefits are important when considering responses to anthropogenic noise. Behav. Ecol. 2014, 25, 4–7. [Google Scholar] [CrossRef] [Green Version]
  48. Brown, N.A.; Halliday, W.D.; Balshine, S.; Juanes, F. Low-amplitude noise elicits the Lombard effect in plainfin midshipman mating vocalizations in the wild. Anim. Behav. 2021, 181, 29–39. [Google Scholar] [CrossRef]
  49. Swaddle, J.P.; Francis, C.D.; Barber, J.R.; Cooper, C.B.; Kyba, C.C.; Dominoni, D.M.; Shannon, G.; Aschehoug, E.; Goodwin, S.E.; Kawahara, A.Y.; et al. A framework to assess evolutionary responses to anthropogenic light and sound. Trends Ecol. Evol. 2015, 30, 550–560. [Google Scholar] [CrossRef]
  50. Farina, A.; Gage, S.H. The ecological effects of noise on species and communities. Eco acoustics. In The Ecological Role of Sounds; Wiley: Oxford, UK, 2017; pp. 95–108. [Google Scholar]
  51. Zollinger, S.A.; Brumm, H. Why birds sing loud songs and why they sometimes don’t. Anim. Behav. 2015, 105, 289–295. [Google Scholar] [CrossRef]
  52. Brumm, H.; Todt, D. Noise-dependent song amplitude regulation in a territorial songbird. Anim. Behav. 2002, 63, 891–897. [Google Scholar] [CrossRef]
  53. Brumm, H. The impact of environmental noise on song amplitude in a territorial bird. J. Anim. Ecol. 2004, 73, 434–440. [Google Scholar] [CrossRef]
  54. Luczkovich, J.J.; Krahforst, C.S.; Kelly, K.E.; Sprague, M.W. The Lombard effect in fishes: How boat noise impacts oyster toadfish vocalization amplitudes in natural experiments. Proc. Mtgs. Acoust. 2016, 27, 010035. [Google Scholar]
  55. Sementili-Cardoso, G.; Donatelli, R.J. Anthropogenic noise and atmospheric absorption of sound induce amplitude shifts in the songs of Southern House Wren (Troglodytes aedon musculus). Urban Ecosyst. 2021, 24, 1001–1009. [Google Scholar] [CrossRef]
  56. Ramirez-Carrasco, C.; Córdova-Lepe, F.; Moreno-Gómez, F.N.; Velásquez, N.A. A mathematical model for the impact of noise on population dynamics of a single species experiencing Lombard effect. Ecol. Model. 2022, 470, 110022. [Google Scholar] [CrossRef]
  57. Sanchirico, J.N.; Wilen, J.E. A bioeconomic model of marine reserve creation. J. Environ. Econ. Manag. 2001, 42, 257–276. [Google Scholar] [CrossRef]
  58. Howe, R.W.; Davis, G.J.; Mosca, V. The demographic significance of ‘sink’ populations. Biol. Conserv. 1991, 57, 239–255. [Google Scholar] [CrossRef]
  59. Saether, B.E.; Engen, S.; Lande, R. Finite metapopulation models with density–dependent migration and stochastic local dynamics. Proc. R. Soc. Lond. Ser. B Biol. Sci. 1999, 266, 113–118. [Google Scholar] [CrossRef] [Green Version]
  60. Fonseca, D.M.; Hart, D.D. Density-dependent dispersal of black fly neonates is mediated by flow. Oikos 1996, 75, 49–58. [Google Scholar] [CrossRef]
  61. Veit, R.R.; Lewis, M.A. Dispersal, population growth, and the Allee effect: Dynamics of the house finch invasion of eastern North America. Am. Nat. 1996, 148, 255–274. [Google Scholar] [CrossRef]
  62. Aars, J.; Ims, R.A. Population dynamic and genetic consequences of spatial density-dependent dispersal in patchy populations. Am. Nat. 2000, 155, 252–265. [Google Scholar] [CrossRef] [PubMed]
  63. Bass, H.E.; Sutherland, L.C.; Zuckerwar, A.J.; Blackstock, D.T.; Hester, D.M. Atmospheric absorption of sound: Further developments. J. Acoust. Soc. Am. 1995, 97, 680–683. [Google Scholar] [CrossRef]
  64. Wiley, R.; Richards, D.G. Physical constraints on acoustic communication in the atmosphere: Implications for the evolution of animal vocalizations. Behav. Ecol. Sociobiol. 1978, 3, 69–94. [Google Scholar] [CrossRef]
  65. Vilar, J.M.; Solé, R.V. Effects of noise in symmetric two-species competition. Phys. Rev. Lett. 1998, 80, 4099. [Google Scholar] [CrossRef]
  66. Spagnolo, B.; Fiasconaro, A.; Valenti, D. Noise induced phenomena in LotkaVolterra systems. Fluct. Noise Lett. 2003, 3, L177–L185. [Google Scholar] [CrossRef]
  67. Upadhyay, R.K.; Mukhopadhyay, A.; Iyengar, S.R.K. Influence of environmental noise on the dynamics of a realistic ecological model. Fluct. Noise Lett. 2007, 7, L61–L77. [Google Scholar] [CrossRef]
  68. Das, A.; Samanta, G.P. Stochastic prey–predator model with additional food for predator. Phys. A Stat. Mech. Its Appl. 2018, 512, 121–141. [Google Scholar] [CrossRef]
  69. Watts, G.; Chinn, L.; Godfrey, N. The effects of vegetation on the perception of traffic noise. Appl. Acoust. 1999, 56, 39–56. [Google Scholar] [CrossRef]
  70. Ow, L.F.; Ghosh, S. Urban cities and road traffic noise: Reduction through vegetation. Appl. Acoust. 2017, 120, 15–20. [Google Scholar] [CrossRef]
  71. Klingberg, J.; Broberg, M.; Strandberg, B.; Thorsson, P.; Pleijel, H. Influence of urban vegetation on air pollution and noise exposure—A case study in Gothenburg, Sweden. Sci. Total Environ. 2017, 599, 1728–1739. [Google Scholar] [CrossRef] [PubMed]
  72. McCarthy, E. International Regulation of Underwater Sound: Establishing Rules and Standards to Address Ocean Noise Pollution; Springer Science & Business Media: Berlin, Germany, 2007. [Google Scholar]
  73. McCarthy, E.; Lichtman, F. The origin and evolution of ocean noise regulation under the US Marine Mammal Protection Act. Ocean Coast. LJ 2007, 13. Available online: https://digitalcommons.mainelaw.maine.edu/oclj/vol13/iss1/2 (accessed on 8 September 2022).
Figure 1. Diagram of two migration processes between patches. In order to avoid noise and occupied patches, individuals migrate by two processes: a uniderectional process where individuals migrate from patch 1 to patch 2 due to antropogenic noise with migration rate a 12 = a I 1 and a random process where individuals migrate between patches 1 and 2 in search of the patch with the lowest occupancy level with migration rates b 12 = b / K 1 and b 21 = b / K 2 .
Mathematics 10 03485 g001
Figure 2. Evolution over time of the occupancy levels of two patches with different noise levels (more noise: black line; less noise: red line), when noise intensity is low. In this simulation, K = 0.5 , i.e., the carrying capacity of the noisy patch ( K 1 ) is lower than that of the less noisy patch ( K 2 ).
Mathematics 10 03485 g002
Figure 3. Evolution over time of the occupancy levels of two patches with different noise levels (more noise: black line; less noise: red line), when noise intensity is low. In this simulation, k = 3 , i.e., the carrying capacity of the noisy patch ( K 1 ) is higher than that of the less noisy patch ( K 2 ).
Mathematics 10 03485 g003
Figure 4. Evolution over time of the occupancy levels of two patches with different noise levels (more noise: black line; less noise: red line), when noise intensity is high. In this simulation, k = 0.5 , i.e., the carrying capacity of the noisy patch ( K 1 ) is lower than that of the less noisy patch ( K 2 ).
Mathematics 10 03485 g004
Figure 5. Evolution over time of the occupancy levels of two patches with different noise levels (more noise: black line; less noise: red line), when noise intensity is high. In this simulation, k = 3 , i.e., the carrying capacity of the noisy patch ( K 1 ) is higher than that of the less noisy patch ( K 2 ).
Mathematics 10 03485 g005
Publisher’s Note: MDPI stays neutral with regard to jurisdictional claims in published maps and institutional affiliations.

