Article

Economic Activity Forecasting Based on the Sentiment Analysis of News

by
Mantas Lukauskas
1,*,
Vaida Pilinkienė
2,
Jurgita Bruneckienė
2,
Alina Stundžienė
2,
Andrius Grybauskas
2 and
Tomas Ruzgas
1
1
Department of Applied Mathematics, Faculty of Mathematics and Natural Sciences, Kaunas University of Technology, 44249 Kaunas, Lithuania
2
School of Economics and Business, Kaunas University of Technology, 44249 Kaunas, Lithuania
*
Author to whom correspondence should be addressed.
Mathematics 2022, 10(19), 3461; https://doi.org/10.3390/math10193461
Submission received: 31 August 2022 / Revised: 16 September 2022 / Accepted: 19 September 2022 / Published: 22 September 2022
(This article belongs to the Section Mathematics and Computer Science)

Abstract

:
The outbreak of war and the earlier and ongoing COVID-19 pandemic determined the need for real-time monitoring of economic activity. The economic activity of a country can be defined in different ways. Most often, the country’s economic activity is characterized by various indicators such as the gross domestic product, the level of employment or unemployment of the population, the price level in the country, inflation, and other frequently used economic indicators. The most popular were the gross domestic product (GDP) and industrial production. However, such traditional tools have started to decline in modern times (as the timely knowledge of information becomes a critical factor in decision making in a rapidly changing environment) as they are published with significant delays. This work aims to use the information in the Lithuanian mass media and machine learning methods to assess whether these data can be used to assess economic activity. The aim of using these data is to determine the correlation between the usual indicators of economic activity assessment and media sentiments and to forecast traditional indicators. When evaluating consumer confidence, it is observed that the forecasting of this economic activity indicator is better based on the general index of negative sentiment (comparisons with univariate time series). In this case, the average absolute percentage error is 1.3% lower. However, if all sentiments are included in the forecasting instead of the best one, the forecasting is worse and in this case the MAPE is 5.9% higher. It is noticeable that forecasting the monthly and annual inflation rate is thus best when the overall negative sentiment is used. The MAPE of the monthly inflation rate is as much as8.5% lower, while the MAPE of the annual inflation rate is 1.5% lower.

1. Introduction

Currently, artificial intelligence is subject to more and more different applications in practice. One of the areas of artificial intelligence that has seen significant improvement in recent years is natural language processing. Natural language processing is a discipline with characteristics of linguistics and computer science. This field applies various mathematical and computational methods to natural language processing. The application areas can be diverse and include text reading and voicing [1], automatic translation [2] (which everyone often uses), automatic text correction [3], information search [4], and many other areas. Natural language processing is widely used in the activities of companies, both for the previously mentioned tasks and for various others. One such task is sentiment analysis. Sentiment analysis uses mathematical methods and textual information to determine whether the presented text is positive or negative [5,6]. Furthermore, the text can be analyzed in another way: deciding whether the text is positive or negative and deciding the mood of the text itself. This application of natural language processing allows one to automate various processes and increase the speed of data analysis. Even with enormous amounts of data, it is possible to determine whether the analyzed texts are positive or negative. This application can not only be used in the activities of companies, and specifically user feedback on companies, but also to evaluate economic processes. Currently, to link information in the press with economic, political, and other phenomena, indices are usually used and calculated based on the number of certain words in the text [7,8]. The authors calculated words such as economy, uncertainty, industry, politics, regulation, deficit, etc. Repetition in the texts is made up of an index based on them [9,10]. A compilation of the index allows the researcher to link the obtained index with other indicators to assess the relationship of certain events, such as wars, representing the crisis with the index. Newer research shows that the relevance of this topic is indeed great, and the authors’ attention is currently explicitly directed to the application of machine learning in sentiment analysis. One such study is Shapiro et al. (2022), which applied both word-based computing and machine learning techniques [11]. It is also important to mention that many studies rely on more straightforward methods, such as bag-of-words (BoW) and global vectors for word representation (GloVE). However, it is also noticeable that more and more diverse machine learning methods are being used, providing faster and often better results [12,13]. Moreover, a smaller dataset is often used due to possible computational problems or limited data availability. It is also noticeable that news sentiment analysis is often associated with stock markets, as they are susceptible to various events and people’s moods [12,14]. However, this use is not limited to predicting these indicators and can be applied to predicting various other indicators. This article aims to use natural language-processing technologies to analyze the news portal’s news and determine whether the news sentiment index influences different indicators of economic activity. The article hypothesizes that the index of negative Lithuanian news is inversely related to indicators of economic activity. For example, as the negative Lithuanian news index increases, the unemployment rate increases and GDP decreases. This hypothesis is based on the fact that possible negative consequences for the economy are discussed before specific economic processes occur, so the use of natural language processing for this purpose can help predict economic indicators faster and even more accurately. This research paper may contribute to the development of natural language, and by establishing that news sentiment analysis can be used to predict economic activity, it may help to establish further economic guidance.
This article is organized as follows. Section 2 introduces the concept of economic activity, methods of economic activity assessment, and indicators used. The third chapter of this article introduces natural language processing methods and models used in natural language sentiment analysis. The fourth chapter of this article discusses the data, methods, and metrics used in the research. The fifth chapter discusses the results obtained during the research and compares different methods of sentiment analysis and forecasting indicators based on the sentiment index. Finally, the conclusions and future work are discussed in the sixth chapter.

2. Economic Activity

The outbreak of war and the earlier and ongoing COVID-19 pandemic determined the need for real-time monitoring of economic activity. The economic activity of a country can be defined in different ways. Most often, the country’s economic activity is characterized by various indicators such as the gross domestic product, the level of employment or unemployment of the population, the price level in the country, inflation, and other frequently used economic indicators. The most natural way was to use the gross domestic product (GDP) and industrial production. However, such traditional tools have started to decline in modern times (when the timely knowledge of information becomes a critical factor in decision making in a rapidly changing environment) as they are published with significant delays. The most common indicators of economic activity cover the economy according to different dimensions: private household consumption, production activity, labour market, domestic and international trade, prices, environment (conventional pollution), transport, and logistics. States and investors seek to assess economic activity as soon as possible to make timely decisions. Data delay challenges are particularly painful during periods of various shocks (pandemic, war) when countries’ governments have to make urgent decisions. Economic shocks significantly distort macroeconomic forecasts due to the lag effect of traditional macroeconomic indicators and their nature [15,16].
When assessing the country’s economic activity, it is usually associated with the gross domestic product or changes in industrial production, which allow one to assess the actions taking place in the country’s industry/production [17,18,19]. However, as mentioned earlier, various sudden economic changes, such as war or pandemics, suggest that the usual indicators for monitoring economic activity are no longer sufficient. For this reason, the number of monitored indicators is expanded, and the frequency of their monitoring is increased to assess the situation in time [20,21,22]. Examples of such new data can be Google’s mobile movement data, satellite data, and other data related to people’s mobility during the pandemic [20,23]. These data were previously used very rarely, but now the conditions are set for broader use of such data. It is also worth noting that, for example, Google data can often be used in real time. In recent years, real-time/high-frequency data have received substantial attention. Although most methods are still based on historical data, which are characterized by a relatively significant lag (often a lag of one month), such a delay is significant for the accuracy of forecasts and the real assessment of the situation. This problem has been studied by several researchers [24,25], who unanimously agree that the lack of data is the main problem when making timely decisions.
New economic modelling capabilities are being sought to help address this issue. For this reason, machine learning methods and their use are essential in economic modelling. Applying artificial intelligence methods (to analyse and interpret data, as well as provide more accurate forecasts) [26] and processing large amounts of data (Big Data) are both essential. Compared to previously used methods, machine learning methods can help to assess the situation better, as they often perform better than traditional methods. Some authors integrate machine learning techniques in their work in order to process large amounts of data, including various alternative indicators that have not been evaluated before [27,28,29,30]. The possibilities of processing large amounts of data make it possible to use data such as:
  • social media information (search keywords, comments);
  • business company data (prices of real estate and goods on online portals, the volume of transactions);
  • mobility data (fixed and mobile sensor data, satellite images, pollution data);
  • Energy consumption data;
  • Financial market data, credit card transactions;
Forecasting becomes much simpler and can be carried out with extremely low latency with such data. It is all the more important to mention that the amount of data generated is increasing yearly. The high frequency of data generation makes it possible to have high-frequency data; if data were only previously available once a year, it is now possible to have weekly, daily, or even hourly data [31,32,33]. Some authors use a combination of traditional and non-traditional indicators to obtain the best result [34,35], combining high-frequency indicators with conventional and low-frequency macroeconomic variables. More and more researchers are using these indicators, indicating that these new indicators will become more and more important for economic monitoring in the future [26].
For this reason, as mentioned earlier, the aim of this work is to use the information in the Lithuanian mass media and machine learning methods to assess whether these data can be used for assessing economic activity. Furthermore, the aim of using these data is to determine the correlation between the usual indicators of economic activity assessment and media sentiments and to forecast traditional indicators. Despite the growing number of scientific articles [30,34,36], confirming the contribution of high-frequency information means providing an accurate forecast of economic indicators. Research [37] is still refuting or requires further attention. However, various results and active discussions among scientists only confirm the relevance and novelty of the problem.

3. Natural Language and Transformers

Natural language processing is the computer analysis and processing of natural language (which can be both written and audio information) using various mathematical methods for linguistic application. Natural language processing can be used for a variety of tasks. Natural language processing was introduced in the mid-20th century, but only rule-based systems could be developed at that time. Later, neural networks, or rather recurrent neural networks (RNNs), were introduced. These neural networks made it possible to perform various tasks in which static values, and the dynamics of these values, are essential. Due to the shortcoming of these methods, which is related to their memory, another model of neural networks developed from them: the long–short-term memory neural network. After such great discoveries and their application in natural language processing, it seemed that the best result was achieved, but in 2017, a new structure of transformers was created [38]. Moreover, most natural language processing tasks are currently being solved using these structure models. Transformers can be said to have fundamentally changed the direction of natural language processing and allowed the development of many different applications. The basic structure of transformer models is presented in the figure below (see Figure 1).
It can be said that the central element in the architecture of transformers is multi-head attention, which is calculated using the following formulas [38]:
M u l t i H e a d Q ,   K ,   V = C o n c a t h e a d 1 , , h e a d h W 0
h e a d i = A t t e n t i o n ( Q W i Q ,   K W i K , V W i V )
A t t e n t i o n Q ,   K ,   V = s o f t m a x Q K T d k V
where Q is the query, K is the keys, and V is the values. Concat refers to the concatenation of layers and variable h describes the number of heads. W i 0 R d m o d e l x d m o d e l is a matrix of weights of the i-th head and dmodel is the size of the input embeddings and d k = d m o d e l / h .
Attention (·) is called scaled dot–product attention because their weight values are based on key and dot–product queries. The difference between multi-head attention and masked multi-head attention is that the former allows the model to see the future context. At the same time, the latter does not, so they are used in the encoder and decoder structures. The feed-forward component transforms the output from the last transformer decoder block into a probability distribution using FC layers with a softmax activation function. A position encoding is added to each input insertion to include the order of the input sequence. Currently, there are many models based on the structure of transformers, and most of the ones used in practice by various language researchers are based on the structure of transformers. Around four years ago, OpenAI released its first generative pre-training transformer (GPT) model. This model was already a huge revolution in natural language processing, but two years later, OpenAI released a second version of the model which was even more powerful. The GPT-2 1.5 billion parameter model was trained with web texts [39]. The second version of the model was even ten times larger than the previously released version, so even better results characterized it. The latest GPT model is currently in its third version [40]. This model is trained with as many as 175 billion parameters. However, GPT models are only one of the structure models of transformers, one of the widely used models in BERT. Bidirectional encoder representations from transformers (BERTs) can be described as a pre-training technique based on work on contextual representations [41,42]. BERT models have many different model variants developed over the years. One of the more minor mods created for simple tasks is DistilBERT [43]. The main difference between this model and the usual BERT models is the distillation in the model, which reduces the model’s volume in an extreme way, while even maintaining about 97 percent of the model’s accuracy. There are also many other technical improvements to BERT models such as ALBERT [44], BART [45], DocBERT [46], or Facebook’s RoBERTa [47]. Information on these models, as well as many other models, is provided in the Methods and Materials section. XLNet builds on the BERT and GPT models and aims to address their shortcomings. XLNet’s core architecture is based on the Transformer-XL model [48]. However, the problem with these models is that they predict tokens in a random order rather than a sequential order [49].
Natural language processing is increasingly applied in different scientific and practical fields, as it can be applied to solve various problems. These natural language processing tasks can be information extraction from unstructured data [50], automated text generation [51,52], text translation into other languages [53], and also (for the main purpose of this research) sentiment or feeling analysis using text [54,55,56,57,58]. Different architectures of transformers are also used in this study, which are presented in the Materials and Methods section below.

4. Materials and Methods

This section describes how the data used in the study were obtained, how these data were processed, and the main characteristics of the data. The following subsections of this chapter describe the main methods used to perform different research tasks (natural language processing sentiment analysis, clustering, and prediction) and evaluation metrics for different research tasks (clustering and prediction). The general scheme of the study is presented in the figure below (see Figure 2); this scheme provides a general outline of the study, the individual elements of which are discussed in the subsections below.

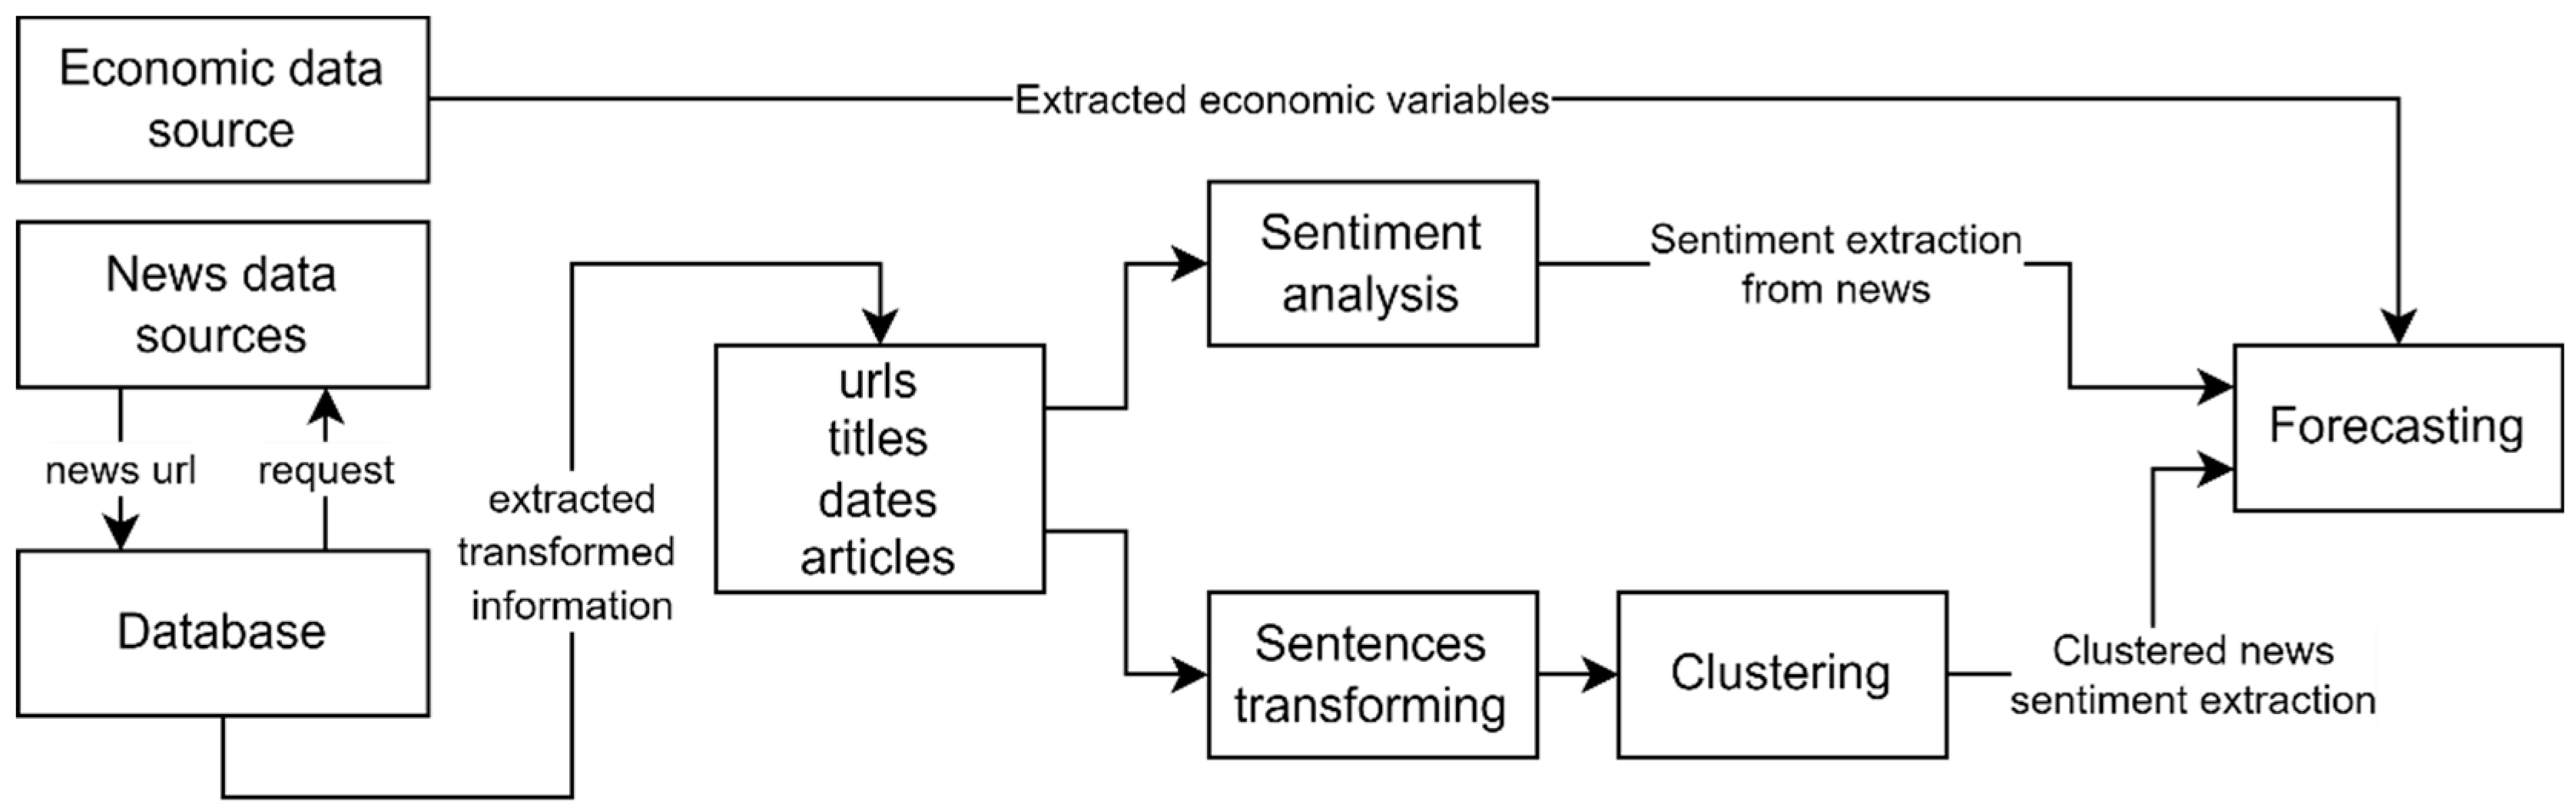
4.1. Data Gathering, Processing, and Analysis

In the course of this study, articles on news portals were collected. Python packages Playwright, Selenium, and BeautifulSoup were used to collect this information during the research. The structure of the articles is presented in the figure below (see Figure 3). When collecting all the information from the articles, each part of the article was used as a separate piece of information. In addition, the publication time of the article (date variable), article category (categorical variable), article title, main article information (lead), and article text were collected as textual variables. All this information was collected using separate computer systems and stored in the PostgreSQL database to collect it faster.
The dataset used in the study was collected from the two largest news portals in Lithuania; the studied period was January 2000–July 2022. The total number of news articles used in the study was 2,570,815 (1,552,947 articles from the first source and 1,017,868 from the second source). In the graph below (see Figure 4), it can be seen that the amount of information on news portals increased every year. A reasonably significant increase in the news was observed in the post-crisis period, and a significant jump could also be seen after the start of the COVID-19 pandemic and the war in Ukraine.
Economic activity data (dependent variables) were obtained using the database of the Lithuanian Statistics Department. These indicators of economic activity were selected based on the literature analysis presented above, during which it was determined which underground indicators were used by authors describing the economic activity. Additionally, when choosing the indicators, it was necessary to consider that in most cases, only annual data were provided. A significant amount of information was lost when examining annual data, with the expectation to find more frequent data. Therefore, only data with a monthly frequency were selected. This makes it possible to have a fairly large time series to forecast these indicators.

4.2. NLP Models Used in the Research

In this study, textual data were analysed; therefore, the previously discussed transformers were used to analyse these data. Transformers provided better results compared to conventional methods used before their appearance. There are quite a few sentiment analysis models, but it is worth noting that there are almost no such models in the Lithuanian language; therefore, for this reason, the articles in Lithuanian had to be translated first. Some random translations were checked, and the quality of these translations was evaluated. It is noticeable that Lithuanian–English translations were performed with high quality. These translations were performed using the Python package deep-translator. This package includes different tools, including the Google translator and the DeepL translator. Google Translate was used in this study to evaluate the translation quality.
Next, another text analysis task was performed. These tasks were performed using HuggingFace models. In the first case, the text was transformed into points in space, as this was necessary for text clustering using the sentence transformer model all-MiniLM-L6-v2 (All-MiniLM-L6-v2 model link: https://huggingface.co/sentence-transformers/all-MiniLM-L6-v2 (accessed on 20 August 2022)). It is a model of sentence transformers and maps sentences and paragraphs into a 384-dimensional dense vector space and can be used for tasks such as clustering or semantic search.
When evaluating the sentiments of different textual data, the dataset with which the used models were trained can be of considerable importance. For this reason, it was decided that a combination of different models would be used during the sentiment analysis, as opposed to one specific model. This study used 4 different pre-trained models for text sentiment detection: DistilBERT-base-uncased, FinBERT, Twitter-roBERTa-base, and FinBERT-tone. These models were trained with different data, thus avoiding the larger influence of the training data.
The DistilBERT-base-uncased model (Distil-BERT-uncased modelio nuoroda: https://huggingface.co/distilbert-base-uncased-finetuned-sst-2-english accessed on 22 August 2022) is a reduced version of the Bert-base-uncased model but exerts extremely high performance. This model was trained on the SST-2 dataset and has an accuracy of 91.3 percent. FinBERT is a model developed by Prosus, specifically designed to analyse financial texts [59]. This model is a BERT model, but it was explicitly trained on financial textual data, which allowed this model to identify better sentiments in texts related to financial information. Data from Financial PhraseBank were used to train the model [60]. Another model used in the study was the FinBERT-tone model (FinBERT-tone modelio nuoroda: https://huggingface.co/yiyanghkust/finbert-tone accessed on 18 August 2022). The textual data of financial information were also used to train this model [61]. This model was trained using as many as three different sets of financial information. The total case size was 4.9 B tokens. Companies report 10-K and 10-Q with USD 2.5 billion tokens, earnings call transcripts with USD 1.3 billion tokens, and analyst reports with USD 1.1 billion tokens. In this tone, the model was trained with manually labelled data. This model achieves better performance in the financial tone analysis task. The final model in this study was the Twit-ter-roBERTa-base model, specifically used for sentiment analysis [62]. This model was trained using as many as 124 million Twitter messages collected over three years. It can also evaluate sentiments, not only for financial data but also for general texts.

4.3. Clustering Methods Used in the Research

The purpose of this study was to classify all news texts into groups to determine these groups’ sentiments. For this purpose, cluster analysis was used; the models used are described further in this subsection. Cluster analysis is a type of unsupervised learning, the main goal of which is to classify the observations into certain unknown groups based on the similarity of the observations. In this case, observations in one cluster are as similar as possible to each other, while observations in separate clusters are different from each other. This analysis helps to discover clusters that may not usually be discernible in the original data. When analysing cluster analysis, it can be noticed that distance-based cluster analysis is usually mentioned. This type of cluster analysis is based on the distance between observations. One of the most popular k-means clustering methods was used in this study. This method is convenient to use due to its simple operation and the small number of required parameters. The k-means method divides the available data into k groups, where each observation belongs to exactly one group. In the first cycle, the data are divided into k groups. Then, during the iterations, an attempt is made to find the most suitable partition of the data so that the elements in the cluster are similar (the distance between them is the smallest). At the same time, the observations between individual clusters are different (the distance between them is the largest). The essence of the k-means method is the division of observations into k-specified clusters, but using these methods and randomly initializing the cluster centres, the clusters may be different. This method can be described in 5 main steps (see Figure 5):
  • The observations are randomly divided into k clusters, and the initial centres of these clusters are selected.
  • Cluster centres are recalculated.
  • The distance of each observation to the clusters is calculated based on distance measures.
  • The observations are assigned to the nearest cluster according to the distance to the cluster centres.
  • Steps 2–4 are repeated until the cluster centres do not change or whenchange is less than the specified tolerance limit.
Figure 5. Visualization of the k-means method.
Mathematics 10 03461 g005
The new modified inversion formula density estimation (MIDE) clustering method was also used in this study [63]. This method is based on a modified inversion formula, and the obtained empirical research results show that this method performs qualitative clustering. Moreover, in order to determine the most suitable clustering methods for the analysed data, other clustering methods were used in this study: Gaussian mixture models, Bayesian Gaussian mixture models, density-based spatial clustering of applications with noise (DBSCAN) [64], balanced iterative reducing and clustering using hierarchies (BIRCH) [65], and ordering points to identify the clustering structure (OPTICS) [66]. These different models were trained by changing their parameters; thus, to determine the best clustering models, the parameters of each model were selected from its parameter set. For example, the MIDE parameters set the percentage of exceptions, which can be changed from 0 to 10%, and the DBSCAN method sets the minimum distance between points or the minimum number of points in a cluster.

4.4. Clustering Evaluation Metrics

This subsection presents the main metrics used to evaluate clustering results in the study. In this case, clustering was performed without prior knowledge of the true classes, so metrics such as accuracy and NMI (or other metrics that require true classes) cannot be used. This work used several different metrics that do not require actual classes. One of the metrics is the Calinski and Harabasz metric [67], which is also often called the variance ratio criterion. The score is the ratio of the within-cluster variance to the sum of the within-cluster variance. Another metric used was the Davies–Bouldin metric [68], which evaluates cluster similarities. This metric was calculated as the similarity between within-cluster distances and between-cluster distances. The lowest possible value for this metric was zero, and the lower the value, the better the clustering results. Finally, the last metric used was the silhouette coefficient [69]. However, it is important to emphasize that this coefficient is more difficult to calculate when such a large amount of data is used in this paper. A large amount of data makes it difficult to calculate distances for each observation. The observed silhouette coefficient is (b-a)/max (a, b). For clarity, b is the distance between the sample and the nearest cluster of which the observation is not a part. The best value is one and the worst is −1. Values near 0 indicate overlapping groups.

4.5. Forecasting Methods Used in the Research

Many different econometric models are used in scientific research to forecast economic activity and different economic variables. These models include models such as the dynamic factorial model [70,71], Bayesian vector autoregression (BVAR) models [72], and factor-augmented VAR (FAVAR) models [73]. Richardson et al. (2021) [74] demonstrated that machine learning algorithms allow central banks to assess the current state of the economy in more detail and can be more accurate than conventional econometric models. For this reason, this study did not use traditional econometric models for forecasting, but rather machine learning methods. Such methods allow the influence of sentiment analysis on different indicators of economic activity and the significance of the use of machine learning in economic forecasting to be evaluated. Considerable attention in data science is paid specifically to neural networks. Feed-forward neural networks are commonly used to solve problems, but it is important to mention that these neural networks cannot capture data variation. This makes it difficult to use these neural networks to predict economic indicators. In order to predict dynamic indicators, recurrent neural networks were created, which allow both the current state and also the past state to be recorded, as well as data from different periods [75]. However, RNNs suffer from the problem of vanishing gradients, which hinders the learning of long data sequences. For this reason, newer long–short-term memory (LSTM) neural networks have been developed, a type of recurrent neural network that not only captures past data when the gap between input information and output is small, but also when this gap is much larger [76]. Another modification of recurrent neural networks is the gated recurrent unit (GRU). One of the main differences between LSTMs and GRUs is that GRUs do not have memory cells [77]. This type of neural network does not separate forget gate and input gate but combines them into one update gate. Moreover, this type of neural network combines the cell’s state and the hidden state.

4.6. Forecasting Evaluation Metrics

An essential factor in developing machine learning models is the accuracy of these models, so functions that can evaluate the accuracy of the models are needed. Error functions perform this function by comparing the values predicted by the models and the actual values. Depending on the problem being solved, different error functions were applied. The following table shows the error functions of the regression models (see Table 1). It is essential to mention that, considering the task that is solved in this work, not all the metrics presented in the table were used, but these metrics are still discussed in the paper. The root mean square error (RMSE) [61] is the standard deviation of the errors. This metric is one of the most commonly used metrics for solving problems involving regression models. The RMSE metric describes how widely the errors are spread. The RMSE is used in climatology, forecasting, and regression analysis to verify experimental results. Another metric used in regression problems is the mean squared error [78], which can essentially be said to be the same RMSE metric, except that the root is not used in its calculation. The mean absolute error [79] is the absolute mean error of the errors, which allows us to precisely estimate the absolute error. The coefficient of determination [80] is an evaluation function whose best value is unity; the closer this value is to unity, the better the trained model.

5. Results

This section presents the main results of the study. The first subsection of this chapter (see Section 5.1) provides information on the results of news clustering using different clustering methods. These results were evaluated using the clustering performance evaluation metrics described in the previous section. The second subsection of this chapter (see Section 5.2) provides information on news sentiment analysis. The results are also presented separately because the sentiment analysis was conducted in different directions. Sentiment analysis was performed for all news in general, individual news categories, and clusters obtained during clustering. Finally, the third subsection of this chapter (see Section 5.3) provides information on forecasting different economic indicators describing the economic activity. The forecasting of different indicators was based on the sentiment analysis results obtained in the second subsection and the clustering results presented in the first subsection.

5.1. News Clustering Results

This subsection provides information on the different clustering methods used during the study and the obtained results. In the first step of news clustering, all textual information was transformed into numerical information using sentence transformers. Using sentence transformers, textual data are transformed into 384-dimensional data. Each text corresponds to a certain point in this space, according to the words in the sentence, their meanings, and their semantic meaning. These points are then clustered based on different clustering methods, and the obtained results are compared based on the metrics discussed in the previous section. The methods with the best results are used in further research. The table below (see Table 2) shows the clustering results. More clustering methods were used in the study in the Methods section, but some problems were observed with these methods. Due to the huge amount of data, the BIRCH clustering method required as much as 4 TB of RAM, which made it hard to implement at this step of the problem. Furthermore, the DBSCAN and OPTICS methods, due to their matrix calculation, cope with the presented tasks in a difficult way. These methods take a very long time, making it difficult to discover suitable parameter sets. The table below shows the results of the four clustering methods. It can be seen that the best clustering results were obtained using the K-means method. Moreover, the MIDE method showed quite good clustering results. During the clustering, data dimensionality reduction methods were additionally applied (PCA, t-SNE, and SMACOF), but no positive influence on the clustering results was observed.

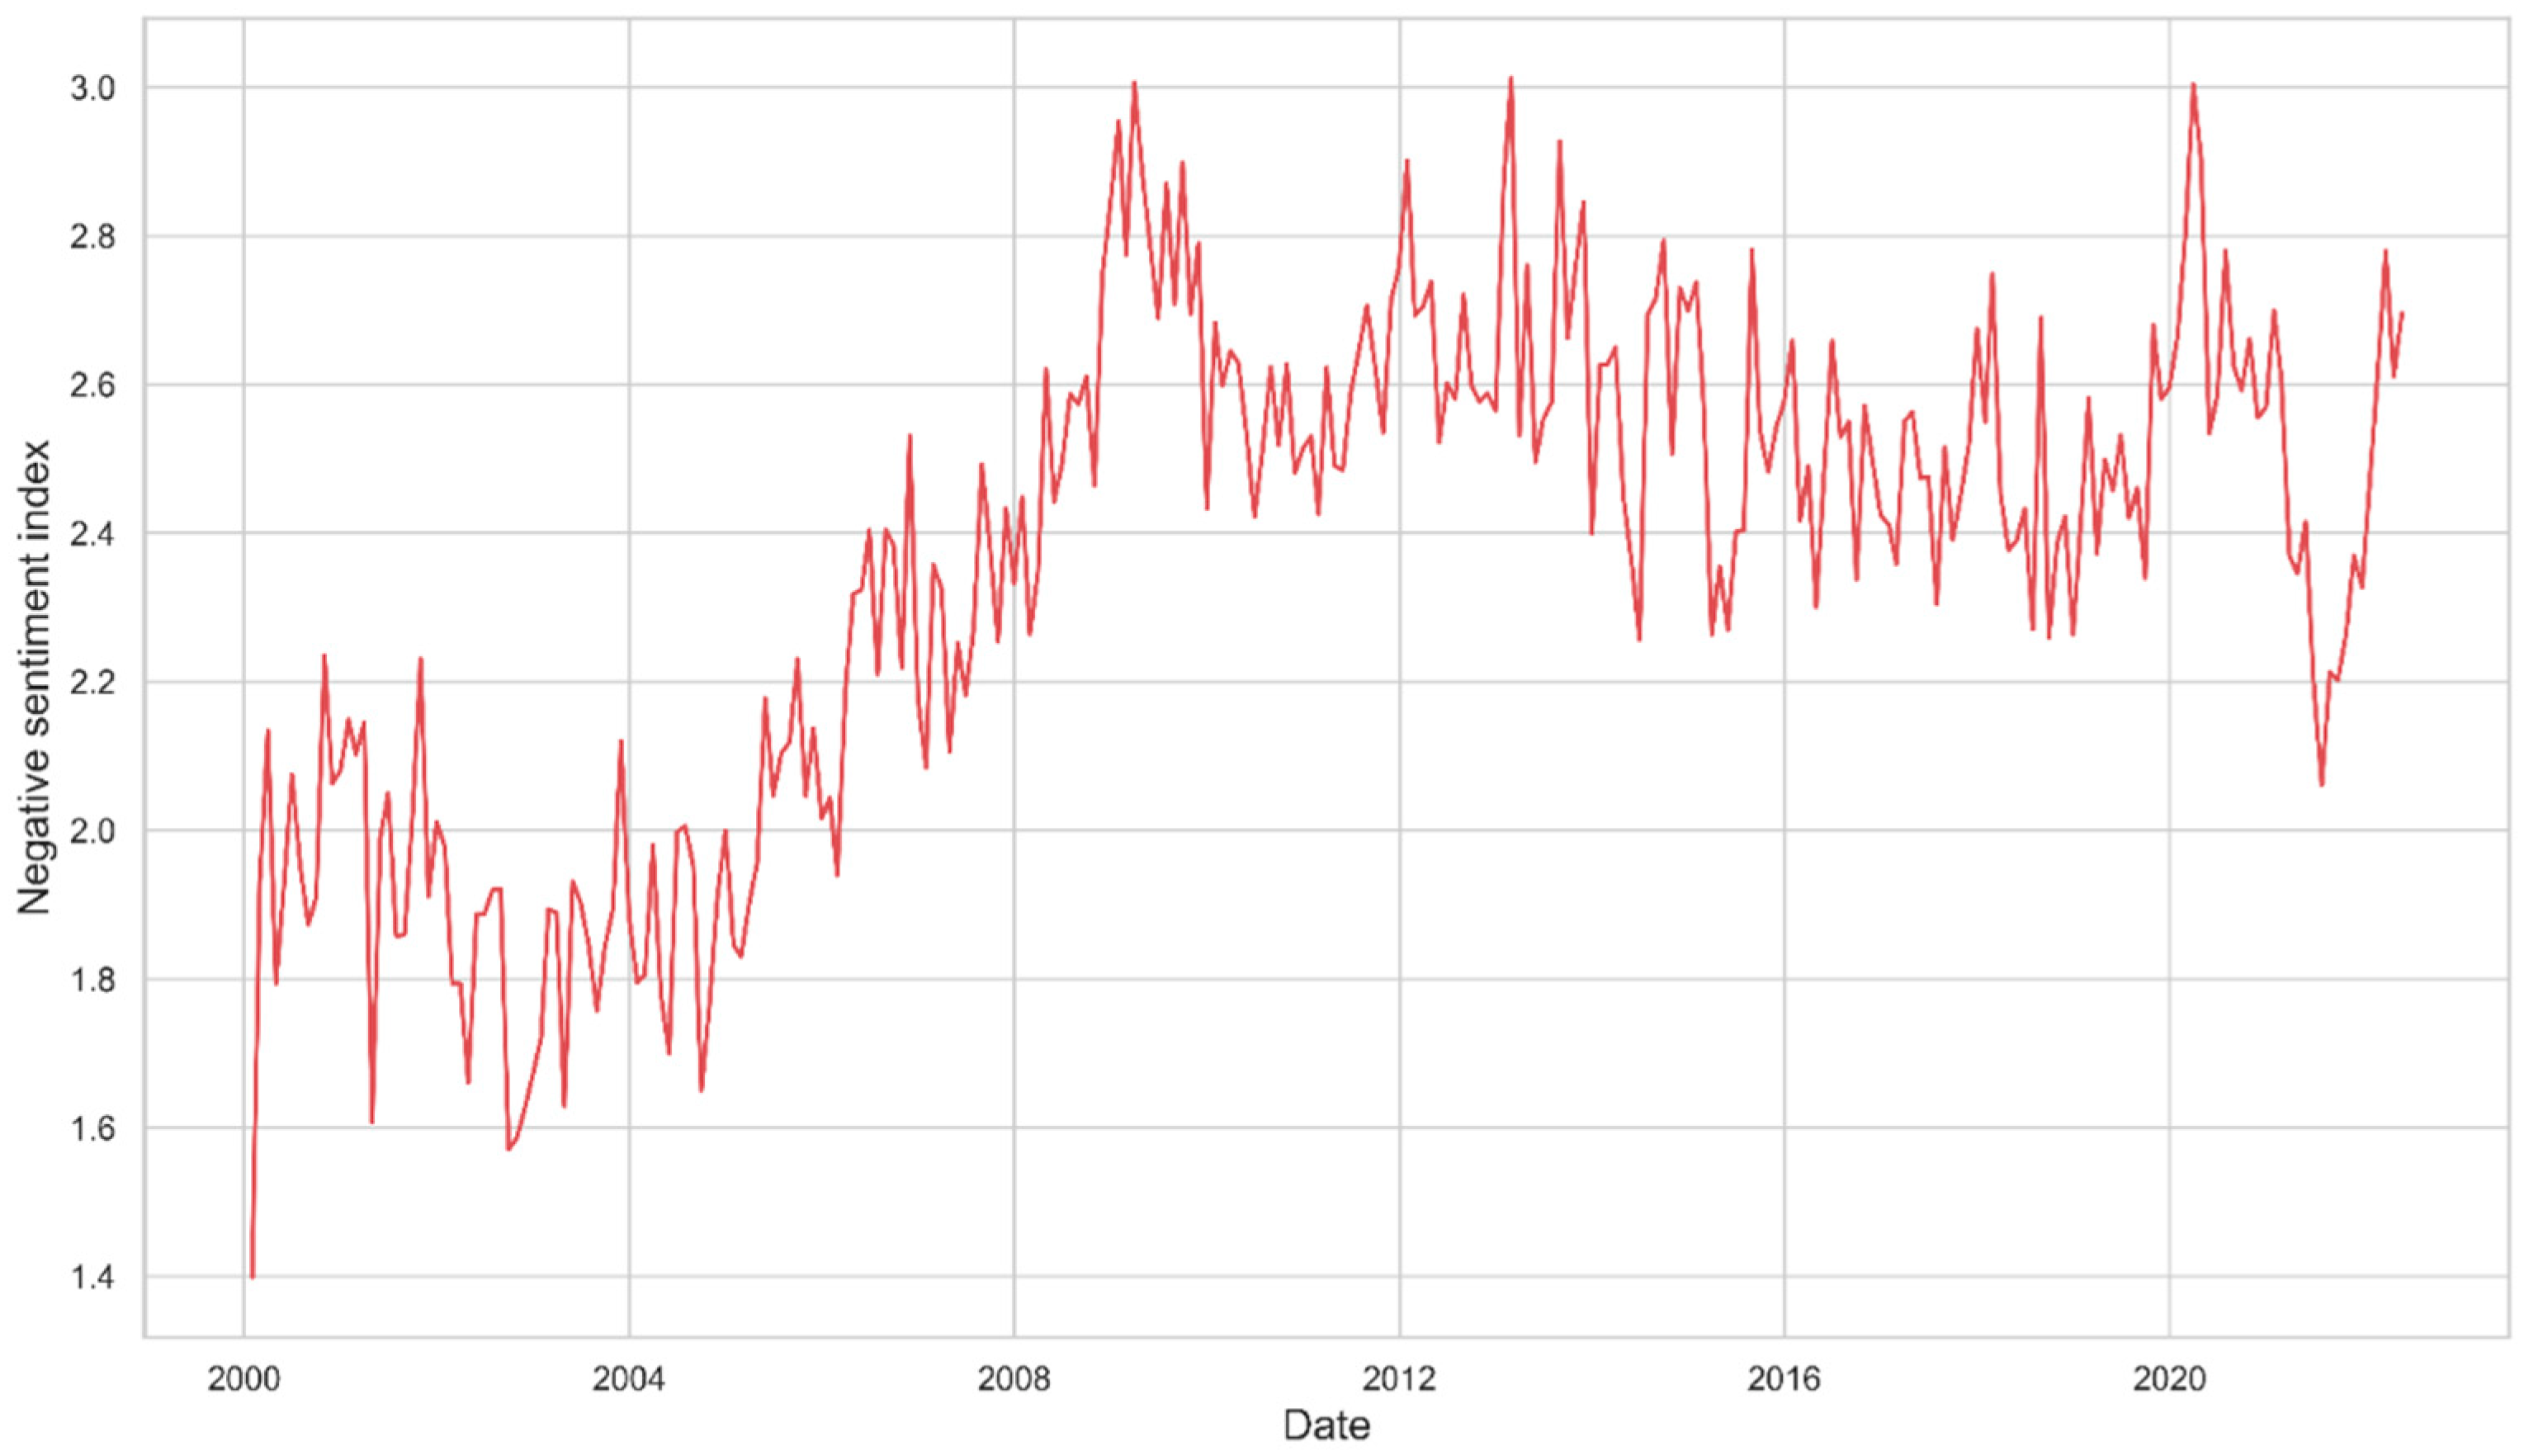
5.2. Sentiment Index of the News

This subsection presents the results of the sentiment analysis. Sentiment analysis was performed using different cuts of the datasets. In the first case, sentiment analysis was performed using the entire available dataset. In the second case, sentiment analysis was performed using news categories extracted from news articles (business, health, in Lithuania, abroad). In the last case, sentiment analysis was performed based on the clustering results. In order to perform such sentiment analysis, first, all data were clustered according to the best model determined in the previous section. Sentiment analysis was then performed using separate clusters, and the sentiment time series was thus created, which is used in the following section. Four different models were used for sentiment analysis to avoid the possible influence of individual sentiment analysis models, which were previously trained on different datasets. These models are discussed in the Materials and Methods section. The general sentiment index (SI) for time t is calculated according to the formula below:
S I t = 1 N t j = 1 4 i = 1 N t T j A i t
where S I t is the sentiment index at a point in time t; T j , a sentiment analysis model (transformer), is used since the sum of the four models used in total is up to 4; T j A i t , the output, is given in the interval from 0 to 1; and A i t is the ith news article at time t, where i is in the interval from 1 to Nt and Nt is the number of news articles at a time t.
Below is a graphical representation of negative sentiment analysis for the business news category using only news article titles (see Figure 6). Based on the presented results, it can be observed that the negative sentiment toward knowledge increased, particularly during the period of economic crisis. A big jump is also observed at the beginning of the COVID-19 pandemic and the beginning of the war in Ukraine. These economic shocks can explain these changes in negative sentiment in business news. When a crisis, war, or pandemic starts, or when these events are anticipated, a higher number of negative news is observed in the information of business news. There are also discussions of various possible options, so negative sentiment can indicate upcoming shocks in economic activity as well. It is also important to mention the fact that this compiled index has a fairly high correlation with the indices previously compiled by other authors. For example, Baker et al. (2016) compiled the economic policy uncertainty index (EPU) [9]. Using the data available in this study, it was found that the correlation between the EPU index and the SI index obtained in the study is statistically significant. However, it is important to emphasize that the EPU index uses pre-defined words, whereas this work does not require this to calculate the index.
Below is a graphic representation of negative sentiment analysis for the business news category using news titles and article lead information (see Figure 7). These results provide similar interpretations as the previous graphical representation. However, in this case, it can be observed that after the shocks, the negative sentiment decreases more. The most negative sentiment changes are seen in the same periods discussed earlier. Numerically, it is observed that the negative sentiment is higher than when only using the textual information of the titles.
As can be seen, only the negative sentiments of business news were presented, but during the study, the analysis was carried out with different categories. Therefore, the sentiment analysis results for these categories are presented in the graphs in the Appendix A (see Figure A1, Figure A2, Figure A3, Figure A4, Figure A5 and Figure A6).

5.3. Economic Activity Forecasting

This subsection presents the forecasting results of different indicators of economic activity. Conventional correlation analysis can be performed in the first forecasting stage. The table below (see Table 3) shows the results of the correlation analysis between the negative sentiments of different news categories and economic variables. Abbreviations in the table below (see Table 3) are as follows: UNY—youth unemployment rate, UNA—total unemployment rate, CS—consumer satisfaction, MI—monthly inflation rate, YI—annual inflation rate, and PI—output index. It can be noted that not all variables have statistically significant correlations in the presented table. It is observed that the youth unemployment rate decreases as the negative sentiment of foreign news, health news, and cultural news increases (more bad news). The same conclusions are also observed when adding the sentiments of Lithuanian news and science news and evaluating the overall unemployment level. These results can be interpreted so that when the number of negative news on news portals increases, employees are less inclined to leave their jobs and are more inclined to look for work. As we can see, there is no significant correlation with business news, so it can be assumed that these sentiments are perhaps not so crucial for business. It is observed that consumer confidence is negatively related to negative sentiment across categories. Arguably, the more negative news in the press, the less trust consumers have in companies. This can be related to various price increases in negative news about companies. The results show a positive and statistically significant relationship between news sentiment and monthly and annual inflation rates.
Interestingly, the negative sentiment of business news has a statistically significant relationship, but only with the annual inflation rate and not the monthly inflation rate. It is also noticeable that both the monthly and annual inflation rates have a statistically significant relationship with the negative sentiment of the Lithuanian news category. The production index has a statistically significant relationship with the negative sentiment of the business news category; as the negative sentiment increases, the production index decreases.
In the second stage of economic activity forecasting, different machine learning methods were applied to predict the obtained time series. The following table (see Table 4) presents the results obtained during the study. During the study, different neural networks were used for prediction: the simplest RNN, LSTM, and GRU. In order to find optimal prediction models, different parameters of the neural network were changed: the number of hidden layers of the neural network (h), the number of nodes of the neural network (n), and the learning rate of the neural network (lr). The number of hidden layers of the neural network changed from 1 to 10, the number of nodes of the neural network from 8 to 512, and the learning rate of the neural network from 0.001 to 0.1. Moreover, to generalize the model as much as possible, k-fold cross-validation was used, and the table below shows the average values of the metrics and their standard deviation. K-fold cross-validation for time series was carried out, like rolling estimation. For example, model training used 80 percent of the data (from the period beginning to the 80th percentile). Then, the model was tested for the next three months of the data. In the second cycle, 84 percent of data were used for training and the next three months for testing. Different metrics were calculated based on the testing data, and averages and standard deviations were calculated. Model tests like this one verify whether models are generalized for “good” periods and for different trends and seasonality periods. Different datasets have been used to forecast economic activity:
  • Univariate. In the univariate time series, only forecasted past values of the indicator are used.
  • Best sentiment. A univariate time series of the economic activity indicator and a time series of negative sentiments for individual categories are used. Here, the sentiment time series of the categories are used separately.
  • All sentiments. A univariate time series of the economic activity indicator and immediately the time series of all categories of negative sentiments are used.
  • Biggest cluster. The one-dimensional time series of the economic activity indicator and the time series of the negative sentiment of the largest cluster is used.
Table 4. Results of economic activity forecasting based on univariate time series and multivariate time series.
Data/ModelRMSEMAEMAPE
MeanStdMeanStdMeanStd
Youth unemployment rate
Univariate0.0380.0100.0270.0060.0420.009
Business sentiment0.1190.0170.1050.0180.3360.052
All sentiments0.2070.0410.1860.0400.4350.061
Biggest cluster0.2210.0450.1960.0430.4580.068
Overall unemployment rate
Univariate0.0450.0090.0350.0060.0470.008
Business sentiment0.1210.0230.1100.0250.3380.061
All sentiments0.2640.0230.2560.0250.5330.040
Biggest cluster0.2670.0350.2780.0370.5760.045
Consumer satisfaction
Univariate0.0790.0100.0570.0070.0790.009
Overall sentiment0.0480.0050.0400.0030.0660.006
All sentiments0.1190.0220.0950.0210.1380.036
Biggest cluster0.1250.0230.0980.0230.1470.037
Monthly inflation rate
Univariate0.1870.0100.1430.0080.3400.015
Overall sentiment0.1230.0030.0930.0020.2550.008
All sentiments0.2090.0100.1620.0060.3650.032
Biggest cluster0.2080.0130.1580.0070.3560.045
Annual inflation rate
Univariate0.0870.0180.0650.0130.2980.030
Overall sentiment0.0620.0070.0530.0060.2830.035
All sentiments0.1060.0590.0810.0430.2850.117
Biggest cluster0.1560.0680.0980.0560.3050.158
Production index
Univariate0.2140.0110.1770.0140.4020.031
Lithuania sentiment0.0990.0030.0760.0040.1660.010
All sentiments0.1120.0110.0860.0100.1710.014
Biggest cluster0.1560.0230.1050.0210.2050.026
Bolded underlined values indicate the best obtained results.
Time series forecasting uses a time series lag of the economic indicator and negative sentiment from 1 to 12. The table below shows the univariate time series for each indicator of economic activity, the best negative sentiment for one category (the name of the best predictor category is given), the negative sentiment for all categories, and the highest cluster negative sentiment prediction results. This table shows only the results of the best models. A total of more than 20,000 different models were created during the study with different parameters and datasets. It can be seen that both the youth unemployment rate and the overall unemployment rate are best predicted with univariate time series. Although these variables have previously been correlated with category negative sentiment, time elutes do not provide such an advantage in predicting sentiment. It can be seen that negative sentiment-based forecasting outperforms one-dimensional forecasting across all metrics. In the case of clustering, only the most significant cluster was used, so the results obtained are worse than using single-category sentiment. When evaluating consumer confidence, it is observed that the forecasting of this economic activity indicator is better based on the general index of negative sentiment (comparisons with univariate time series). In this case, the average absolute percentage error is 1.3% lower. However, if all sentiments are included in the forecasting, instead of the best one, the forecasting deterioration is noticeable, and in this case, the MAPE is 5.9% higher. It is noticeable that forecasting the monthly and annual inflation rate is thus best when the overall negative sentiment is used. The MAPE of the monthly inflation rate is as much as 8.5% lower, while the MAPE of the annual inflation rate is 1.5% lower. The output index shows the largest change in the forecast between the univariate time series and sentiment forecasting.

6. Discussion

Several main goals were set and implemented during the research, which were discussed in this paper. In the first phase of the study, a large amount of data was collected. This work collected information from two leading Lithuanian news portals (about 2.5 million articles). It is important to note that there are many more news portals in Lithuania, and this project’s further development envisages more excellent information collection.
Further in this work, data clustering was performed, and it can be observed that data clustering with such a large amount of data does not work as well as expected at the beginning of the work. Only part of the expected models for clustering could be used in this research, but these are the most used models in practice. This allowed us to evaluate clustering’s impact on news sentiment analysis and forecasting. Another important factor and limitation of this work is that the titles and leads of the articles were used in the work, but not the entire article’s structure. Nevertheless, we could approve our sentiment impact on the economic activity hypothesis even with the title and lead sentiment analysis. A Lithuanian sentiment analysis model is also currently being developed, which would no longer require the additional translation of texts, and pure texts could be used to extract negative sentiments. In summary, the other results obtained during the study were expected, which supports the hypothesis that negative news sentiment is related to economic activity.
Furthermore, it was observed that negative news sentiment (in individual categories) increases when the economic situation worsens, e.g., with crises, the COVID-19 pandemic, or war. The determined correlation coefficients only further confirmed a statistically significant linear relationship between individual indicators of economic activity and individual categories of negative sentiments. Moreover, after applying the machine learning model to forecasting different economic activity indicators, it is observed that negative sentiment essentially helps to forecast economic activity better. Such results confirm the hypothesis raised during the work about the influence of negative news sentiments on economic activity. Additionally, in a future project, the more extensive use of different machine learning methods in forecasting is planned. Finally, it is essential to mention that low-frequency traditional data are mainly used for forecasting Lithuanian economic activity, and currently, alternative or Big Data are not so often used. Therefore, this study is an excellent start to better use the alternative data available in Lithuania which, as the study confirmed, can be applied to forecasting and refine forecasting compared to traditional data.

7. Policies Implications

The results obtained during the study confirmed that negative news sentiment, extracted using machine learning methods, has a significant relationship with different indicators of economic activity. The gained results may be helpful for government institutions in making timely policy decisions and evaluating policy implementation effectiveness, as the sentiment analysis by different categories provides more detailed information on different areas of the state, such as economy, business, health, and others. The gained results may be helpful for business companies as well, as negative news sentiment can also indicate further economic directions, which allows them to prepare for possible economic shocks, assess the market situation, and create a backup business model. For analysts and experts in the field, this research helps to evaluate the application of machine learning methods in natural language processing and economics. It helps to assess the difficulties of collecting a large amount of data, the need for processing, and the further possibilities of developing new methods. Further cooperation between the academic and business community is possible based on the research results. It has also been observed that large amounts of freely available data create a significant number of new alternative economic variables for national banks and other institutions.

8. Conclusions and Future Research

This study proved the hypothesis that negative news sentiment is related to economic activity. Furthermore, negative news sentiment can be determined based on artificial intelligence methods or transformer structure models. Using negative sentiment in economic activation forecasting reduces model errors and makes more accurate forecasts.
However, this research is further expanded in several different directions: (1) the improvement of the dataset; (2) the application and comparison of different methods for evaluating news sentiment; (3) the development of different structured artificial intelligence models (transformers). Firstly, it is essential to note that many more news portals exist in Lithuania, and this project’s further development envisages greater information collection. This would provide more data and more diverse categories. Furthermore, when evaluating data extraction and its quality and use, in the further stage of this project, it is expected to apply both textual information and visual information of articles. In order to solve this, in the further stages of the research, a comparison of various data dimensionality reduction methods is expected, which would allow clustering to be performed much more simply and without losing a large amount of information. Secondly, this research was based on transformer structure and did not use other authors’ methodologies for comparison purposes. One of the future research fields refers to the different approaches comparison for the same task and mixed sentiment index creations based on the different approaches. Last but not least, the information in the full article was limited to the models used, subject to a maximum text length. However, further work aims to solve this limitation by dividing the text into parts and evaluating the negative sentiment of individual sentences/paragraphs or other parts of the sentence.

Author Contributions

Conceptualization, M.L., V.P., J.B., A.S., A.G. and T.R.; methodology, M.L., V.P., A.G. and T.R.; software, M.L. and T.R.; validation, V.P., J.B., A.S. and A.G.; formal analysis, M.L.; investigation, M.L., V.P. and A.G.; resources, M.L., V.P., J.B., A.S., A.G. and T.R.; data curation, M.L.; writing—original draft preparation, M.L. and A.G.; writing—review and editing, M.L., V.P., J.B., A.S., A.G. and T.R.; visualization, M.L.; supervision, V.P., J.B., A.S. and T.R.; project administration, V.P., J.B. and A.S.; funding acquisition, V.P., J.B. and A.S. All authors have read and agreed to the published version of the manuscript.

Funding

This project has received funding from European Regional Development Fund (project No. 13.1.1-LMT-K-718-05-0012) under a grant agreement with the Research Council of Lithuania (LMTLT). Funded as European Union’s measure in response to the COVID-19 pandemic.

Institutional Review Board Statement

Not applicable.

Informed Consent Statement

Not applicable.

Data Availability Statement

Not applicable.

Acknowledgments

The authors thank the area editor and the reviewers for giving valuable comments and suggestions.

Conflicts of Interest

The authors declare no conflict of interest.

Appendix A

Figure A1. Sentiment analysis of news titles and leads over time for overall news.
Mathematics 10 03461 g0a1
Figure A2. Sentiment analysis of news titles and leads over time for category “Lithuania” news.
Mathematics 10 03461 g0a2
Figure A3. Sentiment analysis of news titles and leads over time for category “Foreign” news.
Mathematics 10 03461 g0a3
Figure A4. Sentiment analysis of news titles and leads over time for category “Science” news.
Mathematics 10 03461 g0a4
Figure A5. Sentiment analysis of news titles and leads over time for category “Culture” news.
Mathematics 10 03461 g0a5
Figure A6. Sentiment analysis of news titles and leads over time for category “Health” news.
Mathematics 10 03461 g0a6

References

  1. Alexakis, G.; Panagiotakis, S.; Fragkakis, A.; Markakis, E.; Vassilakis, K. Control of smart home operations using natural language processing, voice recognition and IoT technologies in a multi-tier architecture. Designs 2019, 3, 32. [Google Scholar] [CrossRef]
  2. Ren, H.; Mao, X.; Ma, W.; Wang, J.; Wang, L. An English-Chinese machine translation and evaluation method for geographical names. ISPRS Int. J. Geo-Inf. 2020, 9, 139. [Google Scholar] [CrossRef]
  3. Neto, A.F.d.S.; Bezerra, B.L.D.; Toselli, A.H. Towards the natural language processing as spelling correction for offline handwritten text recognition systems. Appl. Sci. 2020, 10, 7711. [Google Scholar] [CrossRef]
  4. de Oliveira, N.R.; Pisa, P.S.; Lopez, M.A.; de Medeiros, D.S.V.; Mattos, D.M. Identifying fake news on social networks based on natural language processing: Trends and challenges. Information 2021, 12, 38. [Google Scholar] [CrossRef]
  5. Zhang, L.; Wang, S.; Liu, B. Deep learning for sentiment analysis: A survey. Wiley Interdiscip. Rev. Data Min. Knowl. Discov. 2018, 8, e1253. [Google Scholar] [CrossRef]
  6. Hussein, D.M.E.-D.M. A survey on sentiment analysis challenges. J. King Saud Univ. Eng. Sci. 2018, 30, 330–338. [Google Scholar] [CrossRef]
  7. Taj, S.; Shaikh, B.B.; Meghji, A.F. Sentiment analysis of news articles: A lexicon based approach. In Proceedings of the 2019 2nd International Conference on Computing, Mathematics and Engineering Technologies (iCoMET), Online, 30–31 January 2019; pp. 1–5. [Google Scholar]
  8. Buckman, S.R.; Shapiro, A.H.; Sudhof, M.; Wilson, D.J. News sentiment in the time of COVID-19. FRBSF Econ. Lett. 2020, 8, 5. [Google Scholar]
  9. Baker, S.R.; Bloom, N.; Davis, S.J. Measuring economic policy uncertainty. Q. J. Econ. 2016, 131, 1593–1636. [Google Scholar] [CrossRef]
  10. Caldara, D.; Iacoviello, M. Measuring geopolitical risk. Am. Econ. Rev. 2022, 112, 1194–1225. [Google Scholar] [CrossRef]
  11. Shapiro, A.H.; Sudhof, M.; Wilson, D.J. Measuring news sentiment. J. Econom. 2020, 228, 221–243. [Google Scholar] [CrossRef]
  12. Sousa, M.G.; Sakiyama, K.; de Souza Rodrigues, L.; Moraes, P.H.; Fernandes, E.R.; Matsubara, E.T. BERT for stock market sentiment analysis. In Proceedings of the 2019 IEEE 31st International Conference on Tools with Artificial Intelligence (ICTAI), Portland, OR, USA, 4–6 November 2019; pp. 1597–1601. [Google Scholar]
  13. Jang, E.; Choi, H.; Lee, H. Stock prediction using combination of BERT sentiment Analysis and Macro economy index. J. Korea Soc. Comput. Inf. 2020, 25, 47–56. [Google Scholar]
  14. Gite, S.; Khatavkar, H.; Kotecha, K.; Srivastava, S.; Maheshwari, P.; Pandey, N. Explainable stock prices prediction from financial news articles using sentiment analysis. PeerJ Comput. Sci. 2021, 7, e340. [Google Scholar] [CrossRef] [PubMed]
  15. Galbraith, J.W.; Tkacz, G. Nowcasting GDP with Electronic Payments Data; 928991906X; ECB Statistics Paper; European Central Bank: Frankfurt am Main, Germany, 2015. [Google Scholar]
  16. Bok, B.; Caratelli, D.; Giannone, D.; Sbordone, A.M.; Tambalotti, A. Macroeconomic nowcasting and forecasting with big data. Annu. Rev. Econ. 2018, 10, 615–643. [Google Scholar] [CrossRef]
  17. Cooper, I.; Priestley, R. The world business cycle and expected returns. Rev. Financ. 2013, 17, 1029–1064. [Google Scholar] [CrossRef]
  18. Baumeister, C.; Hamilton, J.D. Structural interpretation of vector autoregressions with incomplete identification: Revisiting the role of oil supply and demand shocks. Am. Econ. Rev. 2019, 109, 1873–1910. [Google Scholar] [CrossRef]
  19. Herrera, A.M.; Rangaraju, S.K. The effect of oil supply shocks on US economic activity: What have we learned? J. Appl. Econom. 2020, 35, 141–159. [Google Scholar] [CrossRef]
  20. Sampi Bravo, J.R.E.; Jooste, C. Nowcasting Economic Activity in Times of COVID-19: An Approximation from the Google Community Mobility Report; World Bank Policy Research Working Paper; The World Bank: Washington, DC, USA, 2020. [Google Scholar]
  21. Diaz, E.M.; Perez-Quiros, G. GEA tracker: A daily indicator of global economic activity. J. Int. Money Financ. 2021, 115, 102400. [Google Scholar] [CrossRef]
  22. Angelov, N.; Waldenström, D. The Impact of COVID-19 on Economic Activity: Evidence from Administrative Tax Registers. 2021. Available online: https://ssrn.com/abstract=3886818 (accessed on 20 August 2022).
  23. Bricongne, J.-C.; Meunier, B.; Pical, T. Can Satellite Data on Air Pollution Predict Industrial Production? 2021. Available online: https://ssrn.com/abstract=3967146 (accessed on 20 August 2022).
  24. Baldwin, R.; Di Mauro, B.W. Economics in the time of COVID-19: A new eBook. VOX CEPR Policy Portal 2020, 2–3. Available online: https://fondazionecerm.it/wp-content/uploads/2020/03/CEPR-Economics-in-the-time-of-COVID-19_-A-new-eBook.pdf (accessed on 20 August 2022).
  25. Chernis, T.; Cheung, C.; Velasco, G. A three-frequency dynamic factor model for nowcasting Canadian provincial GDP growth. Int. J. Forecast. 2020, 36, 851–872. [Google Scholar] [CrossRef]
  26. Lourenço, N.; Rua, A. The Daily Economic Indicator: Tracking economic activity daily during the lockdown. Econ. Model. 2021, 100, 105500. [Google Scholar] [CrossRef]
  27. Cavallo, A.; Diewert, W.E.; Feenstra, R.C.; Inklaar, R.; Timmer, M.P. Using online prices for measuring real consumption across countries. In AEA Papers and Proceedings; American Economic Association: Nashville, TN, USA, 2018; pp. 483–487. [Google Scholar] [CrossRef]
  28. Mellander, C.; Lobo, J.; Stolarick, K.; Matheson, Z. Night-time light data: A good proxy measure for economic activity? PLoS ONE 2015, 10, e0139779. [Google Scholar] [CrossRef] [PubMed]
  29. Kapetanios, G.; Papailias, F. Big Data & Macroeconomic Nowcasting: Methodological Review; Economic Statistics Centre of Excellence, National Institute of Economic and Social Research: London, UK, 2018; Available online: http://escoe-website.s3.amazonaws.com/wp-content/uploads/2020/07/13161005/ESCoE-DP-2018-12.pdf (accessed on 20 August 2022).
  30. Fenz, G.; Stix, H. Monitoring the economy in real time with the weekly OeNB GDP indicator: Background, experience and outlook. Monet. Policy Econ. 2021, Q4/20–Q1/21, 17–40. [Google Scholar]
  31. Orihuel, E.; Sapena, J.; Navarro-Ortiz, J. An empirical algorithm for COVID-19 nowcasting and short-term forecast in Spain: A kinematic approach. Appl. Syst. Innov. 2021, 4, 2. [Google Scholar] [CrossRef]
  32. Xin, M.; Shalaby, A.; Feng, S.; Zhao, H. Impacts of COVID-19 on urban rail transit ridership using the Synthetic Control Method. Transp. Policy 2021, 111, 1–16. [Google Scholar] [CrossRef]
  33. Li, B.; Ma, L. Migration, transportation infrastructure, and the spatial transmission of COVID-19 in China. J. Urban. Econ. 2020, 15, 103351. [Google Scholar] [CrossRef]
  34. Eraslan, S.; Götz, T. An unconventional weekly economic activity index for Germany. Econ. Lett. 2021, 204, 109881. [Google Scholar] [CrossRef]
  35. Eckert, F.; Kronenberg, P.; Mikosch, H.; Neuwirth, S. Tracking Economic Activity with Alternative High-Frequency Data; KOF Working Papers; KOF Swiss Economic Institute, ETH Zurich: Zürich, Switzerland, 2020; Volume 488. [Google Scholar] [CrossRef]
  36. Lewis, D.J.; Mertens, K.; Stock, J.H.; Trivedi, M. Measuring real activity using a weekly economic index 1. J. Appl. Econom. 2022, 37, 667–687. [Google Scholar] [CrossRef]
  37. Fornaro, P.; Luomaranta, H. Aggregate fluctuations and the effect of large corporations: Evidence from Finnish monthly data. Econ. Model. 2018, 70, 245–258. [Google Scholar] [CrossRef]
  38. Vaswani, A.; Shazeer, N.; Parmar, N.; Uszkoreit, J.; Jones, L.; Gomez, A.N.; Kaiser, Ł.; Polosukhin, I. Attention is all you need. In Proceedings of the 31st Conference on Neural Information Processing Systems (NIPS 2017), Long Beach, CA, USA, 4–9 December 2017; Volume 30. Available online: https://proceedings.neurips.cc/paper/2017/file/3f5ee243547dee91fbd053c1c4a845aa-Paper.pdf (accessed on 20 August 2022).
  39. Radford, A.; Wu, J.; Child, R.; Luan, D.; Amodei, D.; Sutskever, I. Language models are unsupervised multitask learners. OpenAI blog 2019, 1, 9. [Google Scholar]
  40. Brown, T.; Mann, B.; Ryder, N.; Subbiah, M.; Kaplan, J.D.; Dhariwal, P.; Neelakantan, A.; Shyam, P.; Sastry, G.; Askell, A. Language models are few-shot learners. Adv. Neural Inf. Process. Syst. 2020, 33, 1877–1901. [Google Scholar]
  41. Devlin, J.; Chang, M.-W.; Lee, K.; Toutanova, K. Bert: Pre-training of deep bidirectional transformers for language understanding. arXiv 2018, arXiv:1810.04805. [Google Scholar]
  42. Pires, T.; Schlinger, E.; Garrette, D. How multilingual is multilingual BERT? arXiv 2019, arXiv:1906.01502. [Google Scholar]
  43. Sanh, V.; Debut, L.; Chaumond, J.; Wolf, T. DistilBERT, a distilled version of BERT: Smaller, faster, cheaper and lighter. arXiv 2019, arXiv:1910.01108. [Google Scholar]
  44. Lan, Z.; Chen, M.; Goodman, S.; Gimpel, K.; Sharma, P.; Soricut, R. Albert: A lite bert for self-supervised learning of language representations. arXiv 2019, arXiv:1909.11942. [Google Scholar]
  45. Lewis, M.; Liu, Y.; Goyal, N.; Ghazvininejad, M.; Mohamed, A.; Levy, O.; Stoyanov, V.; Zettlemoyer, L. Bart: Denoising sequence-to-sequence pre-training for natural language generation, translation, and comprehension. arXiv 2019, arXiv:1910.13461. [Google Scholar]
  46. Adhikari, A.; Ram, A.; Tang, R.; Lin, J. Docbert: Bert for document classification. arXiv 2019, arXiv:1904.08398. [Google Scholar]
  47. Liu, X.; He, P.; Chen, W.; Gao, J. Multi-task deep neural networks for natural language understanding. arXiv 2019, arXiv:1901.11504. [Google Scholar]
  48. Yang, Z.; Dai, Z.; Yang, Y.; Carbonell, J.; Salakhutdinov, R.R.; Le, Q.V. Xlnet: Generalized autoregressive pretraining for language understanding. In Proceedings of the 33rd Conference on Neural Information Processing Systems (NIPS 2019), Vancouver, BC, Canada, 8–14 December 2019; Volume 32. Available online: https://proceedings.neurips.cc/paper/2019/hash/dc6a7e655d7e5840e66733e9ee67cc69-Abstract.html (accessed on 20 August 2022).
  49. Gautam, A.; Venktesh, V.; Masud, S. Fake news detection system using xlnet model with topic distributions: Constraint@ aaai2021 shared task. In International Workshop on Combating Online Hostile Posts in Regional Languages during Emergency Situation; Springer: Cham, Switzerland, 2021; pp. 189–200. [Google Scholar]
  50. Merchant, K.; Pande, Y. Nlp based latent semantic analysis for legal text summarization. In Proceedings of the 2018 International Conference on Advances in Computing, Communications and Informatics (ICACCI), Bangalore, India, 19–22 September 2018; pp. 1803–1807. [Google Scholar]
  51. Wolf, T.; Debut, L.; Sanh, V.; Chaumond, J.; Delangue, C.; Moi, A.; Cistac, P.; Rault, T.; Louf, R.; Funtowicz, M. Huggingface’s transformers: State-of-the-art natural language processing. arXiv 2019, arXiv:1910.03771. [Google Scholar]
  52. Topal, M.O.; Bas, A.; van Heerden, I. Exploring transformers in natural language generation: Gpt, bert, and xlnet. arXiv 2021, arXiv:2102.08036. [Google Scholar]
  53. Gao, F.; Zhu, J.; Wu, L.; Xia, Y.; Qin, T.; Cheng, X.; Zhou, W.; Liu, T.-Y. Soft contextual data augmentation for neural machine translation. In Proceedings of the 57th Annual Meeting of the Association for Computational Linguistics, Florence, Italy, 28 July–2 August 2019; pp. 5539–5544. [Google Scholar]
  54. Li, X.; Fu, X.; Xu, G.; Yang, Y.; Wang, J.; Jin, L.; Liu, Q.; Xiang, T. Enhancing BERT representation with context-aware embedding for aspect-based sentiment analysis. IEEE Access 2020, 8, 46868–46876. [Google Scholar] [CrossRef]
  55. Dang, N.C.; Moreno-García, M.N.; De la Prieta, F. Sentiment analysis based on deep learning: A comparative study. Electronics 2020, 9, 483. [Google Scholar] [CrossRef]
  56. Khan, I.U.; Khan, A.; Khan, W.; Su’ud, M.M.; Alam, M.M.; Subhan, F.; Asghar, M.Z. A review of Urdu sentiment analysis with multilingual perspective: A case of Urdu and roman Urdu language. Computers 2021, 11, 3. [Google Scholar] [CrossRef]
  57. Iglesias, C.A.; Moreno, A. Sentiment analysis for social media. Appl. Sci. 2019, 9, 5037. [Google Scholar] [CrossRef] [Green Version]
  58. Hasan, A.; Moin, S.; Karim, A.; Shamshirband, S. Machine learning-based sentiment analysis for twitter accounts. Math. Comput. Appl. 2018, 23, 11. [Google Scholar] [CrossRef]
  59. Araci, D. Finbert: Financial sentiment analysis with pre-trained language models. arXiv 2019, arXiv:1908.10063. [Google Scholar]
  60. Malo, P.; Sinha, A.; Korhonen, P.; Wallenius, J.; Takala, P. Good debt or bad debt: Detecting semantic orientations in economic texts. J. Assoc. Inf. Sci. Technol. 2014, 65, 782–796. [Google Scholar] [CrossRef]
  61. Huang, A.; Wang, H.; Yang, Y. FinBERT—A Deep Learning Approach to Extracting Textual Information. 2020. Available online: https://papers.ssrn.com/sol3/papers.cfm?abstract_id=3910214 (accessed on 20 August 2022).
  62. Rosenthal, S.; Farra, N.; Nakov, P. SemEval-2017 task 4: Sentiment analysis in Twitter. arXiv 2019, arXiv:1912.00741. [Google Scholar]
  63. Lukauskas, M.; Ruzgas, T. A New Clustering Method Based on the Inversion Formula. Mathematics 2022, 10, 2559. [Google Scholar] [CrossRef]
  64. Ester, M.; Kriegel, H.-P.; Sander, J.; Xu, X. A density-based algorithm for discovering clusters in large spatial databases with noise. In Proceedings of the 2nd International Conference on Knowledge Discovery and Data Mining, Portland, OR, USA, 2–4 August 1996; pp. 226–231. [Google Scholar]
  65. Zhang, T.; Ramakrishnan, R.; Livny, M. BIRCH: An efficient data clustering method for very large databases. ACM Sigmod Rec. 1996, 25, 103–114. [Google Scholar] [CrossRef]
  66. Ankerst, M.; Breunig, M.M.; Kriegel, H.-P.; Sander, J. OPTICS: Ordering points to identify the clustering structure. ACM Sigmod Rec. 1999, 28, 49–60. [Google Scholar] [CrossRef]
  67. Caliński, T.; Harabasz, J. A dendrite method for cluster analysis. Commun. Stat. Theory Methods 1974, 3, 1–27. [Google Scholar] [CrossRef]
  68. Davies, D.L.; Bouldin, D.W. A cluster separation measure. IEEE Trans. Pattern Anal. Mach. Intell. 1979, 2, 224–227. [Google Scholar] [CrossRef]
  69. Rousseeuw, P.J. Silhouettes: A graphical aid to the interpretation and validation of cluster analysis. J. Comput. Appl. Math. 1987, 20, 53–65. [Google Scholar] [CrossRef]
  70. Aruoba, S.B.; Diebold, F.X.; Scotti, C. Real-time measurement of business conditions. J. Bus. Econ. Stat. 2009, 27, 417–427. [Google Scholar] [CrossRef]
  71. Matheson, M.T. Taxing Financial Transactions: Issues and Evidence; IMF: Washington, DC, USA, 2011. [Google Scholar]
  72. Brave, S.A.; Butters, R.A.; Justiniano, A. Forecasting economic activity with mixed frequency BVARs. Int. J. Forecast. 2019, 35, 1692–1707. [Google Scholar] [CrossRef]
  73. Bai, J.; Li, K.; Lu, L. Estimation and inference of FAVAR models. J. Bus. Econ. Stat. 2016, 34, 620–641. [Google Scholar] [CrossRef]
  74. Richardson, A.; van Florenstein Mulder, T.; Vehbi, T. Nowcasting GDP using machine-learning algorithms: A real-time assessment. Int. J. Forecast. 2021, 37, 941–948. [Google Scholar] [CrossRef]
  75. Graves, A.; Mohamed, A.-r.; Hinton, G. Speech recognition with deep recurrent neural networks. In Proceedings of the 2013 IEEE International Conference on Acoustics, Speech and Signal Processing, Vancouver, BC, Canada, 26–31 May 2013; pp. 6645–6649. [Google Scholar]
  76. Hochreiter, S.; Schmidhuber, J. Long short-term memory. Neural Comput. 1997, 9, 1735–1780. [Google Scholar] [CrossRef]
  77. Chung, J.; Gulcehre, C.; Cho, K.; Bengio, Y. Empirical evaluation of gated recurrent neural networks on sequence modeling. arXiv 2014, arXiv:1412.3555. [Google Scholar]
  78. Wang, Z.; Bovik, A.C. Mean squared error: Love it or leave it? A new look at signal fidelity measures. IEEE Signal Process. Mag. 2009, 26, 98–117. [Google Scholar] [CrossRef]
  79. Willmott, C.J.; Matsuura, K. Advantages of the mean absolute error (MAE) over the root mean square error (RMSE) in assessing average model performance. Clim. Res. 2005, 30, 79–82. [Google Scholar] [CrossRef]
  80. Glantz, S.A.; Slinker, B.K. Primer of Applied Regression & Analysis of Variance, 3rd ed.; McGraw-Hill, Inc.: New York, NY, USA, 2001; Volume 654. [Google Scholar]
Figure 1. Schematic structure of the transformer’s architecture.
Mathematics 10 03461 g001
Figure 2. Basic simplified scheme of research.
Mathematics 10 03461 g002
Figure 3. Example of the news structure and data used in the research.
Mathematics 10 03461 g003
Figure 4. Monthly number of articles over time.
Mathematics 10 03461 g004
Figure 6. Graphical representation of negative sentiment analysis for the business news category using only news article titles.
Mathematics 10 03461 g006
Figure 7. Graphic representation of negative sentiment analysis for the business news category using news article titles and article lead information.
Mathematics 10 03461 g007
Table 1. Most common evaluation metrics for forecasting/regression methods.
Metric NameFormula
R2coefficient of determination R 2 = i = 1 n y i ^ y ¯ 2 i = 1 n y i y ¯ 2
R a d j 2 adjusted coefficient of determination R a d j 2 = 1 1 R 2 n 1 n k 1
MAEmean absolute error M A E = 1 n i = 1 n y i y i ^
MSEmean square error M S E = 1 n i = 1 n y i y i ^ 2
RMSErooted mean square error R M S E = i = 1 n y i y i ^ 2 n
MPEmean percentage error M P E = 100   % n i = 1 n y i y i ^ y i
MAPEmean absolute percentage error M A P E = 100   % n i = 1 n y i y i ^ y i
MASEmean absolute scaled error M A S E = 1 n i = 1 n y i y i ^ 1 n 1 i = 2 n y i 1 y i
Table 2. Different models (means and standard deviation) were compared based on the Calinski and Harabasz score and the Davies–Bouldin score for 100 runs.
Calinski and Harabasz ScoreDavies–Bouldin Score
GMM11,6485.841
BGMM13,5476.148
K-means13,3874.627
MIDE12,5425.314
Table 3. Correlation of different categories of negative sentiment with the assessed indicators of economic activity.
Title 1UNYUNACSMIYIPI
Overall sentiment0.0210.050−0.200 ***−0.009−0.013−0.012
Business sentiment0.024−0.067−0.357 ***0.0450.148 *−0.128 *
Lithuania sentiment−0.119−0.213 ***−0.137 *0.148 *0.164 **−0.087
Foreign sentiment−0.212 ***−0.259 ***−0.650 ***0.052−0.1130.068
Health sentiment−0.184 **−0.206 ***0.1140.0710.096−0.060
Science sentiment−0.139 *−0.192 **0.0140.148 *0.327 ***−0.012
Culture sentiment−0.301 ***−0.272 ***−0.300 ***−0.0390.002−0.075
*** correlation is significant at the 0.001 level; ** correlation is significant at the 0.01 level; * correlation is significant at the 0.05 level.
Publisher’s Note: MDPI stays neutral with regard to jurisdictional claims in published maps and institutional affiliations.

