1. Introduction
The COVID-19 pandemic has posed a critical challenge to the global socioeconomic system, raising questions about the levels of preparedness and potential vulnerabilities of most economies to such shocks [
1]. In particular, the pandemic forced populations to reexamine social practices and production systems otherwise considered normal up to the end of 2019. For example, before the launch of vaccination campaigns, governments enacted massive social distancing measures, including strict lockdowns, with abrupt declines in travelling, tourism, and all physical work interactions. In the United States, the pandemic seriously affected the performance of the daily routines of its population and the functioning of enterprises.
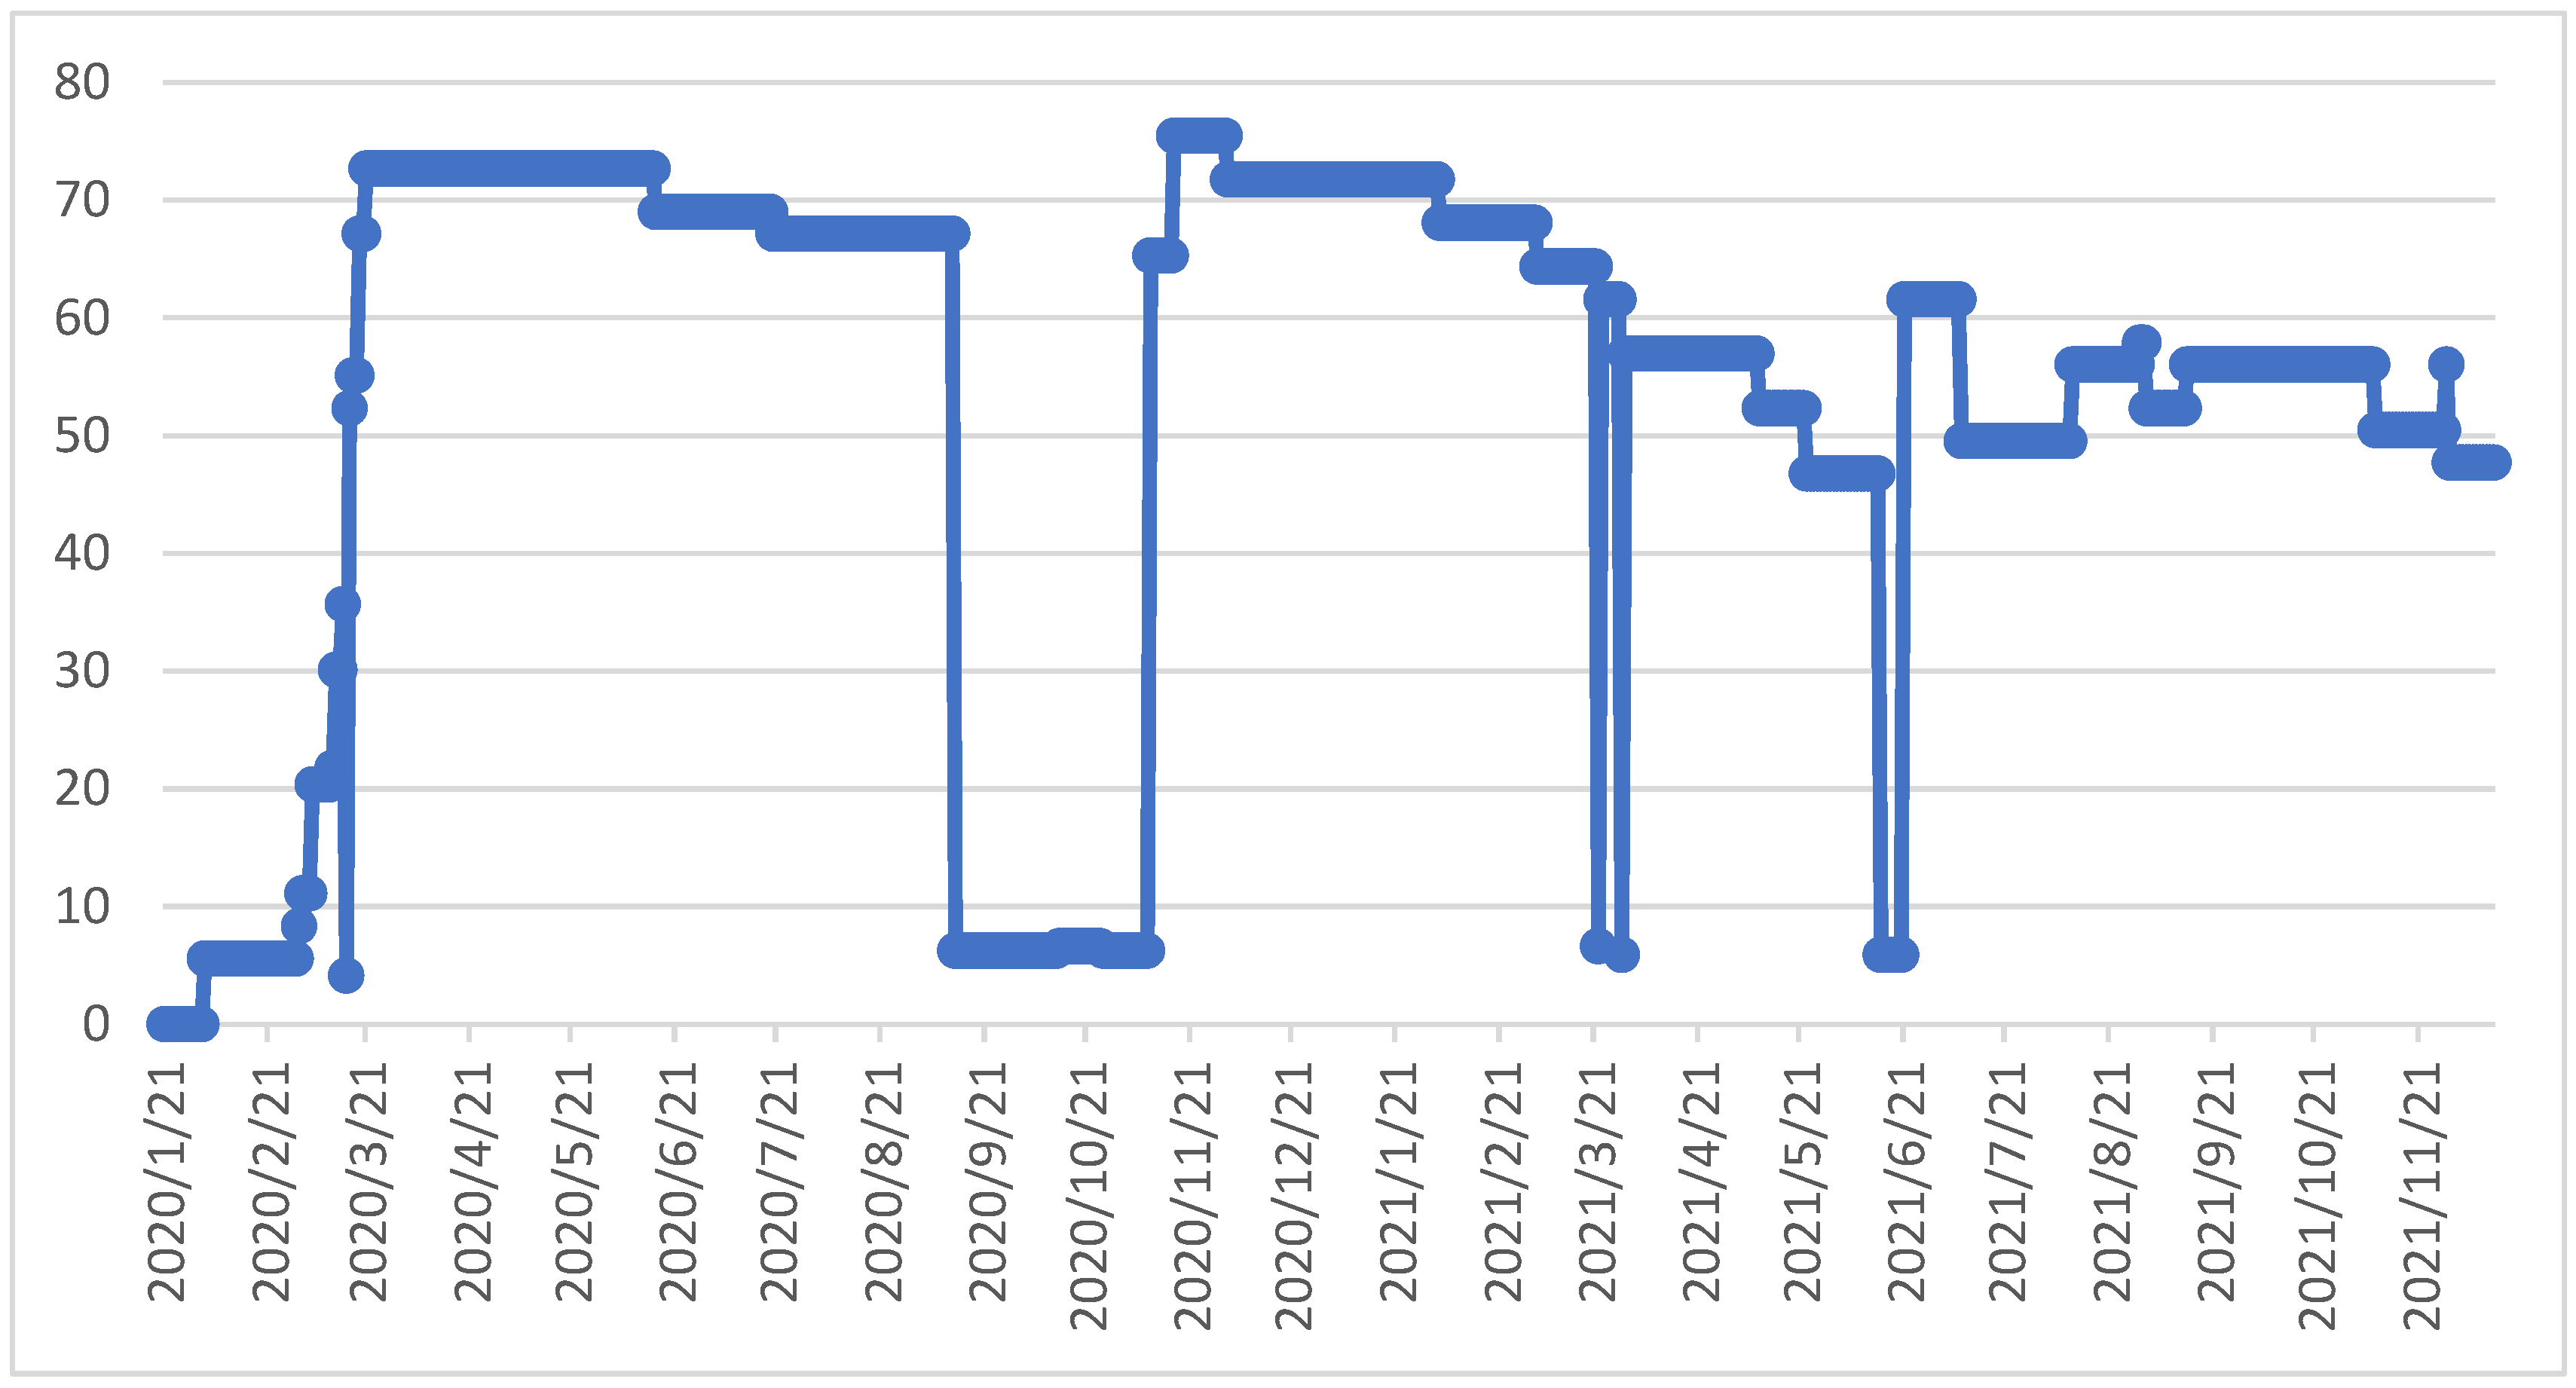
The Stringency Index published by Our World in Data, which measures the levels of closures of social and economic activity in response to the pandemic including school and office closures as well as travel bans among other measures, shows that the severity of lockdowns during 2020 in the United States was concentrated in the period from March to September of that year, while another period of strong restrictions was imposed beginning in November 2020. This degree of restrictions considerably affected the economic routines of the country. For example, as of June 2020, 66% of US respondents to Nielsen had started to work from home since the outbreak (Nielsen Total Audience Report, August 2020).
Figure 1 shows the daily evolution of the Stringency Index.
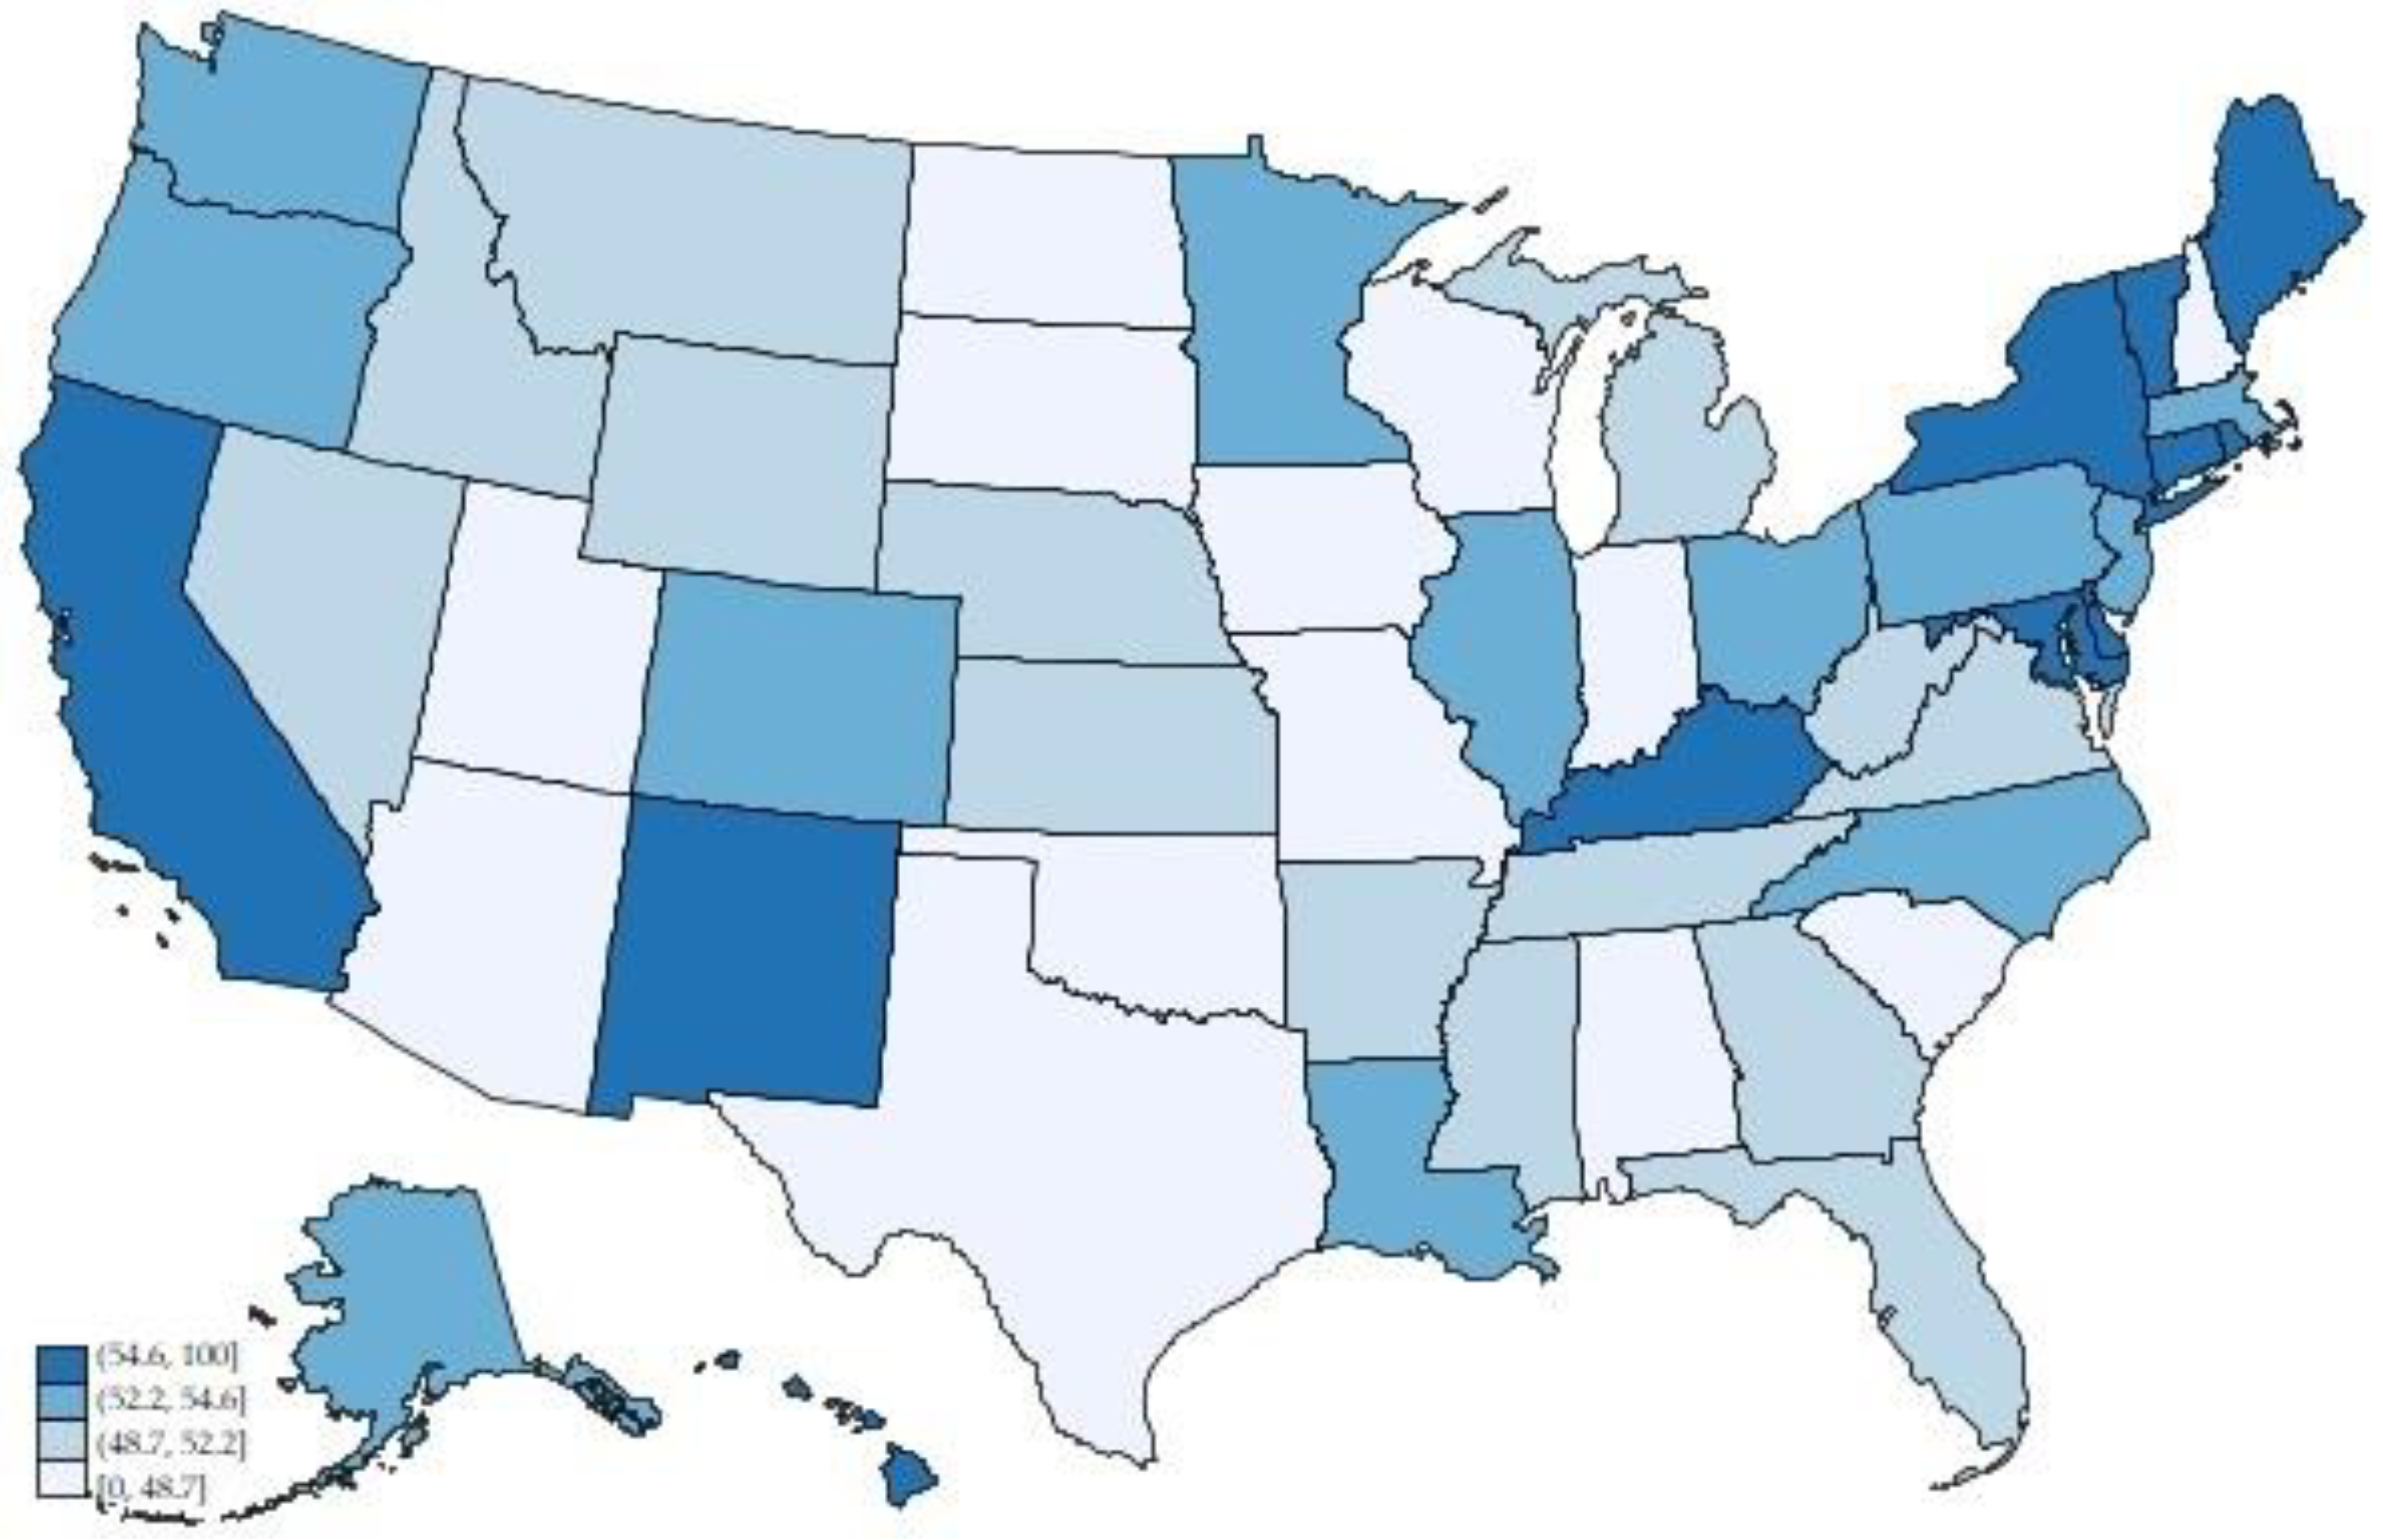
The average national Stringency Index masks important regional differences.
Figure 2 displays the index by state, indicating that the more severe lockdowns were imposed in the northeastern states, as well as Maryland, Delaware, Kentucky, New Mexico, and California.
Following the strict lockdowns carried out in 2020, strong anecdotal evidence has emerged suggesting that a robust ICT (information and communication technologies) infrastructure contributed to counteracting some of the isolation measures, allowing economic systems to continue operating at least partially. In this context, the purpose of this study is to investigate the extent to which ICT adoption (more specifically, fixed broadband networks) mitigated the negative economic impacts generated by the COVID-19 crisis in the United States. The study′s hypothesis is that beyond its economic contribution under normal conditions, broadband adoption was also essential in building resiliency against the economic disruption generated by the pandemic. In this respect, the main contribution of this paper lies in being, to the best of our knowledge, the first empirical research that studies the role of broadband in mitigating the economic losses resulting from COVID-19 within the United States.
This situation raises a new research imperative: If societies are transitioning to environments combining a mix of physical and virtual interactions, it is pertinent to assess how prepared they are to deal with the new conditions. What effect this could have on those regions that are less connected than others? Would we be accelerating unequal development trends? If this were to be the case, the experience of the COVID-19 disruption would be useful in providing some evidence to that effect. The implication from a policy standpoint would be self-evident: there is a critical need to accelerate the development of broadband infrastructure to be ready to deal with the “new normal” expected in the post-COVID world.
The next section of this study reviews the research literature on the impact of broadband on economic resilience in the context of health and other emergencies.
Section 3 details the theoretical model proposed for testing this causality under COVID-19.
Section 4 presents the dataset developed for this study along with the main descriptive statistics.
Section 5 presents and discusses the results of the econometric analysis, focused on estimating the value of broadband adoption for mitigating the economic disruption driven by the pandemic. Based on the evidence presented in
Section 5, we conclude in
Section 6 raising some policy implications.
2. Research Literature Review
2.1. Research in the Field
Research on the economic impacts of digital technologies generated in the past decades confirms, to a large extent, that ICTs and broadband in particular have an impact on economic performance [
2,
3,
4,
5,
6,
7,
8,
9,
10,
11,
12,
13,
14]. Some authors have expanded this insight to a broader definition of ICT: digitization, which measures not only infrastructure development but also its use.
Beyond the positive economic impact, broadband can also be critical in providing economic resiliency under emergency situations such as forced lockdowns. Broadband allows individuals to conduct many daily activities that previously required physical contact. Examples of this are the ability to access telehealth apps, shop online, learn through virtual tools, and work remotely. In addition to providing workers the possibility of teleworking, digitized supply chains and electronic distribution channels can substantially contribute to keep economic activity operating in situations in which face-to-face interactions with customers and suppliers must be avoided. Finally, ICT infrastructure can increase resiliency at the government level by allowing public institutions to continue operating and delivering public services (beyond the services that are less impacted by the level of digitization, e.g., public health and safety, it is straightforward to see that a highly digitized government has more capacity to continue providing public services without interruption).
While research on the contribution of ICT infrastructure to mitigate the economic impact of pandemics is limited, evidence exists about its positive effects in the context of emergencies. So far, the empirical evidence refers mainly to natural disasters, focusing on the capacity of ICTs to provide information for decision making or allow critical public services to continue operating under such circumstances [
15,
16,
17]. Other authors have studied the role of digital technologies during the COVID-19 pandemic, such as research focused on the role of digital technologies for telemedicine purposes during the pandemic [
18,
19,
20]. In addition, ref. [
21] studied the role of electronic customer relationship management (e-CRM) applications on firms′ innovation capabilities in the context of COVID-19, while [
22] argued that the COVID-19 outbreak amplified the impact of information on human behavior, as the internet was a major channel for information and social interactions while staying at home during the pandemic.
As for quantitative empirical evidence, ref. [
23] provided econometric results showing the economic losses of the 2003 SARS pandemic were not equal for every country affected. Starting with a production function, the authors introduced two different variables to capture the effect of SARS: a dummy variable to identify the countries affected by the pandemic, taking value of 1 when at least one positive case had been reported, and a continuous variable based on the number of people infected for every 100,000 inhabitants. The results indicated that: (1) Countries with more positive cases were economically affected more severely, and (2) countries with higher broadband adoption were able to counteract, to some degree, the effects of the outbreak.
Following up on their first analysis, ref. [
24] provided a subsequent analysis of broadband’s contribution to mitigating the economic disruption of COVID-19. By applying a structural econometric model to a 121-country panel, the authors concluded that economic damage was not uniform across countries: ceteris paribus, those economies endowed with better ICT infrastructure were able to achieve higher levels of mitigation. Countries reaching a threshold of 30% fixed broadband penetration, or 50% for mobile broadband penetration, exhibited a lower elasticity of economic impact from COVID-19, as the internet adoption levels in these countries allowed for an important part of the economy and society to continue functioning.
Another study that is close to our main hypothesis is that conducted by [
25] for the case of China. The author analyzed the special role of broadband to explain economic growth during the COVID-19 pandemic using data from 31 provincial districts. The results indicate that a 10% increase in broadband penetration rate resulted in a 1.87% GDP growth rate during the first 3 months of 2020 and a 1.30% GDP growth rate during the first fourth months of that year. The author concludes by suggesting that broadband alleviated the country′s economic losses during the first months of 2020 and that broadband affected China′s economic growth to a larger extent during the pandemic period than under normal circumstances.
Other studies have focused on the role of broadband in mitigating the pandemic disruption in the United States in the case of specific economic variables. For example, ref. [
26] explored the relationship between broadband and employment rates in rural US counties during the first half of 2020. Applying a two-stage least squares model, the authors found that rural fixed broadband availability and adoption appeared to be associated with a higher employment rate. Research has also focused on assessing the impacts of digital platforms (and consequently, broadband) for increasing the survival rates of small businesses. Using data from Uber Eats, an online food ordering and delivery digital service, ref. [
27] determined that the platform was critical in driving an increase in total restaurant activity and orders following the closure of the dine-in channel. In turn, ref. [
28] estimated the factors influencing changes in unemployment rates for southeastern states during the initial months of the pandemic. They found that the ability to telework was a crucial factor in changing unemployment levels, with local broadband adoption influencing this relationship. They conclude that telework had a positive impact for regions with a high broadband adoption rate in the initial months of the pandemic.
2.2. The Opinions of the Experts
The evidence on the positive contribution of broadband in the context of pandemics generated by empirical research coincides with the insights of industry and government policy makers. The International Telecommunications Union recently organized a series of Economic Experts Roundtables to discuss the socioeconomic and regulatory challenges that emerged from the COVID-19 pandemic and the key role of digital infrastructures under such circumstances [
29].
The participant experts offered insights on the positive role of broadband for building economic resiliency in the pandemic situation. Their perspectives were based on prior studies on broadband economic impact, on digital use case impact research, and on descriptive analyses of the impact on telecommuting and online learning. While generally agreeing on broadband overall positive contribution, some experts stated divergent views regarding the impact of digital resilience at the firm level depending on economic size. While one group of experts argued that large corporations have well-established digital solutions in place to rapidly become more resilient, another group considered that small and medium enterprises are the firms that can move online more quickly and easily adapt to the new environment.
All experts agreed that the degree of resiliency is highly dependent on the sector. The roundtable participants argued that as businesses, public sector bodies and ICT providers looked to address the challenging environment, many industries accelerated digitalization and automation. This happened even in industries that were lagging in their digitization before the pandemic, e.g., the health care sector, which was slow to adopt Internet-of-Things (IoT) solutions. According to some of the experts, supply chains in advanced economies have actually adjusted remarkably quickly to the challenges of COVID-19. On the other hand, they argued that low digitization sectors, such as construction, are expected to be hard hit by the pandemic. In any case, despite the nuances, the experts concurred around the key role of digital infrastructures for economic resiliency in the pandemic.
All in all, considering the evidence presented above, we should expect that more connected regions will exhibit higher economic resiliency in the case of a pandemic disruption. This will be explored through an econometric approach for the case of the United States.
3. Theoretical Model
The empirical model is based on an augmented Solow framework [
30], where economies produce according to a Cobb–Douglas production function (this model was used in a previous study to assess the impact of broadband on economic performance for a sample of Brazilian states [
31]):
where
GDP represents gross domestic product,
K is the non-telecom physical capital stock,
L is labor and
HK denotes human capital, approximated as
, where
HK reflects the efficiency of a unit of labor, as in [
32]. Subscripts
i and
t denote, respectively, states and time periods (the model will be estimated for period 2016–2020). The term
A represents total factor productivity (TFP), which reflects differences in production efficiency across states of the country over time. TFP is expressed as:
Accordingly, TFP depends on state-specific characteristics represented by fixed effect
, a term reflecting time invariant idiosyncratic productivity effects, which may make some US states more productive per se because of unobserved characteristics (we decided to design the model with fixed effects rather than random effects as the conducted Hausman tests suggested so). As it is supposed that internet connectivity contributes to increase productivity,
A is assumed to depend positively on the level of broadband adoption, denoted by
BB. Thus, we expect a positive value for
Φ indicating the economic gains derived from broadband. Another important aspect that could shape the impact of broadband on state-level productivity is the existence of differences in the quality of connections. To approximate quality, following [
9,
33], the measure we use is the download speed of connections within each state. The moderating effect of the quality of connections in a state is hypothesized to be positive, i.e.,
δ > 0. This means that for two US states with the same broadband penetration, we expect to observe a larger economic impact for those with faster speeds. Inserting Equation (2) into (1), we obtain:
Applying logarithms for linearization, and after some rearrangements, we get:
where
is a state-level fixed effect. Thus, we understand that the evolution of
GDP depends on specific unobserved state characteristics, on physical capital stock, on labor, on broadband adoption and on the speed of the connections. This model is appropriate for considering the effect of broadband on
GDP under normal circumstances, but it is still incomplete in accounting for the role of this technology in mitigating economic losses in the COVID-19 context. Thus, the pandemic should be considered an external shock, not successfully absorbed by the capital or labor evolution, and therefore requiring a specific variable to account for it. Therefore, to consider the incidence of the COVID-19 on economic output, we add on the right-hand side indicators to account for the degree of propagation of the disease, with the assumption that the more the pandemic has propagated and the stricter the isolation measures to combat it, the greater the expected economic damage. To account for the role of broadband in counteracting the economic effects generated by the pandemic, we add interaction variables between broadband connectivity and the COVID-19-related indicators. As a result, by introducing the COVID-19-related indicators (denoted generically as
COVID) and the interaction variables, the transformed equation is:
In this equation, we expect the parameter associated with COVID-19 to present a negative sign given that the greater the incidence of the disease, the worse the economic outcome; in that case, then ɲ < 0. As for broadband, its economic effect under “normal circumstances” is absorbed by the parameters Φ and δ, while its effect in mitigating the pandemic crisis is captured by ζ.
In order to correctly interpret the signs of ɲ and
ζ, it is useful to differentiate Equation (3) with respect to the COVID-19 variable:
As long as , an increase in the COVID-19 propagation will generate a contraction of the GDP. However, we also expect that the more connected US states will be better prepared to mitigate part of the economic damage and thus experience smaller economic contractions. Because of this, the signs expected for both coefficients are the following: ɲ < 0 and ζ > 0, with as the mitigating role of broadband should be partial, not total. The econometric analysis conducted will aim to identify if the parameters behave as expected above.
To control for potential endogeneity between GDP and the broadband variable, Equation (3) will be estimated in the context of a structural multi-equation model, in keeping with previous authors [
7,
34,
35].
Following [
7], a 4-Equations model will be considered, as depicted in
Table 1.
The aggregate production function is the same as that presented in Equation (3). The demand equation endogenizes broadband penetration, stating that it is a function of income (GDP per capita), the price of the service, education level (HK), and the percentage of the population that lives in densely populated areas (URBAN). The supply equation links the industry output with prices and a measure of the number of fixed providers in a market (number of operators for every 100,000 inhabitants). In our case, we proxy sectoral output with revenue rather than investment as in [
7]. The reason is that there is not a reliable state-level broadband CAPEX series estimate for the US covering the considered period. Finally, the infrastructure production equation states that the annual change in broadband penetration is a function of industry revenue. Ref. [
7] also adds R&D intensity and local loop unbundling as determinants in the demand and supply equations, respectively. However, we understand that these regressors are suitable for explaining demand and supply patterns in a cross-country context, but not for regional analysis as ours, as R&D is not necessarily a suitable indicator of regional disparities and regulation is uniform within the country. The three supplementary equations (demand, supply, and infrastructure production) fulfill the roll of endogenizing broadband since these three equations involve both the demand and supply of telecom infrastructure [
7,
34]. All equations include state-level fixed effects, and the empirical approach followed is three-stage least squares (3SLS) simultaneous equation estimation.
4. Descriptive Statistics
Table 2 provides the descriptions and sources of the model variables. State-level economic variables are extracted from the US Bureau of Economic Analysis database, while broadband penetration comes from Federal Communications Commission Internet Access Services reports and the American Community Survey. Internet advertised speeds are collected from the Technology Policy Institute dataset.
To account for COVID-19 propagation, we rely on two main variables. We identify two channels through which the virus can lead to changes in production and consumption routines and thus generate a negative economic effect. We first consider an indicator of the number of deaths attributed to the disease for every 100,000 inhabitants based on data provided by the U.S. Center for Disease Control and Prevention. These data indicate important differences by state, ranging from 22.5 (Vermont) to 205 (New Jersey) in 2020. This metric should be more reliable than the infections ratio (more prone to reflect differences by state in terms of testing strategies), although there is still the risk of some misreporting of deaths if officially recorded. The second variable specifically captures the normative channel, linked to the restrictions imposed in terms of home confinement and the closure of offices, shops, and schools, among others. This is measured as the average Stringency Index during 2020. Policy responses have varied significantly by state, from the strictest (New Mexico) to the lightest (South Dakota). Naturally, as the model will be estimated for a 2016–2020 panel, the COVID variables will take a value of zero for years before 2020 as there were no COVID deaths or lockdown restrictions imposed. Adding other policy-related variables, such as the share of vaccinated population, is not possible as our data set extends only through the end of 2020, when vaccines were not yet available (the first vaccine in the US was administered in mid-December of that year).
Next, we report in
Table 3 the main descriptive statistics and correlations. For brevity, we report only these indicators for the variables in the primary equation of the system (aggregate production equation), although the statistics for the complete set of variables is available upon request. The main economic variables exhibit an important variation across states, in part because of size differences. In addition, average broadband penetration is 60% of the population. The joint skewness and kurtosis test for normality rejects the null hypothesis in all cases, indicating that the variables are skewed or with non-normal kurtosis, although in the case of the broadband variable, it does so at only 10% significance. Moreover, the Jarque–Bera test indicates that broadband is the only variable in the set that follows a normal distribution, as the null hypothesis is not rejected in that case. In any case, the lack of normality should not be a concern as it was faced in previous research with similar characteristics (see for instance [
36] or [
37]).
For the correlations, as expected K and L are highly correlated. The lack of correlation between COVID measures and the main economic variables suggests that the former should be considered exogenous shocks unrelated to the latter. Naturally, the two COVID-19 correlate highly (0.895). In order to prevent any potential multicollinearity problems, we conduct VIF tests and perform additional checks in
Section 5. No multicollinearity concerns should arise from the remaining variables.
5. Estimation Results
In this section, we present the econometric estimates for the model presented in
Section 3. We gradually consider the COVID-related variables presented in
Table 2 and their interactions with broadband in order to see how GDP is affected in each case. The results highlighted below are consistent in suggesting negative economic effects of increases in both pandemic deaths and the Stringency Index, while at the same time, they highlight the role of broadband in counteracting that economic damage.
Table 4 summarizes the econometric results for the structural model. In all estimates, all equations present excellent fit (R-squared rounding 0.90 or above), except for the broadband infrastructure production equation, where the R-squared was 0.36. In column (i), we present a baseline model without including the COVID-19-related variables, with results showing the expected coefficients and signs. GDP depends on capital and labor, while human capital is found to be not significant. In addition, broadband has a positive effect on GDP, which increases with the availability of high-speed connections (speed is introduced as a dummy variable taking the value of 1 if the average maximum download speed is above 850 Mbps and 0 otherwise). Considering potential multicollinearity problems, we conducted VIF tests and subsequently performed checks in the main equation by removing some of the highly correlated regressors, with results still verifying a non-significant coefficient for human capital and a positive and significant effect from broadband on GDP (these additional checks are available upon request). This suggests that multicollinearity should not be a concern for the purpose of this study. In column (ii), the estimate introduces both pandemic deaths and Stringency Index as regressors, without interacting them with broadband. The coefficient estimate of pandemic deaths is interpreted as the percentage of GDP variation after an increase in one unit in the quantity of COVID-19 deaths per 100,000 population. As expected, pandemic deaths have a negative and significant coefficient, highlighting the damage caused by the pandemic to the economy. This means that an increase in one death per 100,000 population is associated with a GDP contraction of −0.01%. In turn, the coefficient of the Stringency Index is interpreted as the percentage change in GDP after an increase in one unit in the tightness of the restrictions. The Stringency Index also exhibits a negative and significant coefficient (at 10% level). This means that, as expected, the stricter the lockdowns, the worse the economic performance. In column (iii), we add the interaction between pandemic deaths and broadband. The interaction variable is positive and highly significant, thereby confirming our hypothesis that robust fixed broadband connectivity helped to mitigate economic damage during the first year of the pandemic in the United States. Note that in column (iii), the Stringency variable loses significance. This is because it is highly correlated with the pandemic deaths variable (as seen in
Table 3), with the latter effectively capturing the economic effects from the pandemic (as this is another potential source of multicollinearity, we replicated the estimates considering a single COVID-19 variable at a time and discarding the other one, with results standing unchanged). In short, results from column (iii) indicate that an increase in pandemic deaths negatively affects economic performance but that the economic contraction is mitigated through high connectivity levels. This means that for two states facing similar death rates, we expect, ceteris paribus, that the better-connected state will experience less economic damage due its ability to keep the economy running as a result of higher broadband adoption. Next, in column (iv), we consider the Stringency Index as the only interaction with broadband. Again, the role of broadband is crucial in mitigating the economic damage, as the interaction variable presents a positive and significant coefficient. In this case, the deaths variable loses significance, as the Stringency Index captures most of the economic effects from the pandemic.
The previous estimates consider a baseline specification for the secondary equations, as represented in
Table 1 above. However, the pandemic may have also impacted some of the terms of those equations. In particular, broadband demand may have also been influenced by the pandemic. Neglecting that possibility may have resulted in a biased estimate of broadband through the demand equation, affecting the results of the system. To check that concern, we replicate the previous estimates by incorporating the COVID-19-related variables as determinants of broadband demand. The results, presented in columns (v) and (vi), show a non-significant effect from both COVID variables in the demand equation, with no substantial changes arising in the main equation.
From all the estimates reported in
Table 4, it seems clear that the pandemic-deaths and the Stringency Index present overlapping information, as one loses significance every time we interact the other one with broadband. As a result, we will select only one of both COVID-variables to pursue the analysis. We believe that the Stringency Index is more suitable for explaining the virus impact because it measures aspects that directly affect the daily economic activity (in terms of imposed restrictions), in contrast with the death’s variable, which can be interpreted as having an indirect role. In other words, it is not the deaths per se that drive the economic recession: it is the lockdown decisions made as prophylactic measures. Therefore, we continue our analysis relying on the estimated coefficients from the specification presented in column (vi):
ɲ = −0.0041 and
ζ = 0.0009.
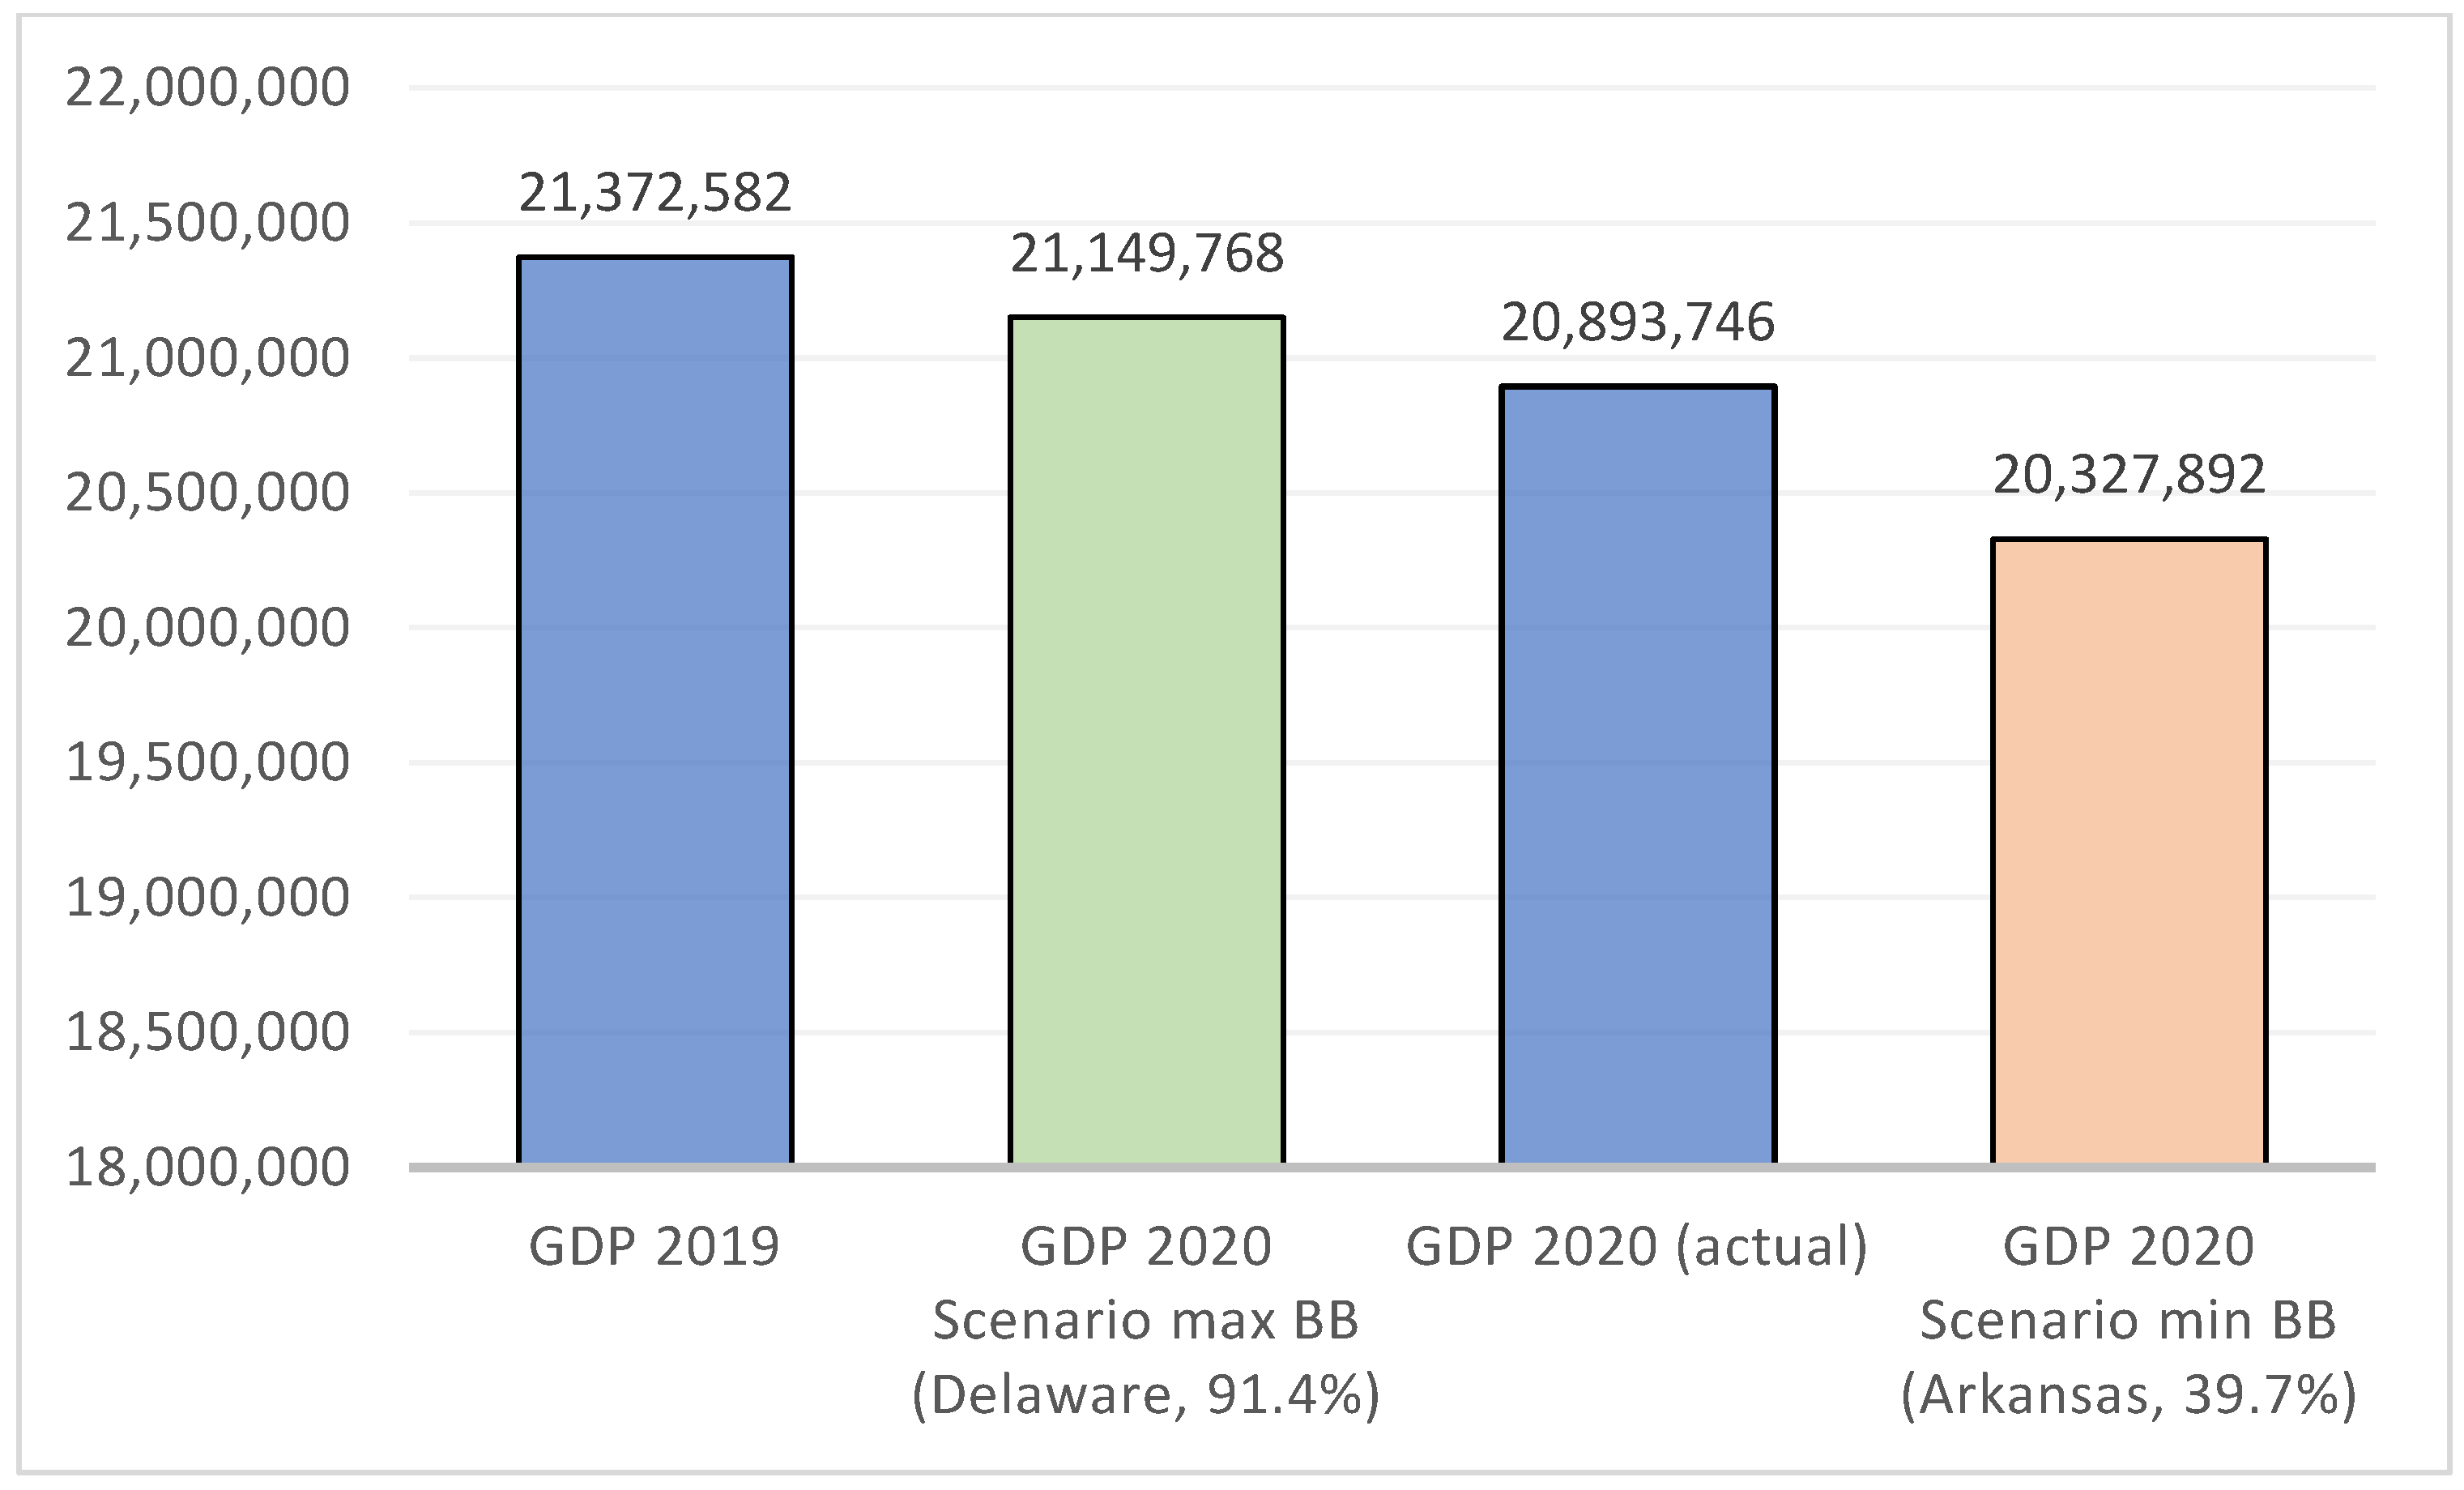
With the estimated coefficients, we can calculate the 2020 growth rate attributed exclusively to the restrictions imposed, which depends on the level of penetration, as seen above in Equation (4). With this information, we can simulate the GDP for 2020 according to two different scenarios of broadband penetration: that of the state with the highest broadband adoption (Delaware, 91.4%) and that with the lowest broadband adoption (Arkansas, 39.7%). Results are presented in
Figure 3 next to the actual values for 2019 and 2020 GDP.
On a national level, if the United States broadband adoption was that of Delaware (rather than the actual 2020 value of 70.5%), the GDP would have contracted only by 1% in 2020, a much lighter recession than the actual 2.2% contraction. Conversely, had broadband been below current levels, the GDP contraction would have been much more severe.
Next, we calculate the elasticity of GDP with respect to lockdown intensity as a function of the Stringency Index and broadband penetration. The elasticity to be estimated must be interpreted as how much the GDP contracts if state governments decided to tighten restrictions by 1%. By applying the estimated coefficients to Equation (4), we can derive an estimate of the elasticity between lockdown intensity and GDP:
The elasticity level in this equation depends on both broadband penetration and the Stringency Index. Using the average lockdown intensity and the national-level broadband penetration in 2020, we estimate a national elasticity of −0.014. This means that an increase in the strictness of the restrictions by 1% above 2020 levels will result in a GDP contraction of 0.014%.
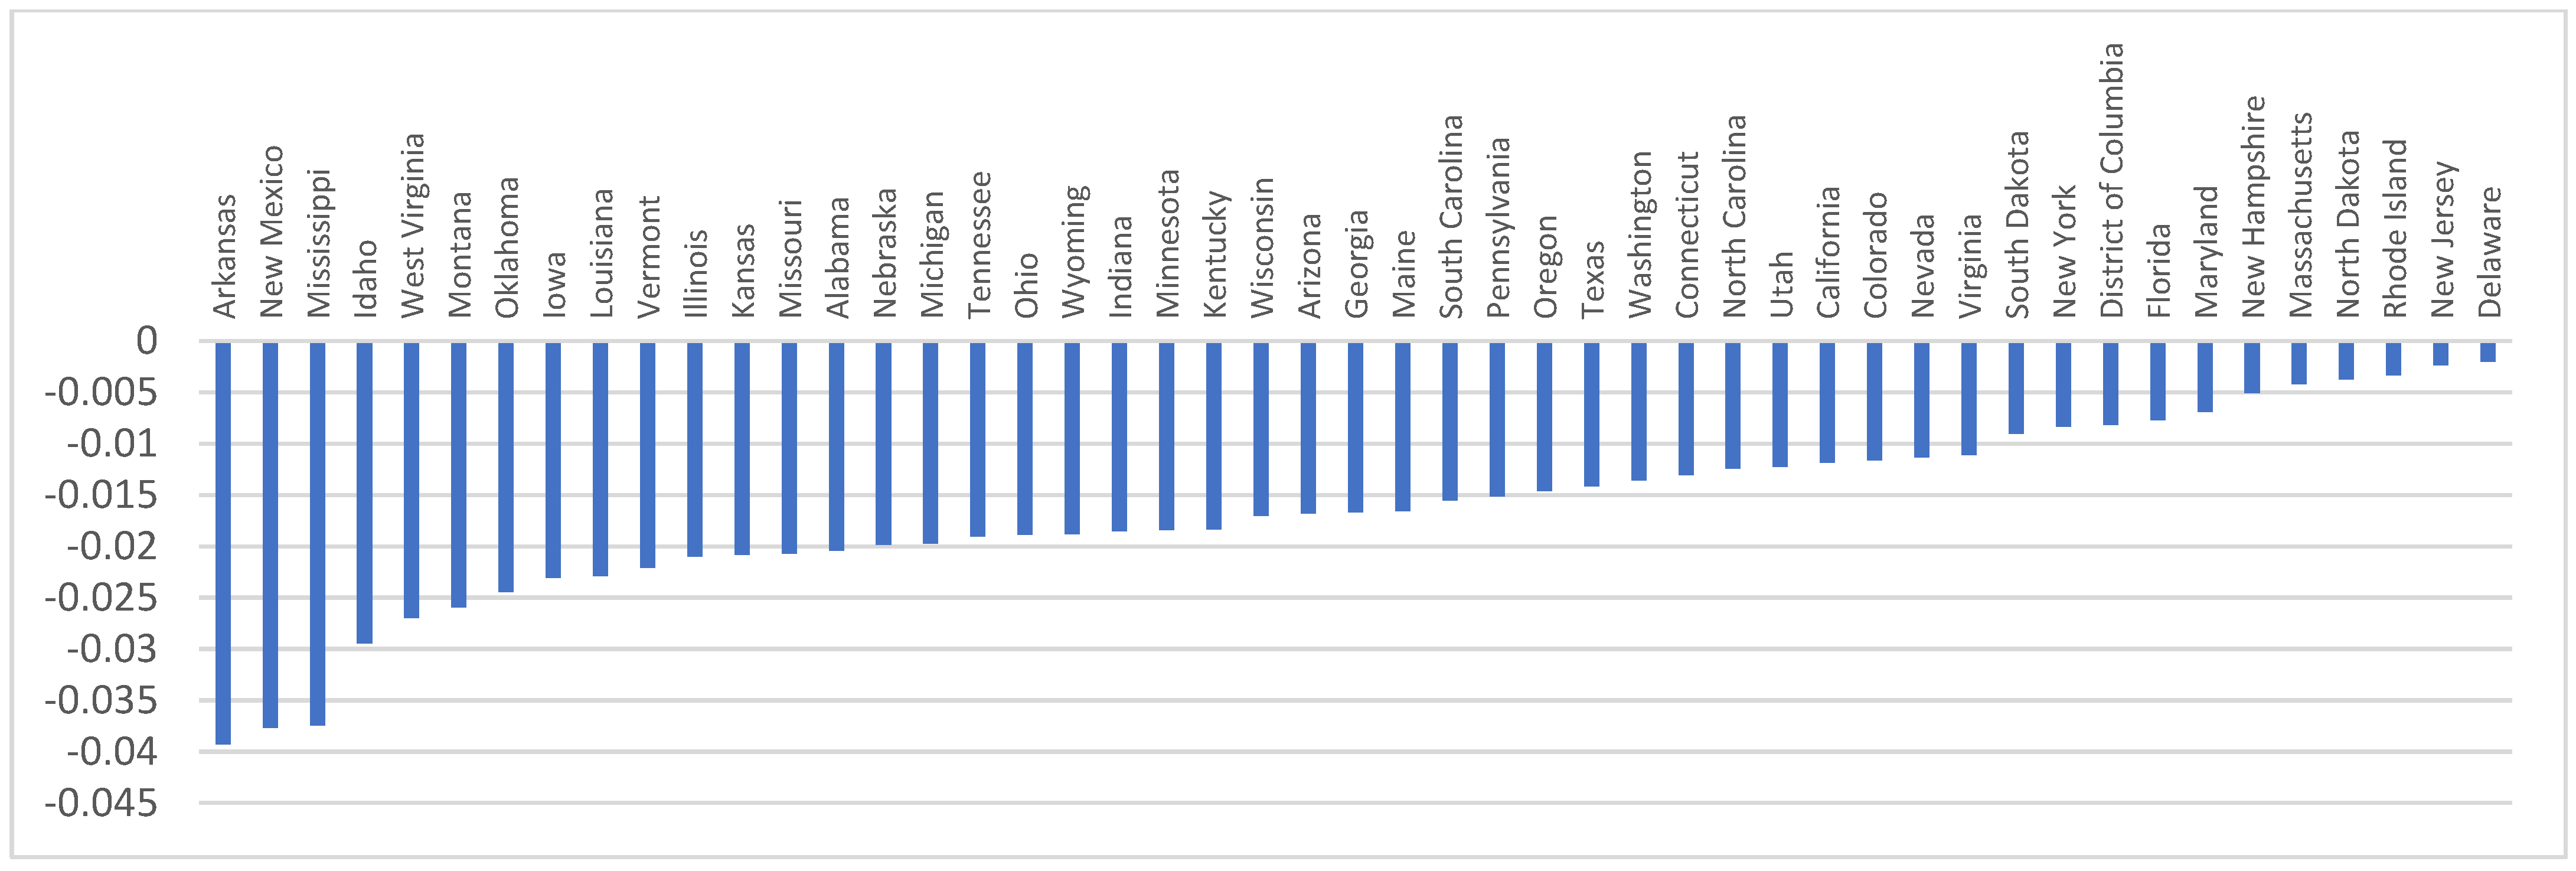
Figure 4 presents the elasticity calculations by state, using in each case their respective Stringency Index and broadband penetration. This elasticity can be thought of as a measure of how much a state’s GDP was negatively affected by an increase in the Stringency Index. The largest elasticity (in absolute terms) is that of Arkansas, where an increase in 1% in the Stringency Index reduces GDP by 0.039%. On the other end of the distribution, the states that are less sensitive to lockdown intensity are those in the Northeast (Delaware, New Jersey, Rhode Island), partially because of having greater broadband adoption.
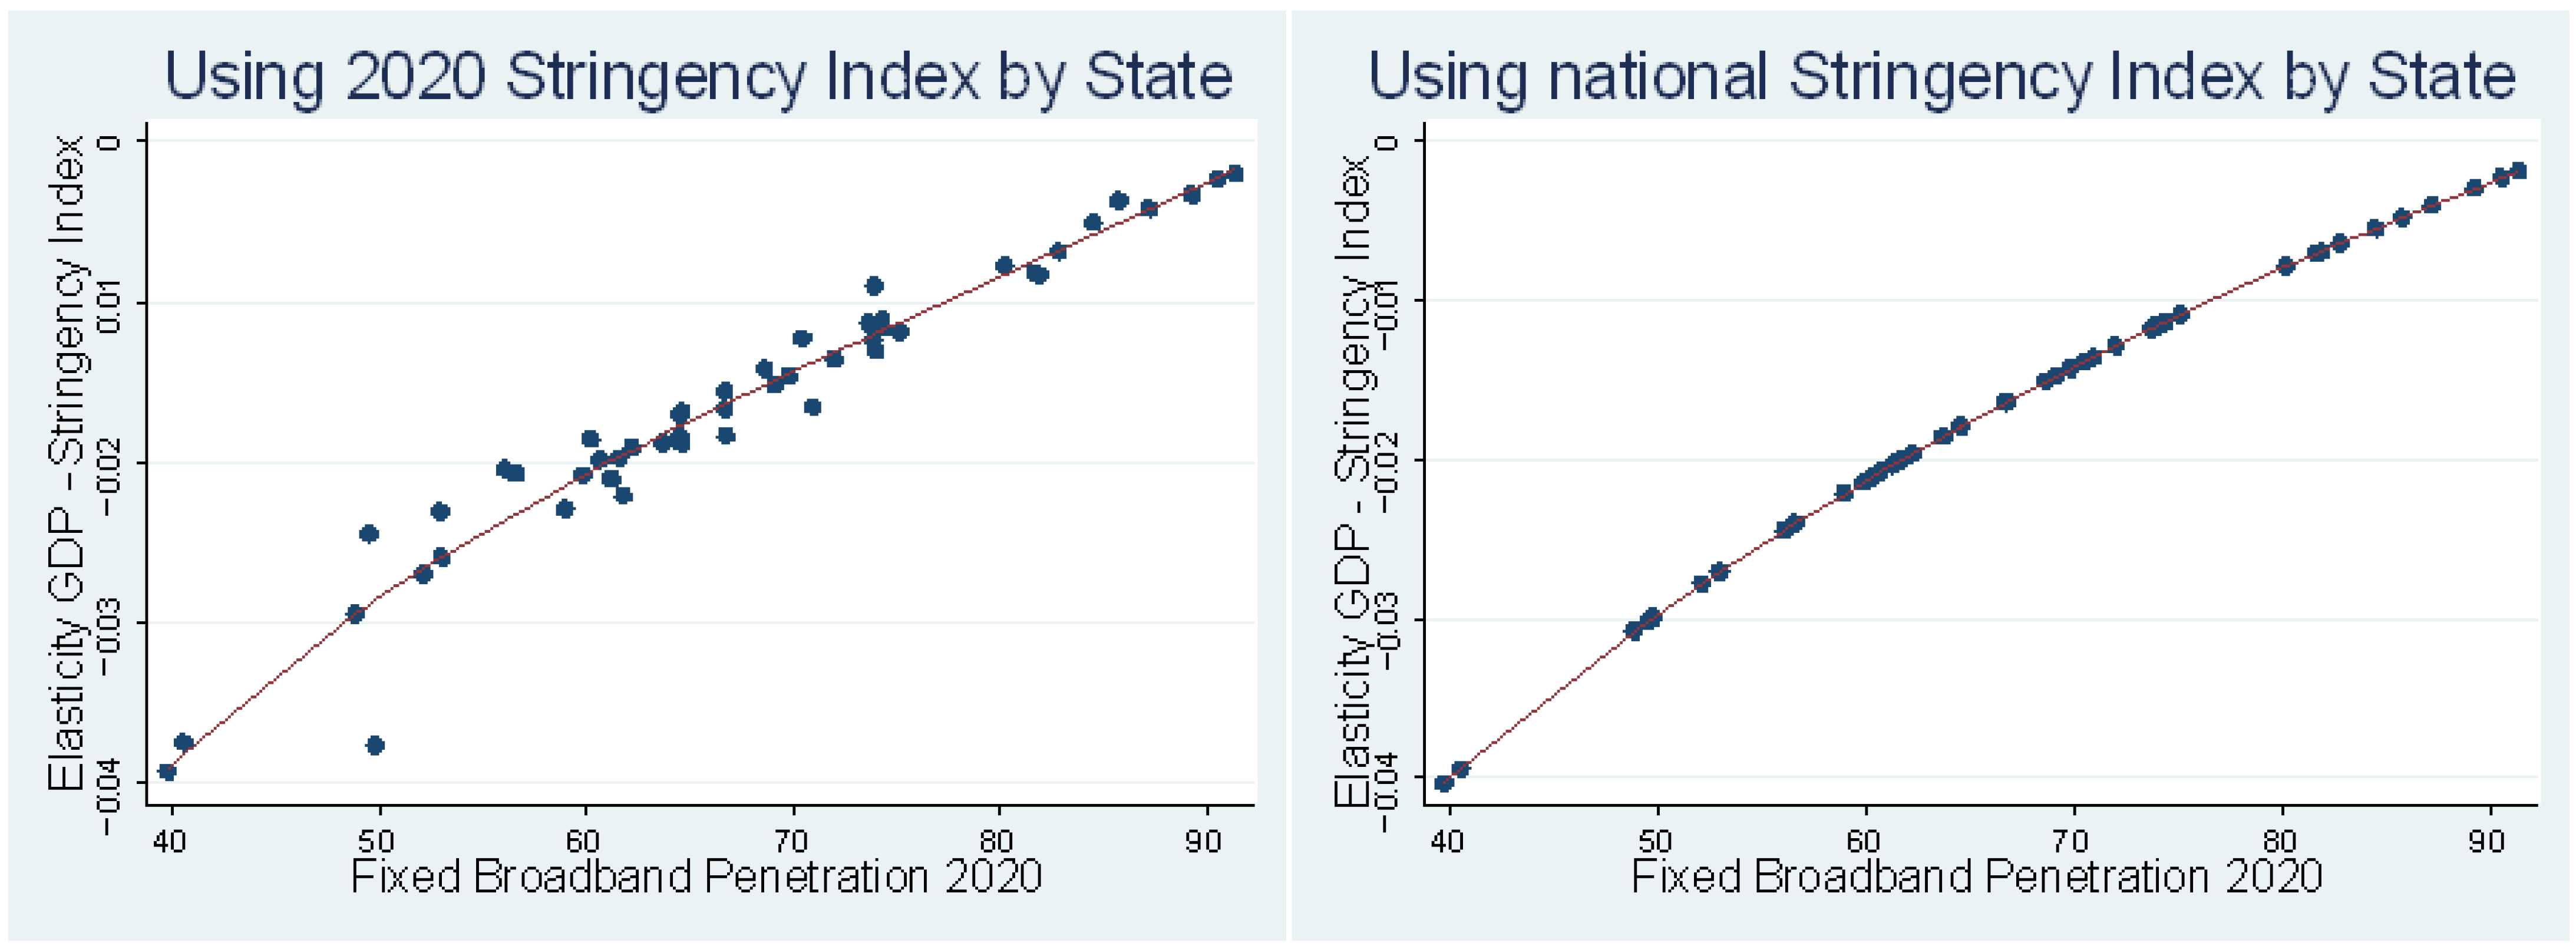
In
Figure 5, we plot the elasticities by state against fixed broadband penetration levels. In the panel on the left, the elasticity calculation is plotted against the actual (real) 2020 Stringency Index by state. In the panel on the right, we replicate the calculation but leave constant the Stringency Index across states (using the national average) to isolate the specific differences in elasticity attributed to broadband penetration levels. This indicates that in states with higher broadband penetration, less economic damage occurs as a result of increasing lockdown intensity above 2020 levels.
6. Conclusions
The COVID-19 pandemic has raised a fundamental challenge to the global socioeconomic system, forcing countries to reexamine social practices and production systems and generating a severe global economic recession. This study has researched the extent to which fixed broadband networks mitigated the negative economic impact generated by the pandemic in the United States.
The results support the position that US states, such as Delaware and New Jersey, with higher broadband adoption were able to counteract a larger portion of the economic losses caused by the 2020 COVID-19 pandemic than states with lower broadband adoption. The connectivity levels allowed for important parts of the economy to continue functioning during lockdowns. At the national level, if the United States broadband penetration figures were those of the more connected states, the GDP would have contracted only 1% in 2020 because of the virus, a much softer recession than the actual 2.2%.
In conclusion, the pandemic highlighted the critical need to close the digital divide and to ensure universal adoption of high-quality internet connections in the United States. Today, wide penetration rate disparities exist between states, such as Delaware’s rate of 91.4% compared with Arkansas′s rate of 39.7%. Because of this, public authorities should focus on creating policy frameworks that allow operators to spur infrastructure deployment and to find the optimal technological mixes to deliver the highest performance to users.


