
Proposing a High-Precision Petroleum Pipeline Monitoring System for Identifying the Type and Amount of Oil Products Using Extraction of Frequency Characteristics and a MLP Neural Network

 , ,
, ,  and
and
Abstract
:1. Introduction
- Examining the received signals in the frequency domain and extracting appropriate characteristics.
- The use of a detector in the structure of the control system.
- The use of only one neural network to determine volume rates, which is due to the extraction of appropriate characteristics. This is despite the fact that in previous researches, researchers implemented separate neural networks according to the number of output parameters, which increases the cost of calculations.
- Increasing accuracy in determining volume rates.
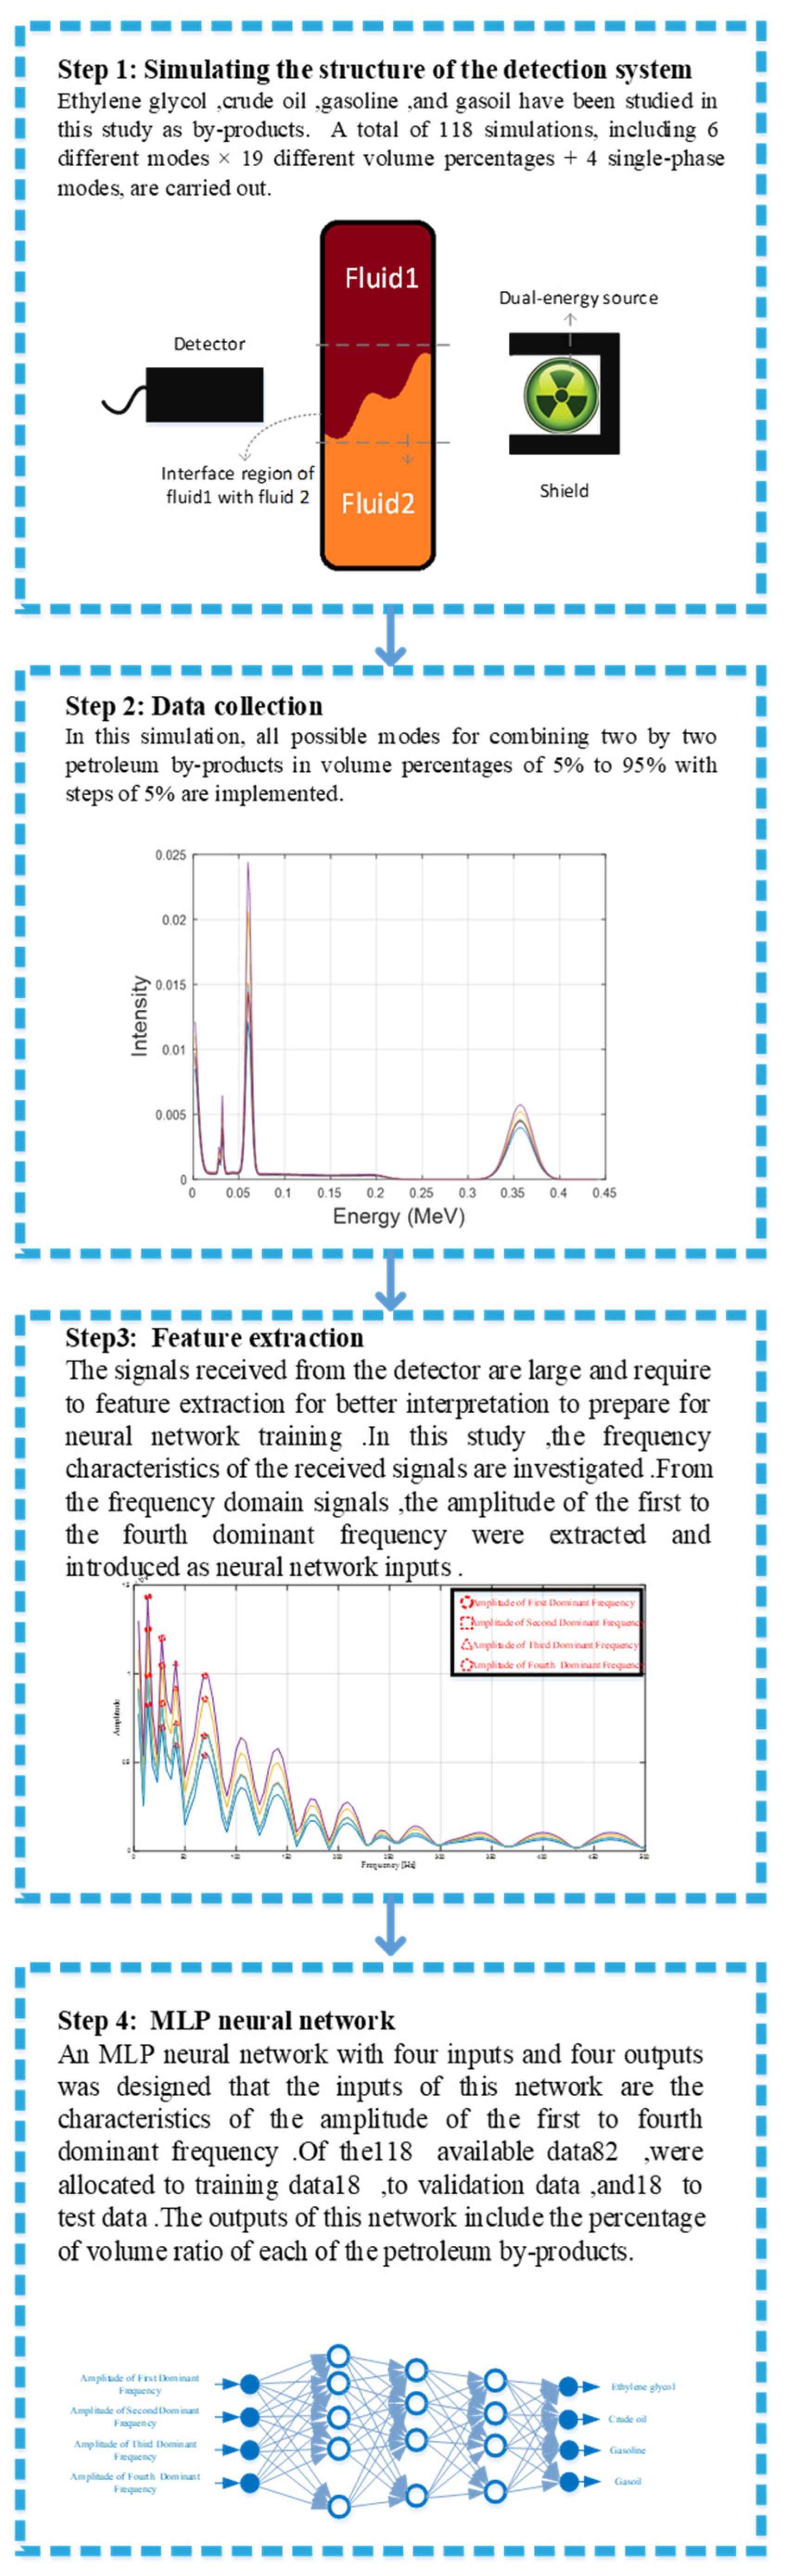
2. Simulation Setup
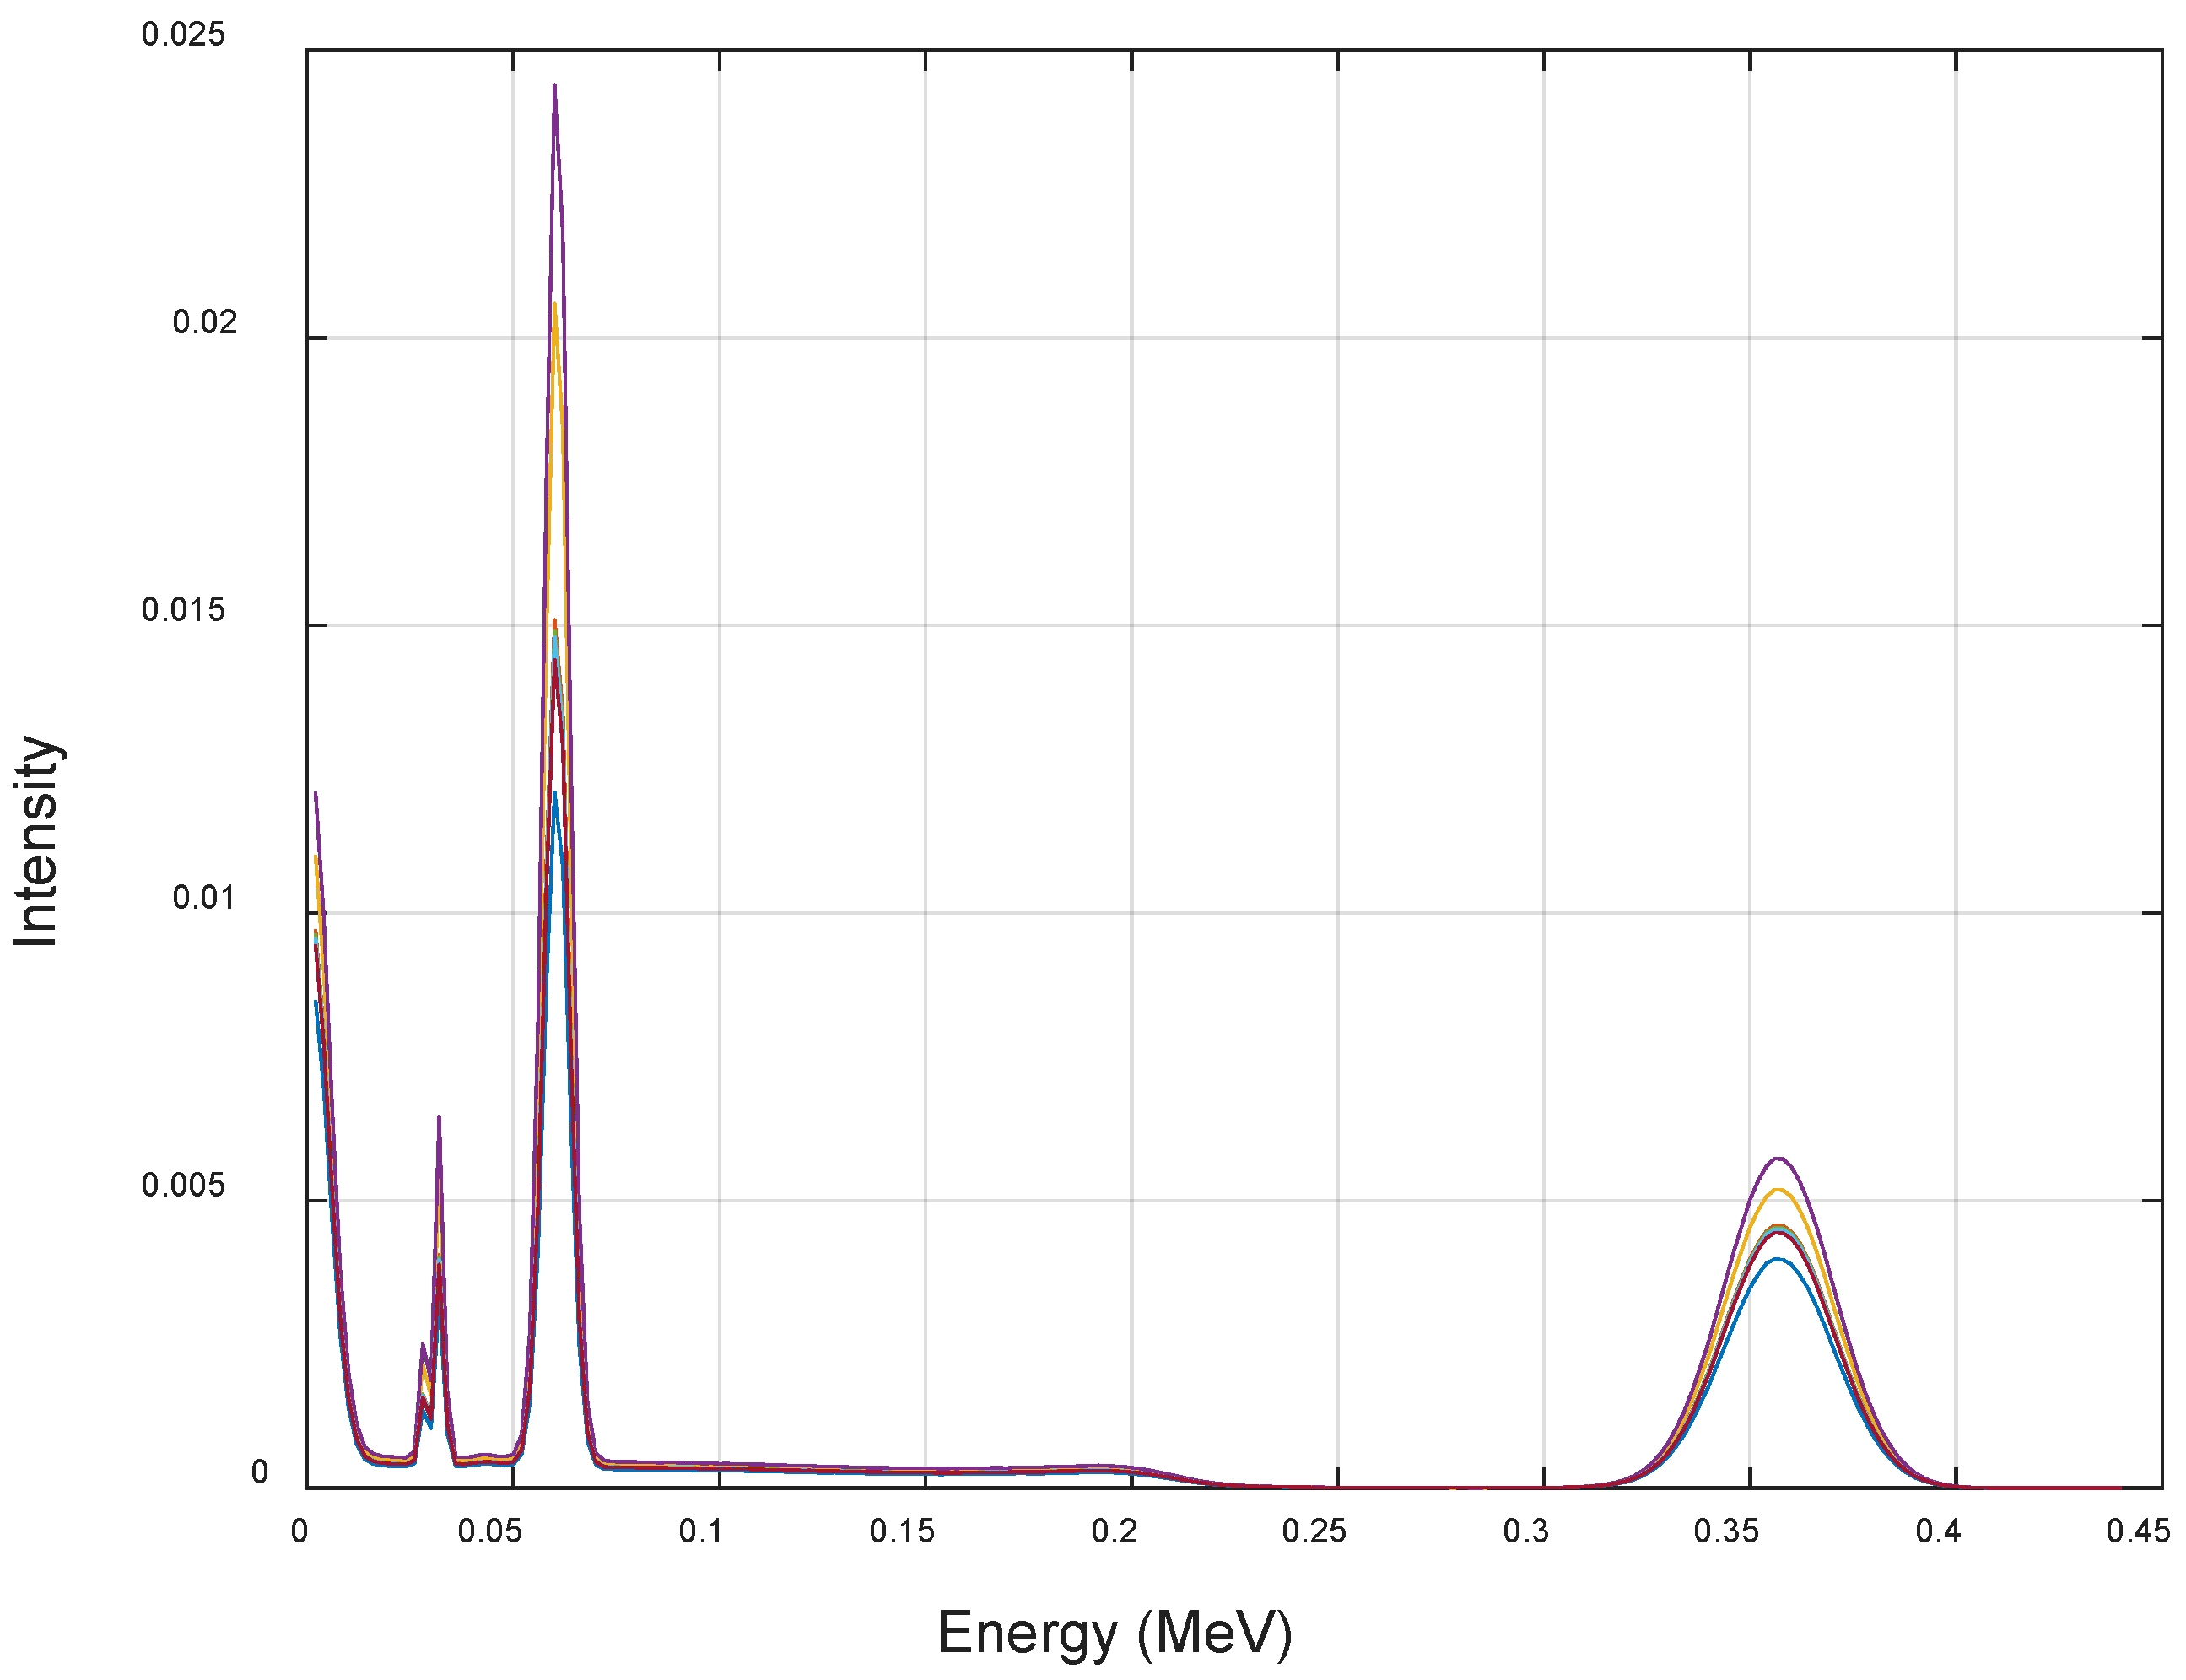
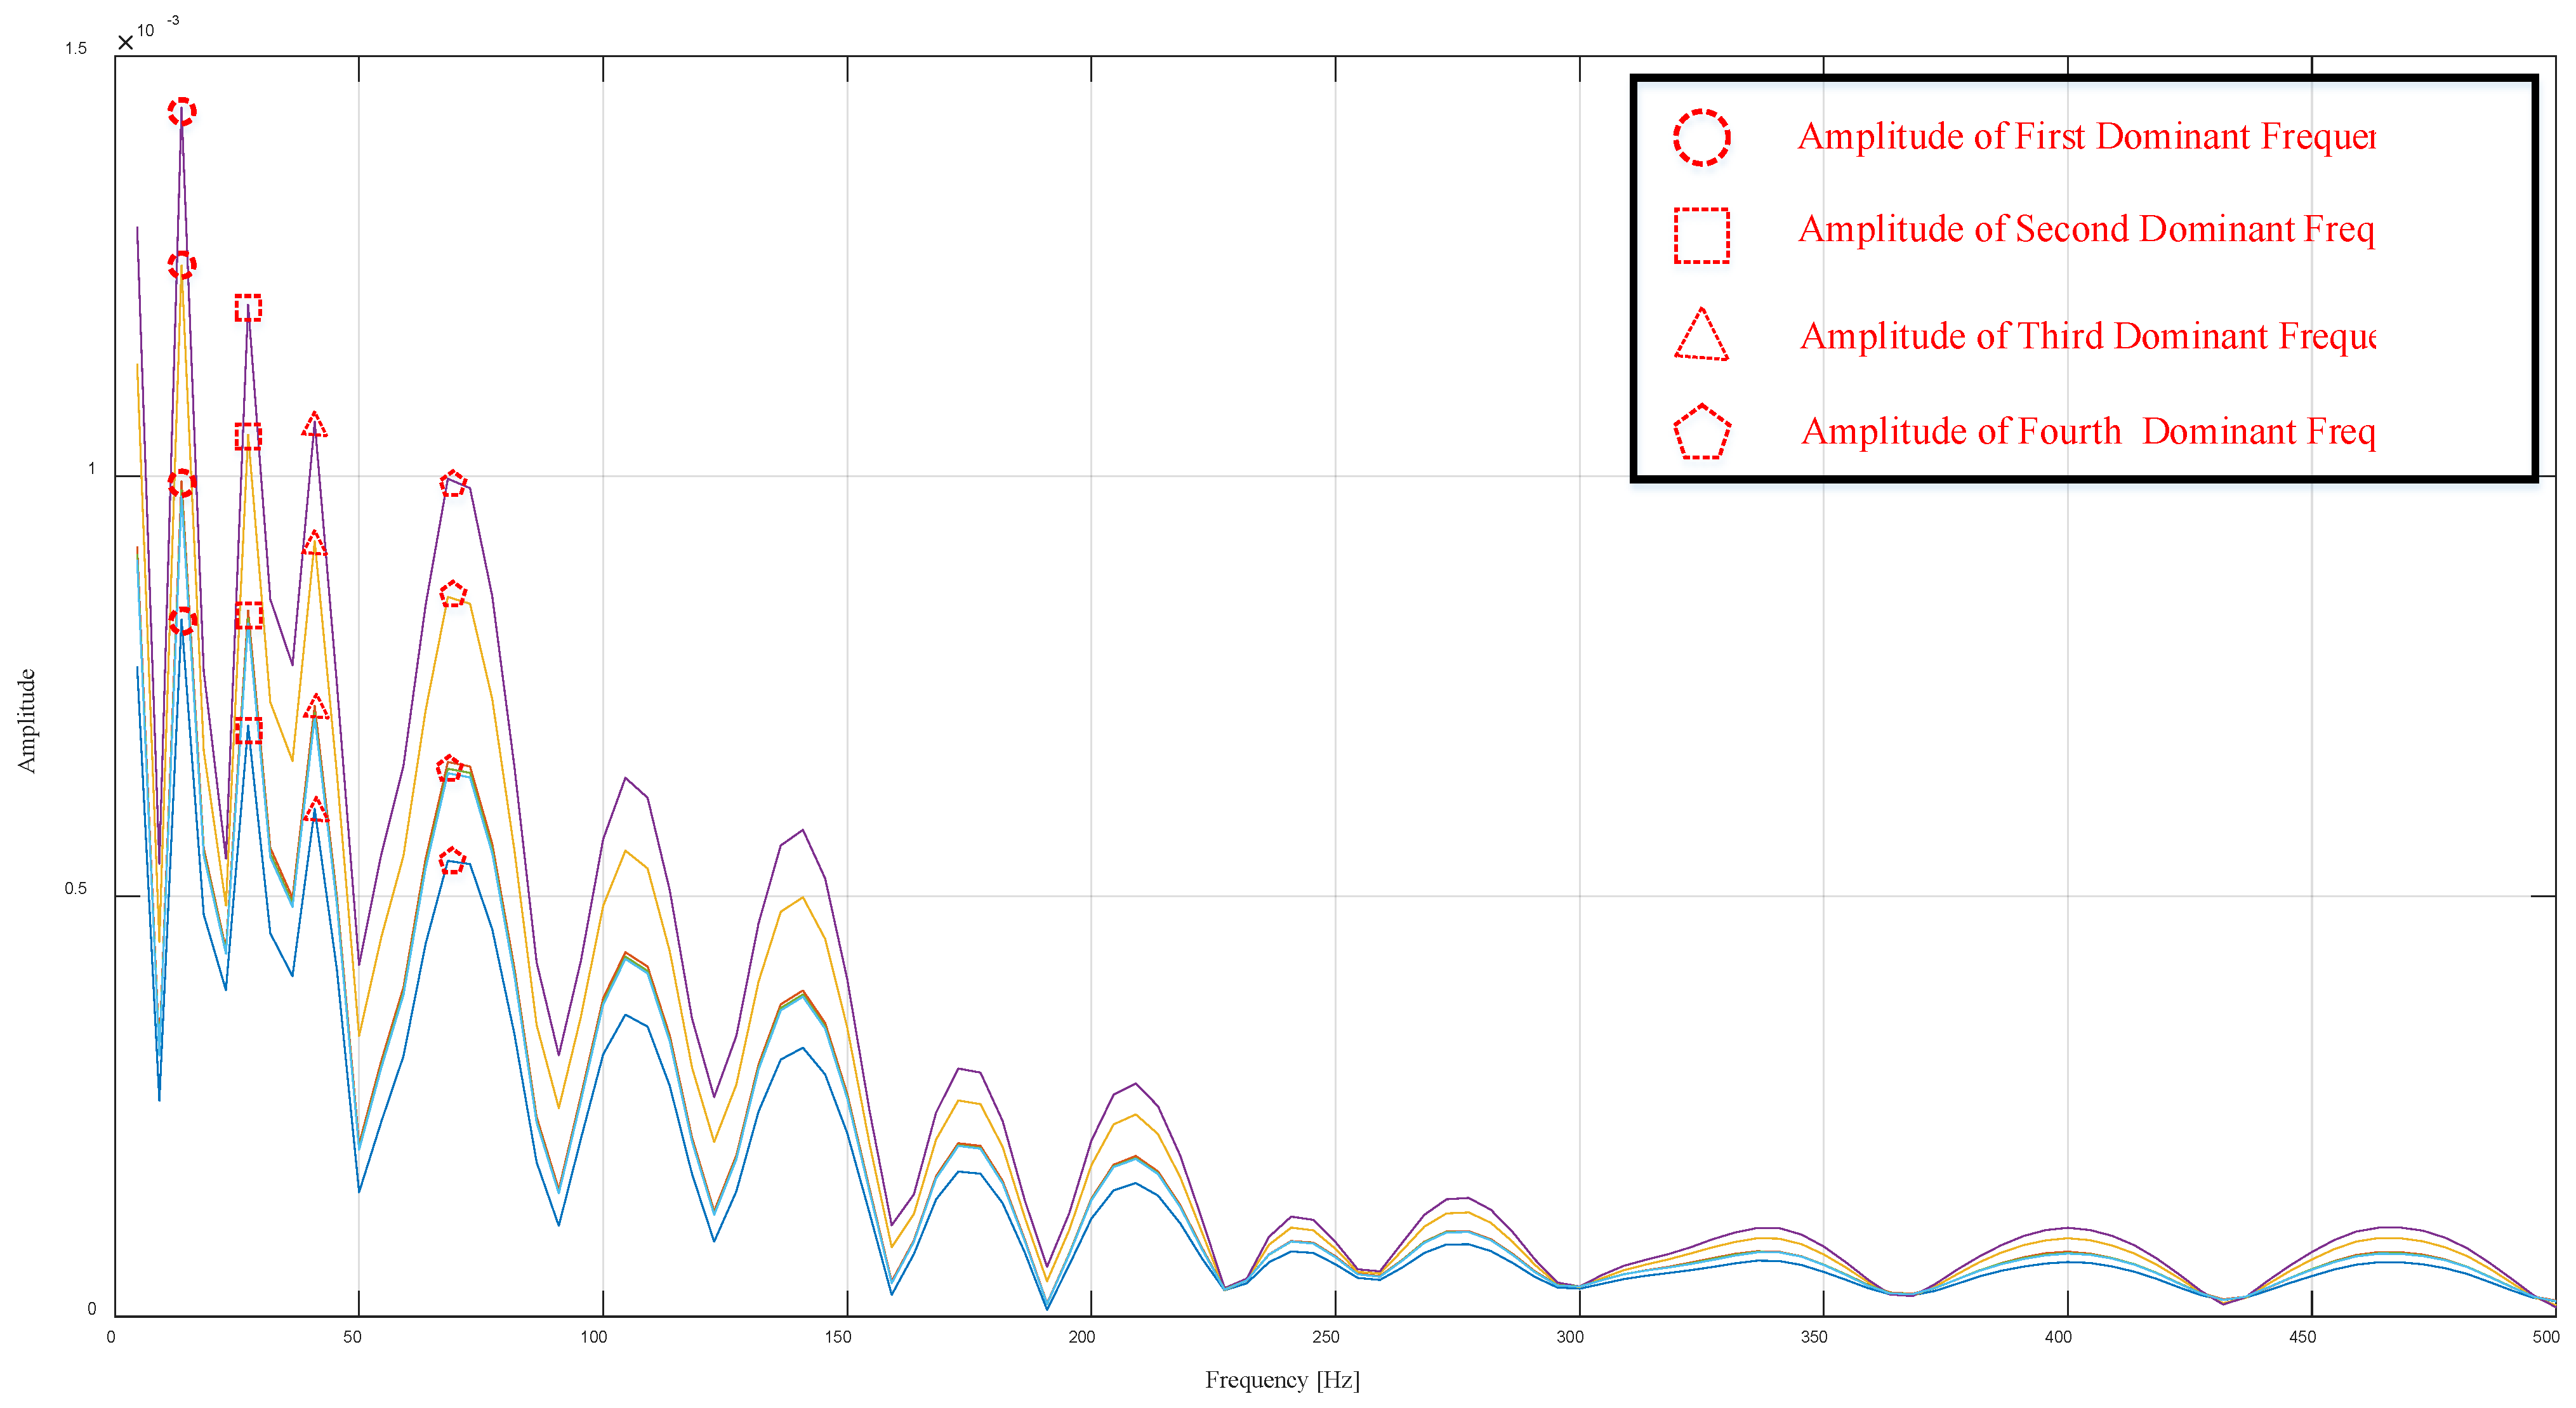
3. Frequency Feature Extraction
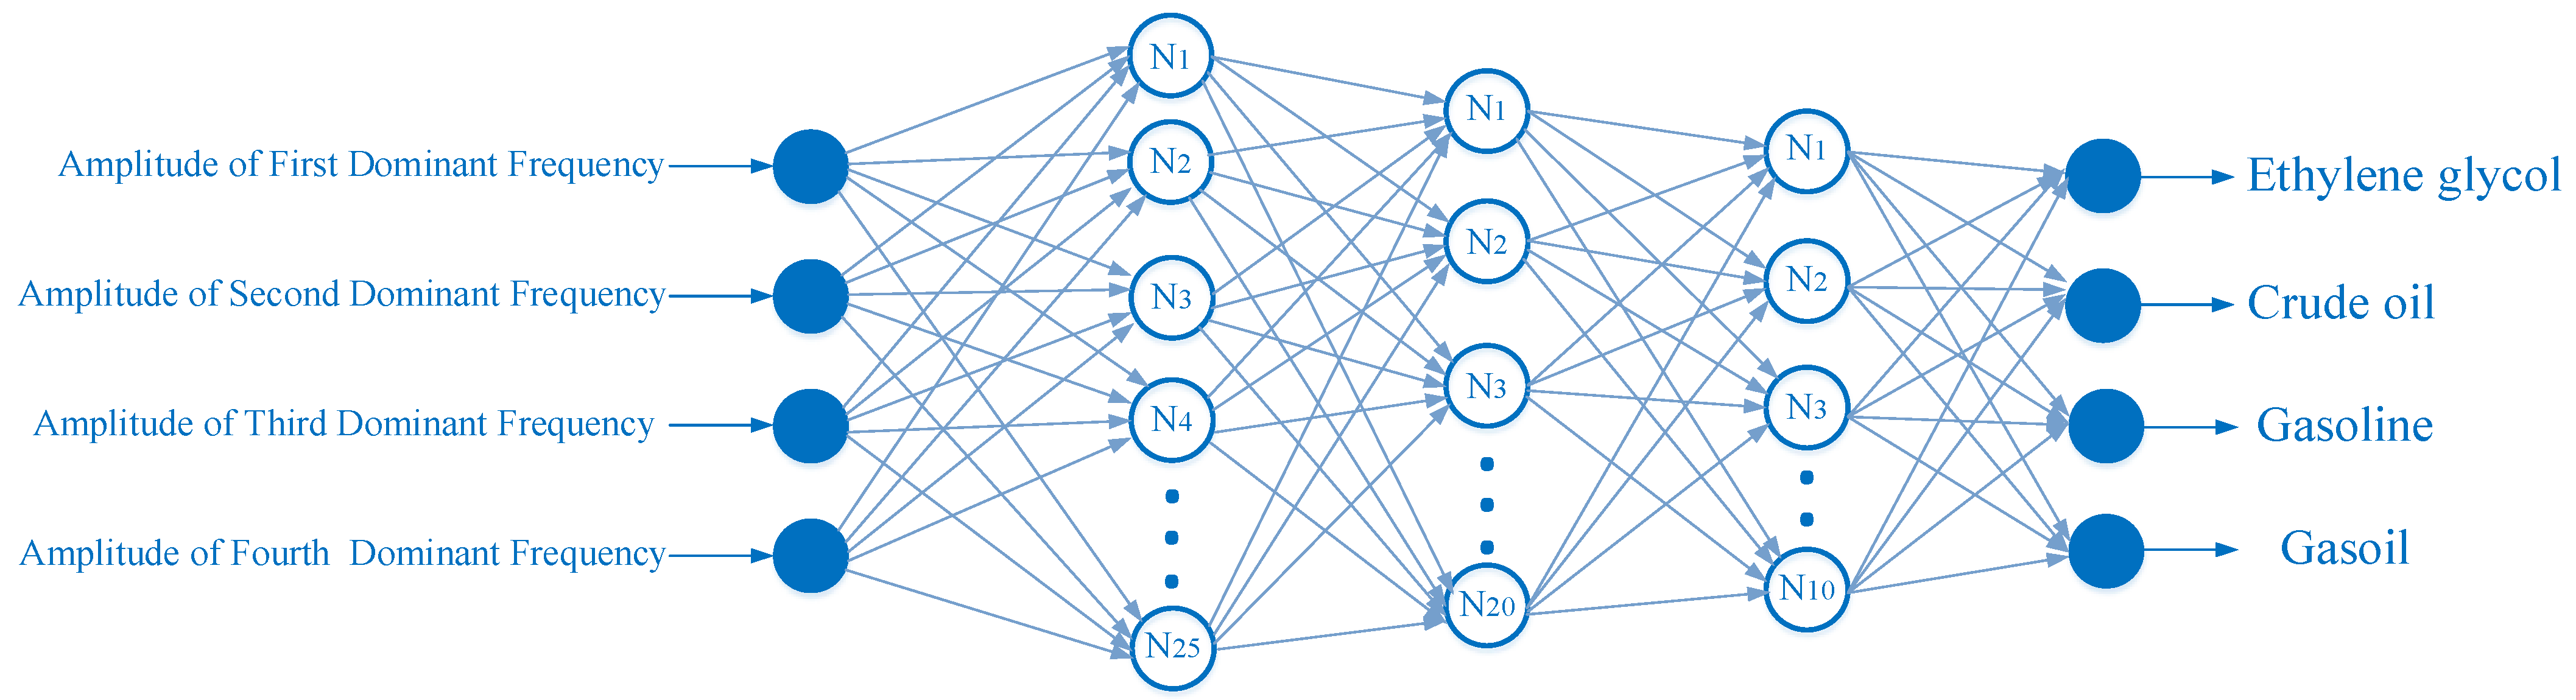
4. The Multilayer Perceptron Neural Network
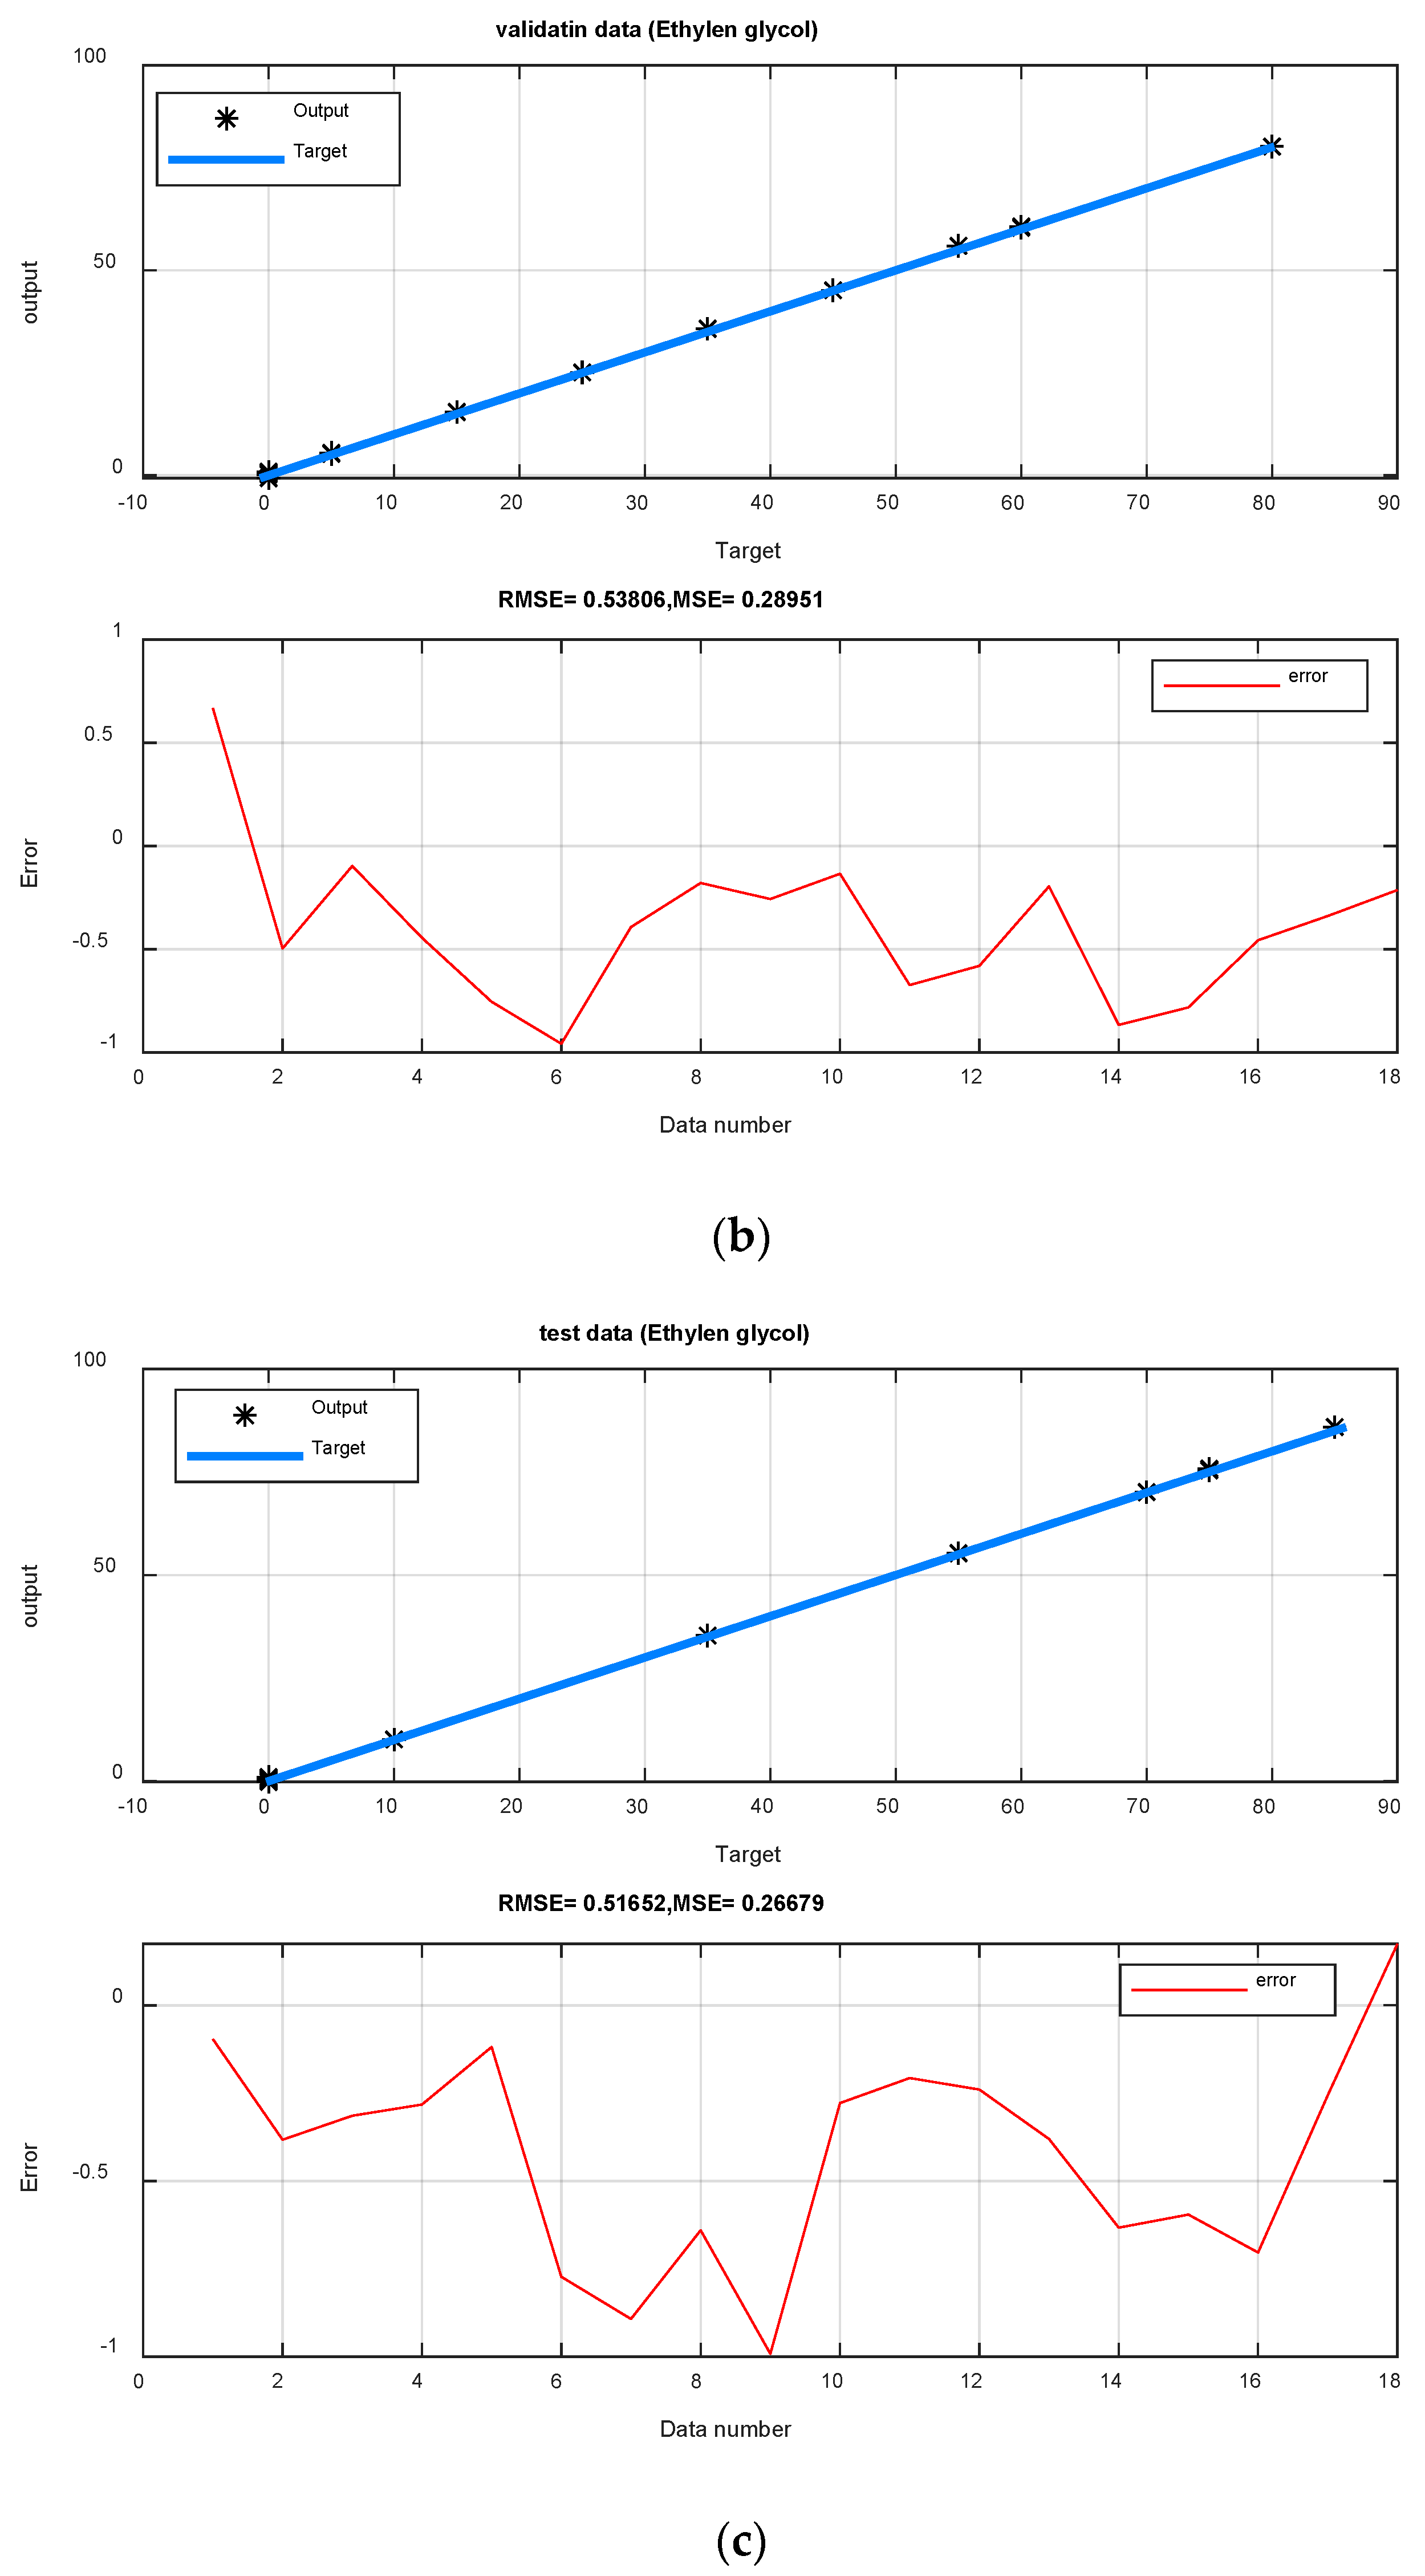
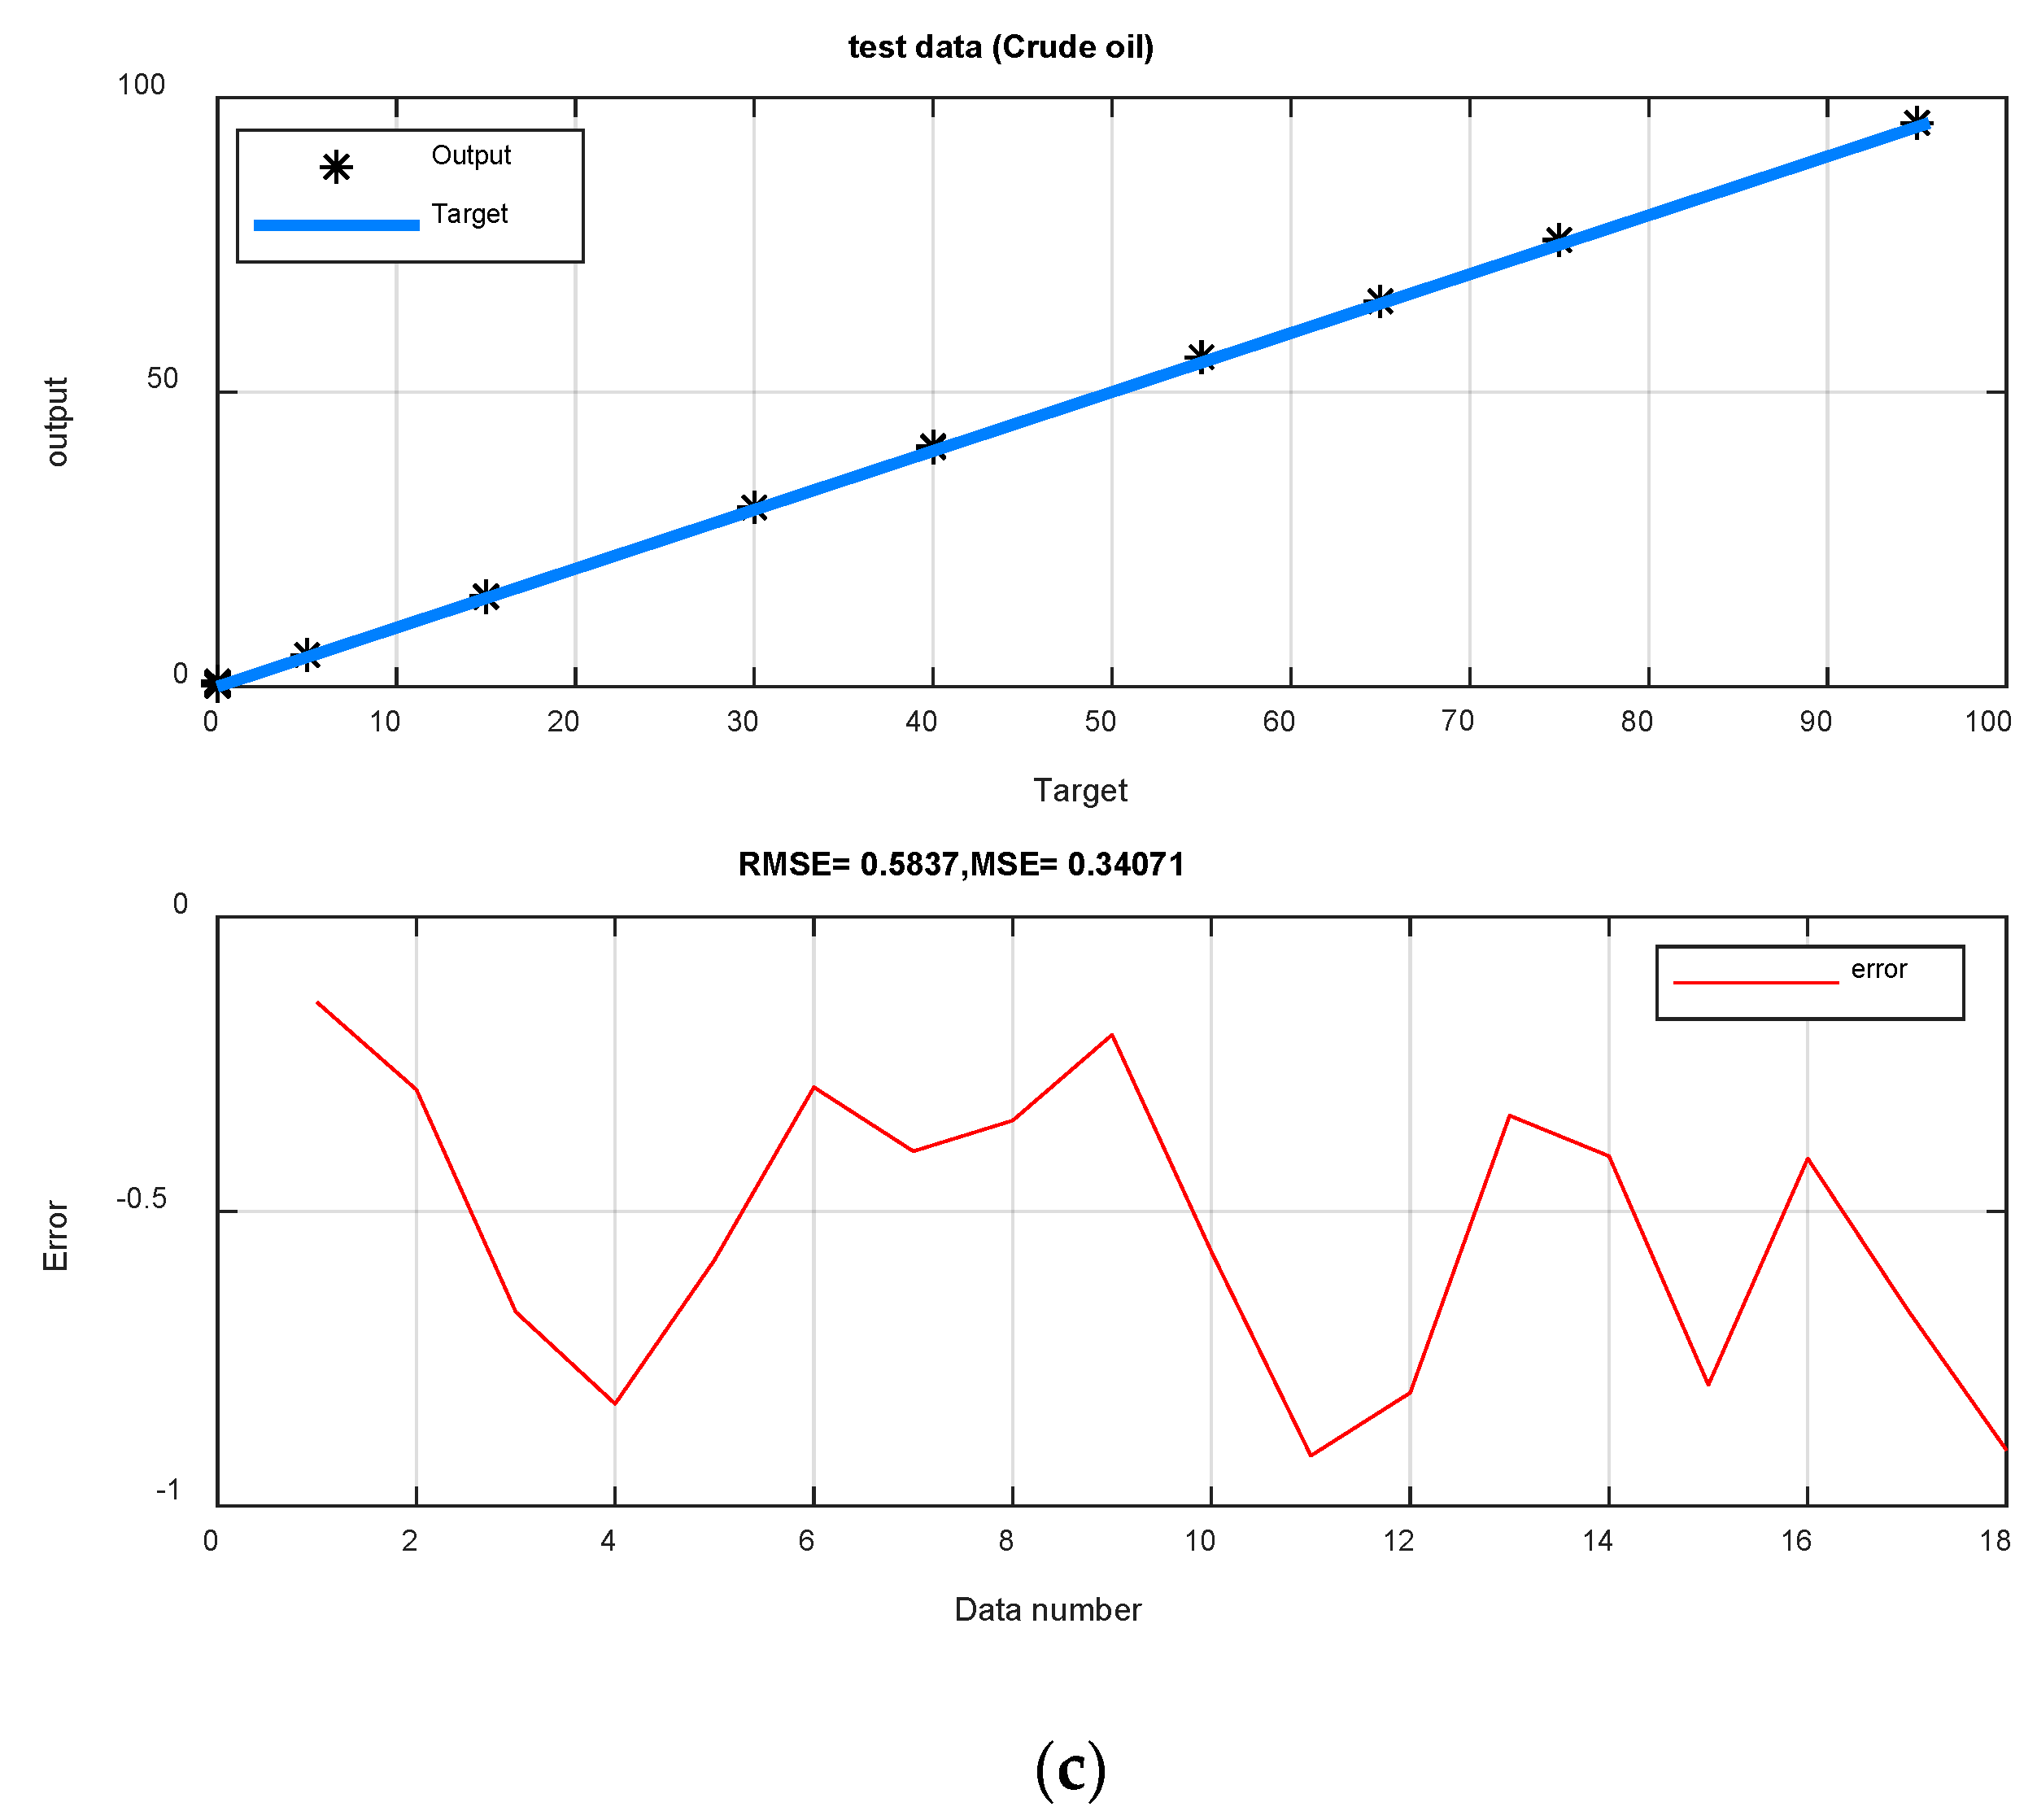
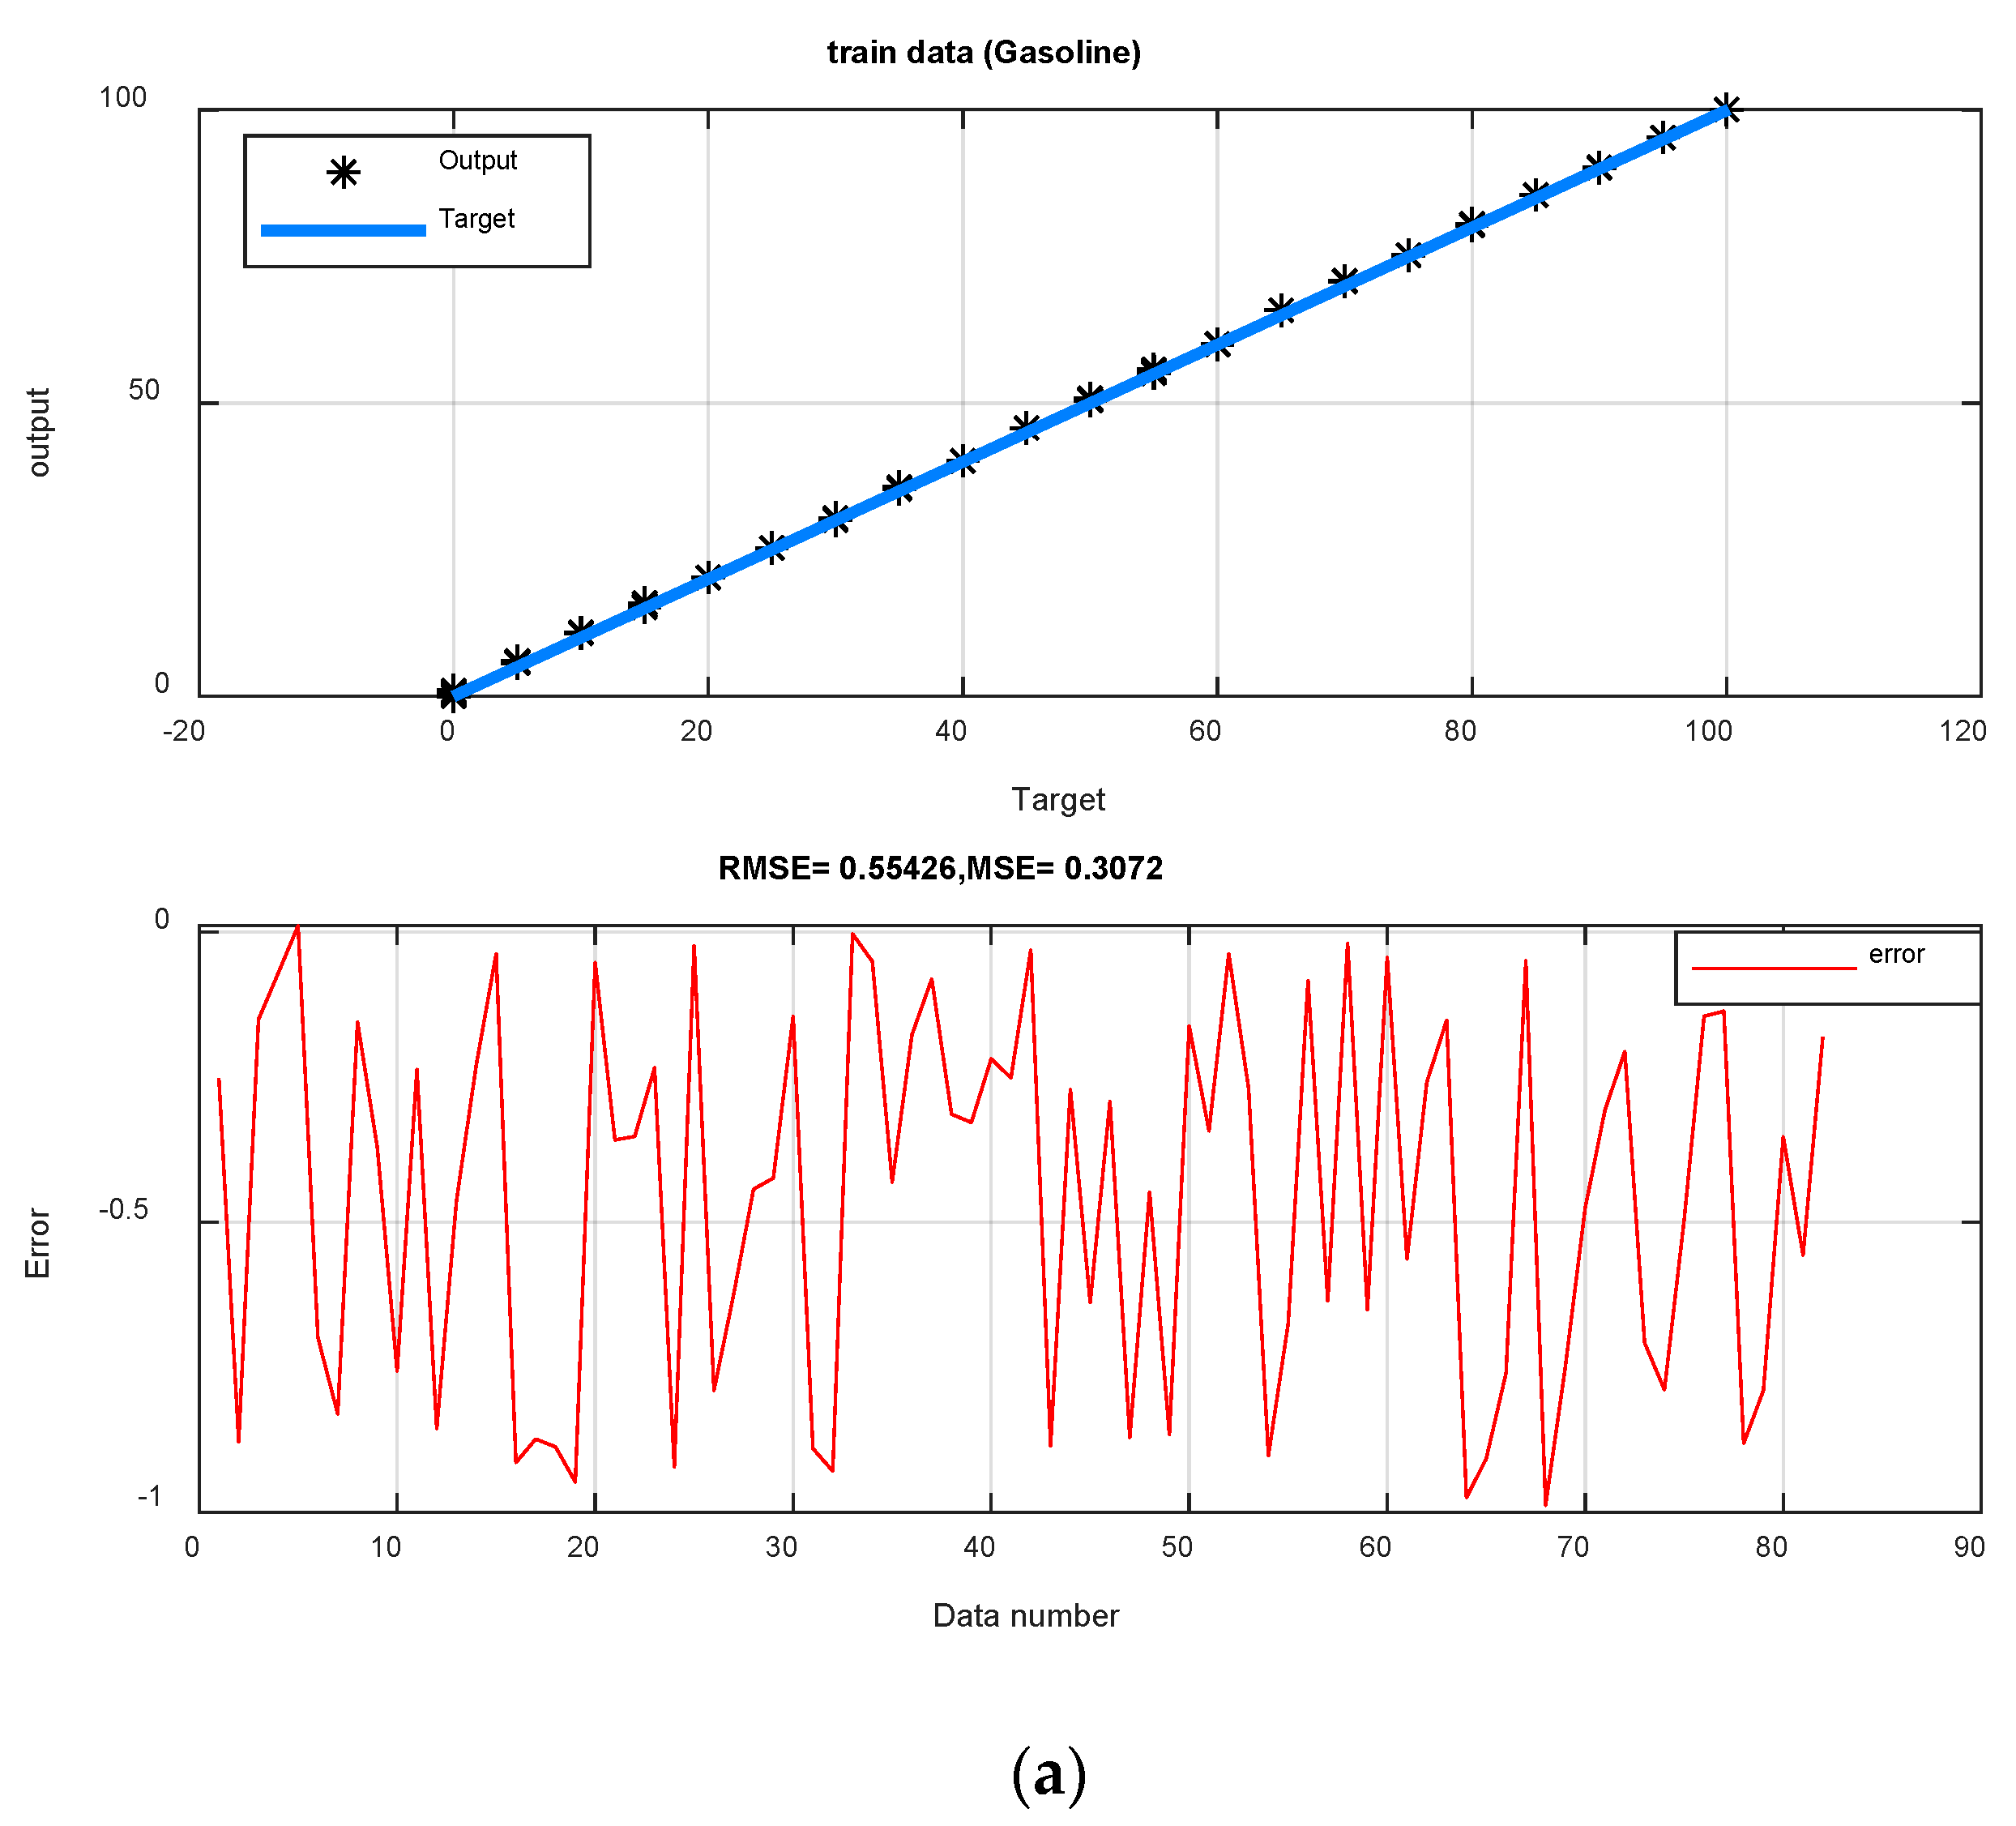
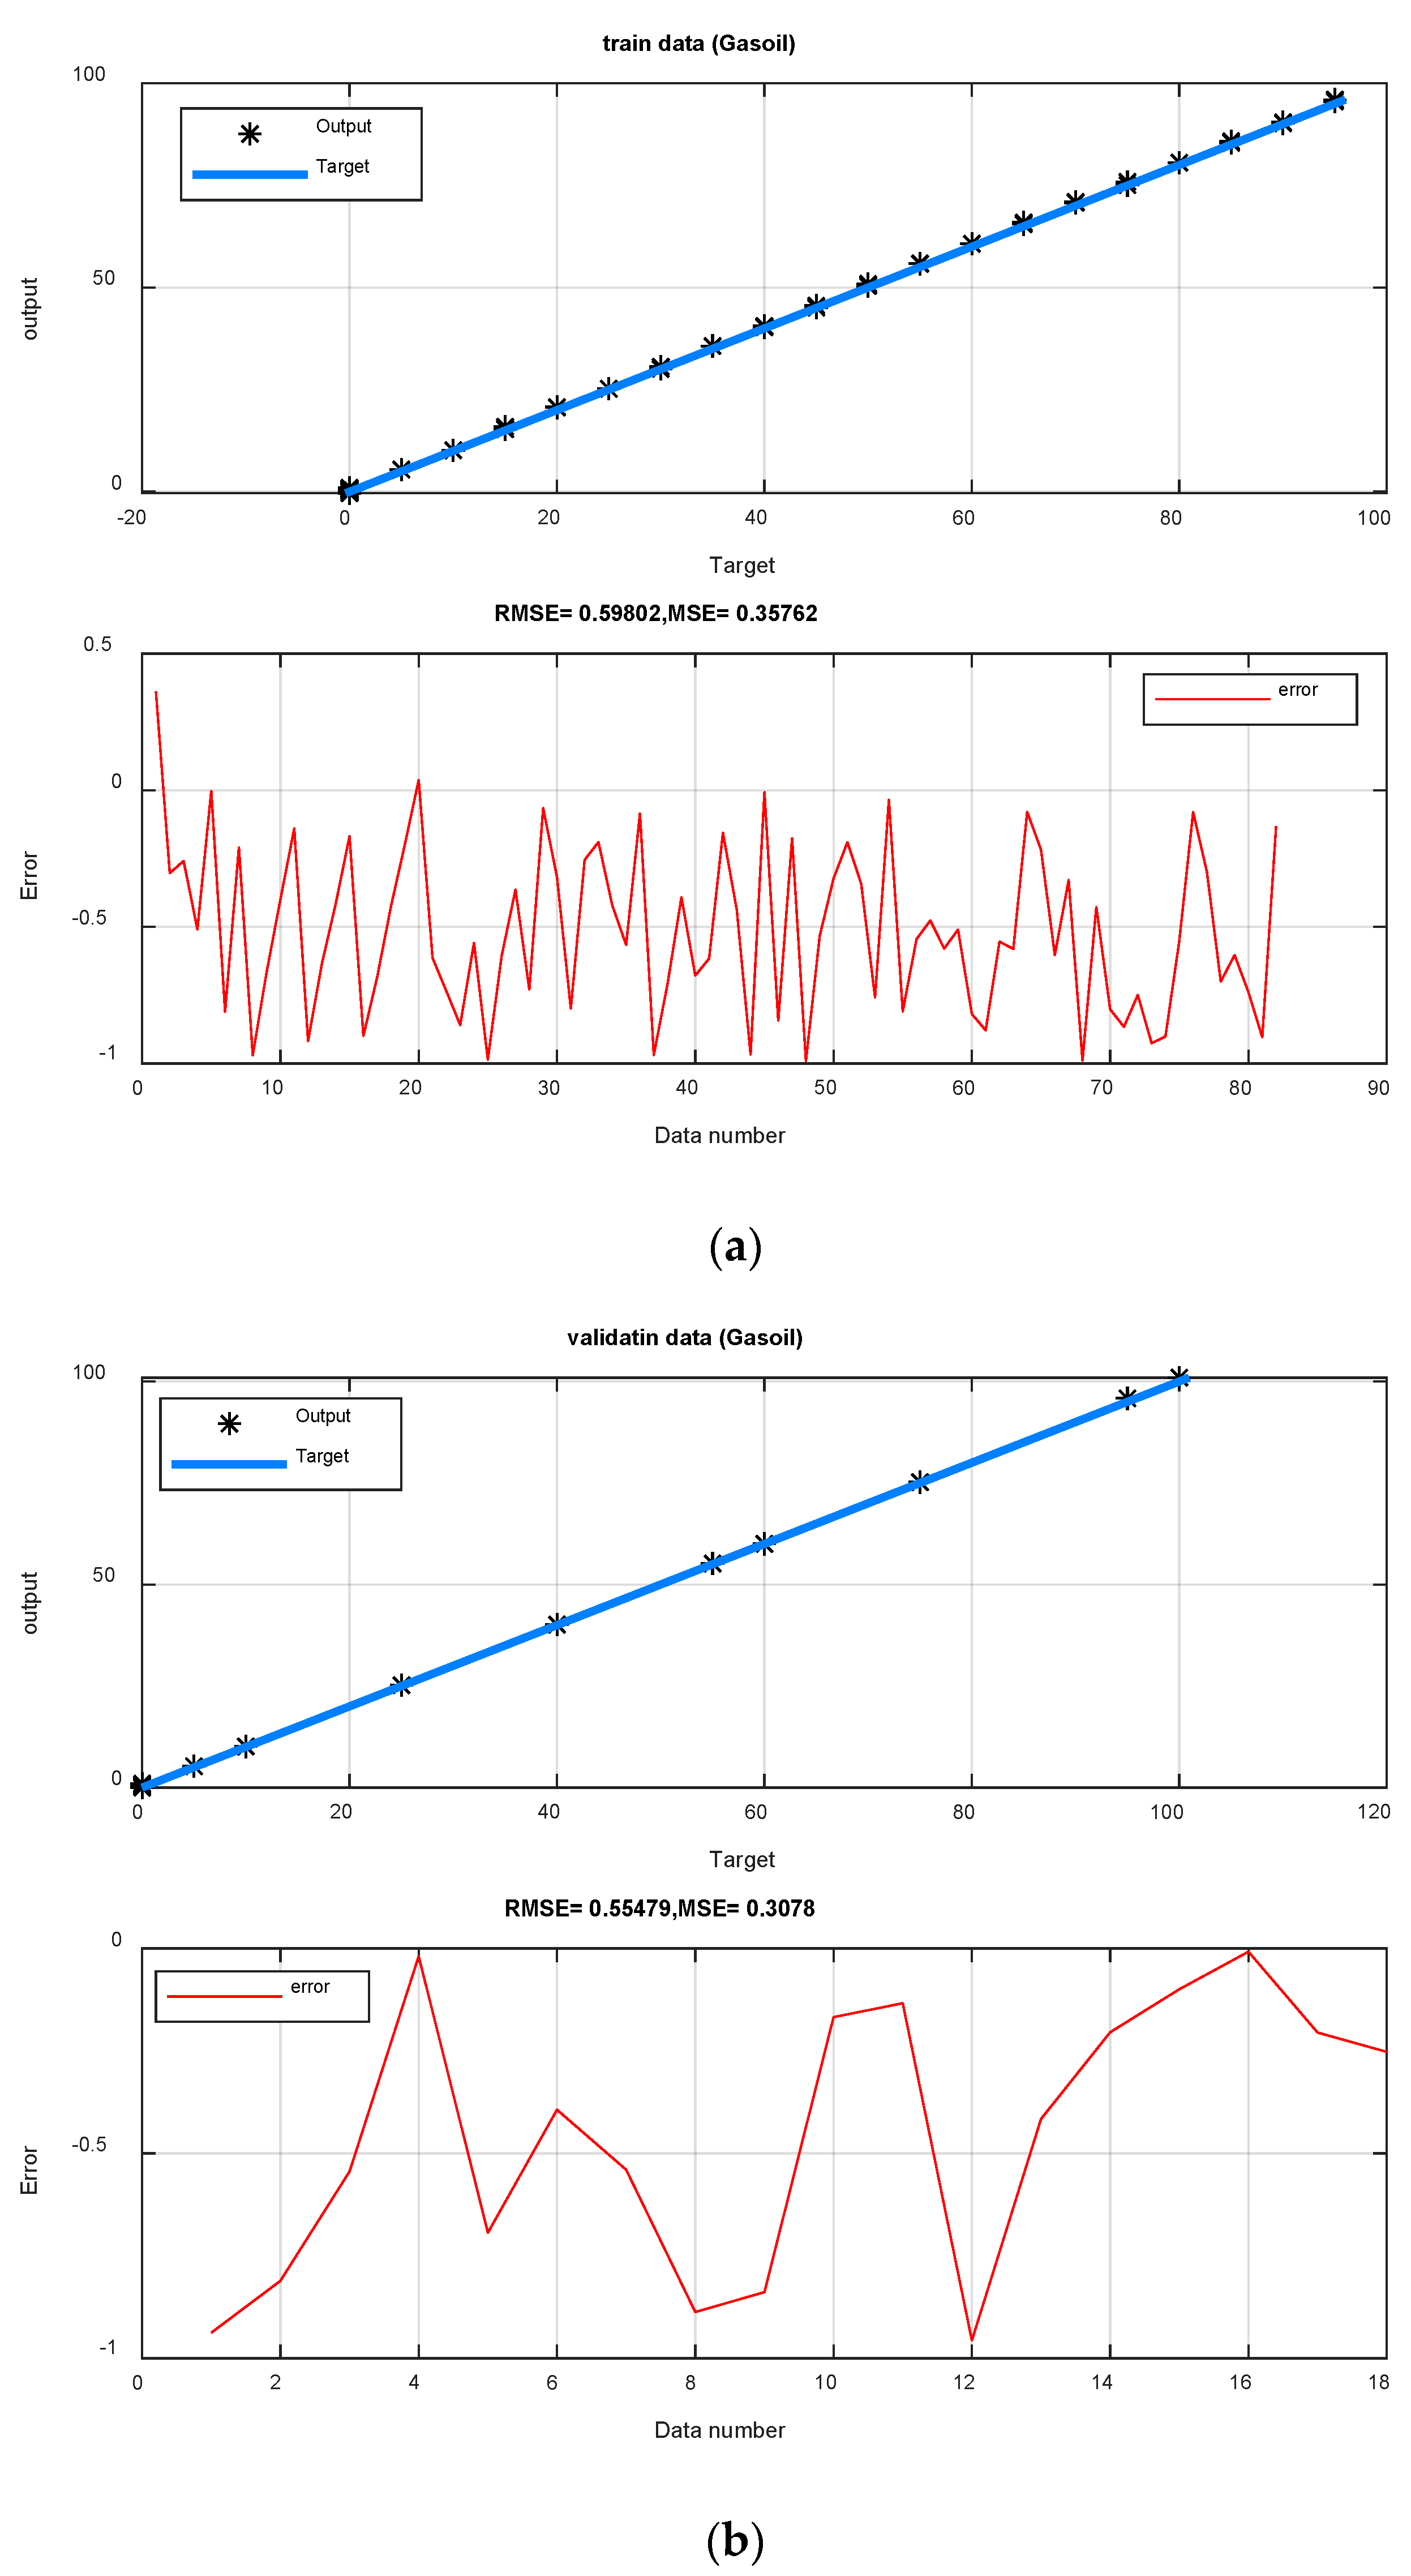
5. Result and Discussion
6. Conclusions
Author Contributions
Funding
Institutional Review Board Statement
Informed Consent Statement
Data Availability Statement
Conflicts of Interest
References
- Basahel, A.; Sattari, M.; Taylan, O.; Nazemi, E. Application of Feature Extraction and Artificial Intelligence Techniques for Increasing the Accuracy of X-ray Radiation Based Two Phase Flow Meter. Mathematics 2021, 9, 1227. [Google Scholar] [CrossRef]
- Taylan, O.; Sattari, M.A.; Essoussi, I.E.; Nazemi, E. Frequency Domain Feature Extraction Investigation to Increase the Accuracy of an Intelligent Nondestructive System for Volume Fraction and Regime Determination of Gas-Water-Oil Three-Phase Flows. Mathematics 2021, 9, 2091. [Google Scholar] [CrossRef]
- Roshani, G.H.; Ali, P.J.M.; Mohammed, S.; Hanus, R.; Abdulkareem, L.; Alanezi, A.A.; Sattari, M.A.; Amiri, S.; Nazemi, E.; Eftekhari-Zadeh, E.; et al. Simulation Study of Utilizing X-ray Tube in Monitoring Systems of Liquid Petroleum Products. Processes 2021, 9, 828. [Google Scholar] [CrossRef]
- Balubaid, M.; Sattari, M.A.; Taylan, O.; Bakhsh, A.A.; Nazemi, E. Applications of Discrete Wavelet Transform for Feature Extraction to Increase the Accuracy of Monitoring Systems of Liquid Petroleum Products. Mathematics 2021, 9, 3215. [Google Scholar] [CrossRef]
- Mayet, A.M.; Alizadeh, S.M.; Nurgalieva, K.S.; Hanus, R.; Nazemi, E.; Narozhnyy, I.M. Extraction of Time-Domain Characteristics and Selection of Effective Features Using Correlation Analysis to Increase the Accuracy of Petroleum Fluid Monitoring Systems. Energies 2022, 15, 1986. [Google Scholar] [CrossRef]
- Nazemi, E.; Roshani, G.H.; Feghhi, S.A.H.; Setayeshi, S.; Zadeh, E.E.; Fatehi, A. Optimization of a method for identifying the flow regime and measuring void fraction in a broad beam gamma-ray attenuation technique. Int. J. Hydrog. Energy 2016, 41, 7438–7444. [Google Scholar] [CrossRef]
- Sattari, M.A.; Korani, N.; Hanus, R.; Roshani, G.H.; Nazemi, E. Improving the performance of gamma radiation based two phase flow meters using optimal time characteristics of the detector output signal extraction. J. Nucl. Sci. Technol. 2020, 41, 42–54. [Google Scholar]
- Hanus, R.; Zych, M.; Petryka, L.; Świsulski, D.; Strzępowicz, A. Application of ANN and PCA to two-phase flow evaluation using radioisotopes. EPJ Web Conf. 2017, 143, 02033. [Google Scholar] [CrossRef]
- Salgado, C.M.; Brandão, L.E.; Schirru, R.; Pereira, C.M.; da Silva, A.X.; Ramos, R. Prediction of volume fractions in three-phase flows using nuclear technique and artificial neural network. Appl. Radiat. Isot. 2009, 67, 1812–1818. [Google Scholar] [CrossRef] [PubMed]
- Salgado, C.M.; Pereira, C.M.; Schirru, R.; Brandão, L.E. Flow regime identification and volume fraction prediction in multiphase flows by means of gamma-ray attenuation and artificial neural networks. Prog. Nucl. Energy 2010, 52, 555–562. [Google Scholar] [CrossRef]
- Salgado, W.; Dam, R.; Salgado, C. Optimization of a flow regime identification system and prediction of volume fractions in three-phase systems using gamma-rays and artificial neural network. Appl. Radiat. Isot. 2021, 169, 109552. [Google Scholar] [CrossRef] [PubMed]
- Sattari, M.A.; Roshani, G.H.; Hanus, R. Improving the structure of two-phase flow meter using feature extraction and GMDH neural network. Radiat. Phys. Chem. 2020, 171, 108725. [Google Scholar] [CrossRef]
- Sattari, M.A.; Roshani, G.H.; Hanus, R.; Nazemi, E. Applicability of time-domain feature extraction methods and artificial intelligence in two-phase flow meters based on gamma-ray absorption technique. Measurement 2021, 168, 108474. [Google Scholar] [CrossRef]
- Roshani, M.; Sattari, M.A.; Ali, P.J.M.; Roshani, G.H.; Nazemi, B.; Corniani, E.; Nazemi, E. Application of GMDH neural network technique to improve measuring precision of a simplified photon attenuation based two-phase flowmeter. Flow Meas. Instrum. 2020, 75, 101804. [Google Scholar] [CrossRef]
- Alamoudi, M.; Sattari, M.; Balubaid, M.; Eftekhari-Zadeh, E.; Nazemi, E.; Taylan, O.; Kalmoun, E. Application of Gamma Attenuation Technique and Artificial Intelligence to Detect Scale Thickness in Pipelines in Which Two-Phase Flows with Different Flow Regimes and Void Fractions Exist. Symmetry 2021, 13, 1198. [Google Scholar] [CrossRef]
- Roshani, M.; Phan, G.; Faraj, R.H.; Phan, N.-H.; Roshani, G.H.; Nazemi, B.; Corniani, E.; Nazemi, E. Proposing a gamma radiation based intelligent system for simultaneous analyzing and detecting type and amount of petroleum by-products. Nucl. Eng. Technol. 2020, 53, 1277–1283. [Google Scholar] [CrossRef]
- Tkachenko, R.; Izonin, I.; Tkachenko, P. Neuro-Fuzzy Diagnostics Systems Based on SGTM Neural-Like Structure and T-Controller. In International Scientific Conference “Intellectual Systems of Decision Making and Problem of Computational Intelligence”; Springer: Cham, Switzerland, 2019; pp. 685–695. [Google Scholar]
- Izonin, I.; Tkachenko, R.; Kryvinska, N.; Tkachenko, P. Multiple linear regression based on coefficients identification using non-iterative SGTM neural-like structure. In Proceedings of the International Work-Conference on Artificial Neural Networks, Gran Canaria, Spain, 12–14 June 2019; Springer: Cham, Switzerland; pp. 467–479. [Google Scholar]
- Mayet, A.M.; Alizadeh, S.M.; Kakarash, Z.A.; Al-Qahtani, A.A.; Alanazi, A.K.; Guerrero, J.W.G.; Alhashimi, H.H.; Eftekhari-Zadeh, E. Increasing the Efficiency of a Control System for Detecting the Type and Amount of Oil Product Passing through Pipelines Based on Gamma-Ray Attenuation, Time Domain Feature Extraction, and Artificial Neural Networks. Polymers 2022, 14, 2852. [Google Scholar] [CrossRef]
- Nussbaumer, H.J. The fast Fourier transform. In Fast Fourier Transform and Convolution Algorithms; Springer: Berlin, Germany, 1981; pp. 80–111. [Google Scholar]
- Mayet, A.M.; Salama, A.S.; Alizadeh, S.M.; Nesic, S.; Guerrero, J.W.G.; Eftekhari-Zadeh, E.; Nazemi, E.; Iliyasu, A.M. Applying Data Mining and Artificial Intelligence Techniques for High Precision Measuring of the Two-Phase Flow’s Characteristics Independent of the Pipe’s Scale Layer. Electronics 2022, 11, 459. [Google Scholar] [CrossRef]
- Iliyasu, A.M.; Mayet, A.M.; Hanus, R.; El-Latif, A.A.A.; Salama, A.S. Employing GMDH-Type Neural Network and Signal Frequency Feature Extraction Approaches for Detection of Scale Thickness inside Oil Pipelines. Energies 2022, 15, 4500. [Google Scholar] [CrossRef]
- Taylor, J.G. Neural Networks and Their Applications; John Wiley & Sons Ltd.: Brighton, UK, 1996. [Google Scholar]
- Gallant, A.R.; White, H. On learning the derivatives of an unknown mapping with multilayer feedforward networks. Neural Netw. 1992, 5, 129–138. [Google Scholar] [CrossRef]
- Hosseini, S.; Roshani, G.; Setayeshi, S. Precise gamma based two-phase flow meter using frequency feature extraction and only one detector. Flow Meas. Instrum. 2020, 72, 101693. [Google Scholar] [CrossRef]
- Peyvandi, R.G.; Rad, S.Z.I. Application of artificial neural networks for the prediction of volume fraction using spectra of gamma rays backscattered by three-phase flows. Eur. Phys. J. Plus 2017, 132, 511. [Google Scholar] [CrossRef]
- Isaev, A.A.; Aliev, M.M.O.; Drozdov, A.N.; Gorbyleva, Y.A.; Nurgalieva, K.S. Improving the Efficiency of Curved Wells’ Operation by Means of Progressive Cavity Pumps. Energies 2022, 15, 4259. [Google Scholar] [CrossRef]
- Lalbakhsh, A.; Mohamadpour, G.; Roshani, S.; Ami, M.; Roshani, S.; Sayem, A.S.M.; Alibakhshikenari, M.; Koziel, S. Design of a Compact Planar Transmission Line for Miniaturized Rat-Race Coupler With Harmonics Suppression. IEEE Access 2021, 9, 129207–129217. [Google Scholar] [CrossRef]
- Roshani, S.; Roshani, S. A compact coupler design using meandered line compact microstrip resonant cell (MLCMRC) and bended lines. Wirel. Netw. 2021, 27, 677–684. [Google Scholar] [CrossRef]
- Shukla, N.K.; Mayet, A.M.; Vats, A.; Aggarwal, M.; Raja, R.K.; Verma, R.; Muqeet, M.A. High speed integrated RF–VLC data communication system: Performance constraints and capacity considerations. Phys. Commun. 2021, 50, 101492. [Google Scholar] [CrossRef]
- Hookari, M.; Roshani, S.; Roshani, S. High-efficiency balanced power amplifier using miniaturized harmonics suppressed coupler. Int. J. RF Microw. Comput. Aided Eng. 2020, 30, e22252. [Google Scholar] [CrossRef]
- Mayet, A.M.; Hussain, A.M.; Hussain, M.M. Three-terminal nanoelectromechanical switch based on tungsten nitride, an amorphous metallic material. Nanotechnology 2016, 27, 035202. [Google Scholar] [CrossRef]
- Lotfi, S.; Roshani, S.; Roshani, S.; Gilan, M.S. Wilkinson power divider with band-pass filtering response and harmonics suppression using open and short stubs. Frequenz 2020, 74, 169–176. [Google Scholar] [CrossRef]
- Mayet, A.; Hussain, M. Amorphous WNx Metal for Accelerometers and Gyroscope. In Proceedings of the MRS Fall Meeting, Boston, MA, USA, 30 November–5 December 2014. [Google Scholar]
- Jamshidi, M.; Siahkamari, H.; Roshani, S.; Roshani, S. A compact Gysel power divider design using U-shaped and T-shaped resonators with harmonics suppression. Electromagnetics 2019, 39, 491–504. [Google Scholar] [CrossRef]
- Mayet, A.; Smith, C.E.; Hussain, M.M. Energy reversible switching from amorphous metal based nanoelectromechanical switch. In Proceedings of the 2013 13th IEEE International Conference on Nanotechnology (IEEE-NANO 2013), Beijing, China, 5–8 August 2013; pp. 366–369. [Google Scholar]
- Roshani, S.; Roshani, S. Two-section impedance transformer design and modeling for power amplifier applications. Appl. Comput. Electromagn. Soc. J. (ACES) 2017, 32, 1042–1047. [Google Scholar]
- Jamshidi, M.B.; Roshani, S.; Talla, J.; Roshani, S.; Peroutka, Z. Size reduction and performance improvement of a microstrip Wilkinson power divider using a hybrid design technique. Sci. Rep. 2021, 11, 7773. [Google Scholar] [CrossRef] [PubMed]
- Mayet, A.; Smith, C.; Hussain, M.M.; Smith, C. Amorphous metal based nanoelectromechanical switch. In Proceedings of the 2013 Saudi International Electronics, Communications and Photonics Conference, Riyadh, Saudi Arabia, 27–30 April 2013; pp. 1–5. [Google Scholar] [CrossRef]
- Hookari, M.; Roshani, S.; Roshani, S. Design of a low pass filter using rhombus-shaped resonators with an analytical LC equivalent circuit. Turk. J. Electr. Eng. Comput. Sci. 2020, 28, 865–874. [Google Scholar] [CrossRef]
- Pirasteh, A.; Roshani, S.; Roshani, S. Design of a miniaturized class F power amplifier using capacitor loaded transmission lines. Frequenz 2020, 74, 145–152. [Google Scholar] [CrossRef]
- Roshani, S.; Dehghani, K.; Roshani, S. A lowpass filter design using curved and fountain shaped resonators. Frequenz 2019, 73, 267–272. [Google Scholar] [CrossRef]
- Roshani, S.; Roshani, S. Design of a compact LPF and a miniaturized Wilkinson power divider using aperiodic stubs with harmonic suppression for wireless applications. Wirel. Netw. 2020, 26, 1493–1501. [Google Scholar] [CrossRef]
- Alanazi, A.K.; Alizadeh, S.M.; Nurgalieva, K.S.; Guerrero, J.W.G.; Abo-Dief, H.M.; Eftekhari-Zadeh, E.; Nazemi, E.; Narozhnyy, I.M. Optimization of X-ray Tube Voltage to Improve the Precision of Two Phase Flow Meters Used in Petroleum Industry. Sustainability 2021, 13, 13622. [Google Scholar] [CrossRef]
- Alanazi, A.K.; Alizadeh, S.M.; Nurgalieva, K.S.; Nesic, S.; Guerrero, J.W.G.; Abo-Dief, H.M.; Eftekhari-Zadeh, E.; Nazemi, E.; Narozhnyy, I.M. Application of Neural Network and Time-Domain Feature Extraction Techniques for Determining Volumetric Percentages and the Type of Two Phase Flow Regimes Independent of Scale Layer Thickness. Appl. Sci. 2022, 12, 1336. [Google Scholar] [CrossRef]
- Mohamadinia, A.; Shama, F.; Sattari, M.A. Miniaturized bandpass filter using coupled lines for wireless applications. Frequenz 2021, 75, 301–308. [Google Scholar] [CrossRef]
- Jedkare, E.; Shama, F.; Sattari, M.A. Compact Wilkinson power divider with multi-harmonics suppression. AEU Int. J. Electron. Commun. 2020, 127, 153436. [Google Scholar] [CrossRef]
- Tabatabaee, A.H.; Shama, F.; Sattari, M.A.; Veysifard, S. A miniaturized Wilkinson power divider with 12th harmonics suppression. J. Electromagn. Waves Appl. 2020, 35, 371–388. [Google Scholar] [CrossRef]


| ANN | MLP | ||
|---|---|---|---|
| No. of neurons in the input layer | 4 | ||
| No. of neurons in the 1st hidden layer | 25 | ||
| No. of neurons in the 2nd hidden layer | 20 | ||
| No. of neurons in the 3rd hidden layer | 10 | ||
| No. of neurons in the output layer | 4 | ||
| No. of epoch | 850 | ||
| Hidden neuron activation function | Tansig | ||
| MSE of predicting ethylene glycol | Training data | Validation data | Test data |
| 0.34 | 0.28 | 0.26 | |
| RMSE of predicting ethylene glycol | 0.58 | 0.53 | 0.51 |
| MSE of predicting crude oil | 0.25 | 0.45 | 0.34 |
| RMSE of predicting crude oil | 0.50 | 0.67 | 0.58 |
| MSE of predicting gasoline | 0.30 | 0.28 | 0.45 |
| RMSE of predicting gasoline | 0.55 | 0.52 | 0.67 |
| MSE of predicting gasoil | 0.41 | 0.30 | 0.26 |
| RMSE of predicting gasoil | 0.66 | 0.55 | 0.51 |
| Ethylene Glycol | Crude Oil | Gasoline | Gasoil | ||||||||||||
|---|---|---|---|---|---|---|---|---|---|---|---|---|---|---|---|
| Train | Validation | Train | Validation | Train | Validation | Train | Validation | ||||||||
| Target | Output | Target | Output | Target | Output | Target | Output | Target | Output | Target | Output | Target | Output | Target | Output |
| 100 | 100.2503 | 0 | −0.6679 | 0 | −0.2444 | 0 | 0.1200 | 0 | 0.2518 | 0 | −0.2710 | 0 | −0.3601 | 100 | 100.9374 |
| 0 | 0.4616 | 5 | 5.4959 | 100 | 100.3333 | 95 | 95.5458 | 0 | 0.8781 | 0 | 0.1298 | 0 | 0.3037 | 0 | 0.8107 |
| 0 | 0.3729 | 25 | 25.0965 | 0 | 0.2291 | 75 | 75.5199 | 100 | 100.1504 | 0 | 0.8440 | 0 | 0.2588 | 0 | 0.5440 |
| 10 | 10.6204 | 15 | 15.4440 | 90 | 90.7862 | 0 | 0.9285 | 0 | 0.0703 | 85 | 85.6582 | 0 | 0.5093 | 0 | 0.0190 |
| 15 | 15.0060 | 35 | 35.7542 | 85 | 85.0123 | 0 | 0.9116 | 0 | −0.0111 | 65 | 65.6383 | 0 | 0.0029 | 0 | 0.6936 |
| 20 | 20.4711 | 55 | 55.9576 | 80 | 80.0183 | 0 | 0.4176 | 0 | 0.6988 | 45 | 45.2076 | 0 | 0.8107 | 0 | 0.3935 |
| 30 | 30.7347 | 60 | 60.3923 | 70 | 70.2377 | 0 | 0.8690 | 0 | 0.8302 | 40 | 40.1848 | 0 | 0.2093 | 0 | 0.5399 |
| 35 | 35.5848 | 80 | 80.1789 | 65 | 65.3069 | 0 | 0.1560 | 0 | 0.1548 | 20 | 20.8099 | 0 | 0.9703 | 0 | 0.8869 |
| 40 | 40.5047 | 5 | 5.2565 | 60 | 60.4803 | 0 | 0.9834 | 0 | 0.3711 | 0 | 0.4331 | 0 | 0.6670 | 95 | 95.8385 |
| 45 | 45.2502 | 45 | 45.1342 | 55 | 55.6207 | 0 | 0.6872 | 0 | 0.7567 | 0 | 0.0370 | 0 | 0.4000 | 55 | 55.1675 |
| 50 | 50.1489 | 60 | 60.6732 | 50 | 50.5052 | 0 | 0.9281 | 0 | 0.2362 | 0 | 0.2378 | 0 | 0.1402 | 40 | 40.1336 |
| 55 | 55.6802 | 0 | 0.5803 | 45 | 45.5780 | 30 | 30.7838 | 0 | 0.8557 | 70 | 70.7285 | 0 | 0.9178 | 0 | 0.9562 |
| 60 | 60.3997 | 0 | 0.1954 | 40 | 40.5334 | 90 | 90.5645 | 0 | 0.4622 | 10 | 10.7957 | 0 | 0.6351 | 0 | 0.4161 |
| 65 | 65.2189 | 0 | 0.8662 | 35 | 35.1642 | 25 | 25.0627 | 0 | 0.2284 | 0 | 0.8243 | 0 | 0.4157 | 75 | 75.2045 |
| 70 | 70.6607 | 0 | 0.7815 | 30 | 30.1545 | 90 | 90.9765 | 0 | 0.0372 | 0 | 0.1148 | 0 | 0.1682 | 10 | 10.0996 |
| 75 | 75.6053 | 0 | 0.4562 | 25 | 25.5907 | 0 | 0.3221 | 0 | 0.9140 | 40 | 40.1615 | 0 | 0.8996 | 60 | 60.0079 |
| 80 | 80.6537 | 0 | 0.3388 | 20 | 20.7869 | 0 | 0.2980 | 0 | 0.8735 | 75 | 75.1267 | 0 | 0.6834 | 25 | 25.2053 |
| 85 | 85.5384 | 0 | 0.2130 | 15 | 15.1296 | 0 | 0.8131 | 0 | 0.8869 | 95 | 95.7242 | 0 | 0.4242 | 5 | 5.2522 |
| 90 | 90.7981 | Test | 10 | 10.0152 | Test | 0 | 0.9475 | Test | 0 | 0.1989 | Test | ||||
| 95 | 95.2433 | Target | Output | 5 | 5.6774 | Target | Output | 0 | 0.0524 | Target | Output | 0 | −0.0373 | Target | Output |
| 5 | 5.7691 | 10 | 10.0963 | 0 | 0.2924 | 0 | 0.1449 | 95 | 95.3581 | 90 | 90.0206 | 0 | 0.6137 | 0 | 0.7854 |
| 20 | 20.9692 | 75 | 75.3825 | 0 | 0.9871 | 0 | 0.2932 | 80 | 80.3520 | 25 | 25.8914 | 0 | 0.7352 | 0 | 0.4598 |
| 25 | 25.8302 | 35 | 35.3142 | 0 | 0.1070 | 0 | 0.6704 | 75 | 75.2338 | 0 | 0.5532 | 0 | 0.8594 | 65 | 65.2154 |
| 30 | 30.0729 | 55 | 55.2824 | 0 | 0.4603 | 0 | 0.8266 | 70 | 70.9220 | 0 | 0.9220 | 0 | 0.5587 | 45 | 45.9522 |
| 40 | 40.2206 | 70 | 70.1186 | 0 | 0.7534 | 0 | 0.5823 | 60 | 60.0233 | 0 | 0.8444 | 0 | 0.9862 | 30 | 30.4423 |
| 45 | 45.2943 | 75 | 75.7724 | 0 | 0.2841 | 0 | 0.2891 | 55 | 55.7898 | 0 | 0.7327 | 0 | 0.6064 | 25 | 25.5066 |
| 50 | 50.4005 | 85 | 85.8925 | 0 | 0.5841 | 0 | 0.3978 | 50 | 50.6236 | 0 | 0.8367 | 0 | 0.3638 | 15 | 15.9047 |
| 65 | 65.2375 | 0 | 0.6401 | 0 | 0.5907 | 5 | 5.3456 | 35 | 35.4429 | 95 | 95.4732 | 0 | 0.7297 | 0 | 0.5678 |
| 70 | 70.4170 | 0 | 0.9915 | 0 | 0.1090 | 15 | 15.2002 | 30 | 30.4238 | 85 | 85.6029 | 0 | 0.0655 | 0 | 0.2494 |
| 85 | 85.9635 | 0 | 0.2781 | 0 | 0.5994 | 40 | 40.5686 | 15 | 15.1449 | 60 | 60.7102 | 0 | 0.3174 | 0 | 0.4820 |
| 90 | 90.4796 | 0 | 0.2070 | 0 | 0.8356 | 55 | 55.9146 | 10 | 10.8898 | 45 | 45.5192 | 0 | 0.7994 | 0 | 0.3714 |
| 95 | 95.7340 | 0 | 0.2397 | 0 | 0.0471 | 75 | 75.8077 | 5 | 5.9287 | 25 | 25.4674 | 0 | 0.2552 | 0 | 0.4647 |
| 10 | 10.4268 | 0 | 0.3804 | 0 | 0.3282 | 15 | 15.3373 | 0 | 0.0031 | 0 | 0.7534 | 90 | 90.1902 | 85 | 85.4777 |
| 15 | 15.3218 | 0 | 0.6327 | 0 | 0.1551 | 30 | 30.4061 | 0 | 0.0505 | 0 | 0.4754 | 85 | 85.4217 | 70 | 70.4645 |
| 20 | 20.6227 | 0 | 0.5955 | 0 | 0.3584 | 40 | 40.7944 | 0 | 0.4310 | 0 | 0.4587 | 80 | 80.5661 | 60 | 60.1754 |
| 25 | 25.3852 | 0 | 0.7034 | 0 | 0.3649 | 65 | 65.4100 | 0 | 0.1768 | 0 | 0.7419 | 75 | 75.0850 | 35 | 35.1766 |
| 30 | 30.8757 | 0 | 0.2561 | 0 | 0.1140 | 95 | 95.6657 | 0 | 0.0806 | 0 | 0.8931 | 70 | 70.9688 | 5 | 5.1572 |
| 40 | 40.9742 | 0 | −0.1749 | 0 | 0.0482 | 0 | 0.9053 | 0 | 0.3138 | 20 | 20.8780 | 60 | 60.7076 | 80 | 80.3878 |
| 50 | 50.0287 | - | - | 0 | 0.2554 | - | - | 0 | 0.3280 | - | - | 50 | 50.3917 | - | - |
| 65 | 65.4649 | - | - | 0 | 0.6128 | - | - | 0 | 0.2182 | - | - | 35 | 35.6784 | - | - |
| 80 | 80.1930 | - | - | 0 | 0.9640 | - | - | 0 | 0.2512 | - | - | 20 | 20.6160 | - | - |
| 90 | 90.8877 | - | - | 0 | 0.9461 | - | - | 0 | 0.0308 | - | - | 10 | 10.1557 | - | - |
| 95 | 95.2856 | - | - | 0 | 0.3720 | - | - | 0 | 0.8852 | - | - | 5 | 5.4375 | - | - |
| 0 | 0.8116 | - | - | 10 | 10.9860 | - | - | 90 | 90.2708 | - | - | 0 | 0.9674 | - | - |
| 0 | 0.1563 | - | - | 20 | 20.2464 | - | - | 80 | 80.6384 | - | - | 0 | 0.0074 | - | - |
| 0 | 0.3523 | - | - | 25 | 25.5626 | - | - | 75 | 75.2913 | - | - | 0 | 0.8436 | - | - |
| 0 | 0.8774 | - | - | 35 | 35.1213 | - | - | 65 | 65.8709 | - | - | 0 | 0.1757 | - | - |
| 0 | 0.7764 | - | - | 45 | 45.8156 | - | - | 55 | 55.4477 | - | - | 0 | 0.9914 | - | - |
| 0 | 0.4610 | - | - | 50 | 50.1615 | - | - | 50 | 50.8660 | - | - | 0 | 0.5332 | - | - |
| 0 | 0.0937 | - | - | 60 | 60.4247 | - | - | 40 | 40.1619 | - | - | 0 | 0.3229 | - | - |
| 0 | 0.3649 | - | - | 65 | 65.0956 | - | - | 35 | 35.3425 | - | - | 0 | 0.1906 | - | - |
| 0 | 0.6050 | - | - | 70 | 70.0008 | - | - | 30 | 30.0373 | - | - | 0 | 0.3430 | - | - |
| 0 | 0.8907 | - | - | 80 | 80.0561 | - | - | 20 | 20.2694 | - | - | 0 | 0.7588 | - | - |
| 0 | 0.9881 | - | - | 85 | 85.0471 | - | - | 15 | 15.9021 | - | - | 0 | 0.0350 | - | - |
| 0 | 0.8255 | - | - | 95 | 95.6633 | - | - | 5 | 5.6746 | - | - | 0 | 0.8099 | - | - |
| 0 | −0.3040 | - | - | 5 | 5.0832 | - | - | 0 | 0.0832 | - | - | 95 | 95.5449 | - | - |
| 0 | 0.6973 | - | - | 10 | 10.1651 | - | - | 0 | 0.6355 | - | - | 90 | 90.4770 | - | - |
| 0 | 0.7413 | - | - | 20 | 20.6047 | - | - | 0 | 0.0190 | - | - | 80 | 80.5796 | - | - |
| 0 | 0.1897 | - | - | 35 | 35.6512 | - | - | 0 | 0.6508 | - | - | 65 | 65.5103 | - | - |
| 0 | 0.8841 | - | - | 45 | 45.2931 | - | - | 0 | 0.0432 | - | - | 55 | 55.8189 | - | - |
| 0 | 0.1644 | - | - | 50 | 50.4422 | - | - | 0 | 0.5633 | - | - | 50 | 50.8786 | - | - |
| 0 | 0.4981 | - | - | 55 | 55.7387 | - | - | 0 | 0.2583 | - | - | 45 | 45.5543 | - | - |
| 0 | 0.0006 | - | - | 60 | 60.3096 | - | - | 0 | 0.1521 | - | - | 40 | 40.5810 | - | - |
| 0 | 0.7261 | - | - | 70 | 70.2379 | - | - | 0 | 0.9742 | - | - | 30 | 30.0793 | - | - |
| 0 | 0.1960 | - | - | 75 | 75.6808 | - | - | 0 | 0.9075 | - | - | 25 | 25.2178 | - | - |
| 0 | 0.1926 | - | - | 80 | 80.4320 | - | - | 0 | 0.7600 | - | - | 20 | 20.6035 | - | - |
| 0 | 0.5311 | - | - | 85 | 85.0690 | - | - | 0 | 0.0494 | - | - | 15 | 15.3289 | - | - |
| 0 | −0.7112 | - | - | 0 | 0.8132 | - | - | 5 | 5.9879 | - | - | 95 | 95.9897 | - | - |
| 0 | −0.8436 | - | - | 0 | 0.7161 | - | - | 10 | 10.7479 | - | - | 90 | 90.4273 | - | - |
| 0 | −0.9808 | - | - | 0 | 0.7233 | - | - | 15 | 15.4751 | - | - | 85 | 85.8016 | - | - |
| 0 | 0.4536 | - | - | 0 | 0.3547 | - | - | 25 | 25.3062 | - | - | 75 | 75.8660 | - | - |
| 0 | 0.1702 | - | - | 0 | 0.8403 | - | - | 30 | 30.2059 | - | - | 70 | 70.7492 | - | - |
| 0 | 0.8165 | - | - | 0 | 0.5051 | - | - | 35 | 35.7077 | - | - | 65 | 65.9260 | - | - |
| 0 | 0.9459 | - | - | 0 | 0.3093 | - | - | 45 | 45.7886 | - | - | 55 | 55.9010 | - | - |
| 0 | 0.4537 | - | - | 0 | 0.4437 | - | - | 50 | 50.4946 | - | - | 50 | 50.5521 | - | - |
| 0 | 0.9560 | - | - | 0 | 0.7649 | - | - | 55 | 55.1449 | - | - | 45 | 45.0799 | - | - |
| 0 | 0.3390 | - | - | 0 | 0.1744 | - | - | 60 | 60.1362 | - | - | 40 | 40.3001 | - | - |
| 0 | 0.6794 | - | - | 0 | 0.6930 | - | - | 65 | 65.8811 | - | - | 35 | 35.7006 | - | - |
| 0 | 0.0618 | - | - | 0 | 0.5073 | - | - | 70 | 70.7896 | - | - | 30 | 30.6033 | - | - |
| 0 | 0.6051 | - | - | 0 | 0.2804 | - | - | 80 | 80.3527 | - | - | 20 | 20.7391 | - | - |
| 0 | 0.8882 | - | - | 0 | 0.6390 | - | - | 85 | 85.5569 | - | - | 15 | 15.9040 | - | - |
| 0 | 0.0510 | - | - | 0 | 0.6310 | - | - | 90 | 90.1803 | - | - | 10 | 10.1328 | - | - |
| Ref | Extracted Features | Type of Neural Network | MSE | RMSE | ||
|---|---|---|---|---|---|---|
| Training | Testing | Training | Testing | |||
| [12] | Time domain | GMDH | 1.24 | 1.20 | 1.11 | 1.09 |
| [13] | Time domain | MLP | 0.21 | 0.036 | 0.46 | 0.6 |
| [14] | Lack of feature extraction | GMDH | 7.34 | 4.92 | 2.71 | 2.21 |
| [15] | Lack of feature extraction | RBF | 0.049 | 0.37 | 0.22 | 0.19 |
| [25] | Frequency domain | MLP | 0.17 | 0.67 | 0.42 | 0.82 |
| [26] | Lack of feature extraction | MLP | 2.56 | 2.56 | 1.6 | 1.6 |
| [current study] | Frequency domain | MLP | 0.41 | 0.45 | 0.66 | 0.67 |
Publisher’s Note: MDPI stays neutral with regard to jurisdictional claims in published maps and institutional affiliations. |
© 2022 by the authors. Licensee MDPI, Basel, Switzerland. This article is an open access article distributed under the terms and conditions of the Creative Commons Attribution (CC BY) license (https://creativecommons.org/licenses/by/4.0/).
Share and Cite
Mayet, A.M.; Nurgalieva, K.S.; Al-Qahtani, A.A.; Narozhnyy, I.M.; Alhashim, H.H.; Nazemi, E.; Indrupskiy, I.M. Proposing a High-Precision Petroleum Pipeline Monitoring System for Identifying the Type and Amount of Oil Products Using Extraction of Frequency Characteristics and a MLP Neural Network. Mathematics 2022, 10, 2916. https://doi.org/10.3390/math10162916
Mayet AM, Nurgalieva KS, Al-Qahtani AA, Narozhnyy IM, Alhashim HH, Nazemi E, Indrupskiy IM. Proposing a High-Precision Petroleum Pipeline Monitoring System for Identifying the Type and Amount of Oil Products Using Extraction of Frequency Characteristics and a MLP Neural Network. Mathematics. 2022; 10(16):2916. https://doi.org/10.3390/math10162916
Chicago/Turabian StyleMayet, Abdulilah Mohammad, Karina Shamilyevna Nurgalieva, Ali Awadh Al-Qahtani, Igor M. Narozhnyy, Hala H. Alhashim, Ehsan Nazemi, and Ilya M. Indrupskiy. 2022. "Proposing a High-Precision Petroleum Pipeline Monitoring System for Identifying the Type and Amount of Oil Products Using Extraction of Frequency Characteristics and a MLP Neural Network" Mathematics 10, no. 16: 2916. https://doi.org/10.3390/math10162916
APA StyleMayet, A. M., Nurgalieva, K. S., Al-Qahtani, A. A., Narozhnyy, I. M., Alhashim, H. H., Nazemi, E., & Indrupskiy, I. M. (2022). Proposing a High-Precision Petroleum Pipeline Monitoring System for Identifying the Type and Amount of Oil Products Using Extraction of Frequency Characteristics and a MLP Neural Network. Mathematics, 10(16), 2916. https://doi.org/10.3390/math10162916