
Statistical Inference of Wiener Constant-Stress Accelerated Degradation Model with Random Effects


Abstract
:1. Introduction
2. Wiener CSADT Model with Random Effects
2.1. Model Descriptions and Assumptions
- A1.
- The CSADT is conducted by one single stress, which has K levels: . and are the normal using stress level and the highest stress level used in the ADT, respectively.
- A2.
- Under stress level , the degradation process of the jth test unit can be described as a Wiener process
- A3.
- At stress levels and , the degradation process has the same degradation mechanism. This means that the diffusion parameters and are not affected by the stress level , but the drift parameter is affected by it.
- A4.
- The product’s degradation process is affected by the stress through the parameter–stress relationshipwhere a and are unknown parameters. The degradation rate under normal using condition can be given by .
- A5.
- At each stress level, the test units have the same test duration, but the measurement intervals and the measurement times are different for each unit. Generally, at different stress levels, the testing durations of units are different.
2.2. CSADT and the Data
3. Point and Interval Estimations
3.1. Point Estimations for Model Parameters
- (1)
- The estimates of parameters a and b are given aswhere
- (2)
- The estimates and are unbiased, that is, .
- (3)
- The variance and covariance of the estimates and are given by
3.2. GCIs for Model Parameters and
| Algorithm 1 Percentiles for model parameters a, b, and . |
|
3.3. GCIs for , and MTTF
| Algorithm 2 Percentiles for quantities , and MTTF. |
|
3.4. GPI for Degradation Characteristic
| Algorithm 3 Percentile for degradation characteristic . |
|
4. Simulation Study and Data Analysis
4.1. Simulation Study
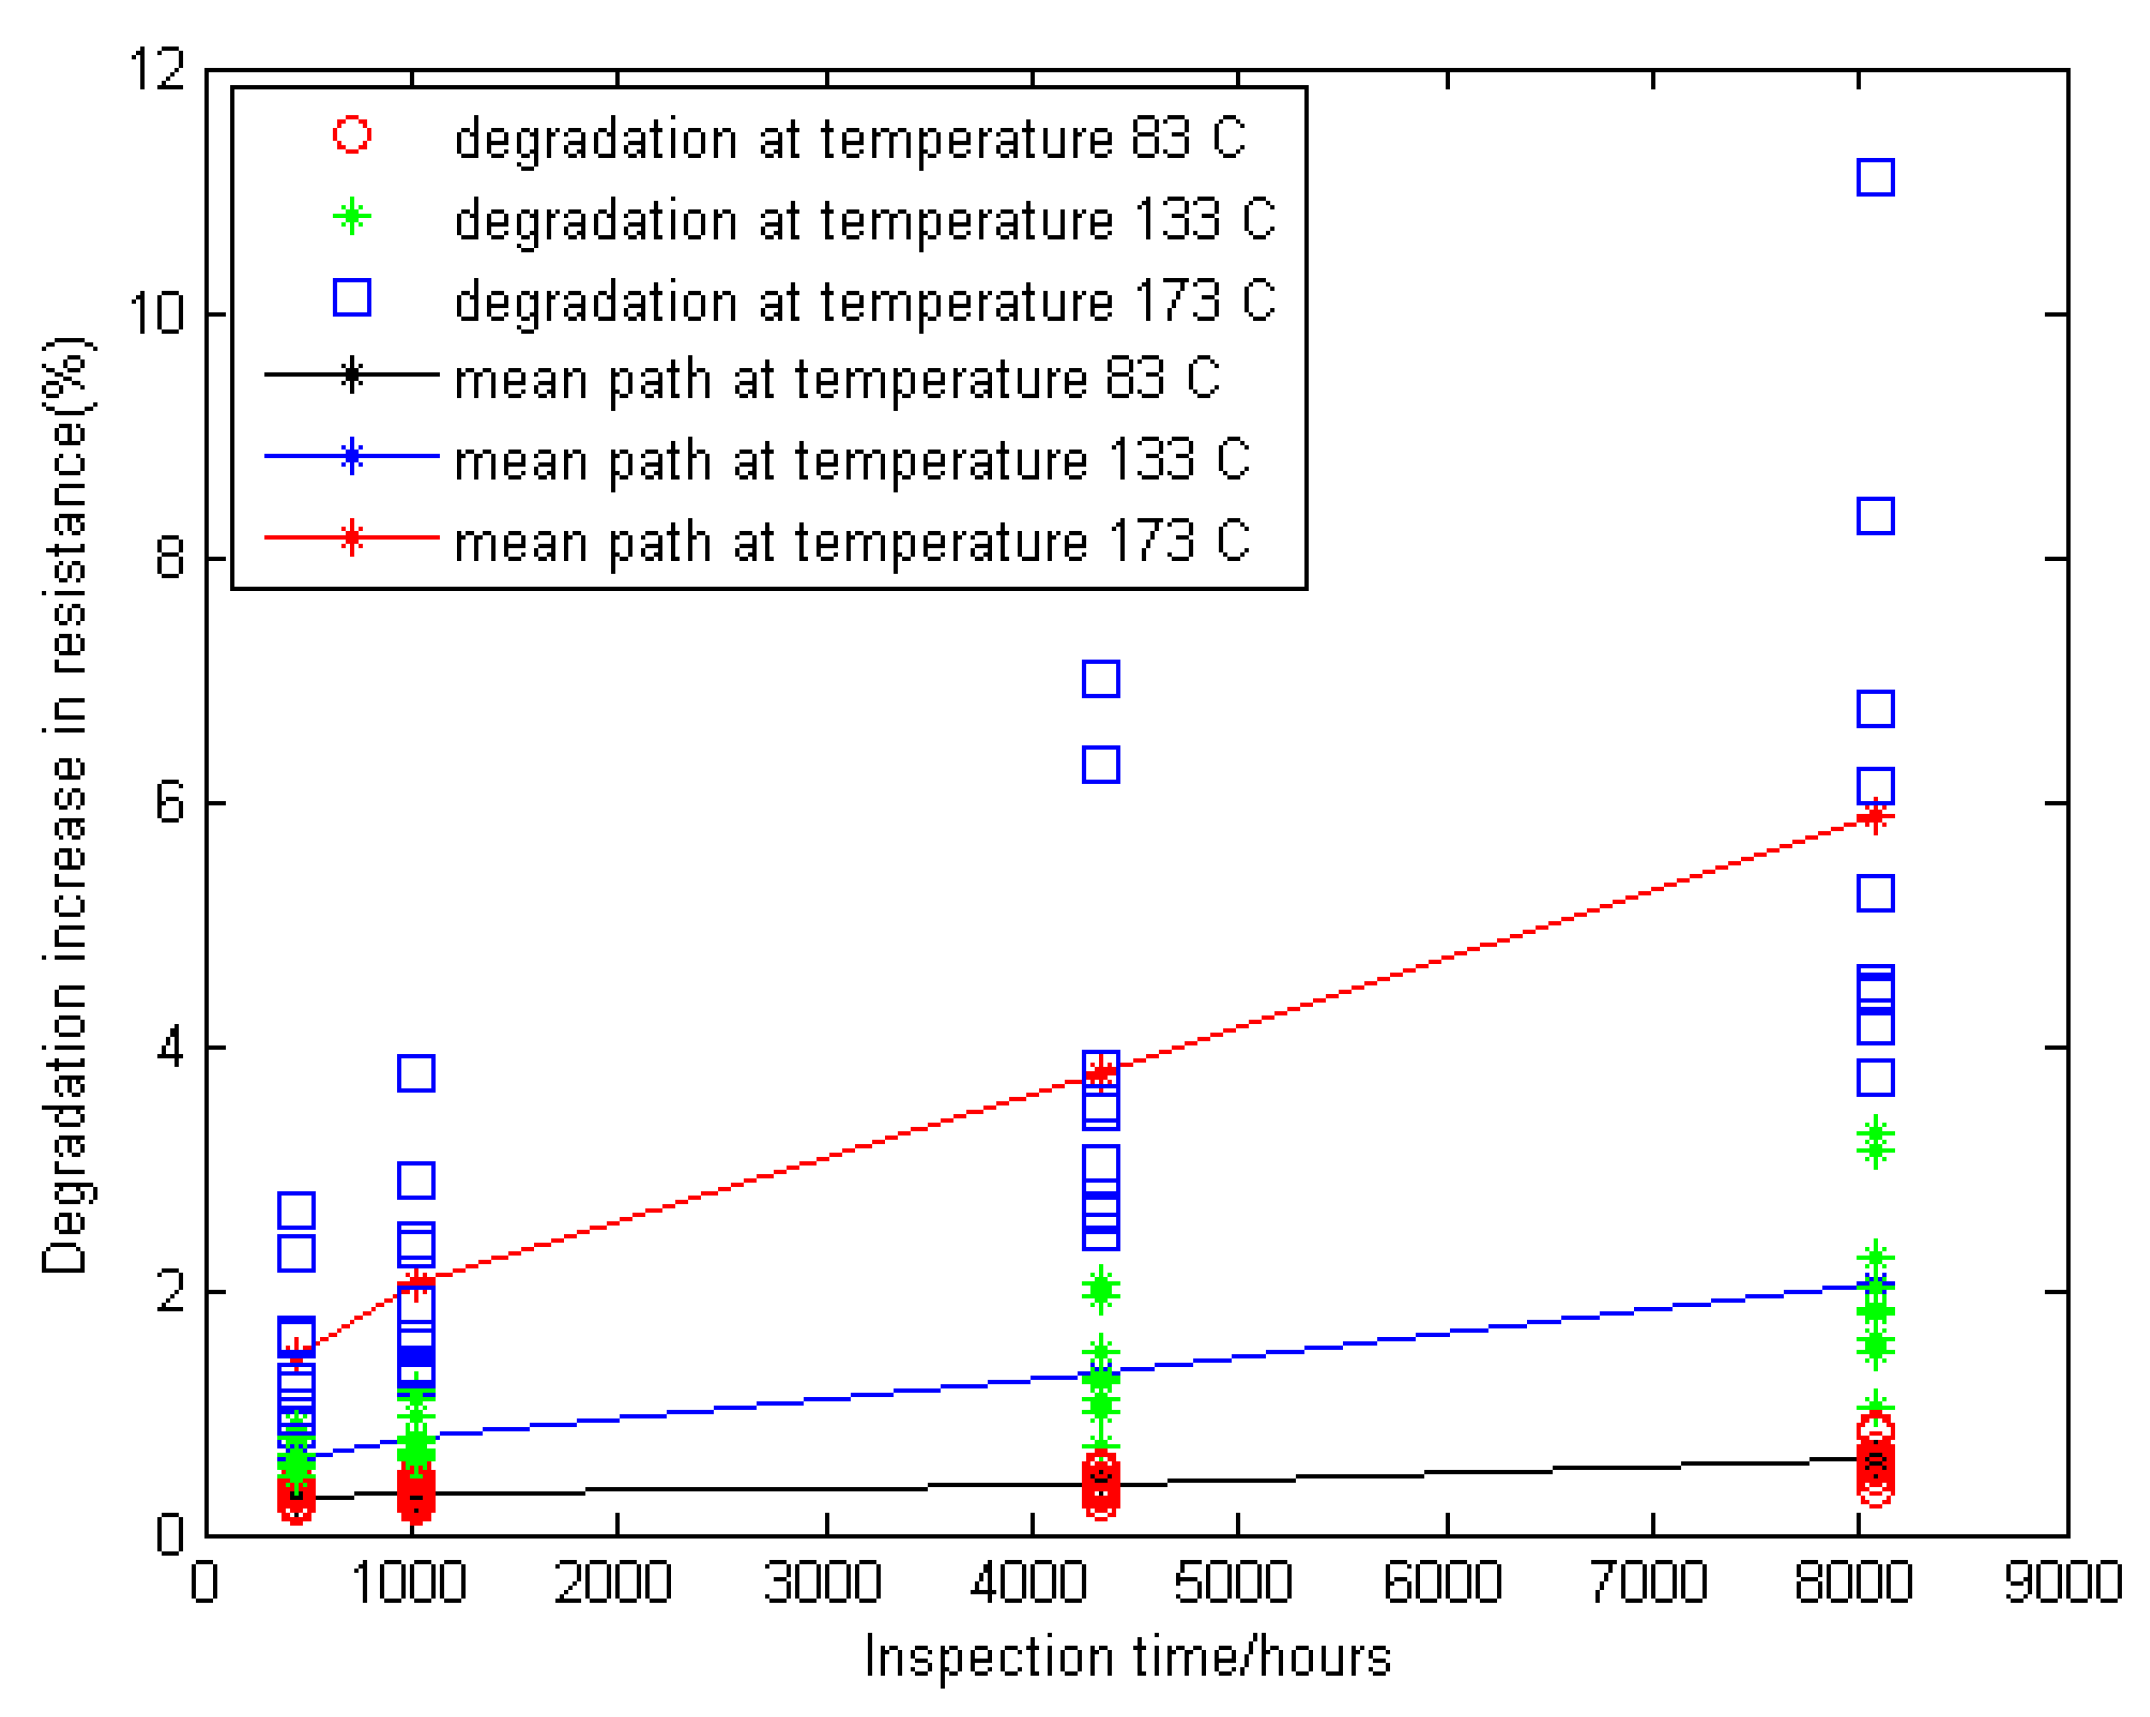
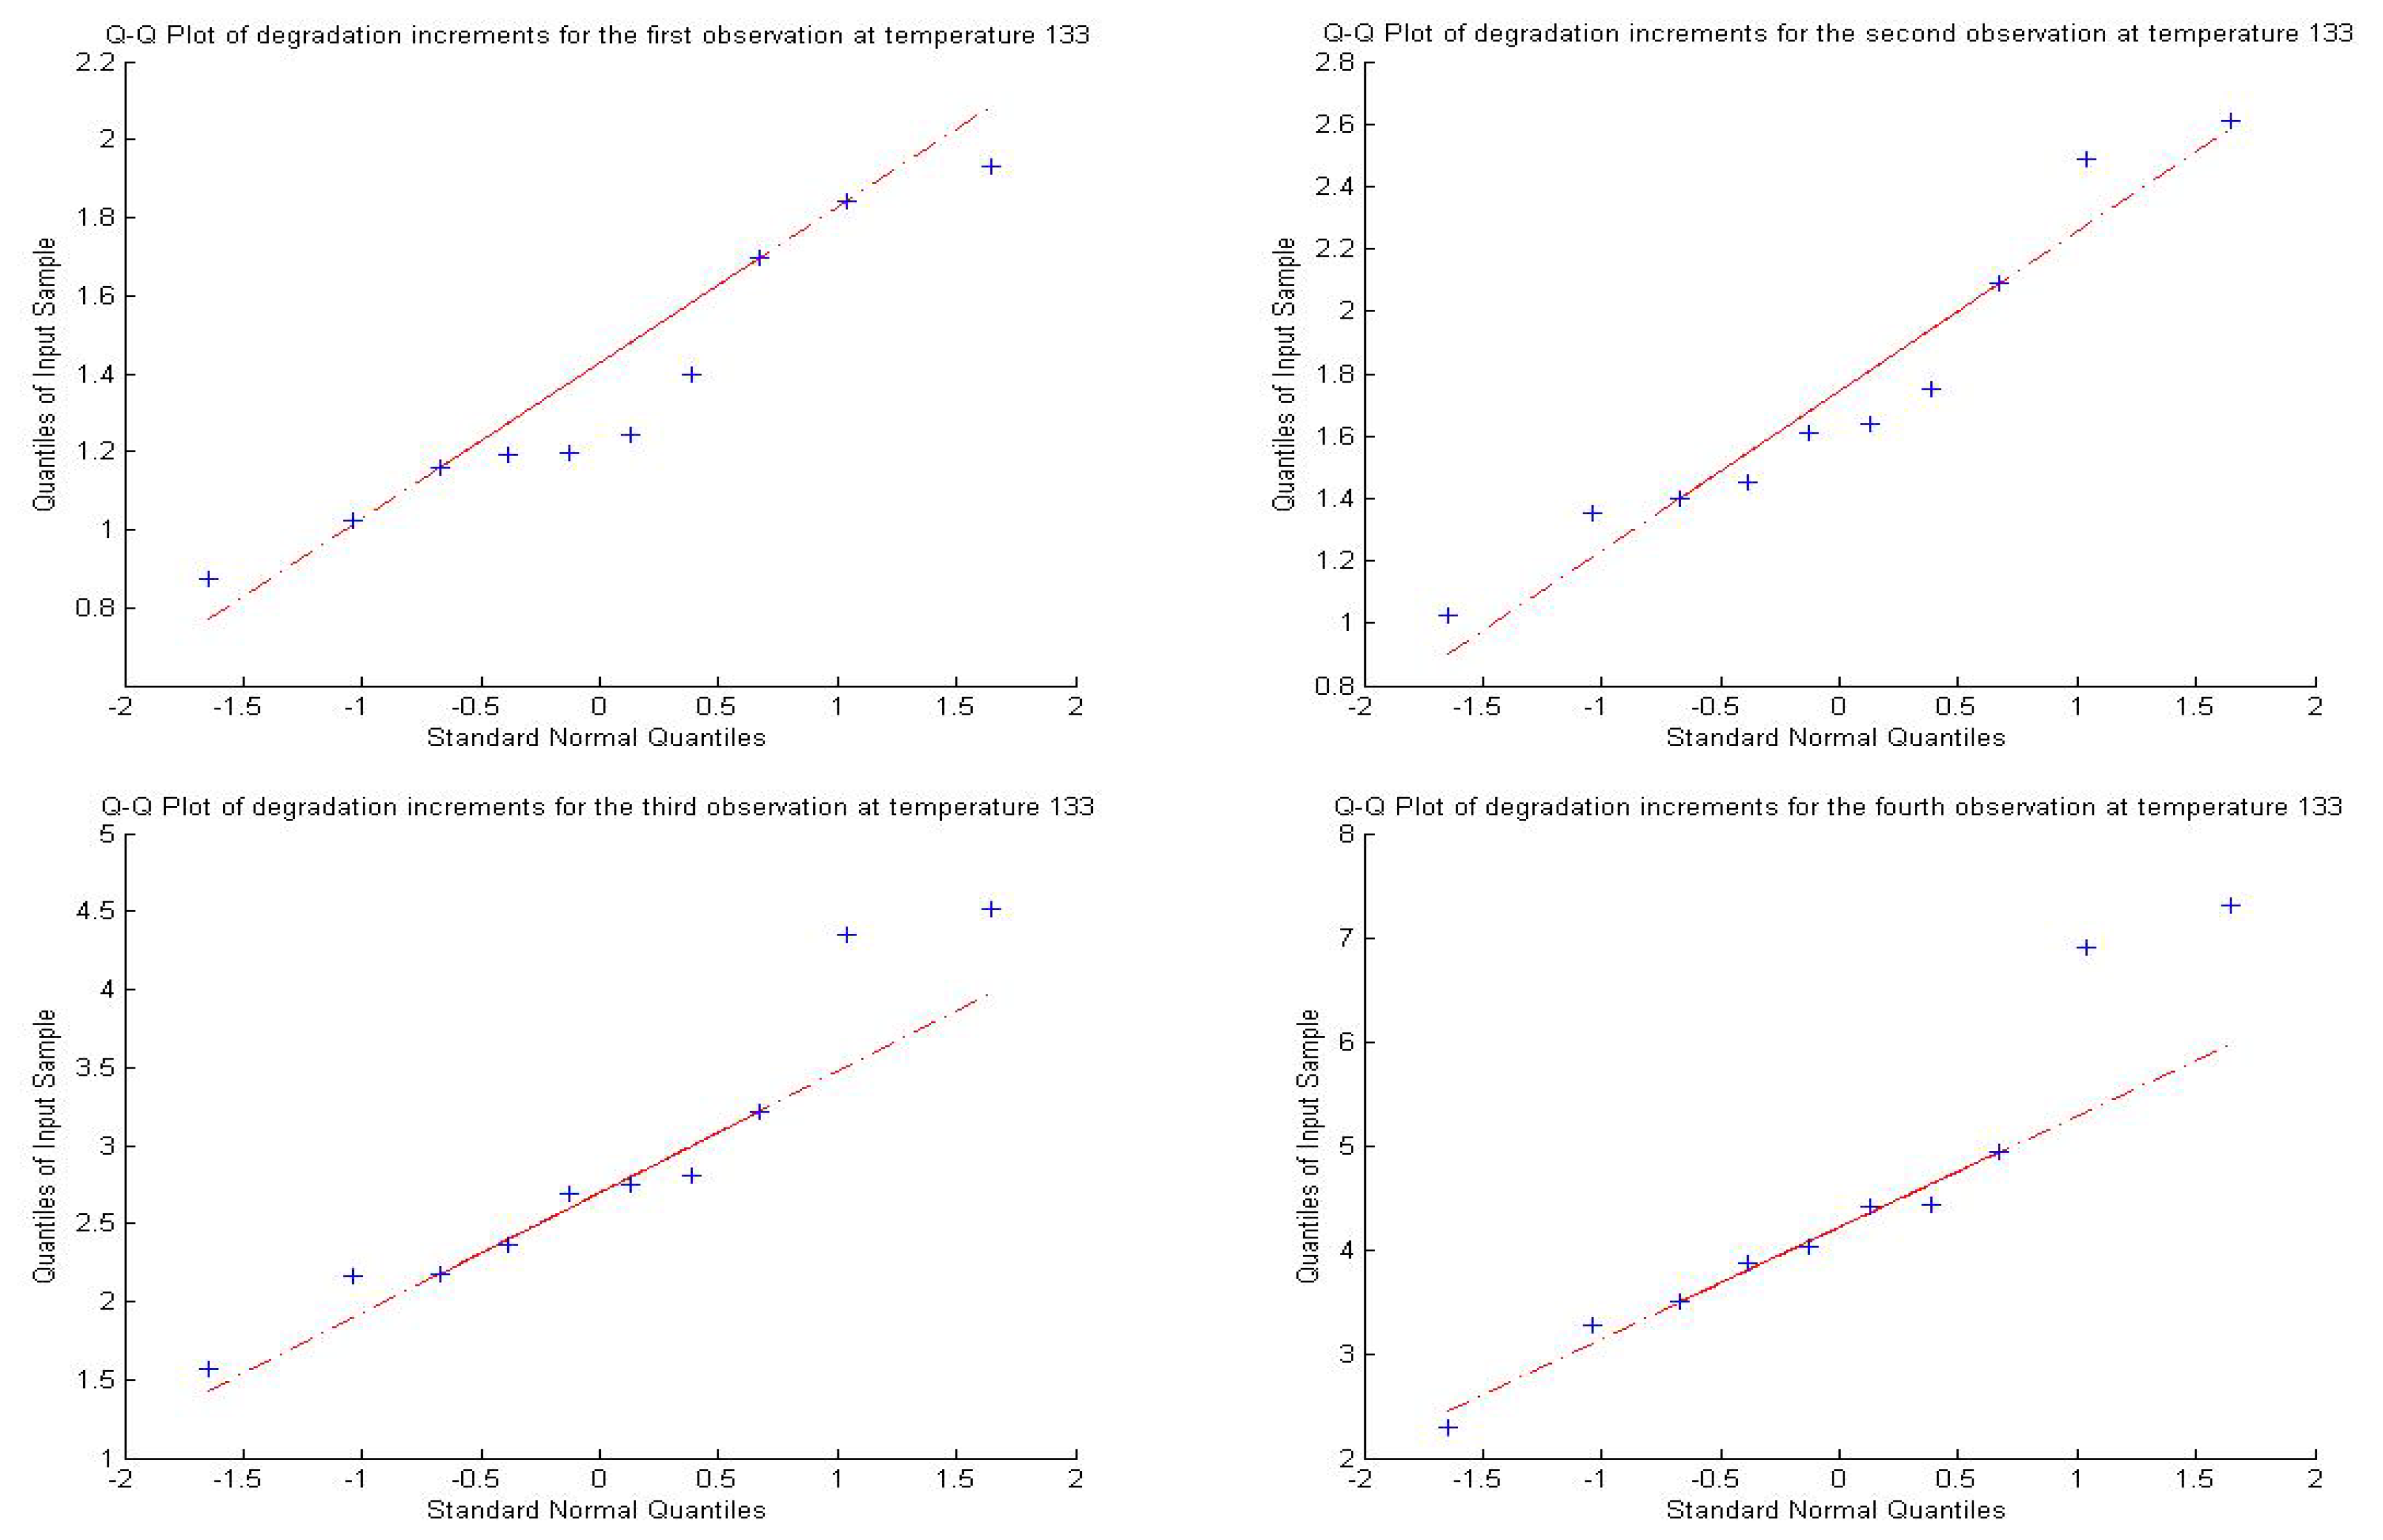
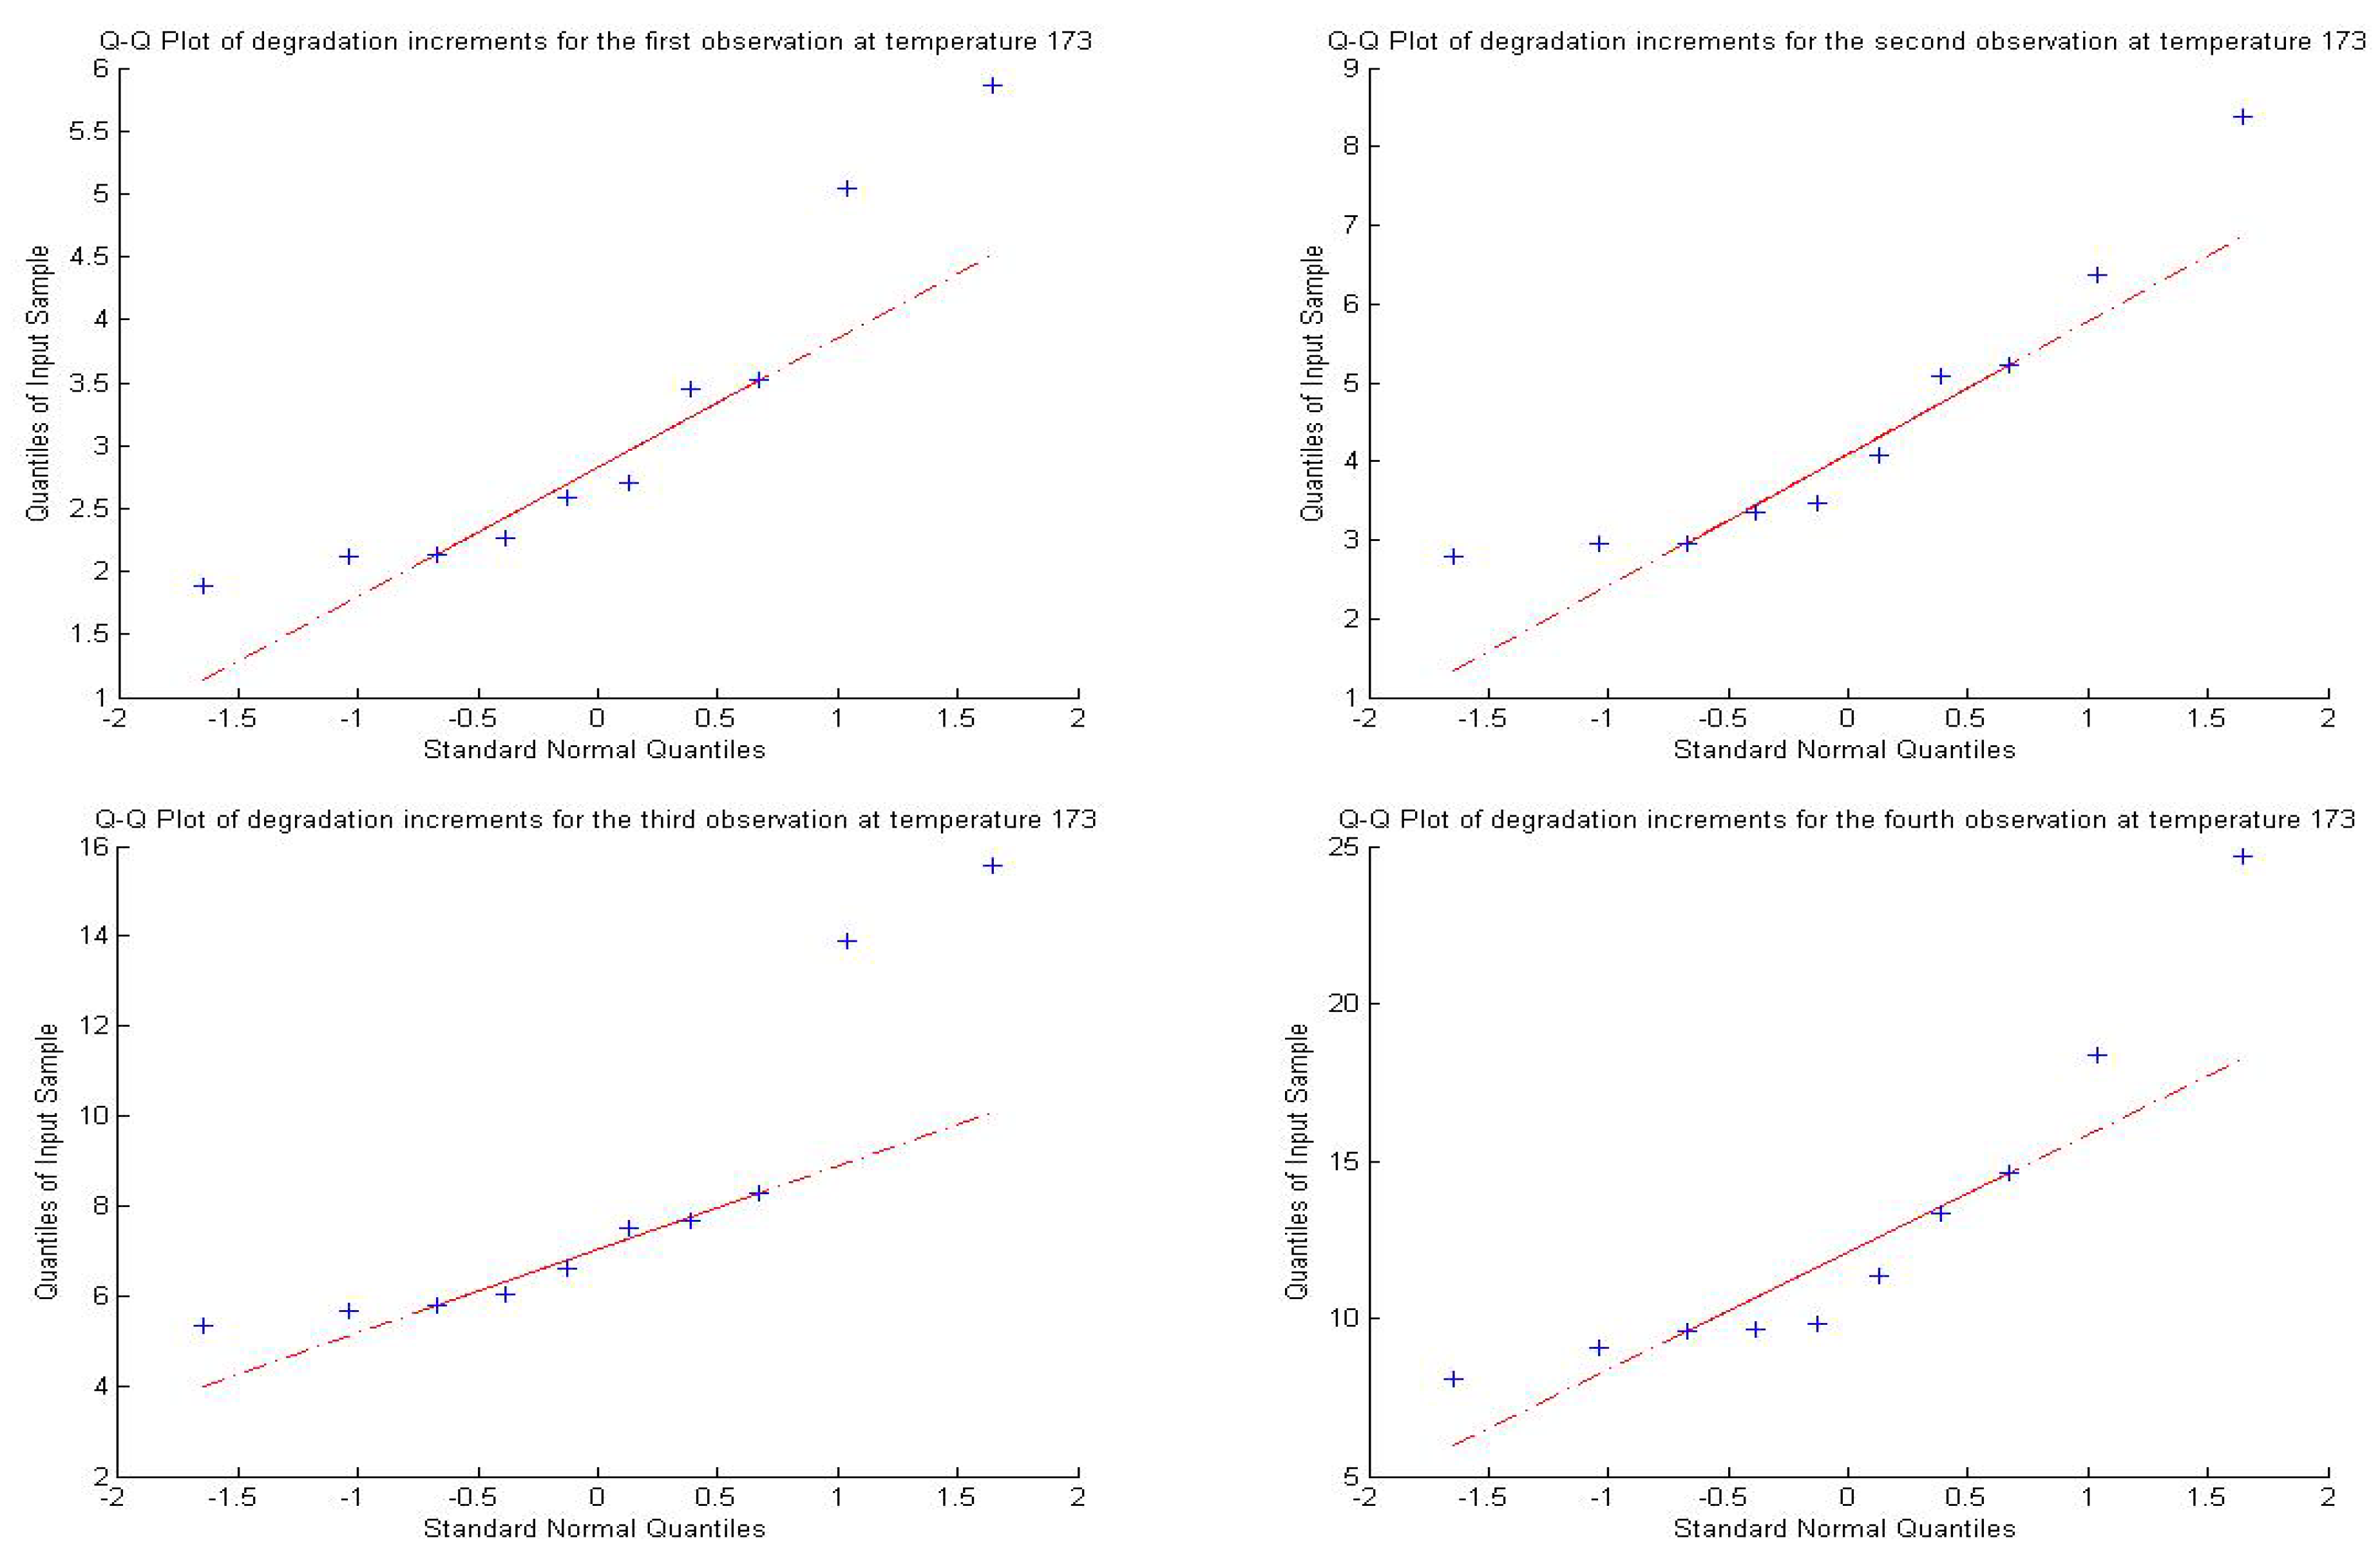
4.2. Real Data Analysis
5. Conclusions
Funding
Institutional Review Board Statement
Informed Consent Statement
Data Availability Statement
Acknowledgments
Conflicts of Interest
References
- Wang, H.; Wang, G.J.; Duan, F.J. Planning of step-stress accelerated degradation test based on the Inverse Gaussian process. Reliab. Eng. Syst. Safe 2016, 154, 97–105. [Google Scholar] [CrossRef]
- Bae, S.J.; Kuo, W.; Kvam, P.H. Degradation models and implied lifetime distribution. Reliab. Eng. Syst. Safe 2007, 92, 601–608. [Google Scholar] [CrossRef]
- Nelson, W. Analysis of performance-degradation data from accelerated tests. IEEE Trans. Reliab. 1981, 30, 89–99. [Google Scholar] [CrossRef]
- Wang, L.; Pan, R.; Li, X.; Jiang, T.A. Bayesian reliability evaluation method with integrated accelerated degradation testing and field information. Reliab. Eng. Syst. Safe 2013, 112, 38–47. [Google Scholar] [CrossRef]
- Shi, Y.; Meeker, W.Q. Bayesian methods for accelerated destructive degradation test planning. IEEE Trans. Reliab. 2012, 61, 245–253. [Google Scholar] [CrossRef] [Green Version]
- Meeker, W.Q.; Escobar, L.A.; Lu, C.J. Accelerated degradation tests: Modeling and analysis. Technometrics 1998, 40, 89–99. [Google Scholar] [CrossRef]
- Meeker, W.Q.; Escobar, L.A. Statistical Methods for Reliability Data; John Wiley & Sons: New York, NY, USA, 1998. [Google Scholar]
- Jiang, P.H.; Wang, B.X.; Wu, F.T. Inference for constant-stress accelerated degradation test based on Gamma process. Appl. Math. Model. 2019, 67, 123–134. [Google Scholar] [CrossRef]
- Pan, Z.; Balakrishnan, N. Reliability modeling of degradation of products with multiple performance characteristics based on gamma process. Reliab. Eng. Syst. Safe 2011, 96, 949–957. [Google Scholar] [CrossRef]
- Lawless, J.; Crowder, M. Covariates and random effects in a gamma process model with ap plication to degradation and failure. Lifetime Data Anal. 2004, 10, 213–227. [Google Scholar] [CrossRef]
- Pan, D.H.; Liu, J.B.; Yang, W.Z. A new result on lifetime estimation based on skew-Wiener degradation model. Stat. Probabil. Lett. 2018, 138, 157–164. [Google Scholar] [CrossRef]
- Ye, Z.S.; Chen, N.; Shen, Y. A new class of Wiener process models for degradation analysis. Reliab. Eng. Syst. Safe 2015, 139, 58–67. [Google Scholar] [CrossRef]
- Wang, X. Wiener process with random effects for degradation data. J. Multivar. Anal. 2010, 101, 340–351. [Google Scholar] [CrossRef] [Green Version]
- Pan, D.H.; Liu, J.B.; Cao, J.D. Remaining useful life estimation using an inverse Gaussian degradation model. Neurocomputing 2016, 185, 64–72. [Google Scholar] [CrossRef] [Green Version]
- Ye, Z.S.; Chen, L.P.; Tang, L.C.; Xie, M. Accelerated degradation test planning using the Inverse Gaussian process. IEEE Trans. Reliab. 2014, 63, 750–763. [Google Scholar] [CrossRef]
- Wang, X.; Xu, D. An inverse Gaussian process model for degradation data. Technometrics 2010, 52, 188–197. [Google Scholar] [CrossRef]
- Jiang, P.H.; Wang, B.X.; Wang, X.F.; Zhou, Z.H. Inverse Gaussian process based reliability analysis for constant-stress accelerated degradation data. Appl. Math. Model. 2022, 105, 137–148. [Google Scholar] [CrossRef]
- Doksum, K.A.; Hyland, A. Models for Variable-Stress accelerated life testing experiments based on Wiener process and Inverse Gaussian distribution. Technometrics 1992, 34, 74–82. [Google Scholar] [CrossRef]
- Doksum, K.A.; Normand, S.L.T. Gaussian Models for degradation processes-Part I: Models for the analysis of Biomarker data. Lifetime Data Anal. 1995, 1, 131–144. [Google Scholar] [CrossRef]
- Padgett, W.J.; Tomlinson, M.A. Inference from accelerated degradation and failure data based on Gaussian process models. Lifetime Data Anal. 2004, 10, 191–206. [Google Scholar] [CrossRef]
- Peng, C.Y.; Tseng, S.T. Mis-Specification analysis of linear degradation models. IEEE Trans. Reliab. 2009, 58, 444–455. [Google Scholar] [CrossRef]
- Pan, Z.; Balakrishnan, N. Multiple-steps step-stress accelerated degradation modeling based on wiener and gamma process. Commun. Stat.-Simul. C 2010, 39, 1384–1402. [Google Scholar] [CrossRef]
- Wang, X.F.; Wang, B.X.; Jiang, P.H.; Hong, Y.L. Accurate reliability inference based on Wiener process with random effects for degradation data. Reliab. Eng. Syst. Safe 2020, 193, 1–8. [Google Scholar] [CrossRef]
- Guan, Q.; Tang, Y.C.; Xu, A.C. Objective Bayesian analysis accelerated degradation test based on Wiener process models. Appl. Math. Model. 2016, 40, 2743–2755. [Google Scholar] [CrossRef]
- Wang, X.F.; Wang, B.X.; Wu, W.H.; Hong, Y.L. Reliability analysis for accelerated degradation data based on the Wiener process with random effects. Qual. Reliab. Eng. Int. 2020, 36, 1969–1981. [Google Scholar] [CrossRef]
- Pan, D.H.; Wei, Y.T.; Fang, H.Z.; Yang, W.Z. A reliability estimation approach via Wiener degradation model with measurement errors. Appl. Math. Comput. 2018, 320, 131–141. [Google Scholar] [CrossRef]
- Jiang, P.H.; Wang, B.X.; Wang, X.F.; Qin, S.D. Optimal plan for Wiener constant-stress accelerated degradation model. Appl. Math. Model. 2020, 84, 191–201. [Google Scholar] [CrossRef]
- Wang, X. A pseudo-likelihood estimation method for nonhomogeneous gamma process model with random effects. Stat. Sin. 2008, 18, 1153–1163. [Google Scholar]
- Liao, H.; Tian, Z. A framework for predicting the remaining useful life of a single unit under time-varying operating conditions. IIE. Trans. 2013, 45, 964–980. [Google Scholar] [CrossRef]
- Ye, Z.S.; Xie, M. Stochastic modeling and analysis of degradation for highly reliable products. Appl. Stoch. Model. Bus. 2015, 31, 16–32. [Google Scholar] [CrossRef]
- Bian, L.; Desmond, A.F.; Kharoufeh, J.P. Degradation modeling for real-time estimation of residual lifetimes in dynamic environments. IIE. Trans. 2015, 47, 471–486. [Google Scholar] [CrossRef]
- Hu, J.M.; Barker, D.; Dasgupta, A. Role of faliure-mechanism identification in accelerated testing. Reliab. Maintainab. Symp. IEEE 1993, 12, 181–188. [Google Scholar]
- Escobar, L.A.; Meeker, W.Q. A review of accelerated test models. Stat. Sci. 2006, 21, 552–577. [Google Scholar] [CrossRef] [Green Version]
- Weerahandi, S. Generalized Inference in Repeated Measures: Exact Methods in MANOVA and MIXed Models; Wiley: Hoboken, NJ, USA, 2004. [Google Scholar]
- Weerahandi, S. Generalized confidence intervals. J. Am. Stat. Assoc. 1993, 88, 899–905. [Google Scholar] [CrossRef]
- Lim, H.; Yum, B.J. Optional design of accelerated degradation tests based on Wiener processmodels. J. Appl. Stat. 2011, 38, 309–325. [Google Scholar] [CrossRef]


| Parameter | a | b | L | ||
|---|---|---|---|---|---|
| −0.90 | 2.00 | 1.00 | 0.50 | 6.30 | |
| −0.40 | 1.40 | 1.21 | 0.64 | 7.92 | |
| −1.10 | 2.60 | 1.50 | 1.00 | 8.75 | |
| 0.20 | 0.80 | 1.96 | 1.21 | 11.55 |
| Case | 0.9 | 0.95 | 0.9 | 0.95 | |
|---|---|---|---|---|---|
| a | b | ||||
| II | 0.9020 (2.2480) | 0.9524 (2.7191) | 0.9025 (1.2222) | 0.9530 (1.4783) | |
| 0.9034 (1.7128) | 0.9512 (2.0598) | 0.8982 (0.9315) | 0.9508 (1.1203) | ||
| 0.9002 (1.4283) | 0.9496 (1.7133) | 0.9000 (0.7767) | 0.9486 (0.9317) | ||
| III | 0.9026 (2.7391) | 0.9528 (3.3134) | 0.9036 (1.4894) | 0.9532 (1.8013) | |
| 0.8962 (2.1017) | 0.9468 (2.5265) | 0.8968 (1.1415) | 0.9465 (1.3727) | ||
| 0.9020 (1.7548) | 0.9464 (2.1049) | 0.9028 (0.9535) | 0.9474 (1.1438) | ||
| IV | 0.9022(3.0371) | 0.9532 (3.6738) | 0.9034 (1.6514) | 0.9528 (1.9972) | |
| 0.9022 (2.3226) | 0.9510 (2.7931) | 0.8978 (1.2630) | 0.9502 (1.5190) | ||
| 0.8996 (1.9413) | 0.9494 (2.3286) | 0.9000 (1.0557) | 0.9488 (1.2663) | ||
| II | 0.8960 (0.5277) | 0.9478 (0.6329) | 0.8955 (1.0175) | 0.9462 (1.2647) | |
| 0.9014 (0.3588) | 0.9516 (0.4288) | 0.8988 (0.7180) | 0.9472 (0.8780) | ||
| 0.8996 (0.2730) | 0.9462 (0.3259) | 0.8966 (0.5719) | 0.9494 (0.6943) | ||
| III | 0.8965 (0.6542) | 0.9478 (0.7846) | 0.8964 (1.5096) | 0.9460 (1.8765) | |
| 0.8952 (0.4433) | 0.9466 (0.5298) | 0.8970 (1.0757) | 0.9474 (1.3155) | ||
| 0.9034 (0.3382) | 0.9508 (0.4037) | 0.9032 (0.8624) | 0.9534 (1.0469) | ||
| IV | 0.8970 (0.8548) | 0.9478 (1.0253) | 0.8968 (1.8565) | 0.9466 (2.3076) | |
| 0.9014 (0.5811) | 0.9516 (0.6946) | 0.8994 (1.3196) | 0.9468 (1.6135) | ||
| 0.8996 (0.4423) | 0.9462 (0.5279) | 0.8976 (1.0563) | 0.9498 (1.2823) | ||
| Case | 0.9 | 0.95 | 0.9 | 0.95 | |
|---|---|---|---|---|---|
| II | 0.9026 (1.6778) | 0.9510 (2.0295) | 0.9008 (0.3429) | 0.9510 (0.4117) | |
| 0.9030 (1.2783) | 0.9498 (1.5372) | 0.9024 (0.2622) | 0.9530 (0.3156) | ||
| 0.9022 (0.7888) | 0.9512 (0.9144) | 0.9036 (0.2037) | 0.9548 (0.2464) | ||
| III | 0.9030 (1.2064) | 0.9522 (1.4303) | 0.8955 (0.3205) | 0.9462 (0.3525) | |
| 0.8966 (0.9632) | 0.9472 (1.1328) | 0.8968 (0.2416) | 0.9464 (0.2939) | ||
| 0.9000 (0.8405) | 0.9464 (0.9819) | 0.9048 (0.1999) | 0.9466 (0.2428) | ||
| IV | 0.9025 (1.6519) | 0.9516 (1.9286) | 0.9028 (0.2632) | 0.9538 (0.3054) | |
| 0.9026 (1.3713) | 0.9500 (1.5889) | 0.9036 (0.2556) | 0.9526 (0.3086) | ||
| 0.9022 (1.2030) | 0.9510 (1.3941) | 0.9038 (0.2121) | 0.9528 (0.2557) | ||
| MTTF | |||||
| II | 0.9022 (5.8332 × ) | 0.9532 (6.6712 × ) | 0.9002 (27.6940) | 0.9500 (33.5407) | |
| 0.9018 (4.8620 × ) | 0.9500 (5.6348 × ) | 0.8992 (26.0592) | 0.9466 (31.3321) | ||
| 0.9002 (2.9923 × ) | 0.9502 (3.3542 × ) | 0.9032 (24.7582) | 0.9534 (29.6830) | ||
| III | 0.9032 (3.3393 × ) | 0.9536 (3.7233 × ) | 0.8964 (31.7443) | 0.9508 (38.4358) | |
| 0.8968 (2.9464 × ) | 0.9464 (3.3212 × ) | 0.8966 (30.6825) | 0.9518 (36.8906) | ||
| 0.9014 (2.7190 × ) | 0.9478 (3.0730 × ) | 0.8952 (30.1169) | 0.9460 (36.1111) | ||
| IV | 0.9032 (3.6767 × ) | 0.9528 (4.0445 × ) | 0.8990 (35.8711) | 0.9514 (43.4082) | |
| 0.9012 (3.3915 × ) | 0.9520 (3.7657 × ) | 0.8976 (34.5438) | 0.9478 (41.5150) | ||
| 0.8982 (3.1433 × ) | 0.9500 (3.5266 × ) | 0.9032 (33.7932) | 0.9530 (40.5162) | ||
| Parameter | GCI | Bootstrap-p CI | |||
|---|---|---|---|---|---|
| 0.9 | 0.95 | 0.9 | 0.95 | ||
| a | 0.9024 (2.0007) | 0.9522 (2.4200) | 0.8872 (1.9162) | 0.9368 (2.2915) | |
| b | 0.9022 (1.0878) | 0.9526 (1.3157) | 0.8912 (1.0407) | 0.9414 (1.2441) | |
| 0.8970 (0.4361) | 0.9478 (0.5231) | 0.8938 (0.4252) | 0.9428 (0.5070) | ||
| 0.8978 (0.8062) | 0.9472 (1.0019) | 0.8736 (0.6920) | 0.9256 (0.8266) | ||
| 0.9028 (1.4934) | 0.9508 (1.8063) | 0.8930 (1.4308) | 0.9418 (1.7116) | ||
| 0.9006 (0.3413) | 0.9498 (0.4098) | 0.8920 (0.3224) | 0.9406 (0.3861) | ||
| MTTF | 0.9024 (6.1217 × ) | 0.9522 (6.9653 × ) | 0.8920 (6.3831 × ) | 0.9424 (7.3118 × ) | |
| 0.8994 (24.6218) | 0.9504 (29.8223) | 0.8878 (23.5011) | 0.9394 (28.2697) | ||
| a | 0.8998 (1.5255) | 0.9536 (1.8345) | 0.8872 (1.4767) | 0.9374 (1.7621) | |
| b | 0.8998 (0.8285) | 0.9512 (0.9963) | 0.8910 (0.8025) | 0.9414 (0.9575) | |
| 0.8978 (0.2969) | 0.9464 (0.3549) | 0.9072 (0.2925) | 0.9560 (0.3486) | ||
| 0.9028 (0.5667) | 0.9536 (0.6930) | 0.8864 (0.5107) | 0.9290 (0.6097) | ||
| 0.9018 (1.1387) | 0.9520 (1.3693) | 0.8878 (1.1021) | 0.9430 (1.3152) | ||
| 0.8974 (0.2599) | 0.9486 (0.3129) | 0.8902 (0.2481) | 0.9412 (0.2969) | ||
| MTTF | 0.9036 (5.1554 × ) | 0.9530 (5.9501 × ) | 0.8870 (5.2715 × ) | 0.9424 (6.1244 × ) | |
| 0.8990 (23.1594) | 0.9490 (27.8547) | 0.8850 (22.3982) | 0.9384 (26.8549) | ||
| a | 0.8974 (1.2686) | 0.9482 (1.5215) | 0.8940 (1.2431) | 0.9436 (1.4824) | |
| b | 0.8964 (0.6895) | 0.9472 (0.8271) | 0.8922 (0.6758) | 0.9446 (0.8058) | |
| 0.9008 (0.2252) | 0.9512 (0.2688) | 0.8938 (0.2237) | 0.9444 (0.2666) | ||
| 0.9028 (0.4509) | 0.9490 (0.54739) | 0.8892 (0.4204) | 0.9336 (0.5016) | ||
| 0.8976 (0.9466) | 0.9492 (1.1354) | 0.8942 (0.9275) | 0.9472 (1.1061) | ||
| 0.8994 (0.2133) | 0.9462 (0.2568) | 0.8906 (0.2087) | 0.9432 (0.2496) | ||
| MTTF | 0.8958 (4.5046 × ) | 0.9500 (5.2422 × ) | 0.8936 (4.5832 × ) | 0.9444 (5.3604 × ) | |
| 0.8996 (22.4528) | 0.9484 (26.9199) | 0.8888 (21.9932) | 0.9446 (26.3262) | ||
| Parameter | LCL in GPQ Method | LCL in Bootstrap-p Method | |||
|---|---|---|---|---|---|
| 0.9 | 0.95 | 0.9 | 0.95 | ||
| a | 0.8968 (−1.6616) | 0.9512 (−1.8934) | 0.9020 (−1.6542) | 0.9506 (−1.8682) | |
| b | 0.9100 (1.5743) | 0.9534 (1.4481) | 0.8974 (1.6012) | 0.9452 (1.4850) | |
| 0.8978 (0.8577) | 0.9432 (0.8207) | 0.9246 (0.8412) | 0.9682 (0.7999) | ||
| 0.9018 (0.2964) | 0.9502 (0.2507) | 0.9546 (0.2483) | 0.9862 (0.1945) | ||
| 0.8976 (0.696) | 0.9518 (0.6311) | 0.8766 (0.7162) | 0.9236 (0.6564) | ||
| MTTF | 0.9044 (1.7927 × ) | 0.9538 (1.3248 × ) | 0.9052 (1.7236 × ) | 0.9508 (1.2075 × ) | |
| a | 0.9020 (−1.4870) | 0.9460 (−1.6608) | 0.8982 (−1.4757) | 0.9470 (−1.6396) | |
| b | 0.8986 (1.6783) | 0.9520 (1.5840) | 0.8922 (1.6854) | 0.9458 (1.5964) | |
| 0.8946 (0.8978) | 0.9432 (0.8704) | 0.9200 (0.8869) | 0.9674 (0.8573) | ||
| 0.8998 (0.3442) | 0.9508 (0.3071) | 0.9498 (0.3086) | 0.9824 (0.2655) | ||
| 0.9012 (0.7535) | 0.9554 (0.7057) | 0.8708 (0.7660) | 0.9276 (0.7226) | ||
| MTTF | 0.9056 (2.1389 × ) | 0.9548 (1.7046 × ) | 0.8952 (2.0895 × ) | 0.9438 (1.6264 × ) | |
| a | 0.9090 (−1.3988) | 0.9558 (−1.5421) | 0.8936 (−1.3809) | 0.9460 (−1.5185) | |
| b | 0.8936 (1.7357) | 0.9424 (1.6578) | 0.8962 (1.7361) | 0.9486 (1.6612) | |
| 0.8998 (0.9186) | 0.9512 (0.8969) | 0.9094 (0.9138) | 0.9596 (0.8906) | ||
| 0.9016 (0.3682) | 0.9504 (0.3361) | 0.9344 (0.3441) | 0.9750 (0.3070) | ||
| 0.8978 (0.7857) | 0.9466 (0.7479) | 0.8830 (0.7901) | 0.9352 (0.7552) | ||
| MTTF | 0.8926 (2.3986 × ) | 0.9386 (1.9975 × ) | 0.9060 (2.3172 × ) | 0.9540 (1.8956 × ) | |
| Parameter | UCL in GPQ Method | UCL in Bootstrap-p Method | |||
|---|---|---|---|---|---|
| 0.9 | 0.95 | 0.9 | 0.95 | ||
| a | 0.9024 (−0.1242) | 0.9542 (0.1074) | 0.8956 (−0.1656) | 0.9446 (0.0481) | |
| b | 0.8950 (2.4102) | 0.9518 (2.5360) | 0.9012 (2.4099) | 0.9500 (2.5257) | |
| 0.8980 (1.1954) | 0.9498 (1.2568) | 0.8816 (1.1723) | 0.9306 (1.2252) | ||
| 0.8870 (0.9001) | 0.9416 (1.0569) | 0.8308 (0.7860) | 0.8874 (0.8866) | ||
| 0.8978 (0.9596) | 0.9488 (0.9723) | 0.9256 (0.9663) | 0.9684 (0.9789) | ||
| MTTF | 0.8980 (6.7811 × ) | 0.9516 (7.4465 × ) | 0.8934 (6.8816 × ) | 0.9432 (7.5906 × ) | |
| a | 0.9046 (−0.3087) | 0.9538 (−0.1353) | 0.8916 (−0.3265) | 0.9402 (−0.1629) | |
| b | 0.9004 (2.3185) | 0.9478 (2.4125) | 0.8980 (2.3101) | 0.9452 (2.3989) | |
| 0.9010 (1.1285) | 0.9526 (1.1673) | 0.8862 (1.1148) | 0.9368 (1.1499) | ||
| 0.9016 (0.7751) | 0.9520 (0.8737) | 0.8440 (0.7058) | 0.9040 (0.7762) | ||
| 0.8944 (0.9537) | 0.9420 (0.9656) | 0.9182 (0.9585) | 0.9626 (0.9707) | ||
| MTTF | 0.8998 (6.2798 × ) | 0.9488 (6.8600 × ) | 0.8914 (6.2941 × ) | 0.9432 (6.8979 ) | |
| a | 0.8934 (−0.4164) | 0.9416 (−0.2734) | 0.9006 (−0.4130) | 0.9510 (−0.2754) | |
| b | 0.9002 (2.2697) | 0.9510 (2.3473) | 0.8942 (2.2623) | 0.9436 (2.3371) | |
| 0.8998 (1.0938) | 0.9496 (1.1221) | 0.8828 (1.0880) | 0.9342 (1.1143) | ||
| 0.8992 (0.7133) | 0.9524 (0.7871) | 0.8552 (0.6712) | 0.9142 (0.7274) | ||
| 0.9012 (0.9502) | 0.9528 (0.9613) | 0.9042 (0.9522) | 0.9554 (0.9639) | ||
| MTTF | 0.9102 (5.9889 × ) | 0.9532 (6.5021 × ) | 0.8932 (5.9508 × ) | 0.9426 (6.4788 × ) | |
| Parameter | Level | GCI/GPI | GLCL | GUCL |
|---|---|---|---|---|
| a | 90% | (0.0022, 0.4338) × | 0.0514 | 0.3833× |
| 95% | (−0.0418, 0.4790) × | 0.0022 | 0.4338× | |
| b | 90% | (1.2000, 2.1000) × | 1.3000 | 2.0000 × |
| 95% | (1.1000, 2.2000) × | 1.2000 | 2.1000 × | |
| 90% | (0.5173, 0.8519) × | 0.5445 | 0.8036 × | |
| 95% | (0.4943, 0.9004) × | 0.5173 | 0.8519 × | |
| 90% | (0.0197, 0.1891) × | 0.0313 | 0.1590 × | |
| 95% | (0.0101, 0.2188) × | 0.0197 | 0.1891 × | |
| 90% | (0.8393, 0.9797) | 0.8673 | 0.9734 | |
| 95% | (0.8117, 0.9839) | 0.8393 | 0.9797 | |
| MTTF | 90% | (1.8784, 6.0114) × | 2.1982 | 5.4981 × |
| 95% | (1.6418, 6.4548) × | 1.8784 | 6.0114 × | |
| 90% | (−4.6179, 9.0402) | −3.0454 | 7.4440 | |
| 95% | (−5.9605, 10.5122) | −4.6179 | 9.0402 |
Publisher’s Note: MDPI stays neutral with regard to jurisdictional claims in published maps and institutional affiliations. |
© 2022 by the author. Licensee MDPI, Basel, Switzerland. This article is an open access article distributed under the terms and conditions of the Creative Commons Attribution (CC BY) license (https://creativecommons.org/licenses/by/4.0/).
Share and Cite
Jiang, P. Statistical Inference of Wiener Constant-Stress Accelerated Degradation Model with Random Effects. Mathematics 2022, 10, 2863. https://doi.org/10.3390/math10162863
Jiang P. Statistical Inference of Wiener Constant-Stress Accelerated Degradation Model with Random Effects. Mathematics. 2022; 10(16):2863. https://doi.org/10.3390/math10162863
Chicago/Turabian StyleJiang, Peihua. 2022. "Statistical Inference of Wiener Constant-Stress Accelerated Degradation Model with Random Effects" Mathematics 10, no. 16: 2863. https://doi.org/10.3390/math10162863
APA StyleJiang, P. (2022). Statistical Inference of Wiener Constant-Stress Accelerated Degradation Model with Random Effects. Mathematics, 10(16), 2863. https://doi.org/10.3390/math10162863