1. Introduction
Recently, Deep Learning (DL) has made remarkable advances in various fields [
1,
2,
3,
4,
5,
6,
7], especially in classification [
8,
9,
10]. Despite excellent results, the success of deep methods highly relies on: (1) large-scale labeled data for supervised learning and (2) the training and test data meeting the requirement of being Independently Identically Distributed (IID). However, annotation is time-consuming and unaffordable in practice. If a model is trained on a dataset (known as the source domain), but tested on another non-IID dataset (known as the target domain), domain shifts occur and tend to severely degrade the performance of the learned model [
11,
12]. Therefore, it is necessary to develop models that are trained on the given labeled datasets, but that can generalize well to a non-IID unlabeled dataset.
Domain Adaptation (DA) aims to learn a discriminative model by reducing domain shifts between training and test distributions [
13]. DA transfers the given labeled source domain knowledge to tackle the task to the different, but related target domain by learning domain-invariant representation between domains. Most approaches focus on Single-source Domain Adaptation (SDA), where the labeled data from only one single source domain are considered. Many achievements have emerged in this decade [
14,
15,
16,
17,
18]. For example, DDC [
14] adds an adaptation layer to the pre-trained AlexNet model to confuse the feature representation between the single source domain and the target domain. DSAN [
16] proposes a novel fine-grained metric function to align the distribution of the single source domain and the target domain. Most of them learn to map the data from both domains into a common feature space to learn domain-invariant representations by minimizing domain distribution discrepancy, so that the source classifier could then be directly applied to target instances.
However, in practice, it is very likely to obtain multiple available source domains, while SDA is not up to employing those source data adequately. Hence, more challenging, Multi-source Domain Adaptation (MDA) is developed to utilize labeled data from multiple source domains with different distributions and has attracted extensive attention these days [
19,
20,
21]. The most straightforward way is to combine all source domains into one single source domain and, then, directly apply SDA methods to align distributions. Due to the dataset expansion, the methods might improve the performance. However, the improvements might not be sufficient; the more accurate ways are supposed to explore to make full use of source domains.
With the spurt of progress in DL and SDA today, MDA has been gradually developed. However, there are two typical issues with most techniques [
22,
23,
24,
25,
26,
27,
28]. (1) Firstly, it is more challenging to learn a common domain-invariant representation for all domains in MDA, because the damages of domain shifts cannot be eliminated even in SDA. Thereby, MDA is processed by aligning the domain-specific distribution for each source–target domain pair. (2) Secondly, multiple source domains are treated as equivalents. However, the benefits of each source domain to the target domain tasks are diverse in reality. The final output should be closer to the adaptation output of the source–target domain pairs with higher credibility. Some studies [
29,
30] add extra neural network components to measure the credibility (i.e., transferability). In this research study, we employed Subjective Logic (SL) [
31] to obtain the uncertainty of every source domain without any addition of the neural network. Regarding source–target domain pairs as witnesses with different credibility (uncertainty), we introduced Dempster–Shafer evidence Theory (DST) to combine all domain-specific adaptation outputs.
As an uncertainty reasoning method, DST can effectively and reliably deal with uncertainty. It relies on Basic Probability Assignment Functions (BPAFs) to measure the initial degree of belief in the occurrence of an event, which is similar to the concept of the “probability” of a random event in probability theory. To generate BPAFs, DST is bridged with MDA and DL by subjective logic.
Our contributions are summarized as follows:
A novel multi-source domain adaptation method with Dempster–Shafer evidence theory is proposed. We provide an effective cross-domain classification solution without any addition of the neural network.
There are few studies combining multi-source domain adaptation and Dempster–Shafer evidence theory as of yet. We explored this kind of research early. In our work, DST is employed to fuse all domain-specific adaptation results and output the final credible results.
The effectiveness of our cross-domain classification method is verified by conducting comprehensive experiments on three well-known benchmarks. The experimental results prove that the proposed method has better performance than other compared approaches.
The rest of this paper is organized as follows.
Section 2 reviews the related work. In
Section 3, the preliminaries are given.
Section 4 describes the proposed method in detail. A series of experiments is reported in
Section 5 and discussed in
Section 6. Finally,
Section 7 summarizes this research study.
3. Preliminaries
3.1. Unsupervised Multi-Source Domain Adaptation
In this research study, the unsupervised MDA problem is investigated. Let denote a collection of N available datasets of source domains, and each labeled source dataset with samples is sufficient to train a source domain distribution model. Meanwhile, a target dataset with samples drawn from the target domain has no labels to support training a reasonable distribution model. With given , the general goal of this problem is to train a cross-domain classifier , which has a low target risk .
The domain-specific distribution and classifier alignment architecture in MFSAN [
55] has proceeded to cross-domain classification. Thus, the domain adaptation model involves the source domain task loss
, the domain adaptation loss
, and the classifier constraint loss
. As shown in (
1),
and
are trade-off parameters.
3.2. Maximum Mean Discrepancy
Maximum mean discrepancy, inspired by the two-sample test in statistics [
63,
64], is the most widely used discrepancy to align the distributions in domain adaptation. In general, MMD is interpreted as the maximum value (upper bound) of the expectation difference between two distributions mapped by any function
f in a predefined function field
, which is an arbitrary vector in the unit sphere (i.e.,
) of the reproducing Hilbert space:
In practice, an estimate of the MMD compares the square distance between the empirical kernel mean embeddings as (
3).
is the Reproducing Kernel Hilbert Space (RKHS) endowed with a characteristic kernel
k.
k means
, where
represents the inner product of vectors and
denotes some feature map to map the original samples to the RKHS
.
3.3. Basic Concepts of DST
The Basic Probability Assignment Function (BPAF) is the fundamental unit of DST, which expresses the initial degree of belief in the proposition. Let
be a frame of discernment, which specifies the proposition range. The function
becomes the BPAF when it satisfies (
4). If
,
is also called the belief mass, and
A is named the focal element.
Dempster’s rule ⊕ is at the core of DST, as it provides algorithmic rules for combining two pieces of evidence, as shown in (
5). Besides, Dempster’s rule is invoked
times to combine
N sets of evidence.
The definition of conflict factor K, shown in (
6), reflects the degree of conflict between
and
, whereby
represents the normalization factor. Obviously, Dempster’s rule tries to fuse shared parts from different sources and ignores conflicting beliefs.
3.4. Dirichlet Distribution
The Dirichlet distribution is involved in SL, which bridges DL, MDA, and DST. In the context of multi-class classification, SL converts the outputs (from DL and MDA) of the neural networks into the concentration parameter of the Dirichlet distribution and associates it with the belief masses (for DST). Accordingly, DST could combine multi-source evidence after BPAFs are obtained and output the final decision.
If the probability density function of multivariate continuous random variable
is (
7):
where
, and
is the Gamma function. Then, the random variable
is said to obey the Dirichlet distribution with concentration parameter
and denoted as
.
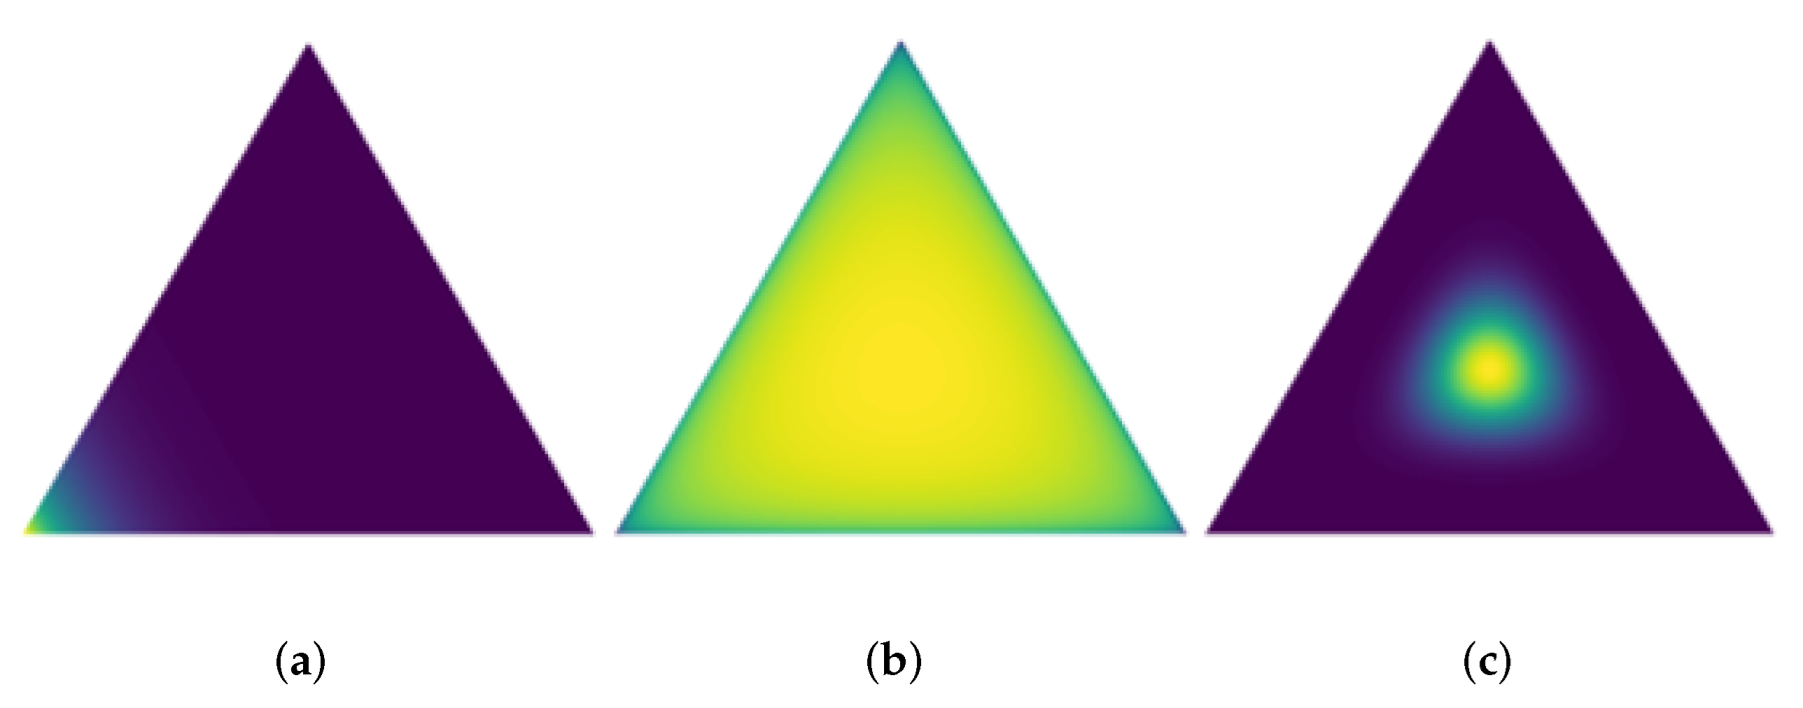
Dirichlet distribution
exists on the
-dimensional simplex, as shown in
Figure 1.
The most important property of the Dirichlet distribution is that it is the conjugate prior to the multinomial distribution. If follows the Dirichlet distribution, its prior probability distribution is and posterior probability distribution is , where D is the given simplex and is the observation count of the multinomial distribution. The concentration parameters of the Dirichlet distribution as a priori distribution are also called the hyperparameters of the posterior distribution. Hence, it is convenient to obtain the posterior distribution from the prior distribution.
4. Research Methodology
Following the two-stage alignment framework in MFSAN [
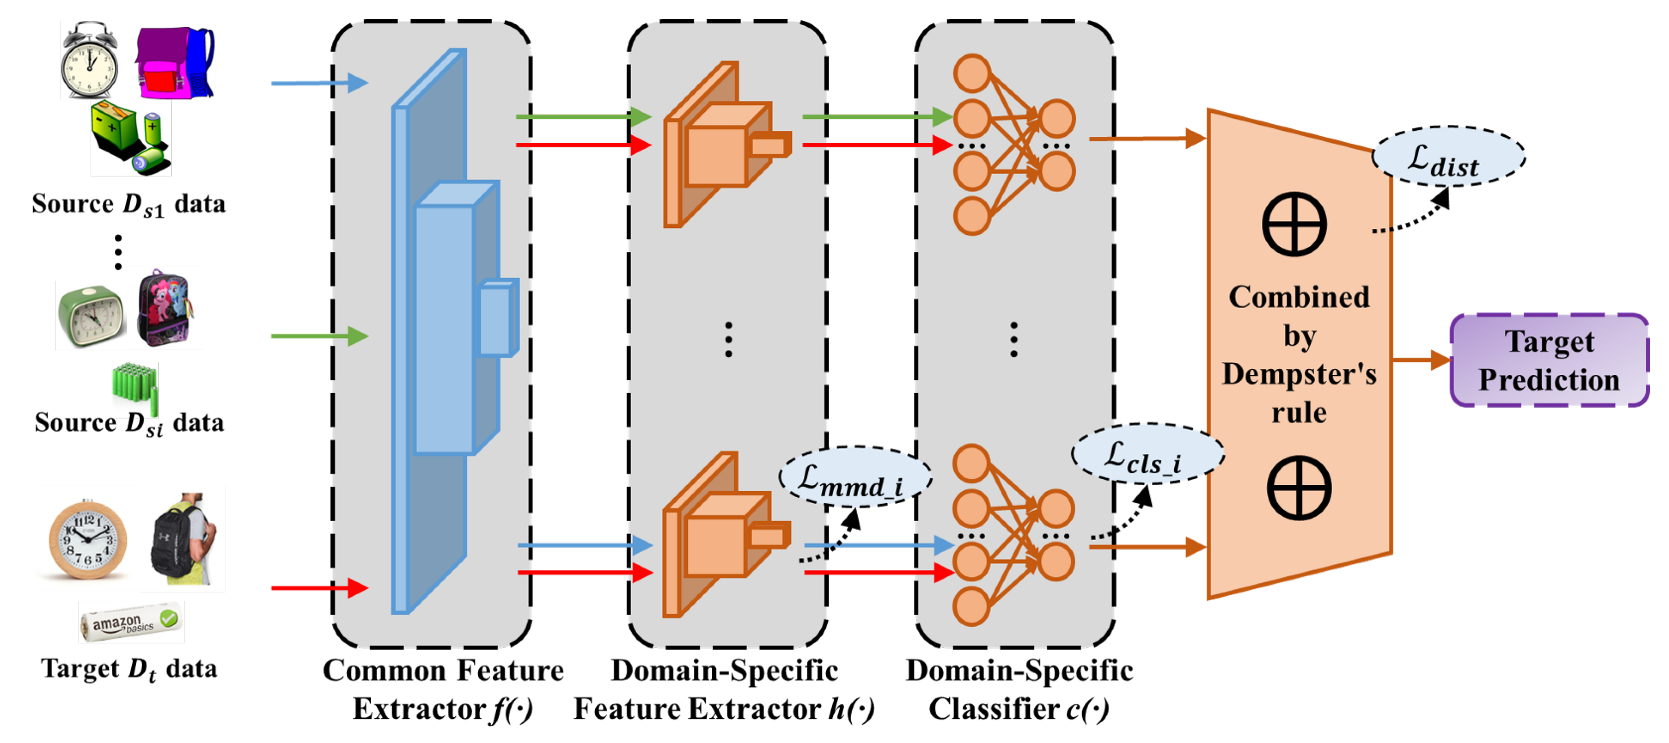
55], a novel Multi-source domain Adaptation Network with Dempster–Shafer evidence theory (MAN-DS) for cross-domain classification is proposed. MAN-DS aims to train a model based on multi-source domain labeled samples and adapts to classify target instances with different distributions. As shown in
Figure 2, the MAN-DS framework consists of four key components, i.e., common feature extractor, domain-specific feature extractor, domain-specific classifier, and Dempster’s combination. Different source domains are extracted into different feature spaces, and then, the distribution alignment of each pair of source and target domains and the output alignment of every source classifier are imposed. Domain-specific adaptation outputs are combined by Dempster’s rule in the end. Besides, the
layer of the classifier is replaced with an activation layer (e.g., ReLU).
4.1. Common Feature Extractor
The damages of domain shifts cannot be eliminated in SDA, so it is more difficult to learn a common domain-invariant representation for all domains in MDA. To address this problem, the easiest way is to train multiple networks to map each source–target domain pair into a specific feature space. However, this would take too much time and space. Thus, the feature extractor is divided into two parts. The first part extracts common features, and the second part extracts domain-specific features (see the next section). In the first part, a common convolutional neural subnetwork is used to automatically map samples in all domains from the original feature space into a common feature space.
4.2. Domain-Specific Feature Extractor
Now, we come to the second part where domain-specific features are extracted by different extractors. For each pair of source and target domains, a specific subnetwork
aims to map
and
into the same domain-specific feature space. The objective of domain adaptation is to find a domain-invariant representation between domains. In other words, an
is desired, which makes the distribution discrepancy between
and
as small as possible. There are many explicit or implicit methods to achieve this goal. Here, the most widely used MMD is employed to reduce the distribution discrepancy between domains. The MMD loss is reformulated as:
4.3. Domain-Specific Classifier
Traditionally, a series of classifiers is employed to classify the source domain samples after extracting domain-specific invariant features, respectively. However, the use of the exponent in the function leads to the probability of the predicted category being inflated. It was replaced with an activation function (e.g., RELU) to ensure that the network outputs non-negative values in this research study. The multi-classification problem is a multinomial distribution fitting problem. As the conjugate prior, the Dirichlet distribution is convenient to obtain the posterior distribution from the prior distribution.
Subjective logic [
31] defines a theoretical framework for obtaining the probabilities of different classes and the overall uncertainty of the multi-classification problem based on the
evidence collected from the data. SL provides an additional mass function, which allows the model to distinguish between a lack of evidence. In our model, SL provides the degree of overall uncertainty of each source, which is important for final decisions to some extent.
For the
K-classification problem, the nonnegative-activated output
of the last fully connected layer of the classifier refers to
evidence and is closely related to the concentration parameters
of the Dirichlet distribution, as shown in the following:
With subjective logic, for each pair of the source–target domain, the probability
for the
kth category and the overall uncertainty
are calculated by:
where
is the Dirichlet strength. Obviously,
. Correspondingly, the less total evidence observed, the greater the total uncertainty is. The mean of the corresponding Dirichlet distribution
for the probability
is computed as
.
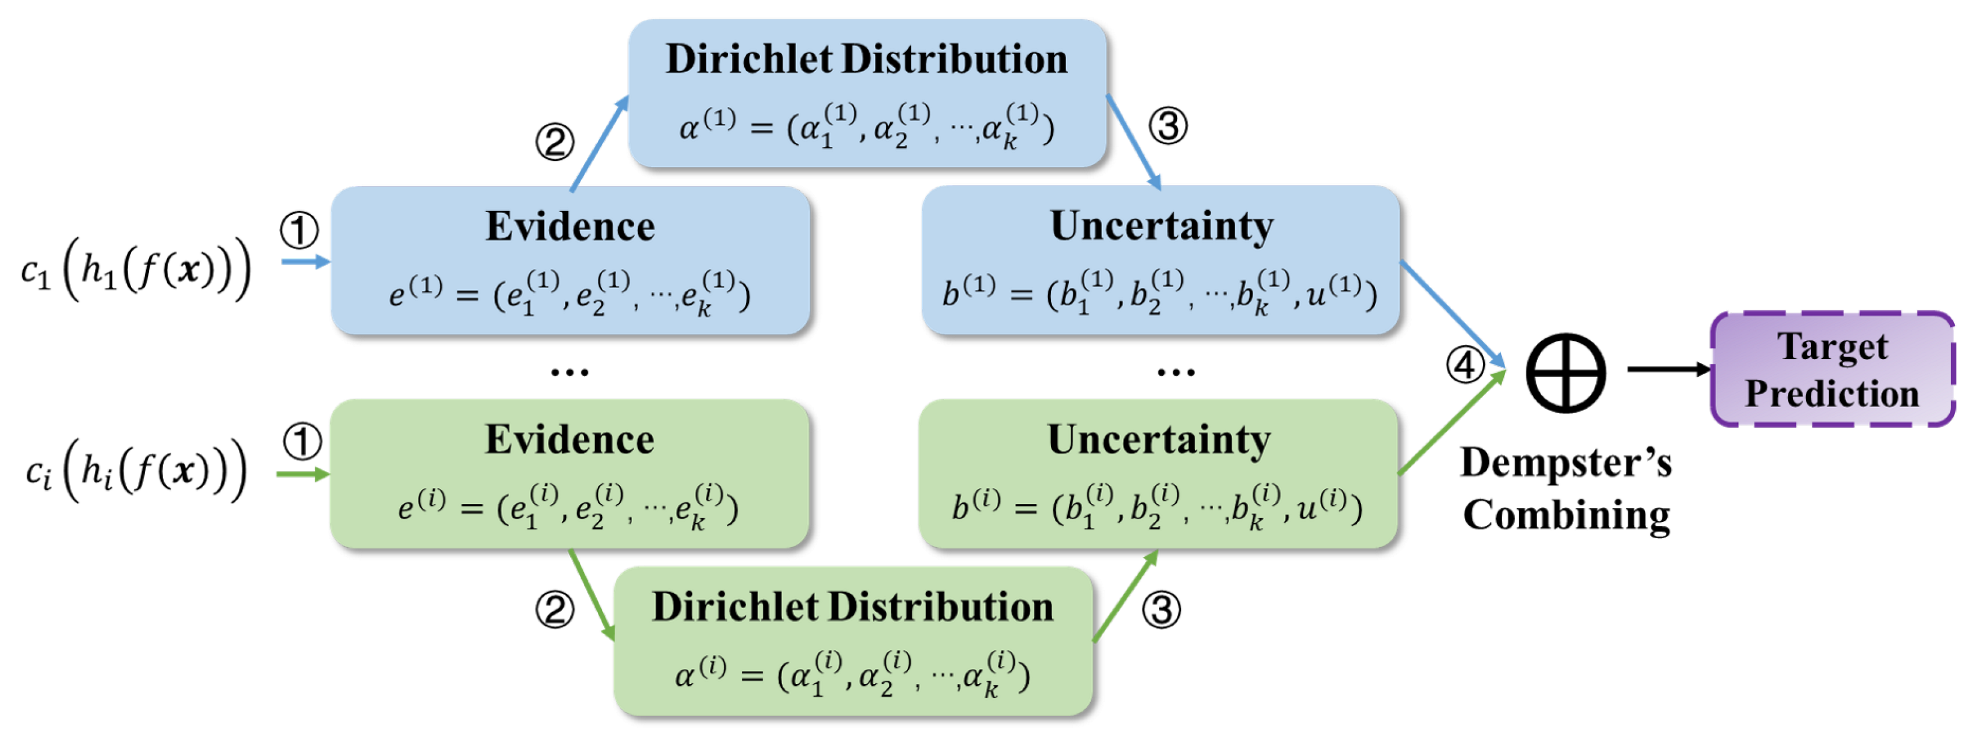
In addition,
Figure 3 demonstrates the process of the outputs of multiple domain-specific classifiers in detail. The evidence of each source is obtained using neural networks (Step ①). According to subjective logic [
31], the obtained evidence parameterizes the Dirichlet distribution (Step ②) to induce the classification probability and uncertainty (Step ③). The classification probability and overall uncertainty are inferred by combining the belief masses of multiple sources based on Dempster’s rule (Step ④). Dempster’s combining is discussed in
Section 4.4.
Source domain task loss
is calculated here. To adapt to the Dirichlet distribution [
65], the cross-entropy function is formulated as (
11).
where
is the digamma function, the parameter
of the Dirichlet distribution and forming the multinomial opinions
, where
is the category assignment probabilities on a simplex, and
is the predicted probability of the
sample for category
k.
The above loss function ensures that more evidence is generated for the correct label of each sample than for other classes, but there is no guarantee that less evidence is generated for the incorrect label. That is, in MAN-DS, the expected evidence of incorrect labels shrinks to 0 [
66]. To this end, the following KL divergence term is introduced:
Therefore, given parameter
of the Dirichlet distribution for each sample
j, the loss is:
where
is a balance factor. In practice,
increases slowly from zero to 1 to avoid paying too much attention to the KL divergence term in the early stage of learning.
That is, the classification loss is formulated as:
4.4. Dempster’s Combination
With subjective logic, there is an FoD
and
focal elements
with belief mass
in every source–target domain pair. To fuse these adaptation outputs from
N sources, only call Dempster’s rule (defined in (
5))
times as:
In addition, the prediction results of multiple classifiers for the same target sample should be consistent. Dempster’s combination could help to avoid ambiguity and large uncertainty on the category boundary, which is demonstrated in
Figure 4.
Moreover, the Manhattan distance is used to measure the difference among the classifiers to achieve this goal, as well. Denote
as the final output of the
ith source–target domain pair. The loss-of-label Manhattan distance is formulated as:
4.5. Objective Function and Algorithm
The overall objective function of the proposed model is formulated as (
17).
In detail,
is minimized to accomplish the source domain task;
is minimized to reduce the domain shifts between each source domain and the target domain;
is a consistent regular term and minimized to constrain the outputs of domain-specific classifiers. In addition,
and
are trade-off parameters; refer to (
1).
The algorithm of [d=Z.]MAN-DSour method is summarized in Algorithm 1, and it can be trained by the standard back-propagation.
| Algorithm 1:The algorithm of the proposed method |
- Input :
source domain data , target domain data , the number of training iterations T, and batch size M; - Output :
model parameters; - 1:
Initialize the parameters of , , , ; - 2:
fordo - 3:
Randomly sample a batch of from , respectively; - 4:
Randomly sample a batch of from ; - 5:
Extract common features and ; - 6:
Extract domain-specific features and ; - 7:
Compute with and by ( 8); - 8:
Obtain for classification and compute by ( 14); - 9:
Obtain , and combine them by ( 5) - 10:
Compute by ( 16); - 11:
Update parameters by ( 17). - 12:
end for
|
5. Experiment
The effectiveness of our cross-domain classification method was verified by conducting comprehensive experiments on three well-known benchmarks: ImageCLEF-DA, Office-31, and Office-Home.
5.1. Data Preparation
ImageCLEF-DA [
67] is a benchmark dataset for the ImageCLEF 2014 domain adaptation challenge, which is organized by selecting the 12 common categories shared by the following three public datasets, each considered as a domain: Caltech-256(
C), ImageNet ILSVRC 2012(
I), and Pascal VOC 2012 (
P). There are 50 images in each category and 600 images in each domain. All domain combinations were used, and three transfer tasks were built:
C,
I →
P;
C,
P→
I;
I,
P→
C.
Office-31 [
68] is a benchmark for domain adaptation, comprising 4110 images in 31 classes collected from three distinct domains: Amazon (
A), which contains images downloaded from amazon.com, Webcam (
W), and DSLR (
D), which contains images taken by a web camera and digital SLR camera with different photographic settings. The images in each domain are unbalanced. To enable unbiased evaluation, all methods were evaluated on all three transfer tasks:
A,
W →
D;
A,
W→
D;
W,
D→
A.
Office-Home [
69] consists of 15,588 images, larger than Office-31 and ImageCLEF-DA. It consists of images from 4 different domains: Artistic images (
A), Clip Art (
C), Product images (
P), and Real-World images (
R). For each domain, the dataset contains images of 65 object categories collected in the office and home settings. All domain combinations were used, and four transfer tasks were built::
A,
P,
R →
C;
A,
P,
C→
R;
A,
R,
C→
P;
P,
R,
C→
A.
5.2. Compared Method
There is a small amount of MDA work based on a domain-specific distribution and classifier alignment architecture. To verify the effectiveness of our MDSAN model, the Multiple Feature Spaces Adaptation Network (MFSAN) [
55] was introduced as the multi-source baseline. In addition, the proposed method was compared with ResNet [
70], Deep Domain Confusion (DDC) [
14], the Deep Adaptation Network (DAN) [
71], Deep CORAL (DCORAL) [
72], and Reverse Gradient (RevGrad) [
73].
There are several comparative standards for different purposes. (1) Source combine: all source domains are combined into a traditional single-source vs. target setting; (2) Single best: the best single source transfer results among the multiple candidate source domains with SDA methods; (3) Multi-source: the results of MDA methods. The first standard is to verify whether multiple source domains are beneficial for the target task or whether the simple combination of source domains will lead to negative transfer. In addition, the second standard evaluates whether the best SDA method could be further improved by introducing other source domains. The third standard demonstrates the effectiveness of the proposed approach.
Furthermore, ablation experiments were performed to verify the effectiveness of DST for adaptation outputs’ fusion. This variant is denoted as , which simply averages the outputs in the end. In addition, variant does not consider , and variant ignores .
5.3. Implementation Details
All methods were implemented based on the PyTorch framework and deployed and testified on the same device. For a fair comparison, the same data pre-processing routines and model architecture were utilized in all experiments. The pre-trained ResNet50 [
70] was employed as the common feature extractor, where the fine-tuning strategy was used to save time. For all domain-specific feature extractors, the same structure
,
,
was utilized. At the end of the neural network, the channels were reduced to 256, like DDC [
14]. According to subjective logic, the
layer was replaced with
to activate the outputs and avoid negative values. The optimization method was mini-batch stochastic gradient descent with a momentum of
. The learning rate was gradually decreased by
, where
p is the training progress linearly changing from 0 to 1, and
. This would optimize to promote convergence and low error on the source domain. As for the hyperparameters,
was simply set. They were changed from 0 to 1 by a progressive schedule
, instead of fixing them throughout the experiments.
5.4. Experimental Results
MAN-DS was compared with the above-mentioned methods on three datasets, and the average results of five repeated experiments are reported in
Table 1,
Table 2 and
Table 3, respectively. The maximum accuracy in a transfer task is marked in bold.
7. Conclusions
The core of MDA is making full use of available source data collected from several different, but related domains. However, it becomes difficult and challenging due to the multiple domain shifts. Following the domain-specific alignment architecture, this study proposed a novel multi-source domain adaptation network combing Dempster–Shafer evidence theory for cross-domain image classification to reduce multiple domain shifts and enhance transfer accuracy. In addition, SL and the Dirichlet distribution were employed to bridge MDA with DST.
To evaluate the effectiveness of the proposed method, three popular benchmark datasets were used and ten transfer tasks were devised to train and validate MAN-DS. Extensive experiments demonstrated that MAN-DS outperforms its competitors in cross-domain image classification. The insightful conclusions are as follows:
MAN-DS achieved good accuracy in all ten transfer tasks of three datasets. On the Office-Home dataset, MAN-DS even improved the average adaptation accuracy to , which is about 2% higher than the best baseline.
Feature visualization shows that MAN-DS could alleviate boundary conflicts to some extent, due to effective DST.
MAN-DS is not sensitive to changes in parameters in a certain range , generally.
MAN-DS improved accuracy without increasing computational complexity. Compared with the baseline MFSAN, the FLOPs and PARAMs of MAN-DS were 4.23 G and 25.88 M, which are close to the 4.12 G and 25.56 M of ResNet. Especially, MAN-DS reduced the computational overhead of the outputs’ combination from to .
Ablation experiments indicated that every component of MAN-DS is positive to improve performance.
The encouraging results show that SL could effectively bridge MDA with DST.
This research study empirically demonstrates DST could reduce the category boundary ambiguity, so as to mitigate the negative impact of multiple domain shifts.
In this research study, the original and unimproved Dempster’s rule was used. In the future, the combination rules will be optimized based on the improved information entropy method to take more evidence information into account. Besides, more effective MDA and DST bridging methods will be investigated.


