Article

An Efficient Methodology for Locating and Sizing PV Generators in Radial Distribution Networks Using a Mixed-Integer Conic Relaxation

by
Oscar Danilo Montoya
1,2,*,†,
Carlos Andrés Ramos-Paja
3,† and
Luis Fernando Grisales-Noreña
4,†
1
Grupo de Compatibilidad e Interferencia Electromagnética, Facultad de Ingeniería, Universidad Distrital Francisco José de Caldas, Bogotá 110231, Colombia
2
Laboratorio Inteligente de Energía, Facultad de Ingeniería, Universidad Tecnológica de Bolívar, Cartagena 131001, Colombia
3
Facultad de Minas, Universidad Nacional de Colombia, Medellín 050034, Colombia
4
Facultad de Ingeniería, Institución Universitaria Pascual Bravo, Campus Robledo, Medellín 050036, Colombia
*
Author to whom correspondence should be addressed.
These authors contributed equally to this work.
Mathematics 2022, 10(15), 2626; https://doi.org/10.3390/math10152626
Submission received: 30 June 2022 / Revised: 22 July 2022 / Accepted: 25 July 2022 / Published: 27 July 2022
(This article belongs to the Special Issue Optimization Theory and Applications)

Abstract

:
This paper proposes a new solution methodology based on a mixed-integer conic formulation to locate and size photovoltaic (PV) generation units in AC distribution networks with a radial structure. The objective function comprises the annual expected energy costs of the conventional substation in addition to the investment and operating costs of PV sources. The original optimization model that represents this problem belongs to the family of mixed-integer nonlinear programming (MINLP); however, the complexity of the power balance constraints make it difficult to find the global optimum. In order to improve the quality of the optimization model, a mixed-integer conic (MIC) formulation is proposed in this research in order to represent the studied problem. Numerical results in two test feeders composed of 33 and 69 nodes demonstrate the effectiveness of the proposed MIC model when compared to multiple metaheuristic optimizers such as the Chu and Beasley Genetic Algorithm, the Newton Metaheuristic Algorithm, the Vortex Search Algorithm, the Gradient-Based Metaheuristic Optimization Algorithm, and the Arithmetic Optimization Algorithm, among others. The final results obtained with the MIC model show improvements greater than USD 100,000 per year of operation. All simulations were run in the MATLAB programming environment, using its own scripts for all the metaheuristic algorithms and the disciplined convex tool known as CVX with the Gurobi solver in order to solve the proposed MIC model.

1. Introduction

1.1. General Context

Electrical distribution networks have undergone significant transformations due to the advancements made in power electronics, which allows for the optimal interface of renewable energy resources, energy storage systems, and controllable loads [1,2]. With the massive integration of these new actors into the electricity distribution sector, conventional passive grids have been transformed into active networks with multiple new challenges [3], such as minimizing the carbon footprint produced by the combustion of fossil fuels in thermal plants [4], improving grid efficiency by minimizing energy losses and by improving the voltage profiles [5], and reducing bad quality indicators regarding the reliability of distribution systems [6], among others.
One of the most important agents in the transformation of distribution networks corresponds to the important developments in small-scale renewable energy technologies that have changed the electricity consumption habits of millions of users in residential, industrial, and commercial applications at medium- and low-voltage levels [7,8,9]. These small generators can be massively integrated with distribution, and they can drastically change the behavior of the electrical network in terms of voltage profiles, energy losses, power flow directions, and the coordination of protective devices [10]. For this reason, several countries around the world have regulated the integration of small-scale generators in distribution networks to maintain economic and technical equilibrium in the distribution sector [11,12]. On the other hand, distribution companies can also integrate medium-size distributed energy resources in their distribution grids in order to minimize their carbon footprint and increase their profit from the distribution and commercialization of energy as a public service [13].
Regardless of the motivation for massively including renewable energy resources in electrical distribution networks, it is a fact that conventional passive distribution systems have stayed behind, and active networks require new research and developments in order to optimize their technical, economic, digital, and environmental dimensions [14].

1.2. Motivation

This research is motivated by the new challenges posed by the Sustainable Development Goals, one of them being the development of energy supply strategies for urban or rural users with zero greenhouse gas emitters [15]. To reach this objective, electric distribution companies, regulatory entities, and governments see renewable generation as a great opportunity to replace conventional thermal generation plants with renewable energy resources [16,17,18]. Solar photovoltaic (PV) and wind power systems are the most established, reliable, and mature technologies that can help with the continuous reduction in greenhouse gas emissions [19,20,21]; however, in countries located in the equatorial area (between the Capricorn and Cancer tropics), PV generation is preferred over wind power sources with regard to its integration into power systems at all voltage levels, given that the expected variations in solar resources throughout the year are minimal [22,23].

1.3. Literature Review

The problem regarding the optimal siting and sizing of renewable generation sources in electrical distribution networks has been largely explored through multiple optimization methodologies in the current literature. Some of the most recent reports are presented below.
The authors of [24] presented the application of a constructive heuristic algorithm based on the simulated annealing algorithm to locate wind power and solar PV sources as well as batteries in electrical distribution networks. Once the location of these devices was defined, a mixed-integer linear programming model was proposed to determine the optimal sizes for the renewables and batteries. Numerical results in three test feeders with 11, 135, and 230 nodes confirmed the effectiveness of the MINLP model at defining the size of the devices; however, the authors did not make any comparison with metaheuristic optimizers in order to confirm the effectiveness of the siting stage. In [25], the authors proposed a fuzzy-based methodology to determine the optimal regions for constructing PV generation units in order to deal with greenhouse gas emissions while considering uncertainties in the solar energetic resource. A validation of the proposed methodology in southern Iran demonstrated the effectiveness of combining the fuzzy-based approach with the analytical hierarchy process and Dempster–Shafer methods, in contrast with separately implementing these methodologies. Ref. [26] presented the application of the classical Chu and Beasley Genetic Algorithm (CBGA) with discrete-continuous codification in order to determine the optimal sizes of the PV generation units in electrical distribution networks. The objective of this research was to minimize the total annual grid operating costs while considering the energy purchasing costs in terminals of the substation and the investment and maintenance costs of the PV generation units installed. The solution of the exact MINLP model with the CBGA yielded better results for the IEEE 33- and IEEE 69-bus networks when compared to the implementation of the MINLP model in the General Algebraic Modeling System (GAMS) software and its BONMIN nonlinear solver. The authors of [15] discussed the main aspects of the massive integration of renewable power in power systems and their dependence on the simultaneous use of large-scale battery energy storage systems to make the power system reliable. A complete qualitative analysis regarding the intermittency of renewables and their percentage of penetration in the power system was provided with the help of several real scenarios around the world.
The problem regarding the optimal siting and sizing of PV generation units in distribution networks has been explored by [27]. The authors proposed the application of the Newton-Metaheuristic Algorithm (NMA) with a discrete-continuous codification. Numerical results in the IEEE 34- and IEEE 85-bus networks demonstrated the effectiveness of the NMA when compared to the CBGA and the BONMIN solver. A complete literature review regarding the optimal design of solar PV applications for rural electrification was presented by [28]. The authors of this research discussed the advantages of using small-scale solar systems to provide self-generation with the help of batteries as an alternative for improving the quality of life in regions without access to conventional power systems. Ref. [29] proposed a new combinatorial optimization method based on the modification of the gradient-based metaheuristic optimizer to locate and size PV sources in distribution networks. Its objective function is the minimization of the annual energy purchasing costs in terminals of the substation, as well as the installation and maintenance costs of the PV sources. The authors of [30] presented the comparison between photovoltaic and wind power systems in sub-transmission and distribution networks. Computational validations using a genetic algorithm in two test feeders composed of 9 and 33 buses show that both generation technologies efficiently improve the grid quality by means of their active and reactive power injection capabilities. Ref. [31] recently presented the application of the discrete-continuous vortex search algorithm (DCVSA) to locate and size PV sources in distribution networks with AC and DC topologies. The objective function under consideration involved the energy, investment, and installation costs of the PV generation units. Numerical results in the IEEE 33- and IEEE 69-bus networks demonstrated the superior performance of the DCVSA when compared to the BONMIN and the CBGA. Additional works that have addressed the problem regarding the optimal siting and sizing of PV sources in distribution networks include the Modified Arithmetic Optimization Algorithm (MAOA) [32], the Generalized Normal Distribution Optimization (GNDO) Algorithm [33], and the Tabu Search Algorithm [34], among others.
The main characteristic of the aforementioned optimization algorithms is that most of them belong to the family of combinatorial optimizers, which work with a master–slave (leader–follower) optimization design, where the master stage defines the optimal location and sizes of the PV sources and the slave stage is entrusted with the technical evaluation of this solution, i.e., the solution of the power flow problem.
It is worth mentioning that one of our proposal’s distinct features is its solution approach, as this research focuses on the mathematical structure of the exact MINLP model that represents the studied problem, as well as the possibility of transforming it into a mixed-integer convex model [35,36].

1.4. Contribution And Scope

Considering the state-of-the-art presented above, this research makes the following contributions to the scientific literature:
  • The reformulation of the exact MINLP model to represent the problem regarding the optimal siting and sizing of PV sources in radial AC distribution networks through a Mixed-Integer Conic (MIC) model. The main advantage of the proposed MIC model is its solvability, which can ensure that the global optimum is reached via a combination of the Branch and Cut method with the interior point approach.
  • Improved results in the IEEE 33- and IEEE 69-bus grids: about USD 100,000 /year per test feeder with respect to the best solution reported in the current literature with the GNDO algorithm [33].
It is important to mention that the results obtained in this research confirm that using maximum power point tracking for optimal dispatch is not the best option for operating PV generation units in electrical networks. With maximum power tracking, PV systems are forced to provide all their power to the grid at each period of time, whereas, with the possibility of optimal dispatch at each period of time, the distribution system can reach a better operational point. These observations are confirmed in the results section.
Note that the studied problem belongs to the family of distribution planning problems. In this study, we consider a planning period of 20 years for the evaluation of the NPV (net present value); however, the optimization model is solved for a typical daily operation scenario in the metropolitan area of Medellín, Colombia. In addition, it is important to mention that, once the PV generators are optimally located and sized with the proposed MIC model, it can be used as a conic dispatch model to determine changes in power consumption and renewable generation availability regarding the optimal daily operation of distributed energy resources in distribution networks by ensuring that the global optimum is reached [37,38].

1.5. Document Structure

The remainder of this research article is organized as follows: Section 2 describes the exact mathematical formulation that represents the problem regarding the optimal siting and sizing of PV generation units in radial AC distribution networks; Section 3 presents the mixed-integer conic reformulation based on the branch convex power flow formulation presented in [37]; Section 4 describes the main features of the IEEE 33- and IEEE 69-bus networks employed in the numerical validations, analysis, and discussions provided in Section 5; conclusions and proposals for future work are presented in Section 6.

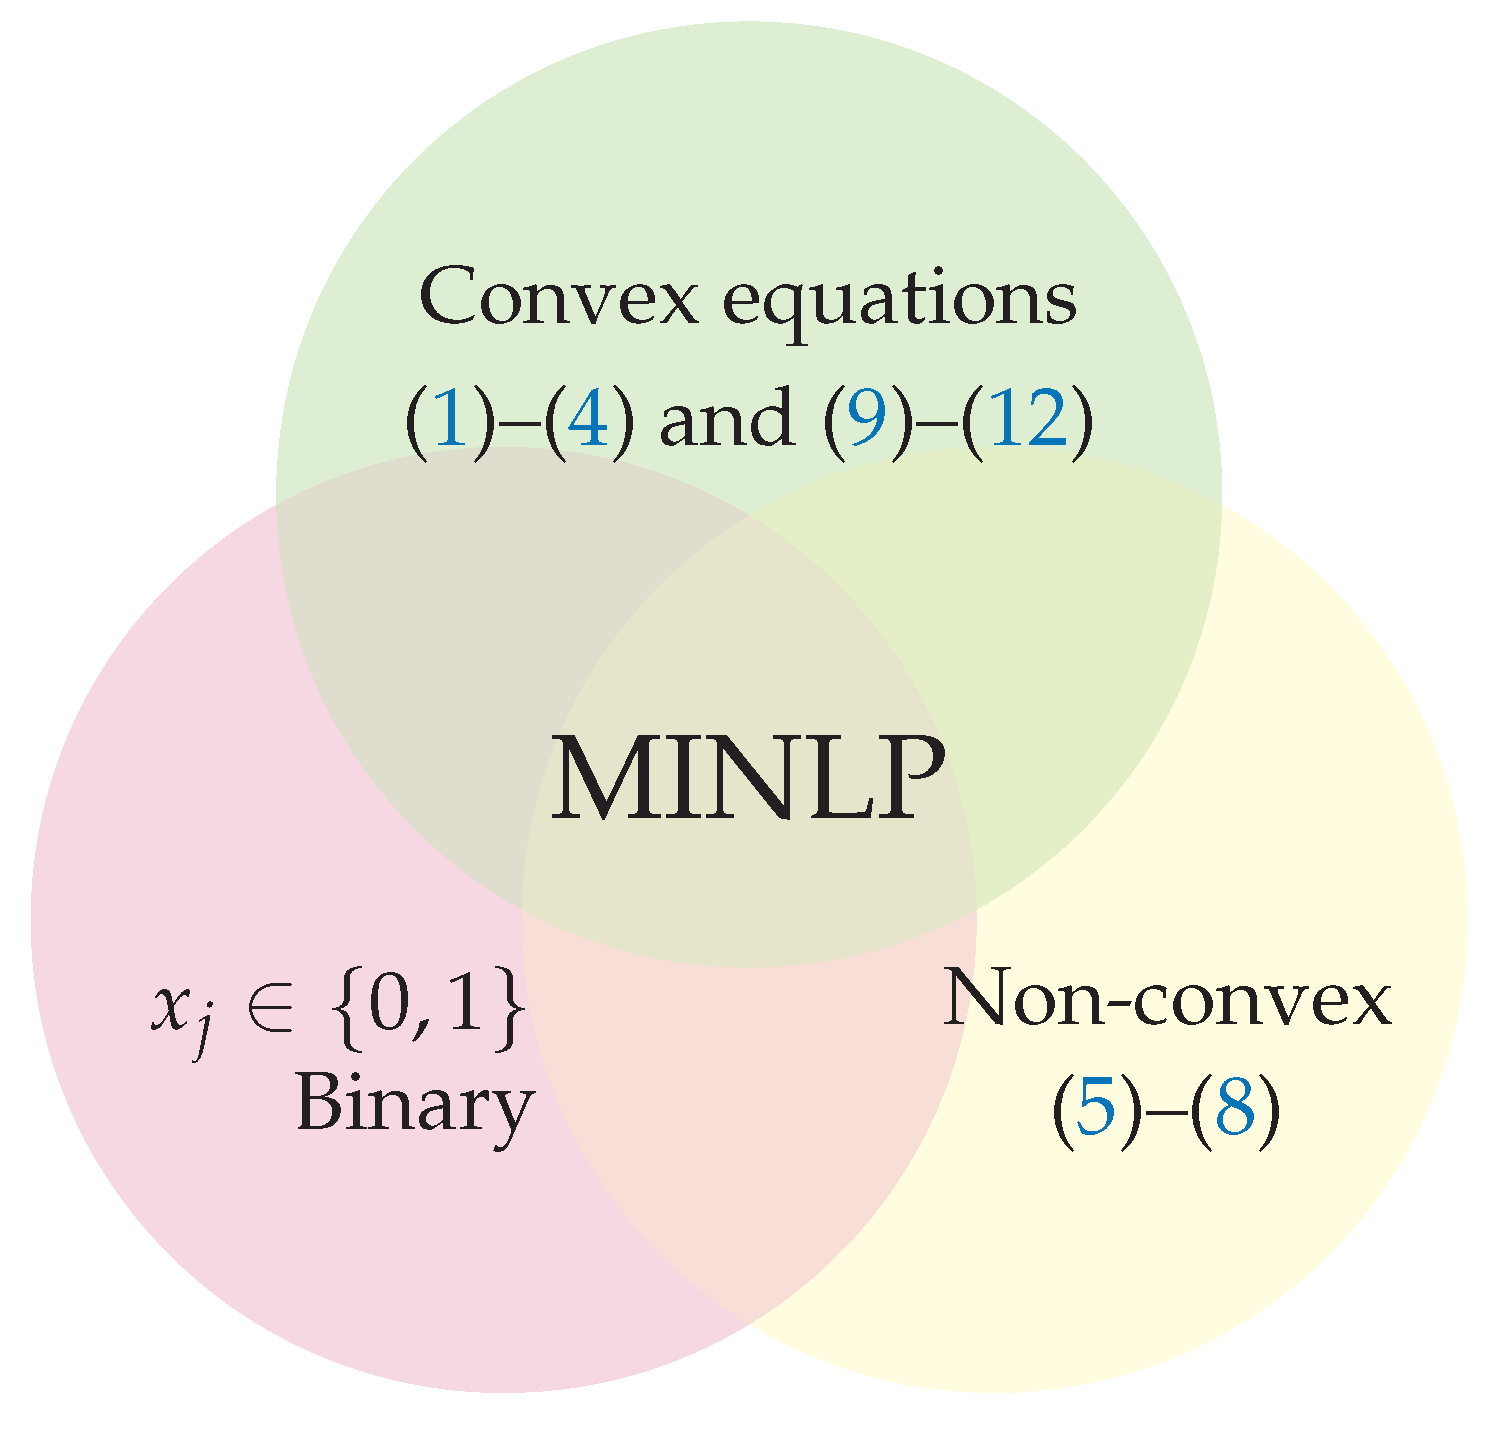
2. Exact MINLP Model

The siting and sizing of PV generation units in electrical distribution networks with a radial structure implies a complex MINLP model given the combination of discrete and continuous variables [39], where
  • The integer and/or binary variables represent the nodes where the PV generation units will be placed;
  • The continuous variables are associated with the electrical variables such as the voltage and current magnitudes, the active and reactive power flows, and the active power generation in PV sources for each period of time, among others.
In addition, the nonlinear programming structure of the model is due to the nonlinear relation between voltages, currents, and powers in the active and reactive power balance constraints per node [37].
For the sake of simplicity, in the mathematical formulations presented below, lowercase letters correspond to variables, and uppercase letters represent constant values and parameters. In addition, it is worth mentioning that, in the proposed mathematical formulations, it is considered that the distribution networks have a strictly radial structure, and these are represented through a single-phase equivalent.

2.1. Objective Function Structure

To locate and size PV generators in radial AC distribution networks, an economical objective function is used as an objective function indicator, which has three main components: (i) the annual expected energy purchasing costs in terminals of the electrical substation, (ii) the investment costs regarding the installation of the PV generators, and (iii) the operating costs of the PV sources during the planning period. The formulation of this objective function and its components is presented below.
z cost = z a + z b + z c ,
z a = C kWh T R a 1 ( 1 + R a ) Y h H i N p s i , h s u b Δ h t T 1 + R e 1 + R a t ,
z b = C p v R a 1 ( 1 + R a ) Y i N p i p v ,
z c = C O & M T h H i N p i , h p v Δ h
where z cost is the objective function value (net present value) of the annual energy purchasing cost in the substation ( z a ), added to the investment costs in PV sources ( z b ) and the operating and maintenance costs of the PV sources ( z c ). C kWh is the expected average energy costs per year, T is the number of days in a year, R a is the expected return rate of the investments made by the distribution company, Y is the number of years of the planning period, R e is the expected rate of increment for the energy costs, and p s i , h s u b is the total power generation at the substation bus for each period of time h (power sent from node s to node i), where Δ h is defined as one hour (1 h). C p v is the cost of acquisition of a kW of PV power, p i p v is the nominal size of a PV generator connected at node i, C O & M is the maintenance and operation costs per kWh of energy generation in the PV sources, and p i , h p v is active power generation in the PV source connected at node i for the period of time h. The sets that contain all the nodes, the periods of time for daily operation, and the periods of time of the planning stage are denoted as N , H , and T , respectively.
Remark 1.
The main advantage of the objective function presented in Equation (1), with its components defined from (2) to (4), is that it is a convex objective function when the power generation at the substation bus ( p s i , h s u b ) and the nominal sizes of the PV generation units are considered as variables, i.e., p i p v , taking into account that the remaining components are defined as constant parameters. Note that this objective function can be used with the same structure in the mixed-integer conic model presented in Section 3 due to its intrinsically convex structure.

2.2. Constraints

To locate and size PV generators in radial AC distribution networks, it is necessary to consider multiple linear and nonlinear constraints associated with the technical operation of the distribution network. These constraints include active and reactive power balance, voltage drops in lines, power transference per line, and son on. The complete list of constraints is presented below.
p i j , h R i j i i j , h 2 k : ( j k ) L p j k , h = P j , h d p j , h p v , j N , j slack , h H ,
q i j , h X i j i i j , h 2 k : ( j k ) L q j k , h = Q j , h d , j N , j slack , h H ,
v j , h 2 = v i , h 2 2 R i j p i j , h + X i j q i j , h + R i j 2 + X i j 2 i i j , h 2 i j L , h H ,
p i j , h 2 + q i j , h 2 = v i , h 2 i i j , h 2 , i j L , h H
x j P p v min G h p v p j , h p v x j P p v max G h p v j N ,
v j min v j , h v j max j N , h H ,
i i j max i i j , h i i j max i j L , h H ,
i N x j N p v max ,
x j 0 , 1 , i N ,
where p i j , h and q i j , h are the active and reactive power flow leaving node i towards destination j at time h; p j k , h and q j k , h are the active and reactive power sent from node j to any node k different from node i for each period of time; P j , h d and Q j , h d correspond to the total constant power consumption at node j for the period of time h; p j , h p v is the total power injected by the PV source connected at node j for each period of time; R i j and X i j represent the resistance and inductance effects in the distribution line in route i j ; i i j , h is the variable associated with the current flow through the line that connects nodes i and j at each period of time; v i , h and v j , h correspond to the voltage magnitudes at nodes i and j for each period of time h, respectively; x j is a binary variable associated with the possibility of assigning a PV source at node j ( x j = 1 ) or not ( x j = 0 ); N p v max is a constant parameter related to the number of PV sources available for inclusion in the distribution network. The set that contains all the branches of the network is L .
Note that the set of constraints (5)–(13) can be understood as follows: Equations (5) and (6) correspond to the power balance equilibrium evaluated at each node per period of time; Equation (7) represents the voltage drop at each line, which is a function of the active and reactive power flows, as well as the branch parameters (i.e., resistance and inductance) and the current flow though the line that connects nodes i and j; Equation (8) corresponds to the application of Tellegen’s second theorem to each sending node i in order to define the apparent power flow leaving it [40]; box-type constraint (9) defines the upper and lower active power generation bounds assigned for a PV source connected at node j for each period of time in the case that the binary variable x j is activated; box-type constraints (10) and (11) define the voltage regulation bounds applicable to all nodes and periods of time, as well as the thermal bounds regarding the distribution lines’ current transport capacity; inequality constraint (12) defines the maximum number of renewable sources based on PV technology that can be included into the distribution network under study; Equation (13) describes the binary nature of the decision variable x j .

2.3. Model Characterization

Figure 1 summarizes the main characteristics of the optimization model (1)–(13). Note that the studied optimization model is only nonlinear and non-convex in its continuous part, which is associated with the active and reactive power balance constraints, voltage drops per line, and the calculation of the apparent power [13].
Remark 2.
As demonstrated in [37], it is possible to transform the set of nonlinear constraints (5)–(8) into a conic set of constraints, which allows transforming the exact MINLP model (1)–(13) into a mixed-integer conic (MIC) model, as presented in the next section.

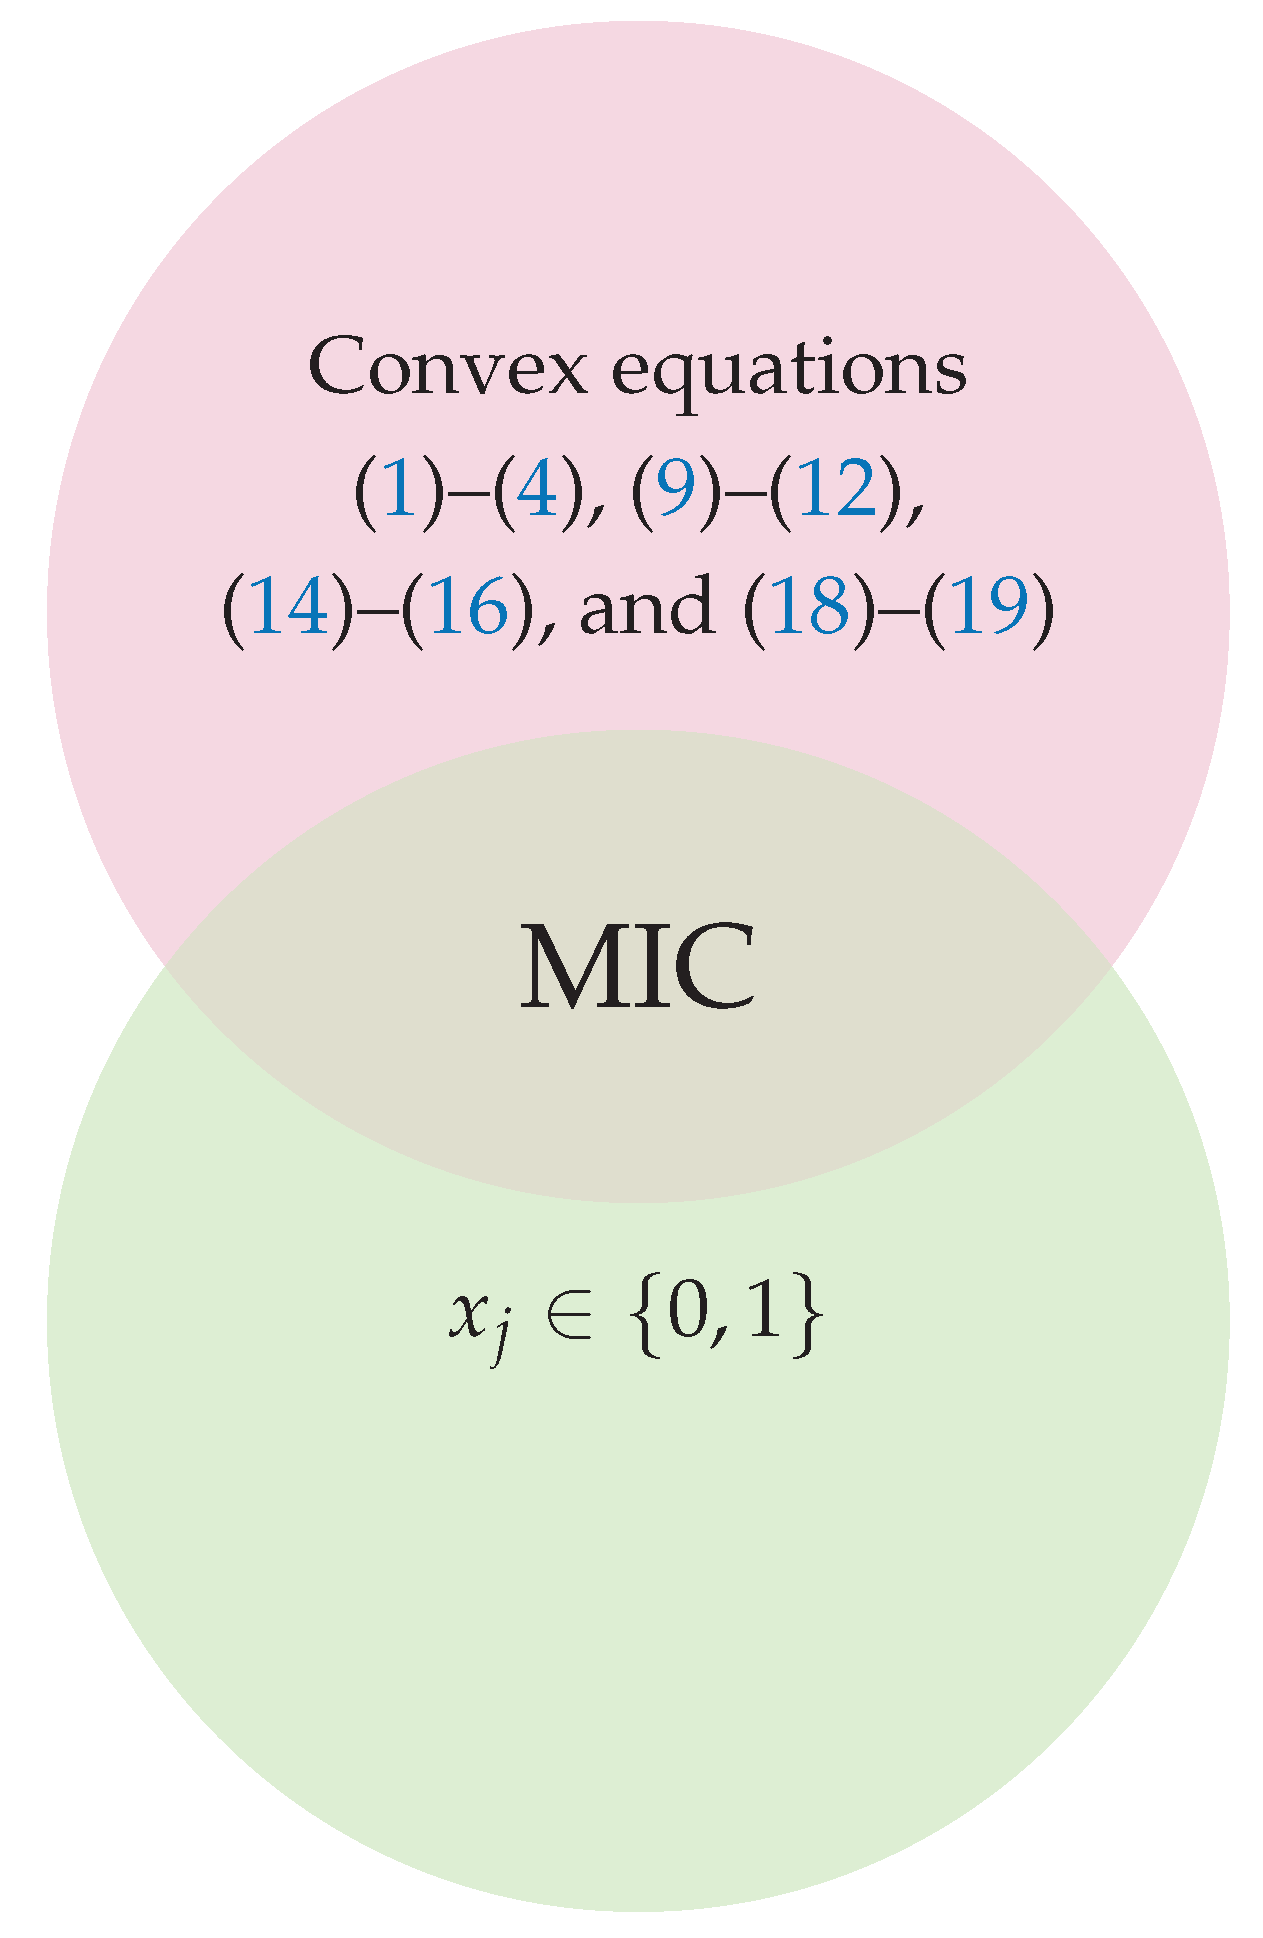
3. Mic Reformulation

The main contribution of this research is the reformulation of the exact MINLP model (1)–(13), especially the subset of constraints (5)–(8) as a set of conic constraints based on the branch flow theory for distribution networks presented in [37]. To this effect, the following set of auxiliary variables is used: l i j , h = i i j , h 2 , w i , h = v i , h 2 , and w j , h = v j , h 2 [41]. Note that, with the aforementioned definition of the auxiliary variables, the set of constraints (5)–(7) can be directly transformed into a set of linear affine (i.e., convex) constraints. These equations take the following form:
p i j , h R i j l i j , h k : ( j k ) L p j k , h = P j , h d p j , h p v , j N , j slack , h H ,
q i j , h X i j l i j , h k : ( j k ) L q j k , h = Q j , h d , j N , j slack , h H ,
w j , h = w i , h 2 R i j p i j , h + X i j q i j , h + R i j 2 + X i j 2 l i j , h i j L , h H .
To become a conic constraint, Equation (8) uses the concept of hyperbolic equivalence between the product of two variables [37].
p i j , h 2 + q i j , h 2 = v i , h 2 i i j , h 2 , i j L , h H p i j , h 2 + q i j , h 2 = w i , h l i j , h , i j L , h H p i j , h 2 + q i j , h 2 = 1 4 w i , h + l i j , h 2 1 4 w i , h l i j , h 2 , i j L , h H 2 p i j , h 2 + 2 q i j , h 2 = w i , h + l i j , h 2 w i , h l i j , h 2 , i j L , h H 2 p i j , h 2 + 2 q i j , h 2 + w i , h l i j , h 2 = w i , h + l i j , h 2 , i j L , h H 2 p i j , h 2 q i j , h w i , h l i j , h = w i , h + l i j , h , i j L . h H ( )
Equation system (17) is still non-linear and non-convex due to the use of the equality symbol since it corresponds to the surface of a hypersphere, which requires additional relaxation to become a conic convex constraint [37]. To achieve this, the equality symbol is replaced with a lower-equal symbol, as defined in Inequality (18).
2 p i j , h 2 q i j , h w i , h l i j , h w i , h + l i j , h , i j L . h H ( )
A modification of the objective function (1) is made in order to consider the effect of the annual costs of the energy losses while deciding the optimal siting and sizing of the PV sources. This effect is only included in the conic model to improve its solution properties, since power losses can be represented as quadratic (as a function of the variable i i j , h ) or as linear (as a function of the auxiliary variable l i j , h ) function:
z d = β C kWh T h H i j NL R i j l i j , h Δ h .
Note that β is the factor assigned to the calculation of the energy losses. In order to control its effect on the objective function value, this factor takes three possible values: 0, 1 / 2 , and 1. The location and size of the PV source with each factor is illustrated in the results section.
Figure 2 illustrates the transformation of the MINLP model presented in Figure 1, where there are only linear affine equations and binary constraints.
Remark 3.
To ensure that the global optimum is found via the proposed MIC model, it is possible to implement the Branch and Cut method in conjunction with the interior point approach, as presented in [42], to deal with mixed-integer conic models.
In order to guarantee that the solution is reached by the MIC model, it is evaluated in the exact MINLP model by fixing all the binary variables on it, which reduces it to a daily optimal power flow model, thus ensuring that the exact behavior of the objective function is known, as well as the PV generation outputs, as recommended in [13].

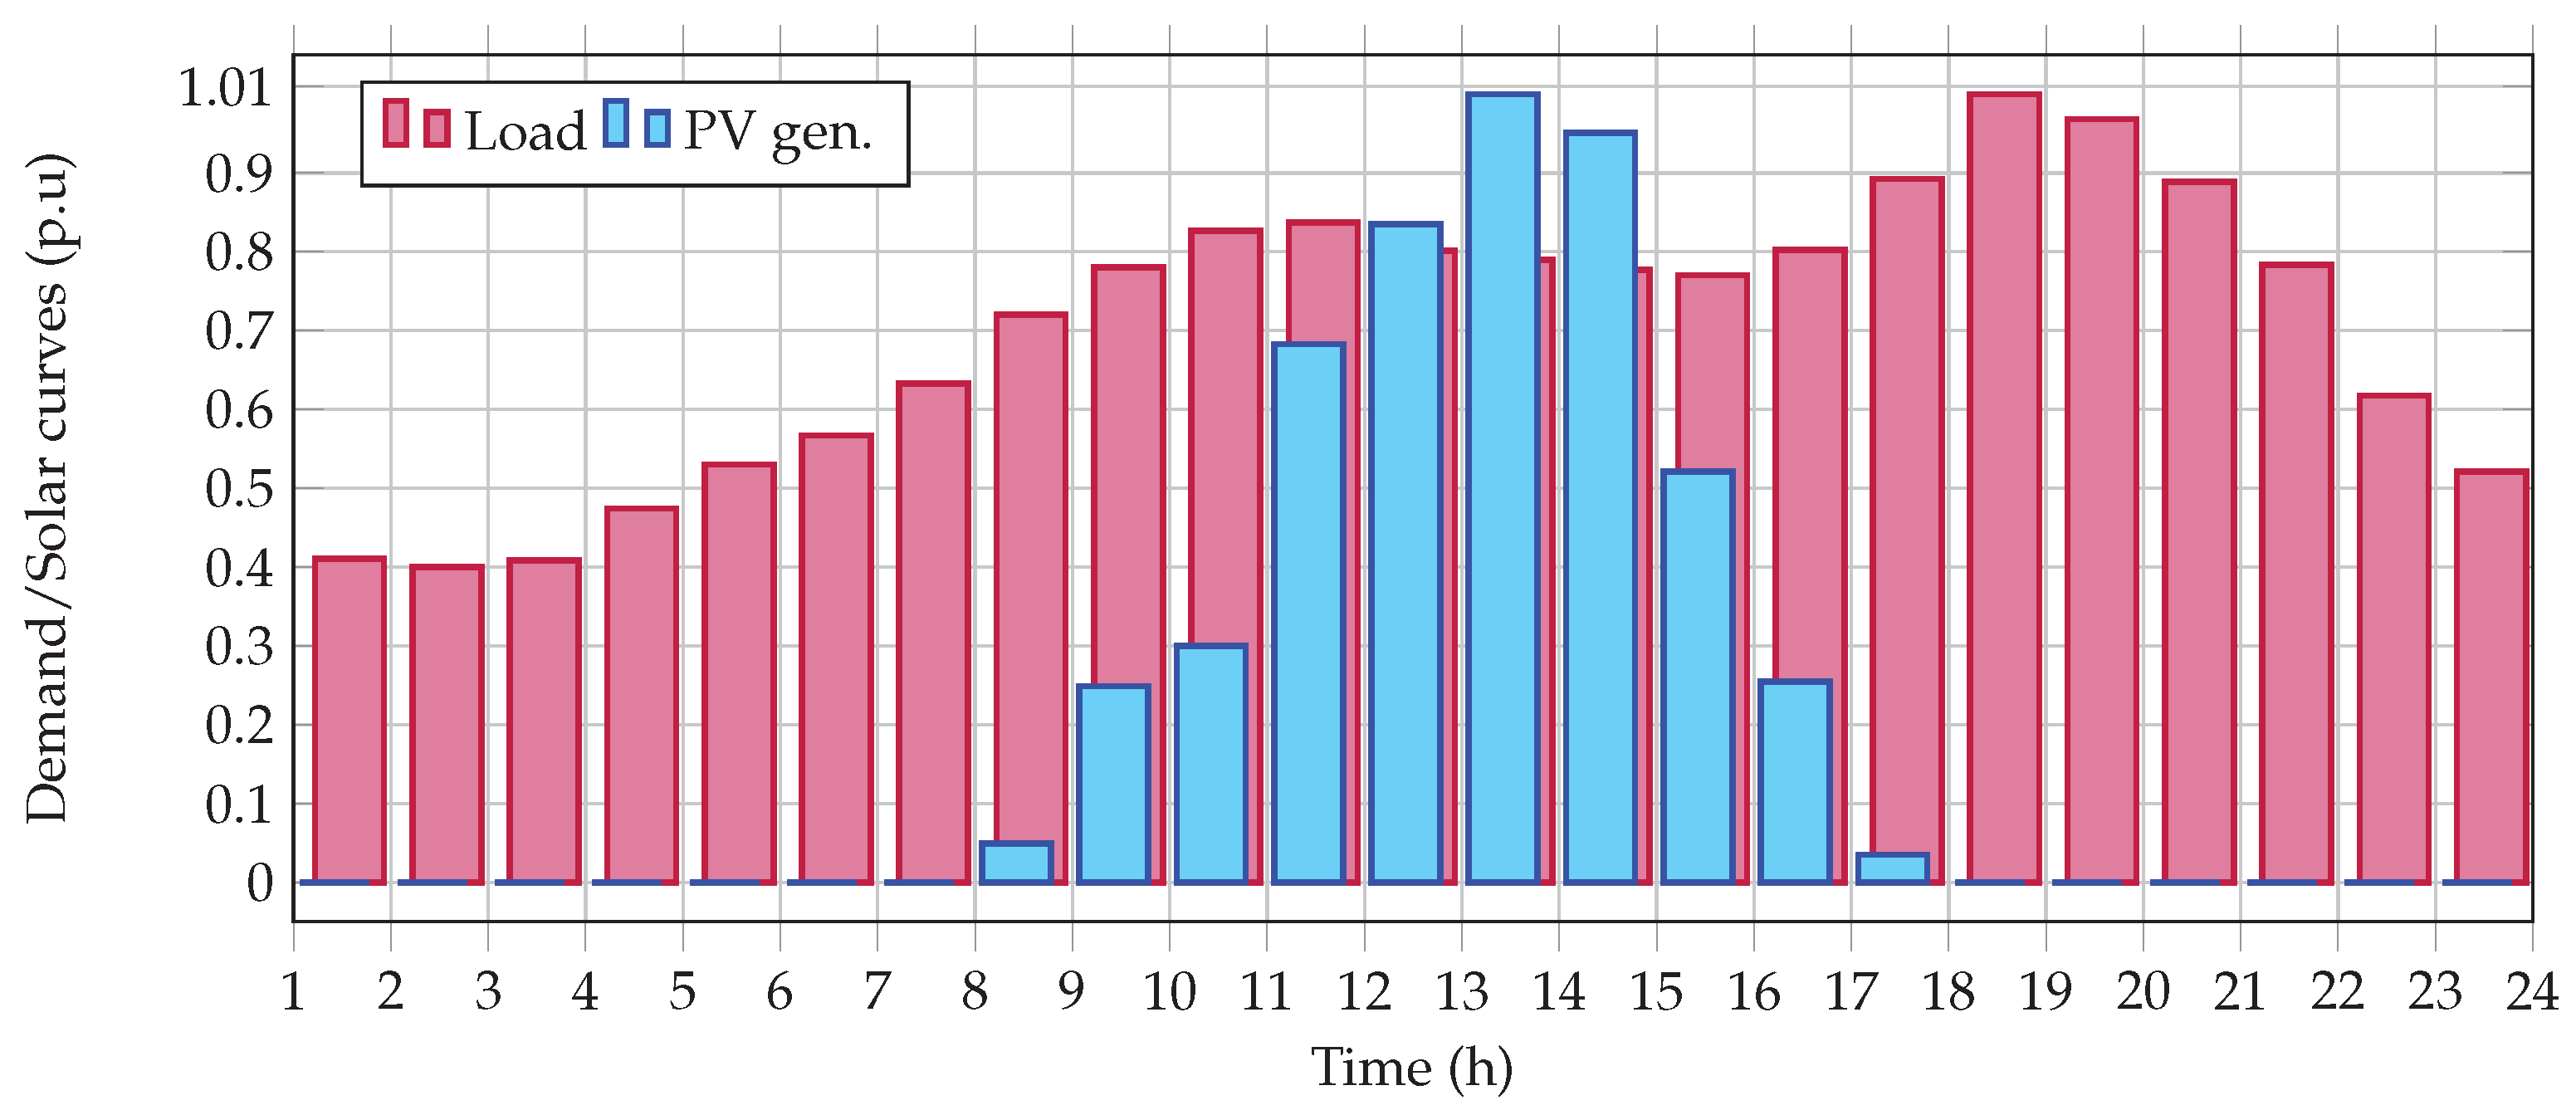
4. Test Feeders and Model Parameters

This section presents the main characteristics of the test feeders employed for all the numerical validations, as well as a model characterization to calculate the objective function and the behavior of the demand and solar generation curves.

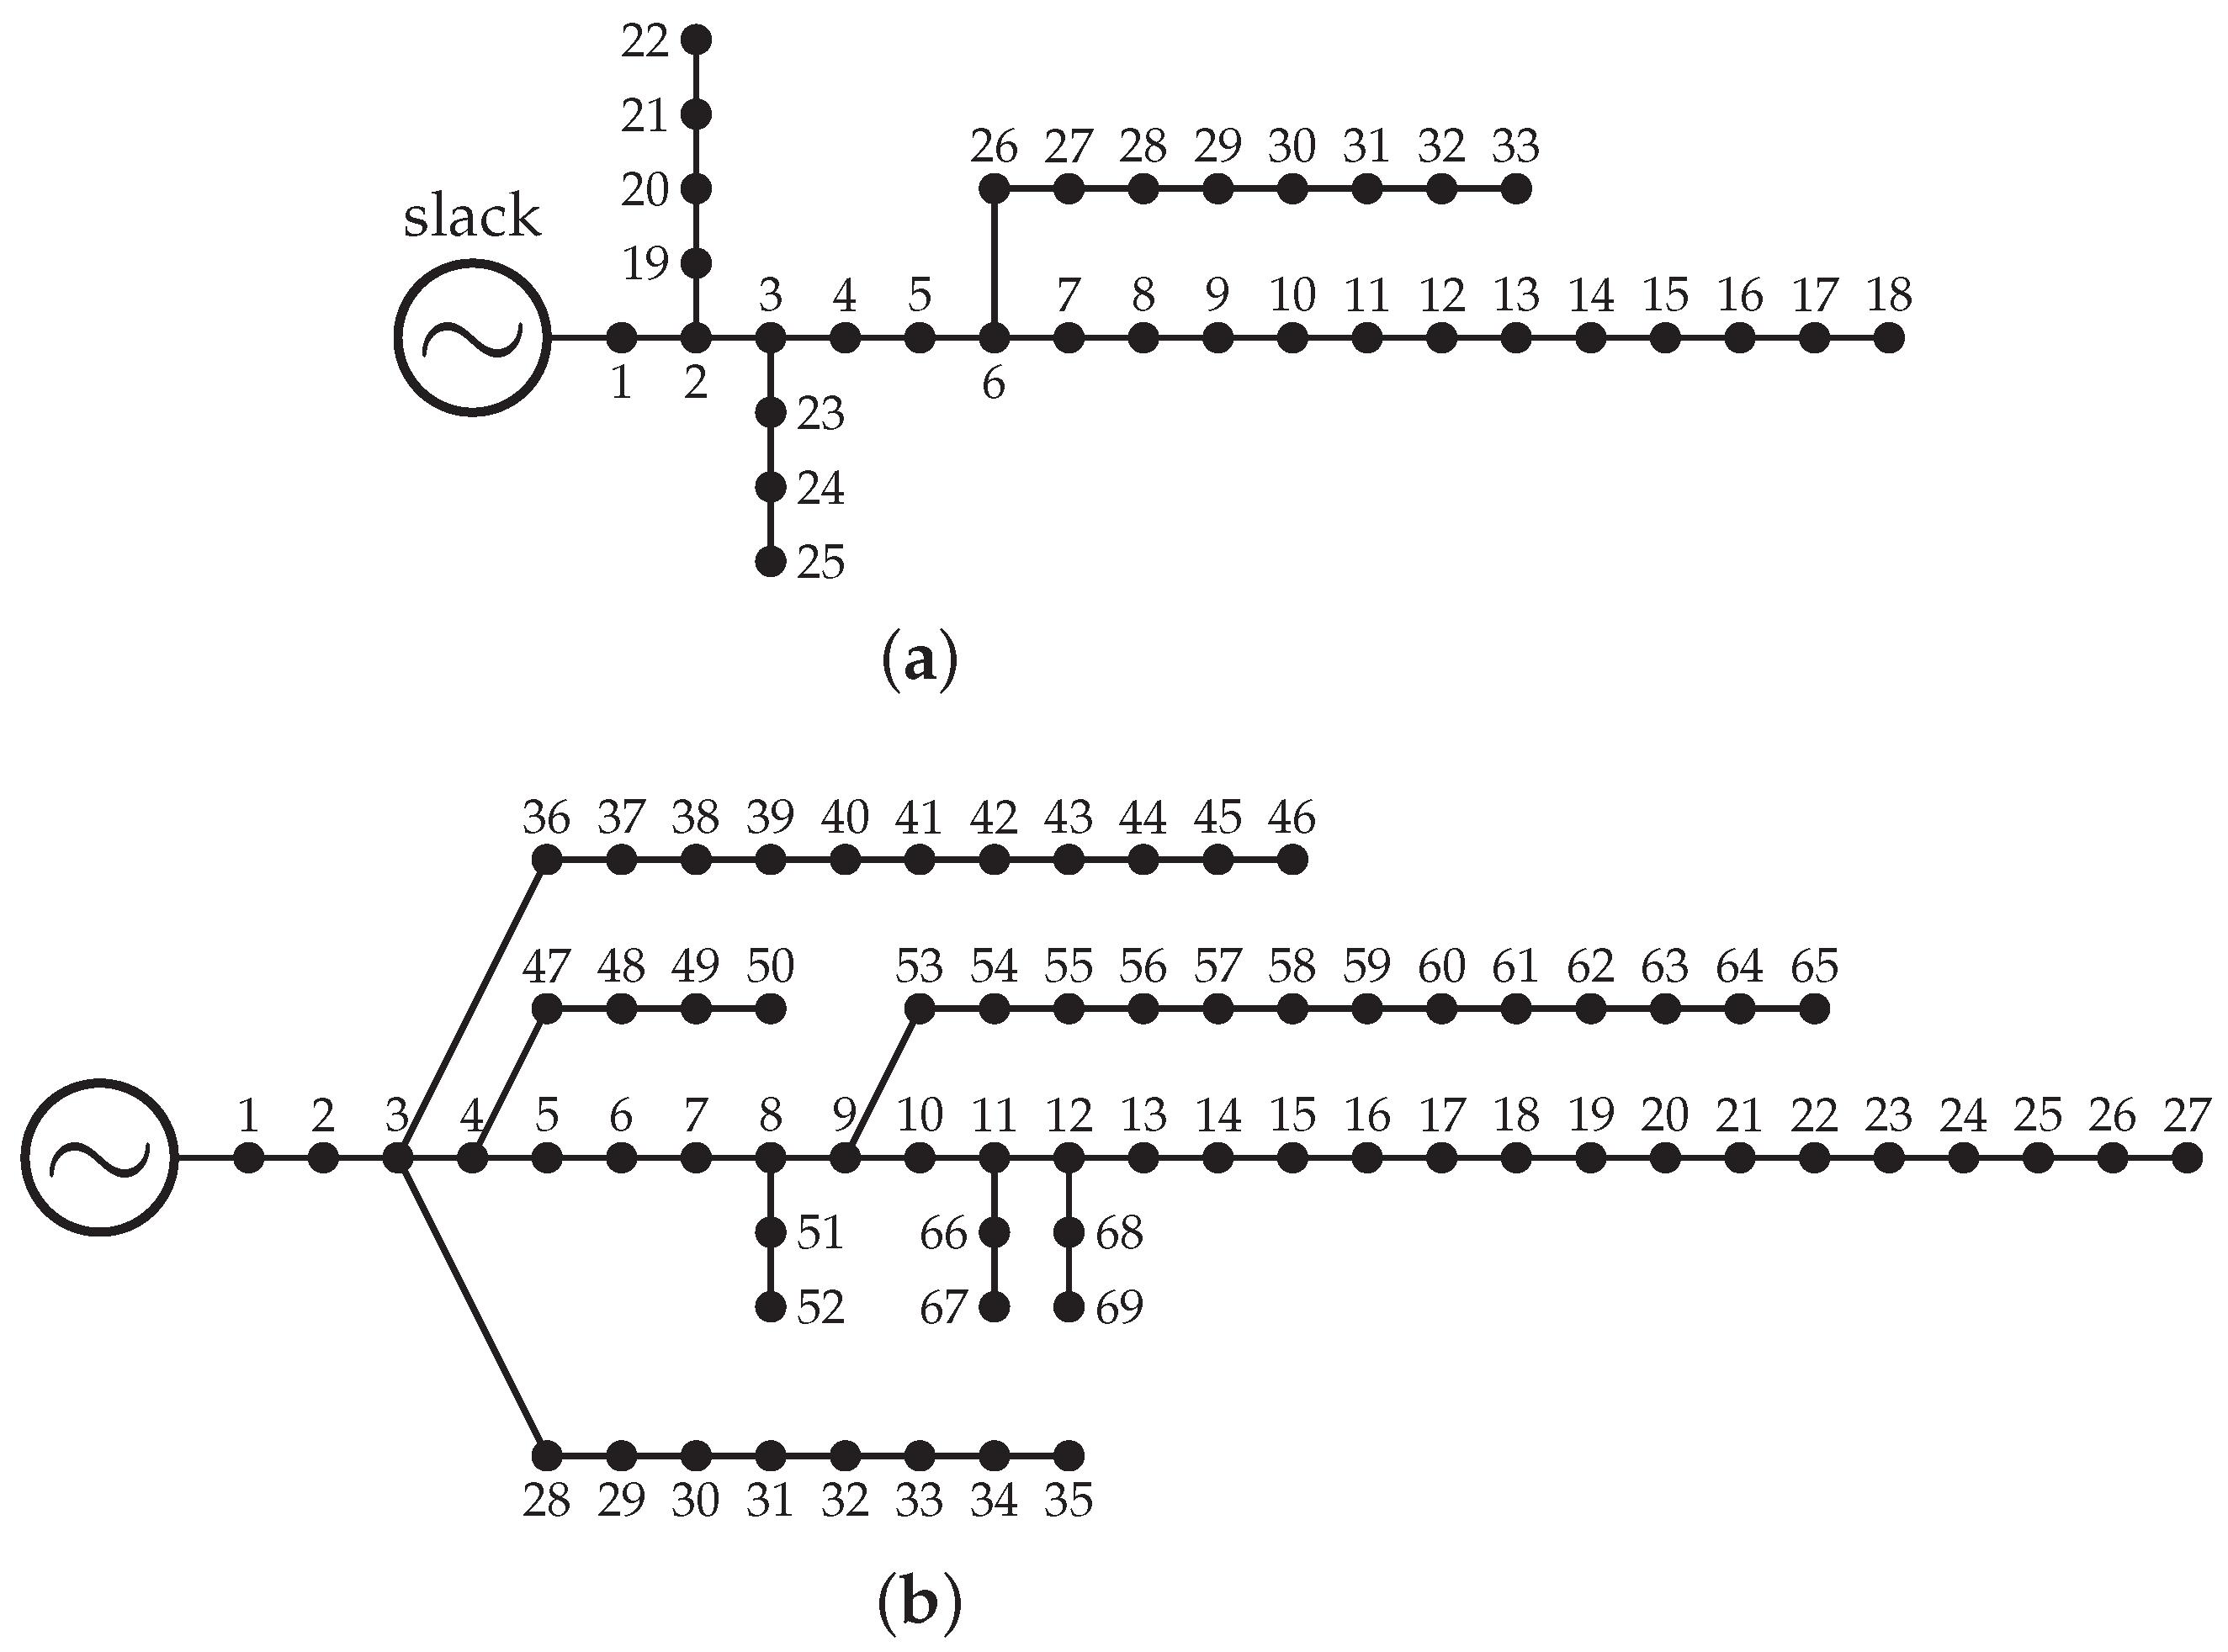
4.1. IEEE 33-Bus Network

This network is a radial electrical distribution system composed of 33 nodes and 32 lines, which is operated with a line-to-ground voltage magnitude of 12.66 kV in terminals of the substation connected at bus 1. The electrical configuration of this test feeder is depicted in Figure 3a, and its electrical data are reported in Table 1.

4.2. IEEE 69-Bus Network

This system is also a radial distribution network with 69 nodes and 68 lines operated with a line-to-ground voltage of 12.66 kV in terminals of the substation connected at node 1. The electrical configuration of this test feeder is depicted in Figure 3b, and its electrical parameters are presented in Table 2.

4.3. Parameters for the Economic Assessment

To evaluate the objective function and its components, i.e., Equations (1)–(4), all the parameters listed in Table 3 are considered.
The mean average generation and demand curves for the metropolitan area of Medellín, Colombia, were used to model the daily behavior of the demand and generators in two test feeders. These curves are plotted in Figure 4.

5. Computational Validations

The proposed MIC model for siting and size PV generation units in AC distribution networks with a radial structure was implemented in the MATLAB software version 2021b from MathWorks (Natick, MA, USA). To solve the MIC model, the convex disciplined tool known as CVX was used with the Gurobi solver. All the implementations were conducted on a desktop computer with an Intel(R) Core(TM) i7-7700 2.8-GHz processor and 16.0 GB of RAM running a 64-bit version of Microsoft Windows 10 Home.
To compare the effectiveness and robustness of the proposed MIC model in determining the optimal PV sizes and locations, as well as their daily dispatch, multiple metaheuristic algorithms available in the current literature were used, namely (i) the Chu and Beasley Genetic Algorithm [26], (ii) the Newton Metaheuristic Algorithm (NMA) [27], (iii) the Modified Gradient-Based Metaheuristic Optimizer (MGbMO) [29], (iv) Generalized Normal Distribution Optimization (GNDO) [33], (v) the Modified Arithmetic Optimization Algorithm (MAOA) [32], and (vi) the Discrete-Continuous Vortex Search Algorithm (DCVSA) [31].
Remark 4.
The solutions reached with each metaheuristic optimization algorithm assumed that the PV generation units were operated using the maximum power point tracking algorithm, i.e., the PV curve in Figure 4 was perfectly followed; however, in the case of the proposed MIC model, the PV generation units were freely operated, i.e., they did not necessarily reach the maximum power depicted in the PV curve of Figure 4.
In order to implement all the comparative metaheuristic optimizers, a discrete-continuous codification based on the proposal presented in [26] is employed. This codification takes the structure defined in (20).
X sol = 8 , k , 20 , | 0.9856 , p k p v , 1.5885 ,
where X sol represents a possible solution individual in which the first N p v max components are related to discrete variables that define the potential nodes where the PV sources will be assigned, and the positions N p v max + 1 to 2 N p v max determine the potential sizes assigned to these PV sources.
Due to the fact that metaheuristic optimizers such as the gradient-based or the Newton-based approaches are defined in the continuous domain, in order to apply their evolution rules, the integer nature of the decision variables is relaxed; however, once the new individual is found, it is rounded in its first N p v max to maintain the feasibility of the solution space during the exploration and exploitation searching processes.

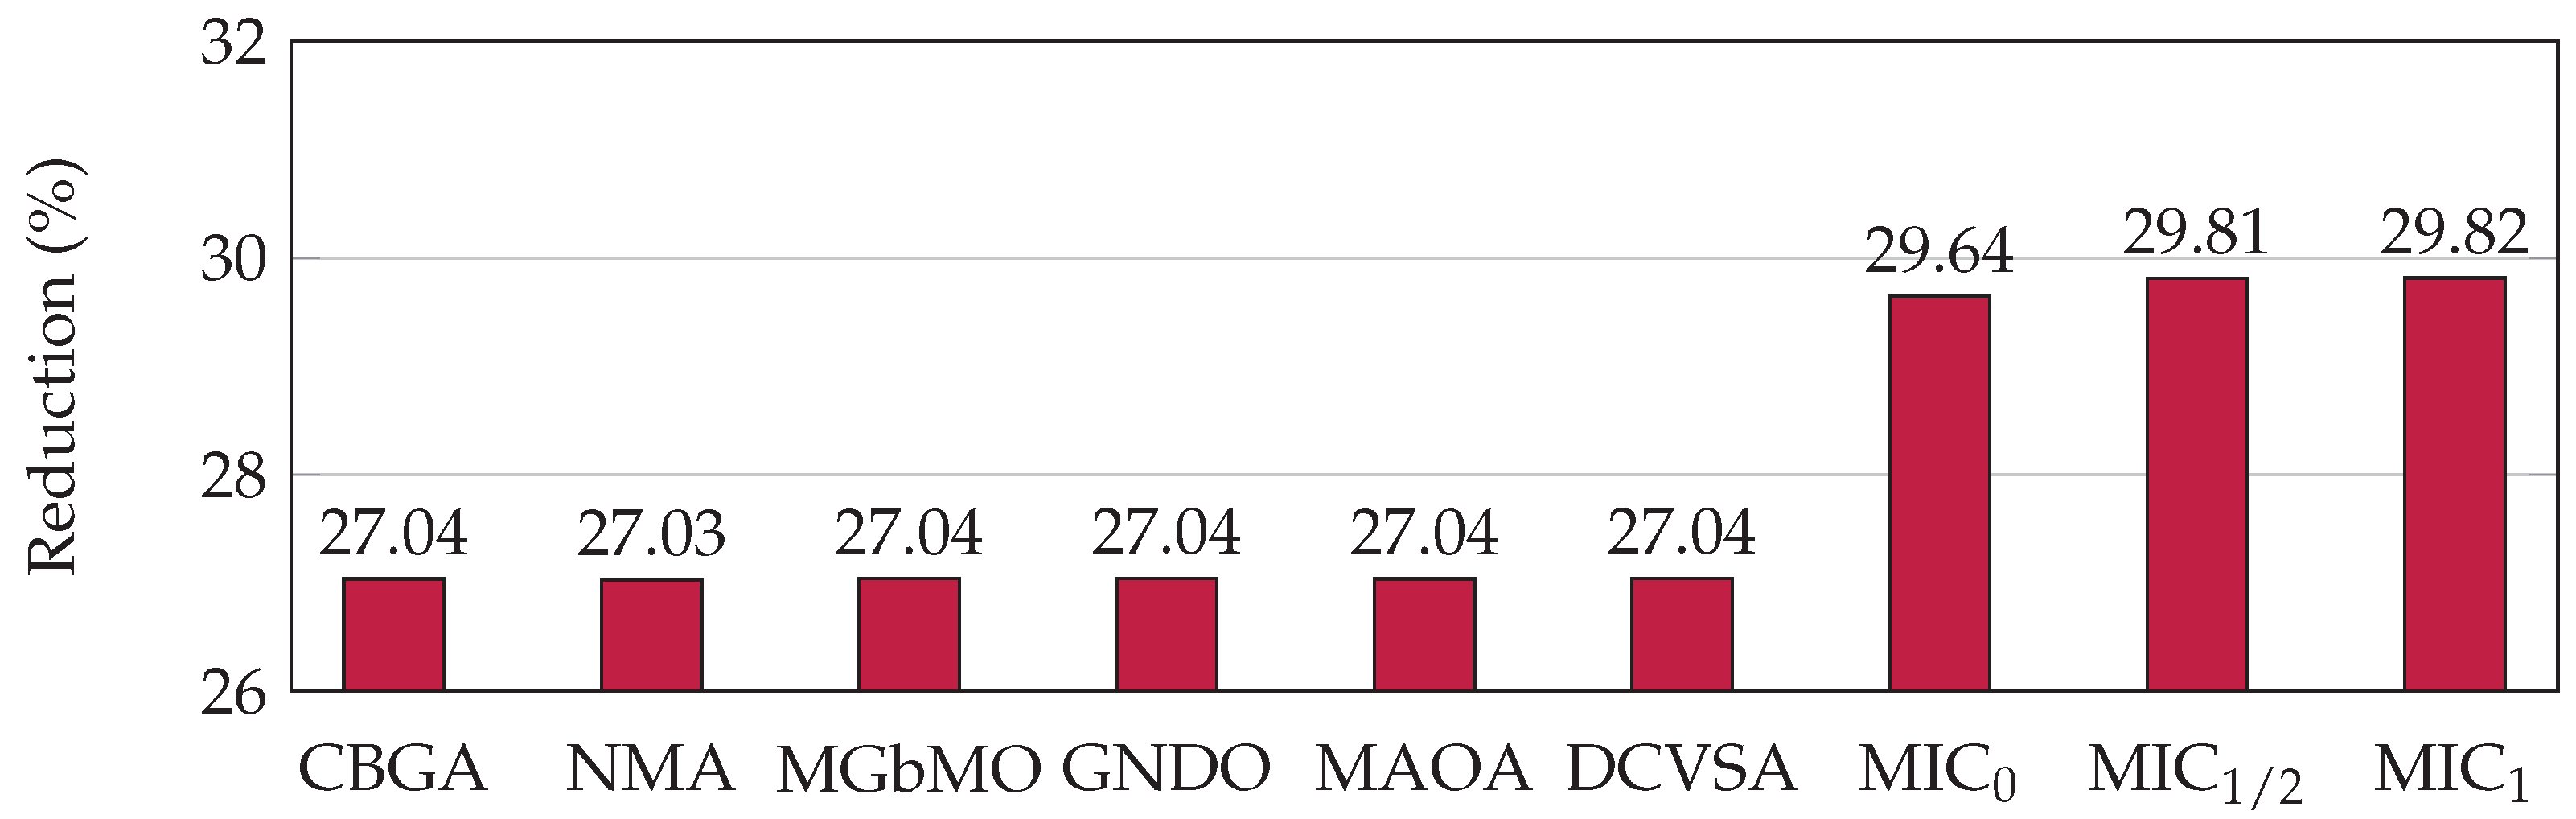
5.1. IEEE 33-Bus Network

Table 4 presents the numerical performance of all the metaheuristic optimizers and the proposed MIC model for the IEEE 33-bus network.
The numerical results in Table 4 show that:
  • The best metaheuristic approach for the IEEE 33-bus grid was the GNDO method, with an objective function of USD/year 2,699,671.75 ; and the worst metaheuristic optimizer was the NMA, with an objective function value of USD/year 2,700,227.33 ; however, both solutions only differed by about USD/year 555.58 . These values imply that all solution methodologies based on the application of metaheuristic methods reported in Table 4 are contained between both bounds.
  • The proposed MIC model with different β -values found objective function values between USD/year 2,603,465.00 and USD/year 2,597,139.00 , i.e., there is a difference of about USD/year 6326 when β = 0 and β = 1 .
  • By comparing the GNDO solution (the best solution among the metaheuristic approaches) and the MIC solution with β = 1 , the difference was about USD/year 102,532.75 . This confirms that the operation of the PV generators without maximum power point tracking is considerably better than the approaches where the PV sources are forced to follow the maximum power point (see metaheuristic results).
  • As for the places and sizes of the PV generators, it was observed that, in the case of the MIC model, the β parameter (i.e., the effect of the power losses) has a significant impact on the final nodal location of the PV generation sources, and well as on their sizes; however, in the objective function, this effect is minimized due to the multi-modal behavior of the solution space in the exact MINLP formulation. This behavior of the studied problem also explains the multiplicity in the set of solutions reported by all the metaheuristic optimizers.
It is worth mentioning that, regarding processing times, the proposed MIC models for the IEEE 33-bus grids take about 45 s to solve the conic model, which is an adequate processing time considering the dimension of the solution space, as there are about 4960 options for discrete variables, with the main advantage that the final solution reached is indeed the global optimal one.
Regarding the annual expected improvements in the objective function, Figure 5 presents the percentage of reductions reached by each optimization method with respect to the benchmark case.
The behavior of the expected annual reductions implies the following: (i) all metaheuristic optimizers that operated using the concept of maximum power point tracking found solutions with reductions between 27.03 % and 27.04 % , i.e., a difference lower than 0.01 % , which allows concluding that, in the IEEE 33-bus network, all the metaheuristic methods have a very good performance (however, these are indeed local optimal solutions, since it is not possible to prove that these algorithms reach the global optimal solution due to their random-based nature); (ii) the MIC model reached reductions between 29.64 % and 29.82 % , where the difference is associated with the inclusion of the β coefficient in the objective function. Nevertheless, all of the MIC solutions improved the objective function values by more than USD 100,000 with respect to the metaheuristic approaches. As mentioned above, this improvement is due to the fact that the MIC model allows operating the PV sources not necessarily with maximum power point tracking. Note that each one of the MIC models provides an optimal solution, but they differ from each other because each one depends on the value assigned to the β parameter, which implies that each objective function is different.

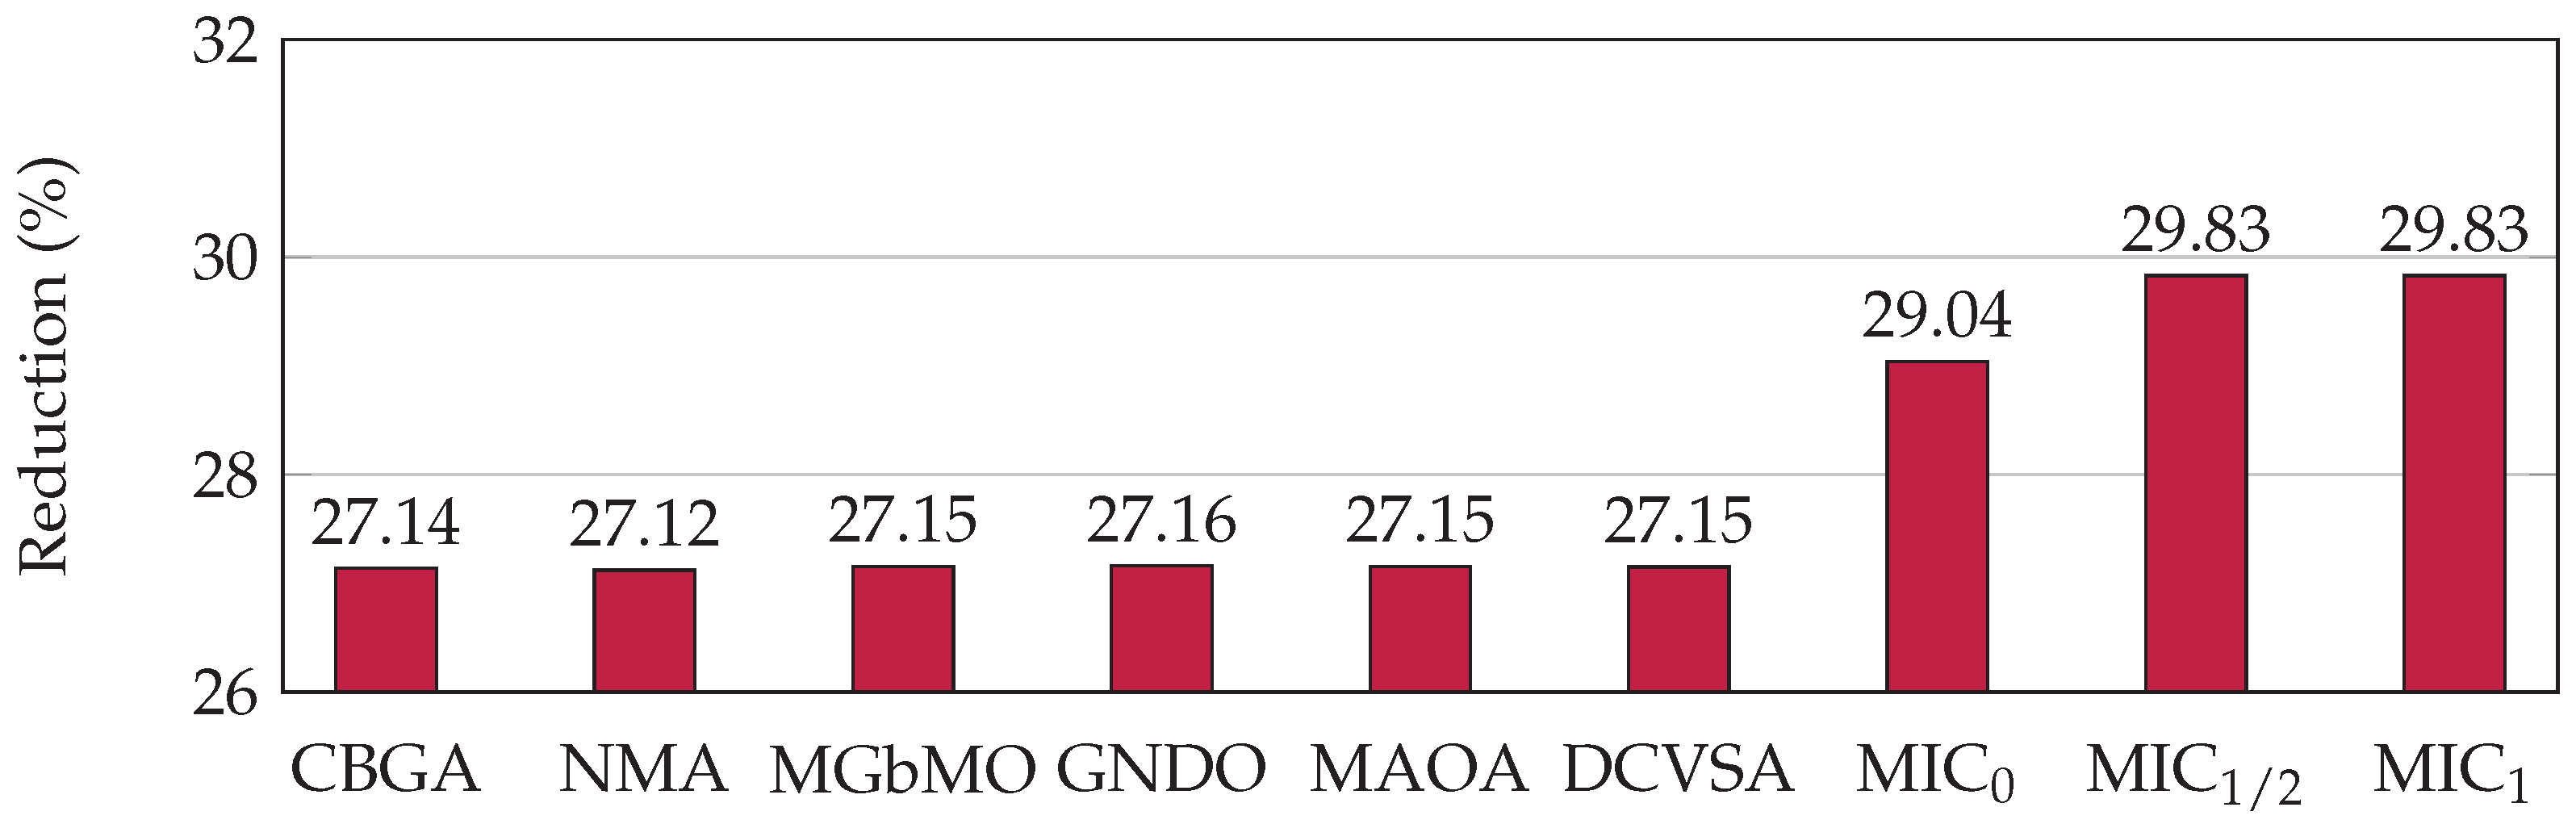
5.2. IEEE 69-Bus Network

Table 5 presents the comparative analysis between the performance of the metaheuristic optimizers reported in the specialized literature and that of the proposed MIC model with different β coefficients.
The numerical results in Table 5 show that:
  • The best metaheuristic optimization algorithm was the GNDO approach, with a final objective function of USD/year 2,824,923.38 ; while the worst metaheuristic approach was the NMA, with an objective function value of USD/year 2,826,368.60 . The difference between both solutions was about USD/year 1445.22 . Note that all the remainder metaheuristic methods are between the solutions reported by the GNDO and the NMA.
  • The MIC models with β = 1 / 2 and β = 1 reached the same objective function value, i.e., USD/year 2,721,282.00 , which corresponds to the best objective function value presented in this research for the IEEE 69-bus network. By comparing the best MIC solution with the GNDO approach, an improvement of USD/year 103,641.38 in favor of the proposed conic model was found.
  • The results obtained with the MIC model confirmed that, in the IEEE 69-bus system, the use of PV generators without maximum power point tracking allows for better results than the operation following this point, as evidenced by the metaheuristic methods.
As for processing times, in the IEEE 69-bus grid, the proposed MIC models take about 438 s to solve the conic model, which is an adequate processing time considering the dimension of the solution space, as there are about 50116 options regarding discrete variables. Note that, even though this processing time is high when compared to metaheuristic approaches, it has the advantage that the global optimal solution is reached with 100% of certainty, which is not possible with any metaheuristic model due to their random-based nature.
On the other hand, Figure 6 depicts the expected reductions of the metaheuristic and the MIC models in the IEEE 69-bus network when compared to the benchmark case.
In the case of the IEEE 69-bus network, all the analyzed metaheuristic methods reached improvements between 27.12 % and 27.16 % regarding the objective function, i.e., there were differences lower than 0.04 % . This small difference confirmed that all the metaheuristic optimizers are adequate to solve the problem concerning the optimal placement and sizing of PV generation units; however, these solutions remain classified as sub-optimal due to the impossibility of theoretically ensuring their global nature. The MIC models showed additional improvements of about 1.88 % and 2.67 % in the objective function value when compared to the GNDO approach (the best metaheuristic method). These improvements confirmed that, when the maximum power point is not tracked, it is possible to reach better results regarding the final objective function value when studying the problem of the optimal placement and sizing of PV generators in distribution networks, with the main advantage that the solutions provided by the models are the global optimum for each assigned value in the β parameter.

6. Conclusions

The problem regarding the optimal siting and sizing of PV generation units in radial AC distribution networks was addressed in this research by transforming the exact MINLP model into a MIC one. Numerical results in the IEEE 33- and IEEE 69-bus networks showed that: (i) in both test feeders, the best metaheuristic optimization method was the GNDO method, with improvements in the final objective function value of about 27.04 % and 27.16 % , respectively; (ii) all the metaheuristic optimization methods showed improvements higher than 27.03 % in the IEEE 33-bus network and 27.12 % in the IEEE 69-bus network, which confirmed that all the studied combinatorial optimization approaches are suitable for solving the problem under study with excellent numerical results; (iii) operating the PV generators while applying maximum power point tracking showed solutions higher than USD/year 2,699,600.00 for the IEEE 33-bus system, while the IEEE 69-bus network showed solutions higher than USD/year 2,824,900.00 ; however, when the grids are freely operated during the day, these values can reduced by about USD/year 100,000 per test feeder, as was demonstrated with the MIC model for different β coefficients.
The main advantage of the proposed MIC model is that it is possible to ensure that the global optimum is found via the interior point method combined with the Branch and Cut optimization approach, which implies that the solution for each β coefficient will be the same in each run; however, when metaheuristic optimization methods are applied to solve MINLP models, statistical tests are required in order to guarantee their adequate performance. Nevertheless, global optimum finding properties can not be attributed to these methodologies.
As future work, it will be possible to conduct the following studies: (i) combining PV generation units with reactive power compensators for annual cost reductions in distribution networks and (ii) extending the proposed MIC model to direct current networks with monopolar and bipolar configurations.

Author Contributions

Conceptualization, methodology, software, and writing (review and editing): O.D.M., C.A.R.-P., and L.F.G.-N. All authors have read and agreed to the published version of the manuscript.

Funding

This research was supported by Minciencias, Universidad Nacional de Colombia, Universidad del Valle, and Instituto Tecnológico Metropolitano under the research project “Dimensionamiento, planeación y control de sistemas eléctricos basados en fuentes renovables no convencionales, sistemas de almacenamiento y pilas de combustible para incrementar el acceso y la seguridad energética de poblaciones colombianas” (Minciencias code 70386), which belongs to the research program “Estrategias para el desarrollo de sistemas energéticos sostenibles, confiables, eficientes y accesibles para el futuro de Colombia” (Minciencias code 1150-852-70378, Hermes code 46771).

Institutional Review Board Statement

Not applicable.

Informed Consent Statement

Not applicable.

Data Availability Statement

The data used in this study are reported in the paper’s figures and tables.

Acknowledgments

The authors thank the Department of Mines (Medellín branch) of Universidad Nacional de Colombia.

Conflicts of Interest

The authors declare no conflict of interest.

Nomenclature

The following abbreviations are used in this manuscript:
z cost Annual expecting operative costs of the distribution network (USD/year).
z a Expected annual energy costs in terminals of the substation bus (USD/year).
z b Annualized investment costs in PV generation units (USD/year).
z c Expected annual operation and maintenance costs of the PV sources installed in the
distribution network (USD/year).
C kWh Expected energy purchasing costs in terminals of the substation (USD/kWh-year).
TTotal number of days in an ordinary year (days).
R a Expected return rate of the investments made by the distribution company (%).
YTotal number of years of the planning period (years).
R e Expected rate of increment for the energy costs during the planning period (%).
p s i , h s u b Power generation in the substation bus for each period of time h (power sent from node s
to node i) (W).
Δ h Length of the period of time in which the variables take fixed values (h).
C p v Cost of acquisition of a PV source per unit of generation (USD/Wp).
p i p v Nominal size of a PV generator connected at node i (Wp).
C O & M Maintenance and operation costs per unit of energy generation in the PV sources (USD/Wh).
p i , h p v Active power generation in the PV source connected at node i for period of time h (W).
N Set that contains all the nodes of the network.
H Set that contains all the periods in a daily operation scenario.
T Set that contains all the years of the planning period.
p i j , h Active power flow leaving node i towards destination j at time h (W).
q i j , h Reactive power flow leaving node i towards destination j at time h (var).
p j k , h Active power flow leaving node j towards destination k at time h (W).
q j k , h Reactive power flow leaving node j towards destination k at time h (var).
P j , h d Total active power consumption at node j for period of time h (W).
Q j , h d Total reactive power consumption at node j for period of time h (var).
p j , h p v Total power injected by the PV source connected at node j for each period of time h (W).
R i j Resistance effect in the distribution line in route i j ( Ω ).
X i j Reactance effect in the distribution line in route i j ( Ω ).
i i j , h Current flow through the line that connects nodes i and j in each period of time h (A).
v i , h Voltage magnitude at node i for each period of time h (V).
v j , h Voltage magnitude at node j for each period of time h (V).
x j Binary variable associated with the possibility of assigning a PV source at node j ( x j = 1 ) or
not ( x j = 0 ).
N p v max Number of PV sources available for inclusion in the distribution network.
L Set that contains all the distribution lines.
l i j , h Square current flow through the line that connects nodes i and j in each period of time h (A 2 ).
w i , h Square voltage magnitude at node i for each period of time h (V 2 ).
w j , h Square voltage magnitude at node j for each period of time h (V 2 ).
z d Expected annual energy loss costs in all the branches of the network (USD/year).
β Factor that allows including or not the expected annual costs of the energy loss.

References

  1. Strezoski, L.; Stefani, I. Utility DERMS for Active Management of Emerging Distribution Grids with High Penetration of Renewable DERs. Electronics 2021, 10, 2027. [Google Scholar] [CrossRef]
  2. Borghetti, A.; Nucci, C.A. Integration of distributed energy resources in distribution power systems. In Integration of Distributed Energy Resources in Power Systems; Elsevier: Amsterdam, The Netherlands, 2016; pp. 15–50. [Google Scholar] [CrossRef]
  3. Chicco, G.; Ciocia, A.; Colella, P.; Leo, P.D.; Mazza, A.; Musumeci, S.; Pons, E.; Russo, A.; Spertino, F. Introduction—Advances and Challenges in Active Distribution Systems. In Lecture Notes in Electrical Engineering; Springer International Publishing: Cham, Switzerland, 2022; pp. 1–42. [Google Scholar] [CrossRef]
  4. Jelti, F.; Allouhi, A.; Büker, M.S.; Saadani, R.; Jamil, A. Renewable Power Generation: A Supply Chain Perspective. Sustainability 2021, 13, 1271. [Google Scholar] [CrossRef]
  5. Marneni, A.; Kulkarni, A.; Ananthapadmanabha, T. Loss Reduction and Voltage Profile Improvement in a Rural Distribution Feeder Using Solar Photovoltaic Generation and Rural Distribution Feeder Optimization Using HOMER. Procedia Technol. 2015, 21, 507–513. [Google Scholar] [CrossRef] [Green Version]
  6. Elkadeem, M.R.; Alaam, M.A.; Azmy, A. Reliability Improvement of Power Distribution Systems using Advanced Distribution Automation. Renew. Energy Sustain. Dev. 2017, 3, 24–32. [Google Scholar] [CrossRef]
  7. Strezoski, L.; Padullaparti, H.; Ding, F.; Baggu, M. Integration of Utility Distributed Energy Resource Management System and Aggregators for Evolving Distribution System Operators. J. Mod. Power Syst. Clean Energy 2022, 10, 277–285. [Google Scholar] [CrossRef]
  8. Fernández, G.; Galan, N.; Marquina, D.; Martínez, D.; Sanchez, A.; López, P.; Bludszuweit, H.; Rueda, J. Photovoltaic Generation Impact Analysis in Low Voltage Distribution Grids. Energies 2020, 13, 4347. [Google Scholar] [CrossRef]
  9. Fischetti, M.; Pisinger, D. Mathematical Optimization and Algorithms for Offshore Wind Farm Design: An Overview. Bus. Inf. Syst. Eng. 2018, 61, 469–485. [Google Scholar] [CrossRef] [Green Version]
  10. Lakshmi, S.; Ganguly, S. Transition of Power Distribution System Planning from Passive to Active Networks: A State-of-the-Art Review and a New Proposal. In Sustainable Energy Technology and Policies; Springer: Singapore, 2017; pp. 87–117. [Google Scholar] [CrossRef]
  11. Gomez, A.L.; Arredondo, C.A.; Luna, M.A.; Villegas, S.; Hernandez, J. Regulating the integration of renewable energy in Colombia: Implications of Law 1715 of 2014. In Proceedings of the 2016 IEEE 43rd Photovoltaic Specialists Conference (PVSC), Portland, OR, USA, 5–10 June 2016. [Google Scholar] [CrossRef]
  12. Lezama, J.M.L.; Villada, F.; Galeano, N.M. Effects of Incentives for Renewable Energy in Colombia. Ing. Univ. 2017, 21. [Google Scholar] [CrossRef] [Green Version]
  13. Montoya, O.D.; Rivas-Trujillo, E.; Hernández, J.C. A Two-Stage Approach to Locate and Size PV Sources in Distribution Networks for Annual Grid Operative Costs Minimization. Electronics 2022, 11, 961. [Google Scholar] [CrossRef]
  14. Mai, T.T.; Nguyen, P.H.; Tran, Q.T.; Cagnano, A.; Carne, G.D.; Amirat, Y.; Le, A.T.; Tuglie, E.D. An overview of grid-edge control with the digital transformation. Electr. Eng. 2021, 103, 1989–2007. [Google Scholar] [CrossRef]
  15. Bjørnebye, H.; Hagem, C.; Lind, A. Optimal location of renewable power. Energy 2018, 147, 1203–1215. [Google Scholar] [CrossRef] [Green Version]
  16. Mosetti, G.; Poloni, C.; Diviacco, B. Optimization of wind turbine positioning in large windfarms by means of a genetic algorithm. J. Wind. Eng. Ind. Aerodyn. 1994, 51, 105–116. [Google Scholar] [CrossRef]
  17. Kåberger, T. Progress of renewable electricity replacing fossil fuels. Glob. Energy Interconnect. 2018, 1, 48–52. [Google Scholar] [CrossRef]
  18. Owusu, P.A.; Asumadu-Sarkodie, S. A review of renewable energy sources, sustainability issues and climate change mitigation. Cogent Eng. 2016, 3, 1167990. [Google Scholar] [CrossRef]
  19. Betakova, V.; Vojar, J.; Sklenicka, P. Wind turbines location: How many and how far? Appl. Energy 2015, 151, 23–31. [Google Scholar] [CrossRef]
  20. Sander, L.; Jung, C.; Schindler, D. Greenhouse Gas Savings Potential under Repowering of Onshore Wind Turbines and Climate Change: A Case Study from Germany. Wind 2021, 1, 1–19. [Google Scholar] [CrossRef]
  21. Oğuz, E.; Şentürk, A.E. Selection of the Most Sustainable Renewable Energy System for Bozcaada Island: Wind vs. Photovoltaic. Sustainability 2019, 11, 4098. [Google Scholar] [CrossRef] [Green Version]
  22. López, A.R.; Krumm, A.; Schattenhofer, L.; Burandt, T.; Montoya, F.C.; Oberländer, N.; Oei, P.Y. Solar PV generation in Colombia - A qualitative and quantitative approach to analyze the potential of solar energy market. Renew. Energy 2020, 148, 1266–1279. [Google Scholar] [CrossRef]
  23. Sihotang, M.A.; Okajima, K. Photovoltaic Power Potential Analysis in Equator Territorial: Case Study of Makassar City, Indonesia. J. Power Energy Eng. 2017, 5, 15–29. [Google Scholar] [CrossRef] [Green Version]
  24. Valencia, A.; Hincapie, R.A.; Gallego, R.A. Optimal location, selection, and operation of battery energy storage systems and renewable distributed generation in medium–low voltage distribution networks. J. Energy Storage 2021, 34, 102158. [Google Scholar] [CrossRef]
  25. Mokarram, M.; Mokarram, M.J.; Khosravi, M.R.; Saber, A.; Rahideh, A. Determination of the optimal location for constructing solar photovoltaic farms based on multi-criteria decision system and Dempster–Shafer theory. Sci. Rep. 2020, 10, 8200. [Google Scholar] [CrossRef]
  26. Montoya, O.D.; Grisales-Noreña, L.F.; Perea-Moreno, A.J. Optimal Investments in PV Sources for Grid-Connected Distribution Networks: An Application of the Discrete–Continuous Genetic Algorithm. Sustainability 2021, 13, 13633. [Google Scholar] [CrossRef]
  27. Montoya, O.D.; Grisales-Noreña, L.F.; Alvarado-Barrios, L.; Arias-Londoño, A.; Álvarez-Arroyo, C. Efficient Reduction in the Annual Investment Costs in AC Distribution Networks via Optimal Integration of Solar PV Sources Using the Newton Metaheuristic Algorithm. Appl. Sci. 2021, 11, 11525. [Google Scholar] [CrossRef]
  28. Feron, S. Sustainability of Off-Grid Photovoltaic Systems for Rural Electrification in Developing Countries: A Review. Sustainability 2016, 8, 1326. [Google Scholar] [CrossRef] [Green Version]
  29. Montoya, O.D.; Grisales-Noreña, L.F.; Giral-Ramírez, D.A. Optimal Placement and Sizing of PV Sources in Distribution Grids Using a Modified Gradient-Based Metaheuristic Optimizer. Sustainability 2022, 14, 3318. [Google Scholar] [CrossRef]
  30. Chowdhury, S.; Matlokotsi, T. Optimal placement and sizing of renewable distributed generation in electricity networks considering different load models. In Proceedings of the 2017 52nd International Universities Power Engineering Conference (UPEC), Heraklion, Greece, 28–31 August 2017. [Google Scholar] [CrossRef]
  31. Cortés-Caicedo, B.; Molina-Martin, F.; Grisales-Noreña, L.F.; Montoya, O.D.; Hernández, J.C. Optimal Design of PV Systems in Electrical Distribution Networks by Minimizing the Annual Equivalent Operative Costs through the Discrete-Continuous Vortex Search Algorithm. Sensors 2022, 22, 851. [Google Scholar] [CrossRef] [PubMed]
  32. Montoya, O.D.; Giral-Ramírez, D.A.; Hernández, J.C. Efficient Integration of PV Sources in Distribution Networks to Reduce Annual Investment and Operating Costs Using the Modified Arithmetic Optimization Algorithm. Electronics 2022, 11, 1680. [Google Scholar] [CrossRef]
  33. Montoya, O.D.; Grisales-Noreña, L.F.; Ramos-Paja, C.A. Optimal Allocation and Sizing of PV Generation Units in Distribution Networks via the Generalized Normal Distribution Optimization Approach. Computers 2022, 11, 53. [Google Scholar] [CrossRef]
  34. Katsigiannis, Y.A.; Georgilakis, P.S.; Karapidakis, E.S. Hybrid Simulated Annealing–Tabu Search Method for Optimal Sizing of Autonomous Power Systems With Renewables. IEEE Trans. Sustain. Energy 2012, 3, 330–338. [Google Scholar] [CrossRef]
  35. Lavaei, J.; Low, S.H. Zero Duality Gap in Optimal Power Flow Problem. IEEE Trans. Power Syst. 2012, 27, 92–107. [Google Scholar] [CrossRef] [Green Version]
  36. Zohrizadeh, F.; Josz, C.; Jin, M.; Madani, R.; Lavaei, J.; Sojoudi, S. A survey on conic relaxations of optimal power flow problem. Eur. J. Oper. Res. 2020, 287, 391–409. [Google Scholar] [CrossRef]
  37. Farivar, M.; Low, S.H. Branch Flow Model: Relaxations and Convexification—Part I. IEEE Trans. Power Syst. 2013, 28, 2554–2564. [Google Scholar] [CrossRef]
  38. Farivar, M.; Low, S.H. Branch Flow Model: Relaxations and Convexification—Part II. IEEE Trans. Power Syst. 2013, 28, 2565–2572. [Google Scholar] [CrossRef]
  39. Kaur, S.; Kumbhar, G.; Sharma, J. A MINLP technique for optimal placement of multiple DG units in distribution systems. Int. J. Electr. Power Energy Syst. 2014, 63, 609–617. [Google Scholar] [CrossRef]
  40. Gallego-Pareja, L.A.; Lopez-Lezama, J.M.; Gomez-Carmona, O. Optimal Placement of Capacitors, Voltage Regulators, and Distributed Generators in Electric Power Distribution Systems. Ingeniería 2020, 25, 334–354. [Google Scholar] [CrossRef]
  41. Montoya-Giraldo, O.D.; Arias-Londoño, A.; Molina-Cabrera, A. Branch Optimal Power Flow Model for DC Networks with Radial Structure: A Conic Relaxation. Tecnura 2022, 26, 30–42. [Google Scholar] [CrossRef]
  42. Benson, H.Y.; Sağlam, Ü. Mixed-Integer Second-Order Cone Programming: A Survey. In Theory Driven by Influential Applications; INFORMS: Catonsville, MD, USA, 2013; pp. 13–36. [Google Scholar] [CrossRef] [Green Version]
Figure 1. Characterization of the optimization model to locate and size PV sources in radial AC distribution networks.
Mathematics 10 02626 g001
Figure 2. Equivalent MIC model to locate and size PV sources in radial AC distribution networks.
Mathematics 10 02626 g002
Figure 3. Grid configuration of the test feeders: (a) IEEE 33- and (b) IEEE 69-node system.
Mathematics 10 02626 g003
Figure 4. Average demand and generation curves in Medellín, Colombia.
Mathematics 10 02626 g004
Figure 5. Reduction percentage for each solution methodology with respect to the benchmark case in the IEEE 33-bus network.
Mathematics 10 02626 g005
Figure 6. Reduction percentage for each solution methodology with respect to the benchmark case in the IEEE 69-bus network.
Mathematics 10 02626 g006
Table 1. Data for the IEEE 33-bus network.
Node iNode j R ij ( Ω ) X ij ( Ω ) P j (kW) Q j (kvar)Node iNode j R ij ( Ω ) X ij ( Ω ) P j (kW) Q j (kvar)
120.09220.04771006017180.73200.57409040
230.49300.251190402190.16400.15659040
340.36600.18641208019201.50421.35549040
450.38110.1941603020210.40950.47849040
560.81900.7070602021220.70890.93739040
670.18720.61882001003230.45120.30839050
781.71141.235120010023240.89800.7091420200
891.03000.7400602024250.89600.7011420200
9101.04000.740060206260.20300.10346025
10110.19660.0650453026270.28420.14476025
11120.37440.1238603527281.05900.93376020
12131.46801.1550603528290.80420.700612070
13140.54160.71291208029300.50750.2585200600
14150.59100.5260601030310.97440.963015070
15160.74630.5450602031320.31050.3619210100
16171.28601.7210602032330.34100.53026040
Table 2. Data for the IEEE 69-bus network.
Node iNode j R ij  ( Ω ) X ij  ( Ω ) P j  (kW) Q j  (kvar)Node iNode j R ij  ( Ω ) X ij  ( Ω ) P j  (kW) Q j  (kvar)
120.00050.0012003360.00440.01082618.55
230.00050.00120036370.06400.15652618.55
340.00150.00360037380.10530.123000
450.02510.02940038390.03040.03552417
560.36600.18642.62.239400.00180.00212417
670.38100.194140.43040410.72830.85091.21
780.09220.0470755441420.31000.362300
890.04930.0251302242430.04100.047564.3
9100.81900.2707281943440.00920.011600
10110.18720.061914510444450.10890.137339.2226.3
11120.71140.235114510445460.00090.001239.2226.3
12131.03000.3400854470.00340.008400
13141.04400.345085.547480.08510.20837956.4
14151.05800.34960048490.28980.7091384.7274.5
15160.19660.065045.53049500.08220.2011384.7274.5
16170.37440.123860358510.09280.047340.528.3
17180.00470.0016603551520.33190.11143.62.7
18190.32760.1083009530.17400.08864.353.5
19200.21060.069010.653540.20300.103426.419
20210.34160.11291148154550.28420.14472417.2
21220.01400.004653.555560.28130.143300
22230.15910.05260056571.59000.533700
23240.34600.1145282057580.78370.263000
24250.74880.24750058590.30420.100610072
25260.30890.1021141059600.38610.117200
26270.17320.0572141060610.50750.25851244888
3280.00440.01082618.661620.09740.04963223
28290.06400.15652618.662630.14500.073800
29300.39780.13150063640.71050.3619227162
30310.07020.02320064651.04100.53025942
31320.35100.11600011660.20120.06111813
32330.83900.2816141066670.00470.00141813
33341.70800.564619.51412680.73940.24442820
34351.47400.48736468690.00470.00162820
Table 3. Data for evaluating the objective function.
ParameterValueUnitParameterValueUnit
C kWh 0.1390USD/kWhT365days
R a 10% R e 2%
y20years Δ h 1h
C PV 1036.49USD/kWp C O & M 0.0019USD/kWh
p i p v , max 2400kW p i p v , min 0kW
N p v a v a 3 Δ V ±10%
Table 4. Numerical performance of the metaheuristic optimizers and the proposed MIC model in the IEEE 33-bus network.
MethodLocation (node)Size (MW) A cost (US$/year)
Benchmark case3,700,455.38
CBGA 11 , 15 , 30 0.7605 , 0.9690 , 1.9060 2,699,932.28
NMA 8 , 16 , 30 2.0961 , 1.2688 , 0.2770 2,700,227.33
MGbMO 9 , 16 , 31 0.5802 , 1.3167 , 1.7571 2,699,841.36
GNDO 10 , 16 , 31 1.0083 , 0.9137 , 1.7257 2,699,671.75
MAOA 12 , 17 , 32 1.0117 , 0.7432 , 1.9022 2,699,902.05
DCVSA 11 , 14 , 31 0.7606 , 1.0852 , 1.8030 2,699,761.71
MIC 0 11 , 16 , 32 1.8400 , 0.6799 , 2.3083 2,603,465.00
MIC 1 / 2 13 , 24 , 29 1.4116 , 1.7145 , 1.9471 2,597,283.00
MIC 1 13 , 24 , 30 1.4392 , 1.7745 , 1.8596 2,597,139.00
Table 5. Numerical performance of the metaheuristic optimizers and the proposed MIC model in the IEEE 69-bus network.
MethodLocation (ode)Size (MW) A cost (US$/year)
Benchmark case3,878,199.93
CBGA 24 , 61 , 64 0.5326 , 1.8954 , 1.3772 2,825,783.33
NMA 12 , 60 , 61 0.0794 , 1.3805 , 2.3776 2,826,368.60
MGbMO 17 , 61 , 62 0.4858 , 1.8893 , 1.4299 2,825,106.78
GNDO 22 , 61 , 64 0.4812 , 2.4000 , 0.9259 2,824,923.38
MAOA 18 , 61 , 62 0.5215 , 2.0576 , 1.2225 2,825,109.60
DCVSA 16 , 61 , 63 0.2632 , 2.2719 , 2.2934 2,825,264.56
MIC 0 23 , 27 , 46 2.3578 , 0.0585 , 2.4000 2,752,021.00
MIC 1 / 2 , 1 17 , 49 , 61 1.0977 , 1.7981 , 2.4000 2,721,282.00
Publisher’s Note: MDPI stays neutral with regard to jurisdictional claims in published maps and institutional affiliations.

