Next Article in Journal
Weighted Log-Rank Test for Clinical Trials with Delayed Treatment Effect Based on a Novel Hazard Function Family
Next Article in Special Issue
Really Ageing Systems Undergoing a Discrete Maintenance Optimization
Previous Article in Journal
Enhancing the Performance of Software Authorship Attribution Using an Ensemble of Deep Autoencoders
Previous Article in Special Issue
Theoretical Bounds on the Number of Tests in Noisy Threshold Group Testing Frameworks
 
 
Correction published on 22 March 2024, see Mathematics 2024, 12(7), 934.
Article

Deep Machine Learning Model-Based Cyber-Attacks Detection in Smart Power Systems

by
Abdulaziz Almalaq
1,*,
Saleh Albadran
1 and
Mohamed A. Mohamed
2,*
1
Department of Electrical Engineering, Engineering College, University of Ha’il, Ha’il 55476, Saudi Arabia
2
Electrical Engineering Department, Faculty of Engineering, Minia University, Minia 61519, Egypt
*
Authors to whom correspondence should be addressed.
Mathematics 2022, 10(15), 2574; https://doi.org/10.3390/math10152574
Submission received: 6 June 2022 / Revised: 20 July 2022 / Accepted: 22 July 2022 / Published: 25 July 2022 / Corrected: 22 March 2024

Abstract

:
In this study, a deep learning-based attack detection model is proposed to address the problem of system disturbances in energy systems caused by natural events like storms and tornadoes or human-made events such as cyber-attacks. The proposed model is trained using the long time recorded data through accurate phasor measurement units (PMUs). The data is then sent to various machine learning methods based on the effective features extracted out using advanced principal component analysis (PCA) model. The performance of the proposed model is examined and compared with some other benchmarks using various indices such as confusion matrix. The results show that incorporating PCA as the feature selection model could effectively decrease feature redundancy and learning time while minimizing data information loss. Furthermore, the proposed model investigates the potential of deep learning-based and Decision Tree (DT) classifiers to detect cyber-attacks for improving the security and efficiency of modern intelligent energy grids. By utilizing the big data recorded by PMUs and identifying relevant properties or characteristics using PCA, the proposed deep model can effectively detect attacks or disturbances in the system, allowing operators to take appropriate action and prevent any further damage.

1. Introduction

1.1. Necessity of the Research

Critical infrastructures rely on complex systems that incorporate both cyber and physical components in their daily operations. The backbone of these facilities is the Industrial Control System (ICS), which plays a crucial role in monitoring and controlling critical infrastructures such as smart power grids, oil and gas, aerospace, and transportation. Accordingly, the safety and security of ICSs are essential for national security [1,2].
The Internet of Things (IoT) integration in ICS has created opportunities for cybercriminals to exploit system vulnerabilities and launch cyber-attacks. The Stuxnet attackin 2010, which targeted ICSs, raised awareness of cyber-security vulnerabilities in these systems. Stuxnet aimed to disrupt the system’s operation without affecting Information Technology (IT) systems [3]. In 2015, the Black-Energy cyber-attack targeted Ukraine’s power grids, resulting in a massive power outage that affected thousands of people [2,4]. While some attacks may cause information leakage, others can damage the physical system or misrepresent the system state for monitoring engineers. These examples high light the growing cyber-threat to operational technology, which supports much of the enabling computer technologies that critical infrastructure ICSs rely on [2].
Technically, power distribution systems and waste-water treatment plants are among the areas where Cyber-physical systems (CPS) is being used. Nevertheless, CPS security problems differ from conventional cyber-security problems in that they include integrity, confidentiality, and availability. In addition to transmitting, distributing, monitoring, and controlling electricity, a smart grid (SG) would greatly enhance energy effectiveness and reliability. Such systems may fail and result in temporary damage to infrastructures [5]. Power grids are regarded as essential infrastructure nowadays by many societies, which have developed security measures and policies related to them [6]. Phasor measurement units (PMUs) are adopted in modern electrical systems to improve reliability as they become more complex in their structure and design. Utilizing the gathered information for quick decision making is one of the advantages. There is still the possibility that hacker exploits vulnerabilities to result in branch overloaded tripping, which will lead to cascading failures and, therefore, leads to considerable damage to SG systems [7]. As the operators monitor and manage the energy grid, they must consider possible attacks on the grid. To accomplish this, much energy and grid expertise is required. However, deep machine learning (DML) methods are used because of their capability to recognize patterns and learn, as well as being quickly able to identify potential security boundaries [8].

1.2. Literature Review

Network systems, usually referred to as essential infrastructure systems, have been usually applied to link the systems for monitoring and collecting equipment operations in real-time. The supervisory control and data acquisition (SCADA) system is highly vulnerable to cyber-attacks, and such attacks need to be handled with extreme caution [9]. Sensor’s fingerprints and noise processing are used in [10] for detecting hidden cyber-attacks in CPS, and the data set from the actual-world water treatment plants is employed to validate the approach, and the outcomes indicated an accuracy of 98 % . In [11], a semantic instruction detection system on the basis of the network was examined for detecting attacks on water plant processes by analyzing network traffic. These findings highlight the need for CPS investigation. Cyber and physical systems are part of the SG. Intrusion detection problems are solved using DML, as seen in recent research [12,13,14]. The intrusion detection method on the basis of DML is examined in [12]. The data set employed was a SWAT-produced datum from various attacks of 10 various kinds. A quick one-class classification scheme that overcomes the problem of vast sensitivity to out-of-range data is employed in [13], and an actual data set is used to test the suggested algorithm. The data sets employed in this study have also been utilized in numerous other types of research. The authors in [14] examined the method with accuracy rates of around 90 % for JRipper + Adaboost and 75 % for random forest compared to the whole multiclass data set. The privacy preservation intrusion diagnosing method on the basis of the correlation coefficient and expectation maximization (EM) clustering techniques is presented in [15] to select significant sections of data and recognize intrusive occurrences. There was an 88.9% recall rate in the model compared to the multiclass data sets with 75% of features. Authors in [16] have improved the detection process by dropping the defense target from rejecting attacks to preventing outages to decreasing the necessary number of secured PMUs. In [17], the authors investigated the effect of cyber-attack on the PMU state estimation process using the Cartesian equations and in the case of zero injection buses. In [18], it is tried to develop an allocation method for fault observability using PMU data considering zero injection buses. In [19], the authors have introduced a fault detecting and classifying, and placement approach based on advanced machine learning in radial distribution systems.

1.3. Contributions

A model based on machine learning is presented in this study for detecting system behaviors by analyzing historical data and related log data. Although unsupervised learning is beneficial for detecting zero-day attacks since it requires no training in attack scenarios, it is also vulnerable to false positives [20]. Furthermore, supervised learning can clearly improve the detection’s confidence. The experiments are then performed using the supervised machine learning approach. The main contributions in this paper are summarized as follows:
(1)
A new classification model based on the Decision Tree (DT) and auto-encoder technique has been proposed as a binary classifier to detect attacks with the aim of increasing the detection accuracy and decreasing the false positive index.
(2)
A Principal Component Analysis (PCA) applied to the raw data of PMUs as an effective feature selection model reduces feature redundancy and learning time while minimizing the loss of data information. This approach has been shown to be effective in various evaluations as it significantly improves the performance of models.
(3)
A new process for handling abnormal data, such as non-numbers and infinity values in data sets, is proposed. This approach could significantly enhance accuracy in comparison to the conventional processes of processing abnormal data.
Following are the remaining sections of the study. A detailed explanation of the methodology is provided in Section 2. The results of the classification are discussed in Section 3. The conclusion appears in Section 4.

2. Model Structure

Scenarios where disturbances and attacks happen in the electric grid, as well as the meaning of features in the data set, are presented in this part. The suggested model and data processing are detailed here.

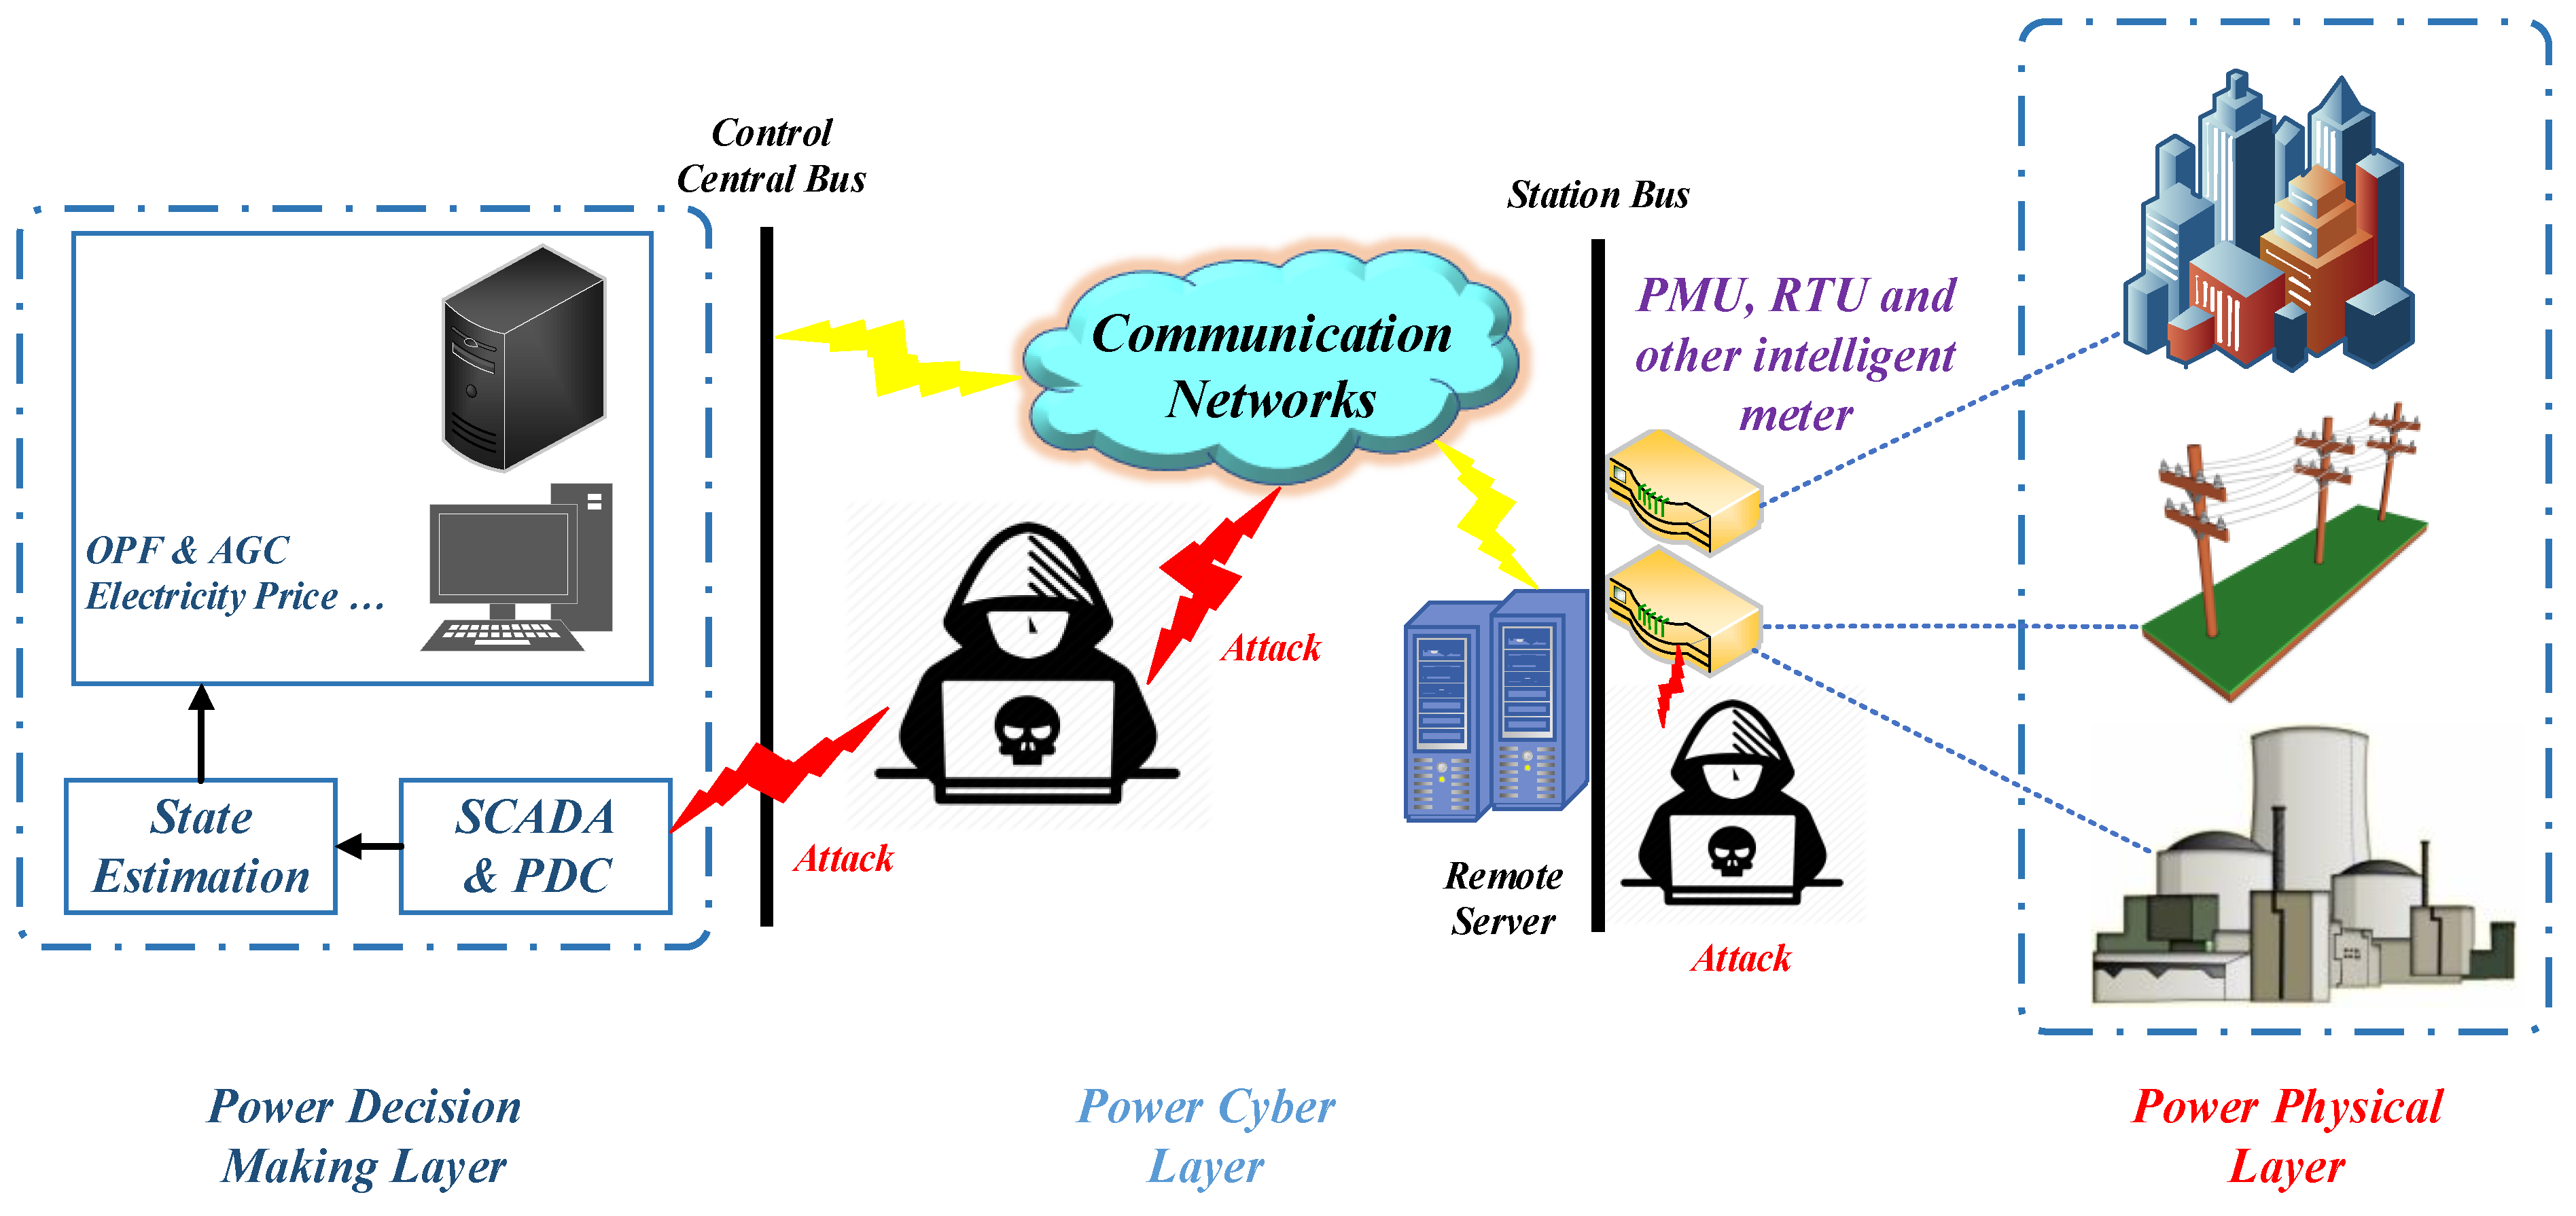
2.1. Introduction to Power System Framework Configuration

The suggested data set consisting of measurements associated with normal, fault, and cyber-attack behavior, and so on [21,22,23]. The electrical network block diagram is shown in Figure 1. Relay, control panel, snort, and PMU/synchronous are primarily used for recording measurement data. Following are some of the most significant components. Power generators are shown by P1 and P2, and the intelligent electronic device (IED) is relay R1, which could switch breaker1 (BR1) on or off. Transmission lines (TLs) are represented by L1 and L2. The phasor data concentrator is shown by PDC that stores and displays Synchron-phasor data as well as records historical data. The IED incorporates a distance protection mechanism that can trip the breaker if it detects faults. Due to the absence of internal verification approaches for detecting changes, the breaker will be tripped regardless of whether the fault is valid or not. BR1-4 can be tripped by manually sending relevant commands to IEDs. In the event that lines or other components are to be maintained, the manual override will be necessary.
The experiment applied a data set that contained 128 features recorded using PMUs from 1 to 4 and relay snort alarms and logs as in Ref. [24]. A PMU measures electric waves on a power network using a common time source. A total of 29 features could be measured by every PMU [24]. The data set also contains twelve columns of log data from the control panel and one column of an actual tag. There are three main categories of scenarios in the multiclass classification data set: No Events, Events, Intrusion, and Natural Events such as storms and tornadoes [25].
(a)
SLG fault: A fault occurs whenever the current, voltage frequency of the system changes abnormally, and many faults in electrical systems occur in line-to-ground and line-to-line (LL). The simulated SLG faults are represented as short circuits at diverse points along the TL in the data set.
(b)
Line maintenance: This type of attack is caused when one or more relays have been deactivated on a particular line to maintain.
(c)
Data injection: More research is being conducted into false data injection state estimation in electrical networks. False data injection attacks are one of the main forms of network attacks, which could affect the power system estimation method. Attackers alter phase angles in order to create false sensor signals. The objective of such attacks is to blind the operators and to avoid raising an alarm, which could lead to economic or physical damage to the electrical systems. Attackers synchronize the phasor measurement with the fault’s SLG and next send a relay trip command on the affected lines. A data set modeled the conditions by varying variables, such as current, voltage, and sequence components, which caused faults on various levels of the TLs.
(d)
Remote tripping command injection attack: This occurs when a computer on the communications network uses unexpected relay trip commands to relay at the end of a TL. For achieving attacks, command injection has been applied versus single relays or double relays.
(e)
Relay adjusting variation attack: The relay is configured with a distance protection layout. Attackers change the setting, so the relay responds badly to authentic faults. In the data sets, faults were caused via deactivating the relay functions at diverse parts of TLs with relays deactivated and faults.

2.2. Methodology

Despite the fact that the machine learning approach is capable of detecting disturbances and cyber-attacks on electric grids, it can have these drawbacks. Currently, references just discuss how to diagnose attacks in the electrical grids and seldom examine the data relationship. In contrast, when working with multi-classification problems, many algorithms convert them into multi-two-class situations. Nonetheless, the AdaBoost algorithm is able to handle multi-classification situations directly. It utilizes weak classifiers well for cascading and is capable of using various classification algorithms as weak classifiers. In terms of the error rate of misclassification, the AdaBoost algorithm is highly competitive [26]. With an increase in data amount, the fitting ability is affected both by generalization problems and by the increasing difficulty of computing. Machine learning requires a large amount of calculating to find the best solution. Additionally, the accuracy rates on the model presented in [14,15] are about 90% compared to the multiclass data sets, which provides considerable space for development. As a consequence of these findings, this paper constructs a model that can perform superior feature engineering and next can split the data by the diverse PMUs to minimize computation overhead. It should be noted that the PMU allocation in the smart grid is performed in the planning stage and might be implemented according to different purposes. While the high cost might be a limitation, the high number of PMUs is always preferred to cover all areas of the smart grid. It is worth noting that PMU allocation is out of the scope of this work but can be found in other research works widely. In addition, the AdaBoost algorithm for detecting the 37-class fault and cyber-attack case studies in the electric grids is adopted in this paper.
About the feature selection process, it should be noted that this experiment applied a data set that contains 128 features recorded using PMUs 1 to 4 and relay snort alarms and logs (relay and PMU have been combined). Please also note that each PMU can record 29 different features. In this regard, and in order to obtain enriched and integrated informative data, feature construction engineering is performed, and 16 novel features are constructed via an analysis of the features and possible links of the raw data in the electrical network. Technically, it is possible to construct novel features using the PCA as the feature selection model that could help to more effectively utilize possible types of data instances which could be used in machine learning models for better application.

2.3. Feature Selection Based on PCA

The presence of redundant or irrelevant features could impede the performance of a machine learning classifier, causing slow convergence or complete failure. To address this issue, this paper employs a PCA, also known as the Karhunen–Loeve transform or the eigenvector regression filter [27]. A PCA reduces dimensionality by eliminating the weakest principal components, resulting in a lower-dimensional projection of the raw feature data that preserves maximal data variance. This reduction is achieved through an orthogonal, linear projection operation. It is worth noting that the PCA operation does not result in any loss of generality.
Y = X C
The projected data matrix Y R S × P contains P principal components of X , where P is less than or equal to N . The key step involves determining the projection matrix C R N × P , which can be accomplished by finding the eigenvectors of X ’s covariance matrix or by solving a singular value decomposition (SVD) problem for X [28].
X = U D V T
The orthogonal matrices U R S × S and V R N × N represent the column and row spaces of X , respectively, while D is a diagonal matrix that contains the singular values λ n , for n = 0 ,   ,   N 1 . The singular values are arranged non-increasingly along the diagonal of D . It has been demonstrated [28] that the projection matrix C can be derived from the first P columns of V , with P being the desired number of principal components.
V = [ v 1 , , v N ]
and
C = [ c 1 , , c P ]
In which v n R N × 1 defines the n t h right singular vector of X , and v n equals c n   ( c n = v n ) .
The singular values in D from (2) indicate the standard deviations of X along the principal directions in the space spanned by the columns of C . The value of λ n 2 represents the variance in X ' s projection along the n t h principal component direction. Variance is often used as a measure of the amount of information contributed by a component to the data representation. To evaluate this, the cumulative explained variance ratio of the principal components is typically examined and expressed as a fraction.
R c e v = n = 1 P λ n 2 n = 1 N λ n 2

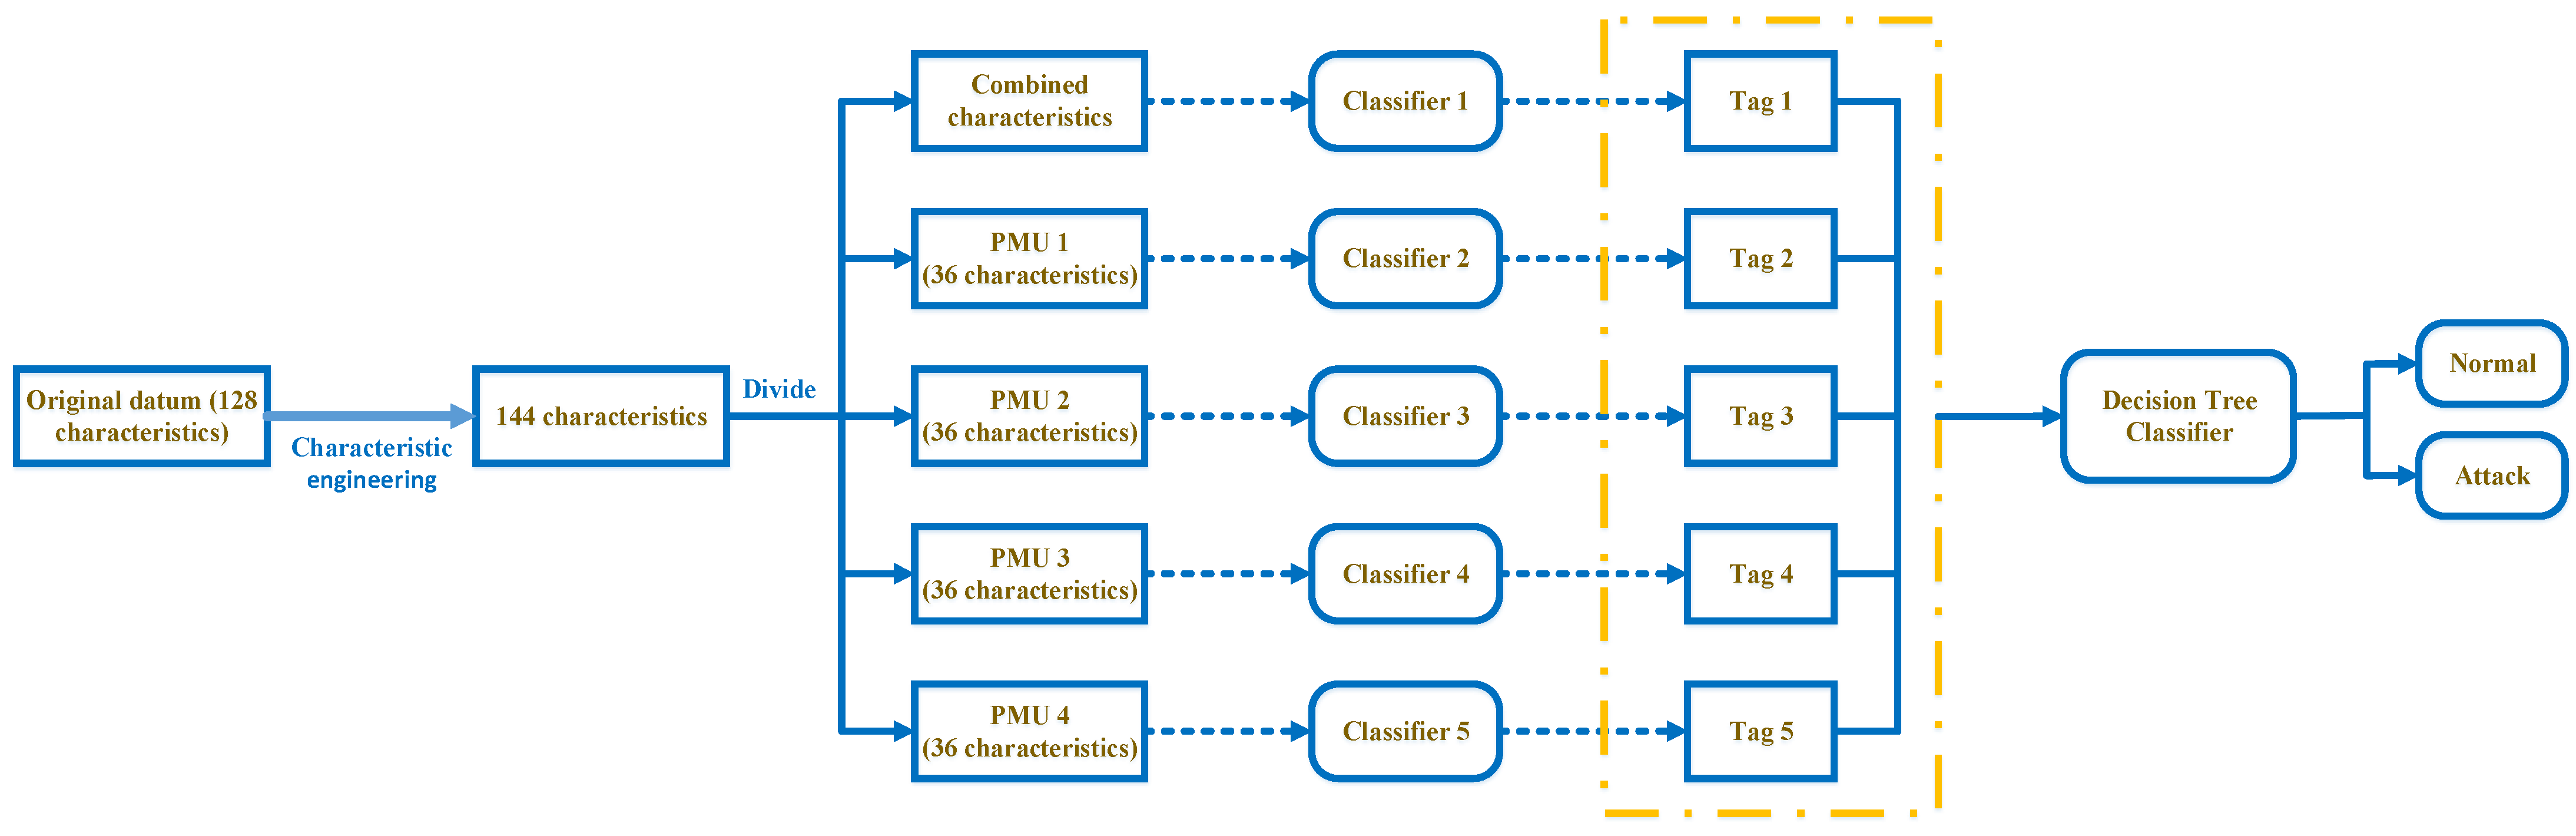
2.4. Diagnosing Attack Behavior Model Structure

A model architecture diagram is shown in Figure 2 to detect faults and cyber-attack in electrical grids [24]. According to Figure 2, the model architecture usually consists of four stages: property making, data dividing, weight voting, and layout training as follows:
Stage.1. Property making. By creating novel features manually from the original data set, it is able to improve the dimension of the data. A novel piece of data is generated by integrating the novel features with several original ones. The upper limit of the model is determined by the features and data, and the algorithm can just approximate the upper limit as closely as feasible. In order to achieve maximum accuracy and improve robustness, feature construction engineering is essential. It is important for feature construction using the original data to obtain more flexible features, and therefore increase data sensitivity and increase the ability to analyze it in the case of sending it to models for classification and training. The target of helpful features is to be simple to understand and maintain. The results of the analysis have led to the construction of 16 novel features. There is also a tendency in machine learning problems to include a large number of features for training instances, and it results in excessive computational overhead and overfitting, leading to poor efficiency. The curse of dimensionality has usually been used to describe this problem. Feature selection and feature extraction have been widely applied to mitigating the problems caused by high dimensionality in learning problems [29]. (In this paper, PCA is used as the feature selection model).
Stage.2. Datum dividing and training. The test and training sets are divided through 9:1 through the data splitting module. There is too much noise in the classifier if too many features are used [30]; therefore, every original data has been split into four parts according to features from various PMUs. While doing this, a section of the main characteristics is picked and sent to the AdaBoost layout to train alongside the novel features as well. This step is necessary for reducing the effect of errors resulting from bad PMU measurements. In case the feature dimension increases, the classifier’s performance decreases. As a result of this step, several of the original features are combined with novel ones in order to reduce the dimension. The original features are sorted using feature importance, and afterward, a variety of proportions of the features are selected, explained in more detail in Part 3. In addition, several classifier models are developed for personalizing the features following splitting. Various classifiers are set up to make every section of the data display the greatest impact on the classifier, i.e., the training model. Using five classifiers and later obtaining five tags following transferring the information to the layout reduces the effect of the alone classifier generalization error.
Stage.3. Weights for voting. It is the responsibility of the module to assign diverse weights to the tags derived from diverse classifiers and vote on the last classification tag of the data. According to the accuracy ratio of every classifier in the training set, the ratio of various weights has been thus determined. Various tags are generated by the test set following they have passed through the trained classifier, and the weights are determined for the last voting session based on the tags of the relevant classifier. By updating the weights in real-time, the entire system can become more robust and generalizable.

2.5. In-Depth Explanation of the Attack-Diagnosing Layout

2.5.1. Properties Making

During property making, 16 novel features have been extracted from every PMU measurement feature and incorporated into the original data set for preparing for the next step. Raw data is mainly used for extracting novel features based on corresponding computations.

2.5.2. Data Processing

It is important to process the data prior to sending it to the machine learning model. The normalization of the data is an important part of data processing. The benefit of this method is that it speeds up and improves the accuracy of iterations for finding the best solution for gradient descent. Among the most common techniques of data normalization are z-score standardization and min-max standardization. Basically, min-max standardization works by changing the original data linearly toward an outcome between [0, 1] shown below:
X s c a l e = x x m i n x m a x x m i n
In addition, Z-score standardization has been known as standard deviation standardization, and it has been mostly applied for characterizing deviations from the average. The data analyzed through this technique assure the standard usual distribution, which is that the standard deviation and average are equal to one and zero, respectively. The data processed using the process can satisfy the standard normal distribution, meaning the mean equals 0 and the standard deviation Equation (6). Following is the transformation function, the mean amount of the instant data is shown by μ , and the standard deviation is represented by σ . This study adopts this normalization process.
X s c a l e = x μ σ
A data set may contain the not a number (NAN) and infinity (INF) amount, but it has been usually substituted through the mean amount or zero. For the data set applied here, the novel replacement process is proposed to avoid underflows in the final replacement value and the data being overly discrete. l o g _ m e a n value is used for replacing NAN and INF values present in the data. It can be calculated as follows:
l o g _ m e a n = log | k i | N u m ( k i ) · ( 1 2 𝕝 ( k i N u m ( k i ) < 0 ) )
Here, the number of digits in a column is shown by N u m ( k i ) and the indicator function is represented by 𝕝 ( x ) , which can be described in the following way:
𝕝 ( x ) = { 1   i f   x   i s   t r u e 0   o t h e r w i s e
Comparative experiments are conducted on various treatment approaches in this study. Section 3 shows the outcomes that show that the suggested process succeeds.

2.5.3. Establish Classifier Layouts

Following a series of tests using various machine learning classifiers, a DT classifier was selected due to its superior performance. The sigmoid layer’s fusion activation function is defined by the equation provided below.
F 1 = k = 1 n y k log t k w s + 1 y k log 1 t k w l
In which F 1 defines the sigmoid layer’s fusion activation function, y k shows the k t h pattern’s tag, t k defines the k t h pattern’s prediction, and w l and w s define the stable pattern and unstable pattern, respectively [31].
A for loop was used to test the Autoencoders (AEs) with varying numbers of layers, neurons, batch sizes, loss and activation functions, optimizers, epochs, and dropout layers in order to improve accuracy and the f-measure. Both Stacked Autoencoder (SAE) and Deep Neural Network (DNN) models utilize the Binary Cross-Entropy (BCE) cost function and the Rectified Linear Unit (ReLU) activation function to achieve optimal performance, as represented by the performance metrics.
R e L U x = m a x ( 0 , x )
In which x defines the observation.

2.5.4. Proposed Machine Learning

An advanced deep learning approach is presented to make a powerful detector for the system. The proposed approach involves building a deep base model to learn representative features. To ensure diversity in the base model, multiple deep autoencoders were created, including an SAE, a Denoising Autoencoder (DAE), and linear decoder methods. Each of these models was trained using unique datasets generated through the Bootstrap method. To this end, the characteristics were first selected. Secondly, deep base models were developed to adaptively learn hidden characteristics from the exploited indexes obtained. To ensure diversity in the base patterns, deep autoencoders were constructed using SAE, DAE, and linear decoder methods.

3. Experiment and Evaluation

In machine learning, classifications and regressions are the primary learning tasks. It is obvious that the classification problem is addressed in this study. The next experiments are designed to test whether the model structure described in this study is capable of distinguishing fault and disturbance in electrical systems. A comparison is made between the model and various conventional models, such as convolution neural network (CNN), gradient boosting decision tree (GBDT), extreme gradient boosting (XGBoost), decision tree (DT), support vector machine (SVM), and k-nearest neighbor (KNN).
Additionally, the accuracy achieved through transferring information has been compared after the property making is compared.

3.1. Data Set

A multiclass classification data set for ICS cyber-attacks is used in the present study. There are several terms applied in machine learning that require an explanation. The true positive (TP) is the positive sample that the layout predicts to be positive, the false positive (FP) is the negative sample that the layout predicts to be positive, and the false negative (FN) is the positive sample that the model predicts to be negative, the true negative (TN) is the negative sample that the model predicts to be negative. The suggested layout is evaluated using accuracy, precision, recall, and F1 score. An F1 score is basically the harmonic value of precision and recall, which are calculated according to the following equations:
a c c u r a c y = ( T P + T N ) / ( T P + F P + F N + T N )
p r e c i s i o n = T P / ( T P + F P )
r e c a l l = T P / ( T P + F N )
F 1   s c o r e = 2 T P 2 T P + F N + F P = 2 · p r e c i s i o n · r e c a l l p r e c i s i o n + r e c a l l

3.2. Experiment Outcome

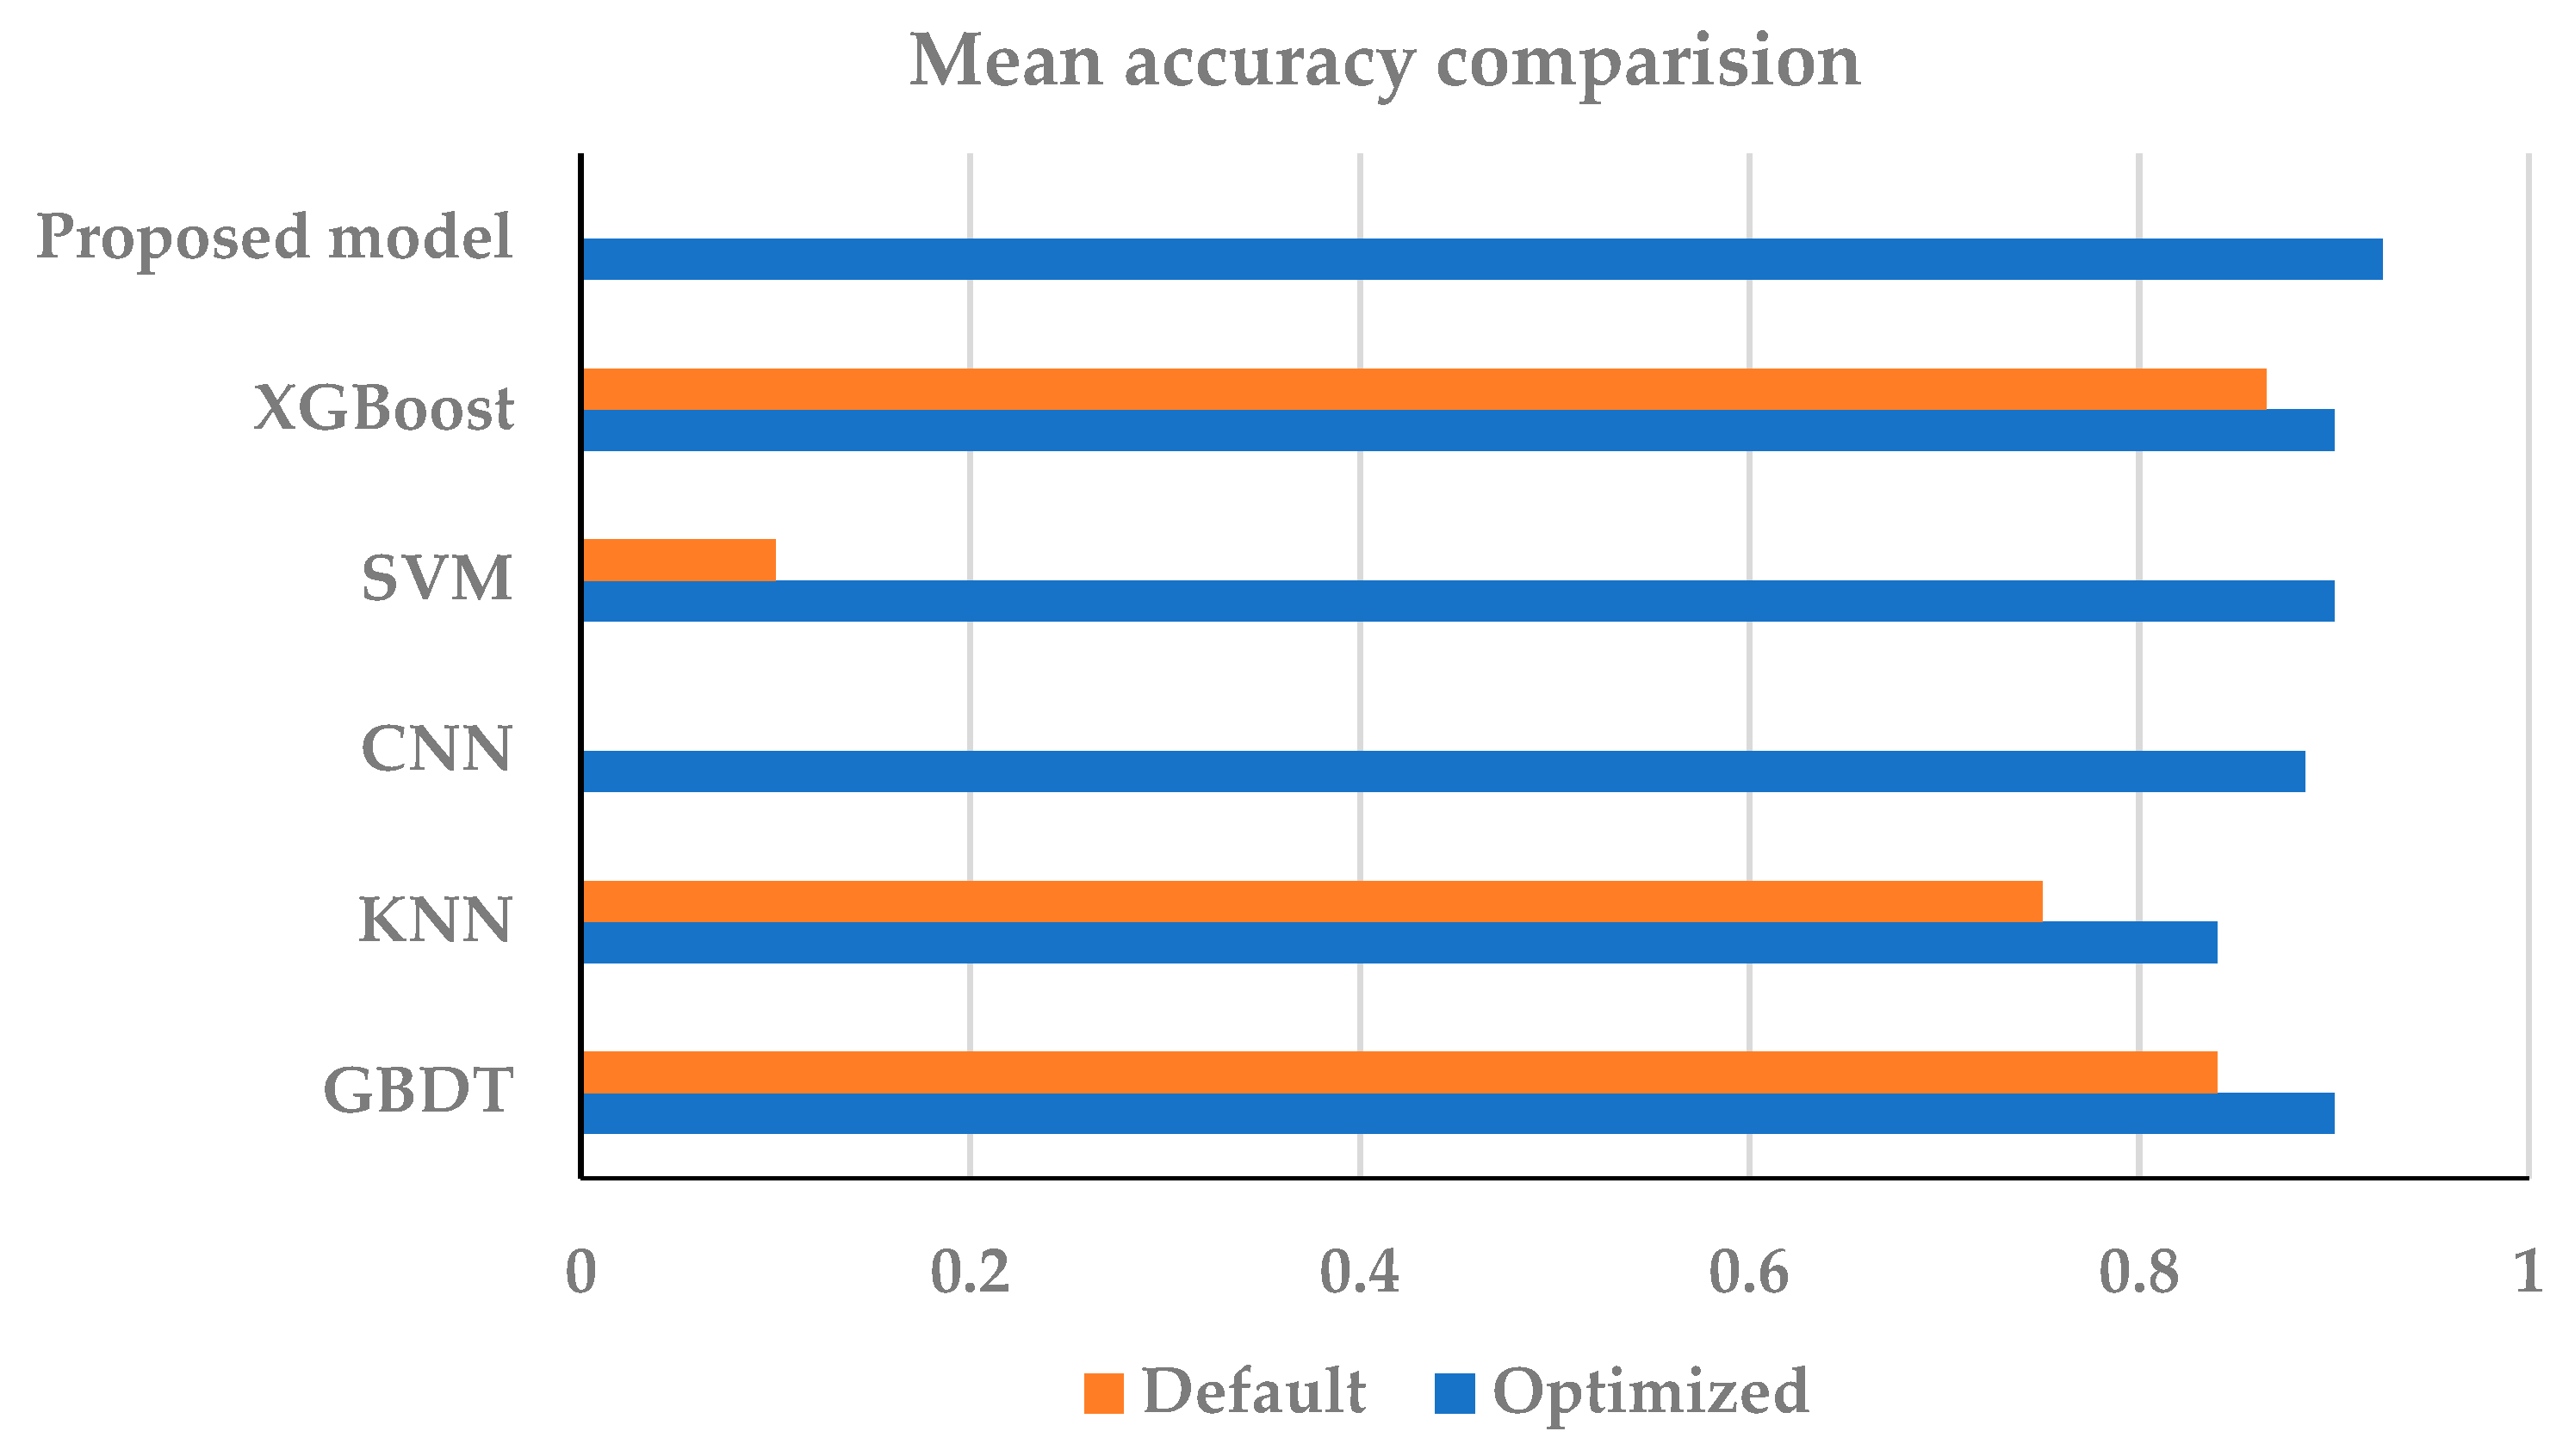
3.2.1. Machine Learning Model

In this experiment, KNN, SVM, GBDT, XGBoost, CNN, and others were applied as conventional models [24,25,32,33,34,35].
Actually, the main purpose of this research is to show the high and successful role of the deep learning models in reinforcing the smart grid against various cyber-attacks. In this regard, the proposed model would detect and stop cyber-hacking at the installation location rather than focusing on the cyber-attack type. Therefore, the localization procedure would be attained through the diverse detection models located in the smart grid, but the cyber-attack type detection requires more data that can be made later based on the recorded abnormal data.

3.2.2. Outcomes

In order to determine the need for various models (fault analysis), we performed some comparative experiments according to various PMU kinds. In one group, properties of localization/segmentation are sent to the related DML model in order to train, and in the other one, whole features are sent to various machine learning models. Moreover, it is shown in Table 1 that data can be effectively split according to the PMU resources. Splitting the data can enhance the accuracy of classification models as well as reduce data dimensions and enhance training speed and minimize computing sources.
Several corresponding experiments are conducted on various ways of replacing abnormal values in data. Table 2 shows the outcomes. The replacement method is shown in the left column, and the suggested approach is represented by l o g _ m e a n . Zero shows a process to replace NAN and INF with zero values, and mean shows a process to replace with the mean value. The proposed model is utilized as a trial model, and the accuracy is adopted as the assessment metrics, that is, the Log-mean column in Table 2.
Applying the l o g _ m e a n technique for replacing the unusual amount in the data is intuitively the best approach. According to the outcome, the suggested process in order to process abnormal values has proven successful.
Table 3 shows the suggested method with PCA in compare of other selection method. As can be seen the accuracy rate of the suggested method with PCA is better than other methods.
Comparison experiments are also conducted to verify feature selection. First, the significance of the original features is determined, and afterward, they are arranged based on significance. A variety of mixtures of features has been selected for training, and Table 4 shows these outcomes.
The approach was verified practically through a comparative test. The test extracts the test group and training group from 15 multiclass data sets in a 9:1 ratio at random, and afterward, these data sets have been combined into 1 training group. The training group has been transferred to the layout to train and learn. Table 5 presents the outcomes of 15 test sets transferred to the model for practically simulating the efficiency of the model applications. It is apparent that the model’s accuracy has decreased. It is because data interaction would occur by increasing the number of data resulting in changing the model, and whenever whole data has been combined, there would unavoidably be abnormal points and noises. Due to the fact that such noises and anomalies have not been separated in training, the model’s indexes alter, and the robustness decreases.
Firstly, the efficacy of the features created from the feature construction engineering in the model is determined by sorting the significance of features. Model interpretability can be determined by determining the significance of features. Weights, gain, cover, and so on are general indicators of feature significance [25].
The test trains 15 sets of multiclass classification data sets and tests respectively and uses accuracy as an assessment metric [24]. The accuracy of the trail data sent to the layout before and after optimization based on the main 128 properties is shown in Figure 3, Figure 4 and Figure 5. The classification accuracy of the trail group on various layouts with default variables is shown in Figure 3, and the accuracy of the trail group on the layout applying optimized variables is represented in Figure 4. For a more intuitive visualization of the variation in accuracy after layouts are optimized, Figure 3 and Figure 4 are combined, and the mean of the accuracy values for whole sets are adopted, i.e., Figure 5. Figure 3, Figure 4 and Figure 5 shows that the SVM layout with default variables has an accuracy of approximately 0.30, but after optimization, it grows to 0.85, which represents a near 200% advancement. Other models have improved significantly in accuracy after optimization as well. The best accuracy of the proposed model is 0.925. The test set had better performance on the model suggested in this study in comparison to the conventional DML and CNN, as shown in Figure 3, Figure 4 and Figure 5.
A true decision is obtained when the detection layout produces the correct result. Conversely, a false decision indicates a false response from the cyber-attack detection layout and can lead to decreased reliability. Therefore, it is important to develop an anomaly detection layout with low false rates. Four criteria, namely Correct Reject Rate (CR), Miss Rate (MR), False Alarm Rate (FR), and Hit Rate (HR), can be used to assess the effectiveness of the layout. To better understand these criteria, a confusion matrix is provided in Table 6.
In order to evaluate the performance of the suggested detection mechanism for detecting cyber-attacks and anomalies in smart grids, the cyber-attack models are applied. The evaluation outcomes were recorded and are presented in Table 7 and Table 8. From the tables, it can be observed that the proposed detection mechanism is highly effective in detecting cyber-attacks, with a detection accuracy rate of over 97%. This indicates that the suggested detection method is capable of accurately detecting FDI attacks and can be considered an efficient solution to the problem. The evaluation results demonstrate the effectiveness of the suggested detection mechanism for detecting cyber-attacks in smart grids, and highlight the potential of deep machine learning methods with PCA and DT for addressing challenges in the field of cyber security.

4. Conclusions

This study proposes a new deep model and feature selection approach for identifying faults and cyber-attacks in electrical systems using various smart grid information and data analysis. Different DML assessment indexes with PCA and DT were used to evaluate the suggested model and conventional DML methods. The results showed that the information analyzing process improves the model’s accuracy and the proposed layout detects various types of behavior in smart grids efficiently. Machine learning with PCA and DT can be used in the power grid to assist operators in making decisions, such as detecting abnormality in data gathering and estimating the system status if data readings from any PMU are unusual. According to the results, the proposed method can accurately and efficiently detect cyber-attacks in smart grids. Furthermore, the study concluded that the proposed model demonstrates good performance in detecting destructive attacks with different intensities. The outcomes of two different metrics, namely the detection rate and the confusion matrix, support the precision and reliability of the proposed anomaly detection approach.

Author Contributions

Conceptualization, A.A., S.A. and M.A.M.; methodology, A.A., S.A. and M.A.M.; software, A.A., S.A. and M.A.M.; validation, A.A., S.A. and M.A.M.; formal analysis, A.A., S.A. and M.A.M.; investigation, A.A., S.A. and M.A.M.; data curation, A.A., S.A. and M.A.M.; writing—original draft preparation, A.A., S.A. and M.A.M.; writing—review and editing, A.A., S.A. and M.A.M.; visualization, A.A., S.A. and M.A.M.; supervision, A.A., S.A. and M.A.M.; project administration, A.A. and S.A.; funding acquisition, A.A. and S.A. All authors have read and agreed to the published version of the manuscript.

Funding

This research has been funded by the Scientific Research Deanship at the University of Ha’il—Saudi Arabia through project number RG-21079.

Institutional Review Board Statement

Not applicable.

Informed Consent Statement

Not applicable.

Data Availability Statement

Not applicable.

Conflicts of Interest

The authors declare no conflict of interest.

References

  1. Almalaq, A.; Albadran, S.; Alghadhban, A.; Jin, T.; Mohamed, M.A. An Effective Hybrid-Energy Framework for Grid Vulnerability Alleviation under Cyber-Stealthy Intrusions. Mathematics 2022, 10, 2510. [Google Scholar] [CrossRef]
  2. Al-Abassi, A.; Karimipour, H.; Dehghantanha, A.; Parizi, R.M. An ensemble deep learning-based cyber-attack detection in industrial control system. IEEE Access 2020, 8, 83965–83973. [Google Scholar] [CrossRef]
  3. Zhang, F.; Kodituwakku, H.A.; Hines, J.W.; Coble, J. Multilayer data-driven cyber-attack detection system for industrial control systems based on network, system, and process data. IEEE Trans. Ind. Inform. 2019, 15, 4362–4369. [Google Scholar] [CrossRef]
  4. Cyber-Attack against Ukrainian Critical Infrastructure. 2016. Available online: https://www.cisa.gov/news-events/ics-alerts/ir-alert-h-16-056-01 (accessed on 11 January 2024).
  5. Reich, J.; Schneider, D.; Sorokos, I.; Papadopoulos, Y.; Kelly, T.; Wei, R.; Armengaud, E.; Kaypmaz, C. Engineering of Runtime Safety Monitors for Cyber-Physical Systems with Digital Dependability Identities. In Proceedings of the International Conference on Computer Safety, Reliability, and Security, Lisbon, Portugal, 15 September 2020; Springer: Cham, Switzerland, 2020; pp. 3–17. [Google Scholar]
  6. Li, Y.; Wang, B.; Wang, H.; Ma, F.; Zhang, J.; Ma, H.; Mohamed, M.A. Importance Assessment of Communication Equipment in Cyber-Physical Coupled Distribution Network Based on Dynamic Node Failure Mechanism. Front. Energy Res. 2022, 10, 911985. [Google Scholar] [CrossRef]
  7. Zhang, L.; Cheng, L.; Alsokhiry, F.; Mohamed, M.A. A Novel Stochastic Blockchain-Based Energy Management in Smart Cities Using V2S and V2G. IEEE Trans. Intell. Transp. Syst. 2022, 24, 915–922. [Google Scholar] [CrossRef]
  8. Chen, J.; Alnowibet, K.; Annuk, A.; Mohamed, M.A. An effective distributed approach based machine learning for energy negotiation in networked microgrids. Energy Strategy Rev. 2021, 38, 100760. [Google Scholar] [CrossRef]
  9. Al-Mhiqani, M.N.; Ahmad, R.; Yassin, W.; Hassan, A.; Abidin, Z.Z.; Ali, N.S.; Abdulkareem, K.H. Cyber-security incidents: A review cases in cyber-physical systems. Int. J. Adv. Comput. Sci. Appl. 2018, 1, 499–508. [Google Scholar]
  10. Luo, Y.; Cheng, L.; Liang, Y.; Fu, J.; Peng, G. Deepnoise: Learning sensor and process noise to detect data integrity attacks in CPS. China Commun. 2021, 18, 192–209. [Google Scholar] [CrossRef]
  11. Kaouk, M.; Flaus, J.M.; Potet, M.L.; Groz, R. A review of intrusion detection systems for industrial control systems. In Proceedings of the 2019 6th International Conference on Control, Decision and Information Technologies (CoDIT), Paris, France, 23 April 2019; IEEE: Toulouse, France, 2019; pp. 1699–1704. [Google Scholar]
  12. Dehghani, M.; Kavousi-Fard, A.; Dabbaghjamanesh, M.; Avatefipour, O. Deep learning based method for false data injection attack detection in AC smart islands. IET Gener. Transm. Distrib. 2020, 14, 5756–5765. [Google Scholar] [CrossRef]
  13. Taormina, R.; Galelli, S.; Tippenhauer, N.O.; Salomons, E.; Ostfeld, A.; Eliades, D.G.; Aghashahi, M.; Sundararajan, R.; Pourahmadi, M.; Banks, M.K.; et al. Battle of the attack detection algorithms: Disclosing cyber-attacks on water distribution networks. J. Water Resour. Plan. Manag. 2018, 144, 04018048. [Google Scholar] [CrossRef]
  14. Chang, Q.; Ma, X.; Chen, M.; Gao, X.; Dehghani, M. A deep learning based secured energy management framework within a smart island. Sustain. Cities Soc. 2021, 70, 102938. [Google Scholar] [CrossRef]
  15. Keshk, M.; Sitnikova, E.; Moustafa, N.; Hu, J.; Khalil, I. An integrated framework for privacy-preserving based anomaly detection for cyber-physical systems. IEEE Trans. Sustain. Comput. 2019, 6, 66–79. [Google Scholar] [CrossRef]
  16. Huang, Y.; He, T.; Chaudhuri, N.R.; la Porta, T. Preventing Outages under Coordinated Cyber-Physical Attack with Secured PMUs. IEEE Trans. Smart Grid 2022, 13, 3160–3173. [Google Scholar] [CrossRef]
  17. Alexopoulos, T.A.; Korres, G.N.; Manousakis, N.M. Complementarity reformulations for false data injection attacks on pmu-only state estimation. Electr. Power Syst. Res. 2020, 189, 106796. [Google Scholar] [CrossRef]
  18. Alexopoulos, T.A.; Manousakis, N.M.; Korres, G.N. Fault location observability using phasor measurements units via semidefinite programming. IEEE Access 2016, 4, 5187–5195. [Google Scholar] [CrossRef]
  19. Mamuya, Y.D.; Lee, Y.-D.; Shen, J.-W.; Shafiullah, M.; Kuo, C.-C. Application of Machine Learning for Fault Classification and Location in a Radial Distribution Grid. Appl. Sci. 2020, 10, 4965. [Google Scholar] [CrossRef]
  20. Chaithanya, P.S.; Priyanga, S.; Pravinraj, S.; Sriram, V.S. SSO-IF: An Outlier Detection Approach for Intrusion Detection in SCADA Systems. In Inventive Communication and Computational Technologies; Springer: Singapore, 2020; pp. 921–929. [Google Scholar]
  21. Chen, J.; Mohamed, M.A.; Dampage, U.; Rezaei, M.; Salmen, S.H.; Obaid, S.A.; Annuk, A. A multi-layer security scheme for mitigating smart grid vulnerability against faults and cyber-attacks. Appl. Sci. 2021, 11, 9972. [Google Scholar] [CrossRef]
  22. Avatefipour, O.; Al-Sumaiti, A.S.; El-Sherbeeny, A.M.; Awwad, E.M.; Elmeligy, M.A.; Mohamed, M.A.; Malik, H. An intelligent secured framework for cyberattack detection in electric vehicles’ CAN bus using machine learning. IEEE Access 2019, 7, 127580–127592. [Google Scholar] [CrossRef]
  23. Wang, B.; Ma, F.; Ge, L.; Ma, H.; Wang, H.; Mohamed, M.A. Icing-EdgeNet: A pruning lightweight edge intelligent method of discriminative driving channel for ice thickness of transmission lines. IEEE Trans. Instrum. Meas. 2020, 70, 1–12. [Google Scholar] [CrossRef]
  24. Wang, D.; Wang, X.; Zhang, Y.; Jin, L. Detection of power grid disturbances and cyber-attacks based on machine learning. J. Inf. Secur. Appl. 2019, 46, 42–52. [Google Scholar] [CrossRef]
  25. Alnowibet, K.; Annuk, A.; Dampage, U.; Mohamed, M.A. Effective energy management via false data detection scheme for the interconnected smart energy hub–microgrid system under stochastic framework. Sustainability 2021, 13, 11836. [Google Scholar] [CrossRef]
  26. Chen, L.; Liu, Z.; Tong, L.; Jiang, Z.; Wang, S.; Dong, J.; Zhou, H. Underwater object detection using Invert Multi-Class Adaboost with deep learning. In Proceedings of the 2020 International Joint Conference on Neural Networks (IJCNN), Glasgow, UK, 19 July 2020; IEEE: Toulouse, France, 2020; pp. 1–8. [Google Scholar]
  27. Gonzales, R.C.; Wintz, P. Digital Image Processing; Addison-Wesley Longman Publishing Co., Inc.: Upper Saddle River, NJ, USA, 1987. [Google Scholar]
  28. Goodfellow, I.; Bengio, Y.; Courville, A. Deep Learning; MIT Press: Cambridge, MA, USA, 2016. [Google Scholar]
  29. Shafizadeh-Moghadam, H. Fully component selection: An efficient combination of feature selection and principal component analysis to increase model performance. Expert Syst. Appl. 2021, 186, 115678. [Google Scholar] [CrossRef]
  30. Roshan, K.; Zafar, A. Deep Learning Approaches for Anomaly and Intrusion Detection in Computer Network: A Review. Cyber Secur. Digit. Forensics 2022, 73, 551–563. [Google Scholar]
  31. Jahromi, A.N.; Karimipour, H.; Dehghantanha, A.; Choo, K.-K.R. Toward detection and attribution of cyber-attacks in IoT-enabled cyber–physical systems. IEEE Internet Things J. 2021, 8, 13712–13722. [Google Scholar] [CrossRef]
  32. Pham, B.T.; Bui, D.T.; Prakash, I.; Nguyen, L.H.; Dholakia, M.B. A comparative study of sequential minimal optimization-based support vector machines, vote feature intervals, and logistic regression in landslide susceptibility assessment using GIS. Environ. Earth Sci. 2017, 76, 371. [Google Scholar] [CrossRef]
  33. Jena, M.; Dehuri, S. Decision tree for classification and regression: A state-of-the art review. Informatica 2020, 44, 405–420. [Google Scholar] [CrossRef]
  34. Chen, R.C.; Caraka, R.E.; Arnita, N.E.; Pomalingo, S.; Rachman, A.; Toharudin, T.; Tai, S.K.; Pardamean, B. An end to end of scalable tree boosting system. Sylwan 2020, 164, 140–151. [Google Scholar]
  35. Zhang, Z.; Zhang, Y.; Guo, D.; Song, M. A scalable network intrusion detection system towards detecting, discovering, and learning unknown attacks. Int. J. Mach. Learn. Cybern. 2021, 12, 1649–1665. [Google Scholar] [CrossRef]
Figure 1. The power system framework configuration.
Mathematics 10 02574 g001
Figure 2. Overview of layout to detect cyber-attacks in smart grids.
Mathematics 10 02574 g002
Figure 3. Precision over 15 data sets through applying default variables.
Mathematics 10 02574 g003
Figure 4. Precision over 15 data sets through applying optimum variables.
Mathematics 10 02574 g004
Figure 5. Mean accuracy comparison.
Mathematics 10 02574 g005
Table 1. Transfer diverse characteristics to the layout for comparison.
TechniqueCharacteristics
EntireSplit
Accuracy0.93440.9387
Table 2. Diverse methods to procedure INF and NAN.
MethodZeroMeanLog-Mean
Accuracy0.93610.93420.9387
Table 3. Accuracy rate of various feature selection method.
MethodPCAPSO AlgorithmK-Means ClusteringSVM
Accuracy0.93870.87410.91340.902
Table 4. Assessment of characteristics chosen.
CharacteristicsOnly New Characteristics25% Main Characteristics and New Characteristics50% Main Characteristics and New Characteristics
Mean accuracy0.74920.93490.9334
Characteristics75% Main Characteristics and New Characteristics100% Main Characteristics and New Characteristics
Mean accuracy0.9330.9353
Table 5. Layout accuracy on 15 trails sets in the actual simulation.
Data setData 1Data 2Data 3Data 4Data 5Data 6Data 7Data 8
Data number0.88940.86990.90970.88300.90920.90960.90660.9193
Data setData 9Data 10Data 11Data 12Data 13Data 14Data 15Entire
Data number0.90830.92290.92410.90070.90160.89660.91300.9043
Table 6. Confusion matrix of proposed scheme.
Actual Value
Detection Scheme Response PositivesNegatives
PositivesTrue PositiveFalse Positive
NegativesFalse NegativeTrue Negative
Table 7. The proposed detection scheme.
LabelNumber of Testing DataIdentified to Be CompromisedIdentified to Be NormalDetection Accuracy (%)
Compromised1759165110893.87
Normal139481131394.17
Table 8. Confusion matrix of the proposed detection scheme.
Actual Value
Detection Scheme Response PositivesNegatives
Positives93.87%5.83%
Negatives6.13%94.17%
Publisher’s Note: MDPI stays neutral with regard to jurisdictional claims in published maps and institutional affiliations.

