1. Introduction
Recently, with the rapid development of medicine, clinical trials, as important processes in the evaluation of new drugs, have received more attention, and the related biostatistics methods need to be improved. In many clinical trials collecting time-to-event data as the endpoint and conducting data analysis under the framework of survival analysis, one of the most significant problem is how to compare two survival curves, or using a mathematical expression, how to test whether there exists a difference between survival functions from different groups.
The log-rank test [
1] and Cox regression [
2] are two of the most classical and widely used statistical methods in comparing survival functions. The log-rank test as a non-parametric method is usually used in randomized controlled trials (RCT) which matches covariates between groups through randomization before starting the trial, while Cox regression is often used in population studies to quantify the effects of covariates [
3]. Both of these methods are actually based on the proportional hazard assumption, which assumes that the hazard ratio of two groups are constant through time, and the standard log-rank test has the highest power in that case [
1]. Most traditional clinical trials satisfy proportional hazard approximately, so subsequent statistical inferences are usually based on the assumption.
However, the advances in immuno-oncology have presented many cases violating the proportional hazard assumption, and that is called the non-proportional hazard (NPH) scenario. The mechanism of immunotherapy, such as the PD-1/PD-L1 inhibitor, is motivating the human body’s immune system to take anti-tumor reactions [
4]. Its treatment effects are indirect and need a transition period to reveal and stabilize compared with the traditional treatment methods, such as chemotherapy [
5], so the situation of the delayed treatment effect is such that the difference between the treatment and control group is not revealed at once but, after a certain period, it often takes place in related studies. Some examples are nivolumab versus docetaxel in treating advance non-squamous non-small-cell lung cancer [
6], pembrolizumab versus docetaxel for treating the same disease [
7] and eribulin mesylate versus capecitabine in treating locally advanced or metastatic breast cancer [
8]. Besides the immuno-oncology study, the delayed treatment effect is also observed in RCT studies on other diseases, such as nephrosis [
9], cardiovascular disease [
10], bone marrow transplantation [
11] and even infectious disease [
12]. The delayed treatment effect is the most common NPH scenario in practice [
13] and deserves special methods in order to be dealt with.
Delayed treatment effect scenarios represented by immunotherapy have brought challenges to traditional test methods. Plenty of numeric simulation results have shown that the standard log-rank test has problems, including low power and poor robustness in the existing NPH scenario [
13,
14,
15], while the result of Cox regression is difficult to interpret when the proportional hazard assumption is violated. Therefore, classical test methods need to be improved when there is a potential delayed treatment effect.
There are two main alternative test methods under RCT designs, including the weighted log-rank test (WLRT) [
16] and methods based on weighted difference in survival curves, such as restricted mean survival time (RMST) [
17,
18]. The latter one has not received wide recognition in the field of medicine and clinical trials [
19]. The WLRT is an improved method of the standard log-rank test, which is the most common test method in clinical trials and has gained more attention, so this paper is mainly about the WLRT.
The basic idea of WLRT is adding weights to different observations, according to the scenarios of the hazard ratio, and a related theoretical framework was proposed by Fleming and Harrington [
20]. Using notations from martingale theory, the general form of WLRT statistics
is as follows:
where
denotes the sample size of the
ith group,
denotes the number of individuals at risk in the
ith group at time
t,
denotes the number of individuals taking events in the
ith group by time
t, and
denotes the weight function. Fleming and Harrington proved that
follows normal distribution asymptotically in a large sample [
16], so
where
and
By selecting different weight functions
, different WLRT statistics can be acquired. A classical weight function called the
family proposed by Fleming and Harrington [
20] is
where
is the survival function at time
t (usually use Kaplan–Meier estimation [
21] to approximate), and
and
are two parameters that can be selected. When
, more weight is put on the late observations, thus the corresponding WLRT can have better performance in testing the delayed treatment effect.
and
are two common
tests.
Besides the
family, other forms of weight function have also been developed in the literature. Magirr et al. proposed the modestly weighted log-rank (
mWLRT) test which has the following weight function:
where
is the estimation of survival function at some certain time
, and the time
can be calculated using their method and is associated with the expected occurrence time of treatment effect [
22]. Magirr et al. proved that their method is non-inferior to the standard log-rank test under almost all scenarios. Unlike other WLRT, Yu et al. considered the weight function based on the time instead of the estimation of survival functions, and a logistic-like weight function (denoted as
) proposed by them is as follows:
where
is associated with the median time of transition period and
a is associated with the length of transition period [
23]. Moreover, Breslow et al. [
24], Xu et al. [
25], Zucker and Lakatos [
26], Yang and Prentice [
27] and others also developed various WLRT methods to deal with NPH scenarios.
However, all of these WLRT are not uniformly most powerful under various delayed treatment effect scenarios. The simulation results from these studies and other review studies [
14,
28] show that a proper selection of the weight function and corresponding parameters is vital to the performance of the test. If the selection does not meet the real situation well, the power of the test may be very low, and the robustness will be affected a lot. Some methods, such as the
proposed by Yu et al., rely on prior information a lot, so they may be not very powerful when such information is lacking. Furthermore, these weight functions may be hard to interpret from the medical perspective and not associated with the expression of survival curves intuitively. Moreover, although there have been many studies on improved WLRT, the references to be compared in these studies are the classical
test, and there are rare parallel comparisons between these novel methods.
It should be mentioned that versatile combination tests based on WLRT have been proposed recently. Such tests, such as the “Max-Combo” test, take the maximum or linear combination of some WLRT [
14,
20], so they are more robust than the single WLRT in general situations and do not require too much prior information [
13,
26,
29,
30]. However, the construction of these combination tests does rely on the selection of single WLRT, and their performances are greatly influenced by the properties of single WLRT. Additionally, though combination tests have good robustness, their power in specific scenarios will not exceed the most powerful WLRT or their component test statistics. In that case, our study still focuses on the single WLRT under the specific situation that the delayed treatment effect appears.
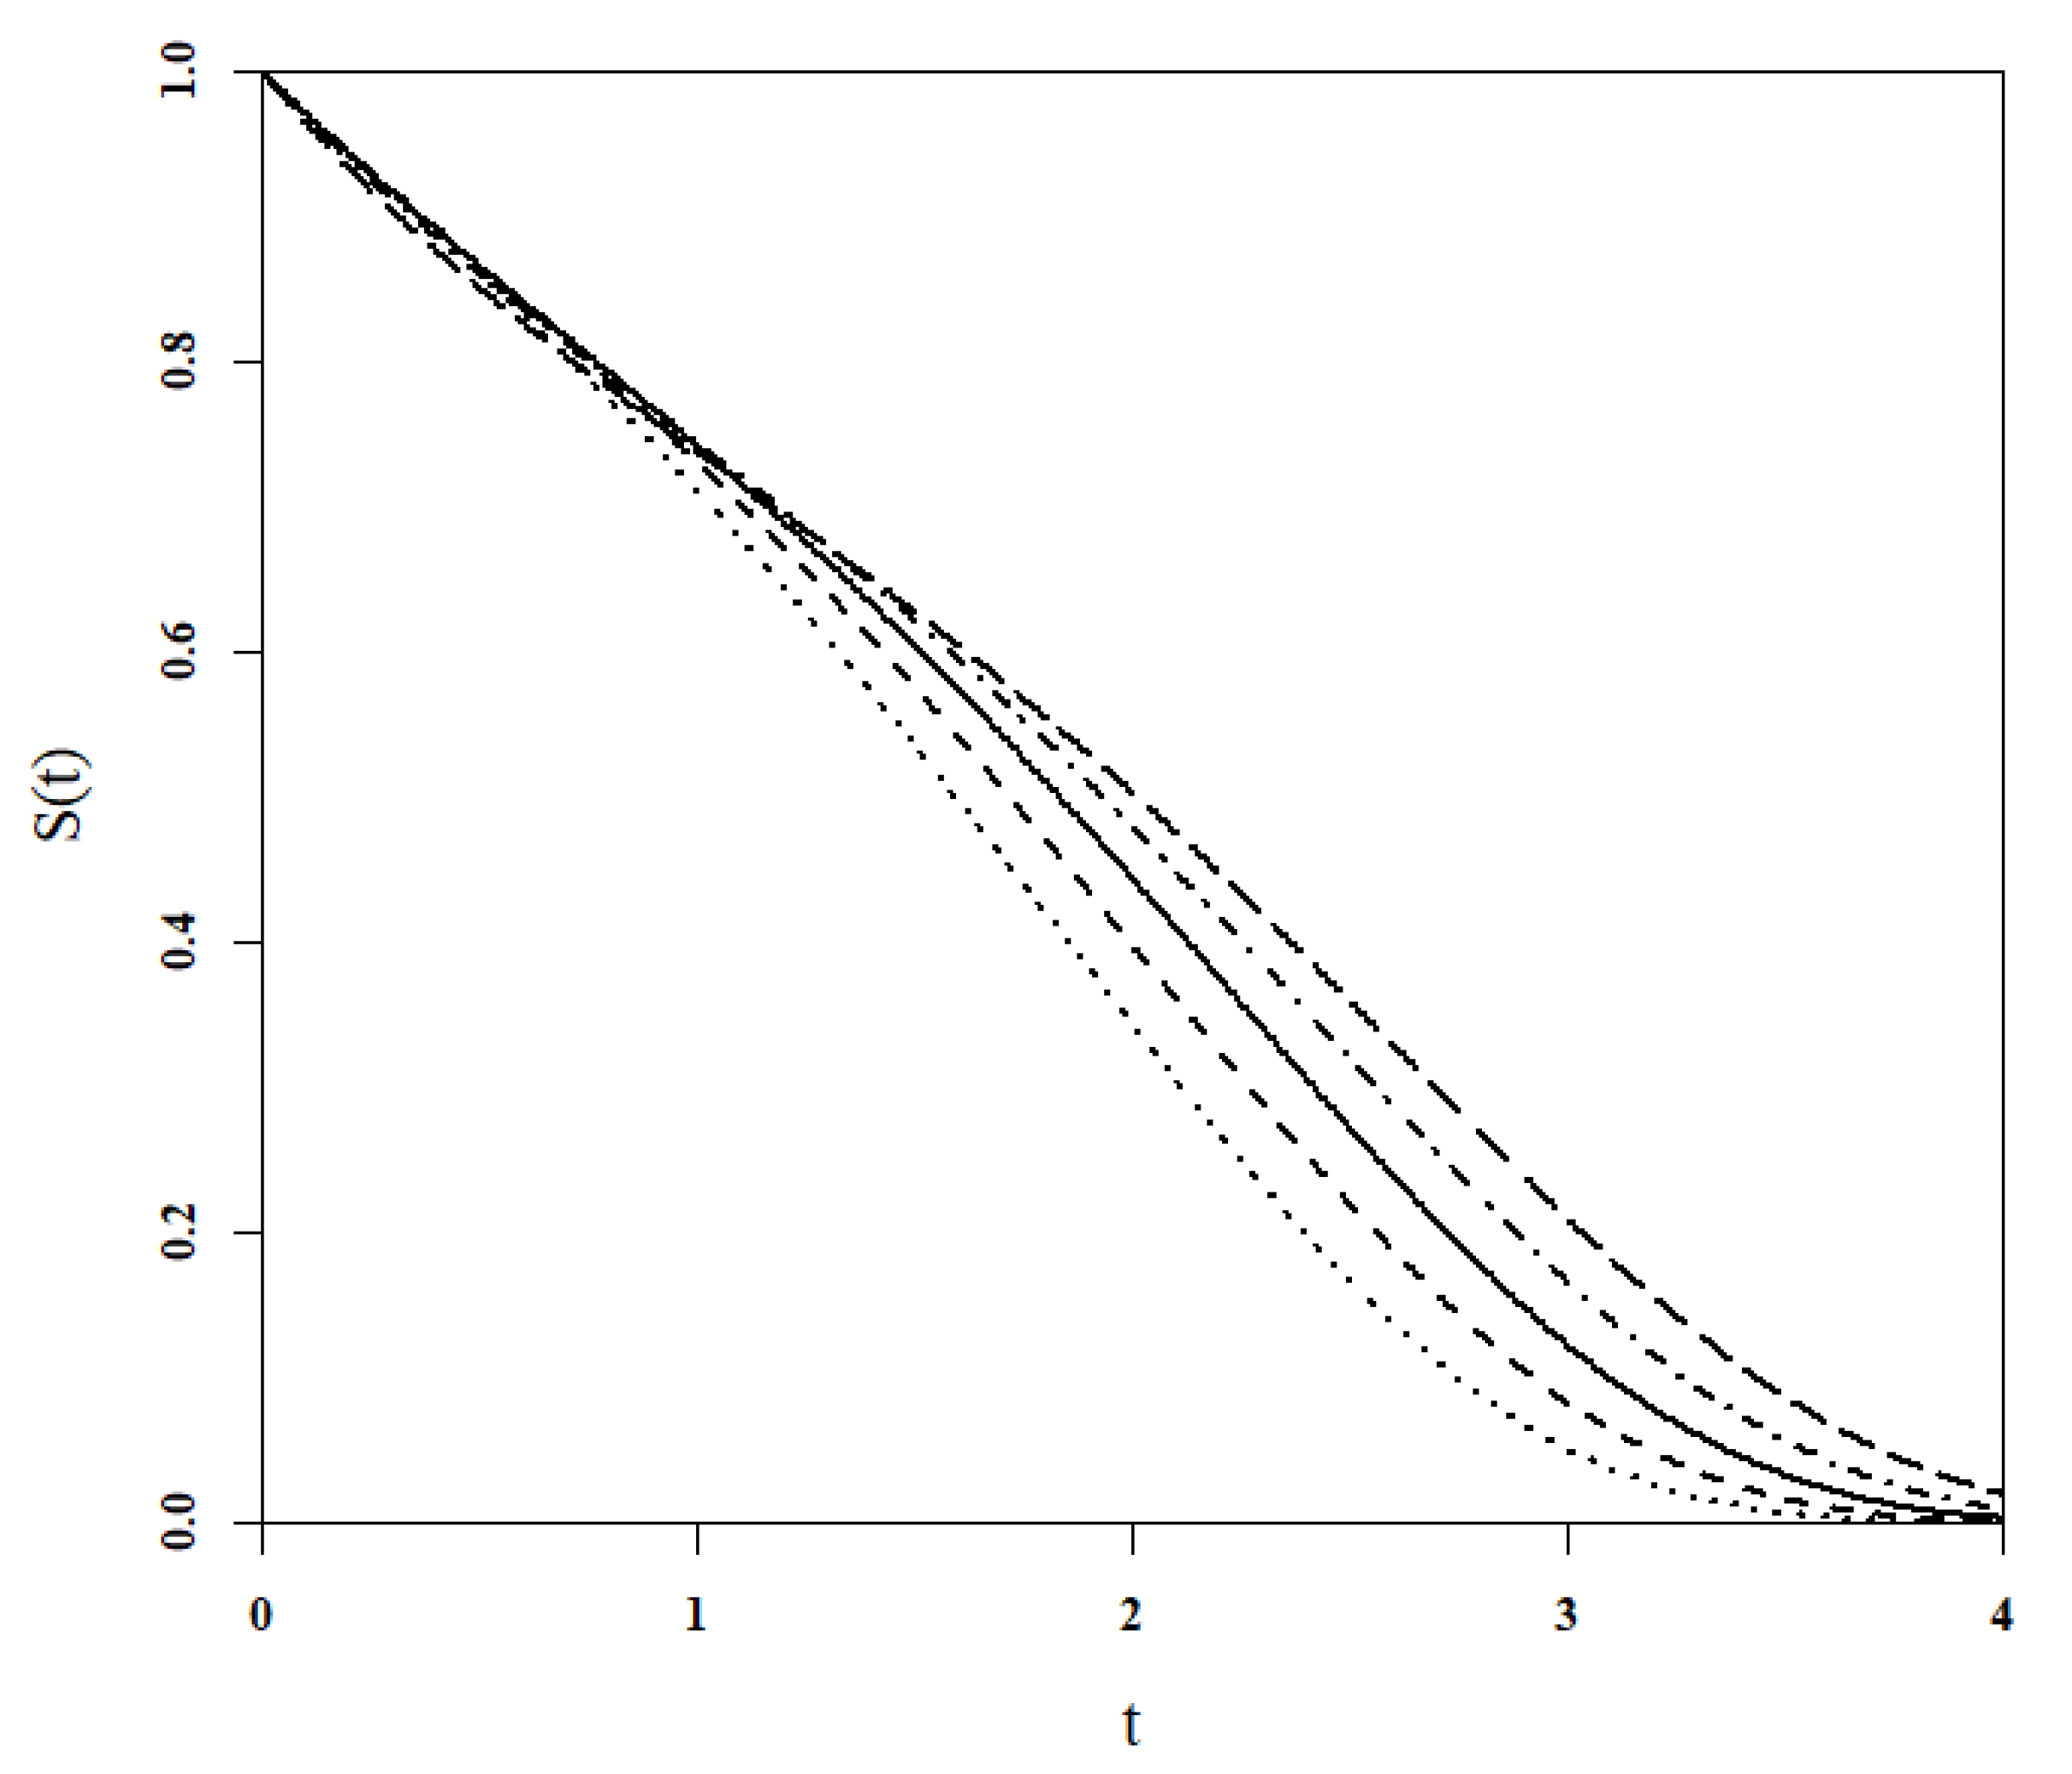
This paper aims to establish a parametric model of hazard functions family to fit the delayed treatment effect scenarios and solve its corresponding most theoretically powerful WLRT under the Fleming and Harrington framework. Additionally, this paper compares the novel WLRT with the classical
test and other latest WLRT in the simulation study, and two application examples are analyzed to evaluate their practical performance. The rest of this paper is organized as follows: In
Section 2, we define the novel
hazard function family to fit the delayed treatment effect scenario and discuss its associated properties. In
Section 3, the corresponding
weight function is derived to construct the powerful WLRT, and methods of parameter selection are also demonstrated. We conduct numerical simulation study to evaluate the performance of different WLRT under various settings and report the results in
Section 4. In
Section 5, we demonstrate two examples with real world data. In
Section 6, we discuss some inspirations from our study and give some suggestions on testing the delayed treatment effect in practice. We summarize the content of this paper and give the conclusion in
Section 7.
4. Simulation Study
In order to evaluate the performance of weight functions in practice and compare them with other WLRT dealing with the delayed treatment effect, we conduct comprehensive simulation studies. The simulation is set up as an RCT with two arms, treatment and control separately. The hypothesis test is set as two-sided, and the significant level is . The type I error rate under null hypothesis and the empirical power under alternative hypothesis of various test will be calculated and compared to evaluate their performance under different scenarios. The survival functions of the treatment and control group are denoted as and , and hazard functions are denoted as and , respectively. Like other parallel studies, most scenarios in this paper are simulated by generating time-to-event data following piece-wise exponential distribution, so different settings are distinguished by hazard functions.
Two test statistics
and
are proposed in this paper, and each statistic has two methods to select the parameter pair, so the
using the prior information method and default selection method, and
using these two methods are denoted as
,
,
and
, respectively. In the
family, we choose
and
, which put weights on the late observations and
, which is the standard log-rank test as comparisons. In other types of WLRT, we choose the modestly weighted log-rank test (
) proposed by Magirr et al. [
22] and a novel WLRT (
) proposed by Yu et al. [
23] to make comparisons. Both these two weight functions were introduced briefly in
Section 1. We choose these two WLRT for two main reasons: (1) Both them are relatively recent methods and have shown good performance in their simulation studies according to the literature. (2) There are also undetermined parameters that may depend on prior information before trials in these two WLRT, which ensures comparability with the
WLRT.
A total of four statistics have parameters depending on prior information:
,
,
and
. Similar to the example shown in
Section 3.2.1, as for
statistics based on the prior information method (
and
), we use the time
when the two survival curves separate and
, which is the total survival rate at
, to help determine the parameters. We assume we have certain information about
in each scenario and the average hazard function of two groups before
(
) can be obtained by the pilot study or previous studies to calculate the expected
. The
also depends on the separation time of two curves, so it shares the same
with
and
in our simulation. The method of
has two parameters:
a is the length of the transition period that the drug takes to be effective, and
is the center of the transition period. All of this information will be specified in their applicable range later. In order to control the range of parameters, all time-related data will be scaled so that
in dealing with
statistics.
4.1. Type I Error Rate
First, we set
to evaluate the type I error rate of these statistics. The total sample size (denoted as
n) is 50, 100 and 200, respectively, with a
ratio to the two groups, and the number of repetitions is set as 10,000 to see whether the type I error rate can be controlled well. In this series of simulations,
,
,
, and
is estimated by the hazard function before
. Three scenarios under a null hypothesis (NH) are shown in
Table 1, and hazard functions of two groups are the same in each scenarios.
The simulation result is shown in
Table 2. The result shows that all these statistics arise with a type I error rate inflation to a different degree when
. As the sample size increases to 100, only
shows a slight type I error rate inflation (
), while all statistics can generally control the type I error rate when
. Therefore, the recommended total sample size should be more than 100 to ensure the reliability of the test in practice. Four
family statistic of interests in this study can control the type I error rate relatively well and show non-inferiority to other WLRT.
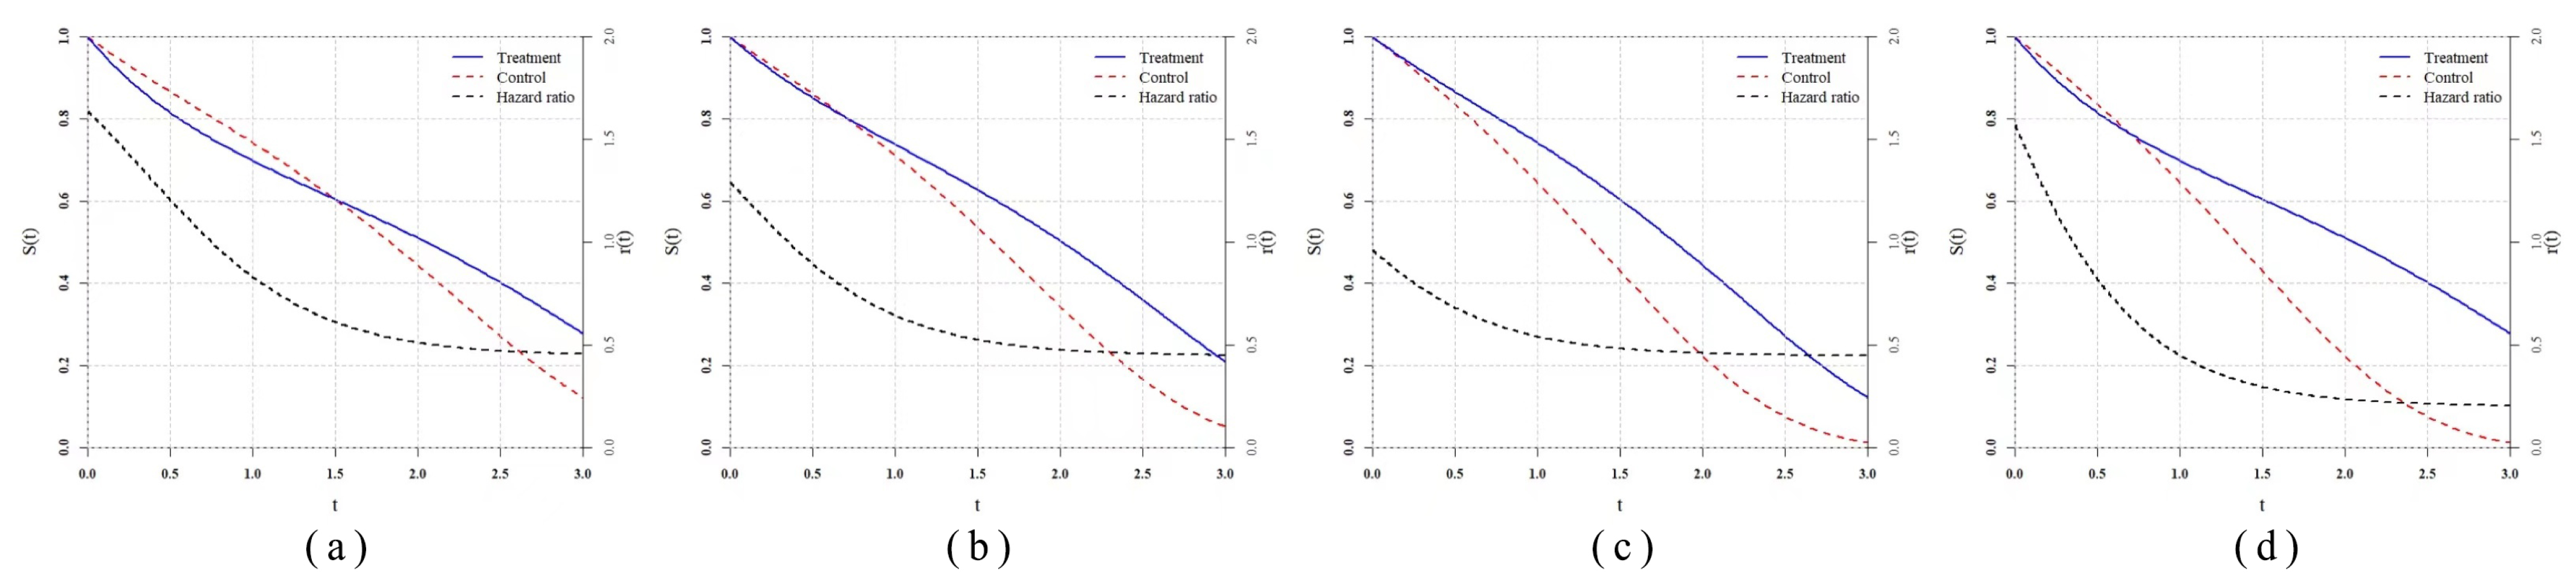
4.2. Simple Settings
Then, we consider the simulation of the delayed treatment effect with simple settings and compare powers of various statistics in the test. “Simple” means we generate the time-to-event data based on the designated hazard functions directly using the Monte Carlo method, and there will be no censoring in that case. In this series of simulations,
,
,
, and
is estimated by the hazard function of control group before
.
Table 3 shows the hazard functions of each scenario. As for the delayed treatment effect scenario (denoted by DT), we copy the classical scenario which was studied by Fleming [
32], Lee [
33] et al. in
and set the
in which the treatment takes a longer time to be effective. We set two scenarios
and
with the
family hazard function, so
family test statistics should be the most powerful, theoretically, in that case. Thus, in these two scenarios, we use the exact
for
and
rather than the estimated. Moreover, we add
and
, which are two proportional hazard scenarios to evaluate their robustness. In
and
, we assume the prior information is known exactly and set
,
, and
. The total sample size is fixed as 200 and the group ratio remains at
, while the repetition number is 5000.
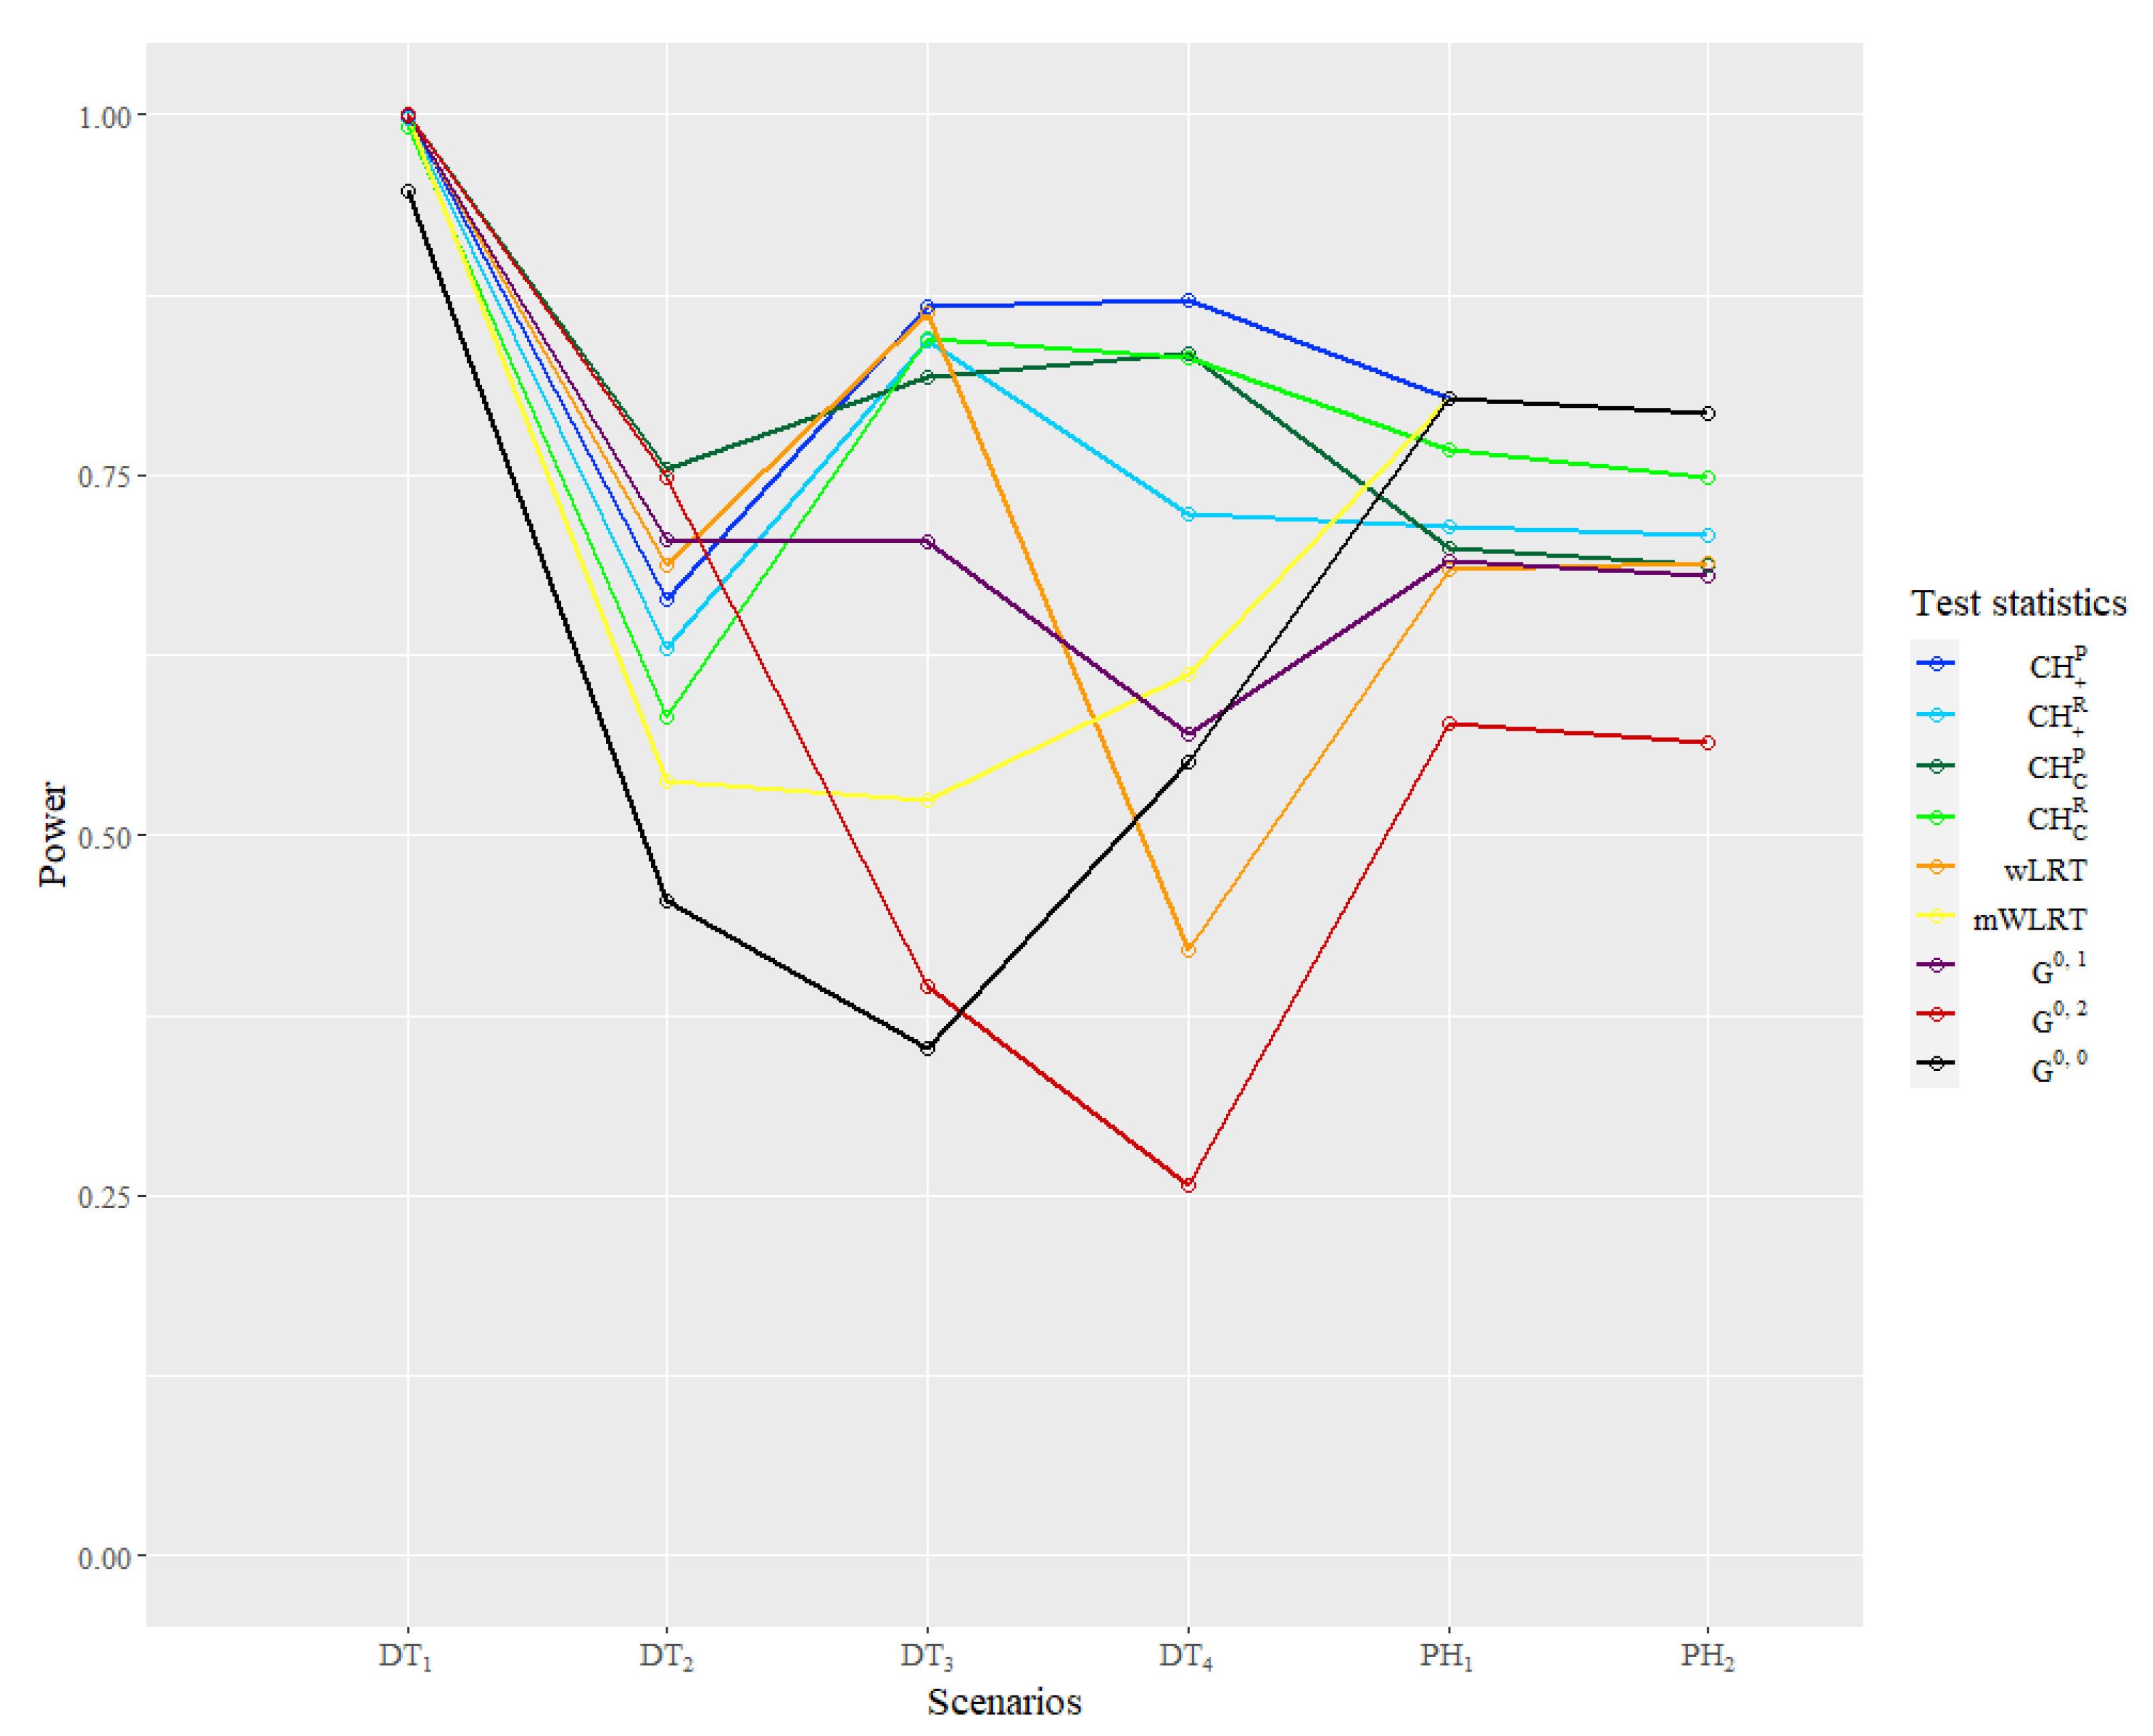
The power result of the simulation is reported in
Table 4 and
Figure 5. In the classical scenario
, powers of all statistics are close to 1 because of the larger sample size compared to the literature, so this result is seldom reflected, except the good large sample properties of all statistics. In the
,
is the most powerful one and
WLRT has relatively good performance, while powers of other WLRT are relatively low. In
and
generated from the
function family, four
test statistics are almost the most powerful as expected. In
, the
WLRT shows great disadvantages compared with other statistics. The performance of
is still good in
but very poor in
. In
,
statistics outperform other WLRT overwhelmingly. The powers of
and
are lower than 0.5, which is very likely to cause a type II error in practice. As for the same type of
statistics, the statistic using the prior information method are more powerful than using the default selection method, while the latter one can still let the power remain at a relatively high level.
As for the and , the standard log-rank test is the most powerful one as expected. The statistics based on prior information actually degenerate to , so they share the same power. Powers of statistics using the default selection method are much higher than and , which also have default parameters. In particular, the power of is very close to the power of .
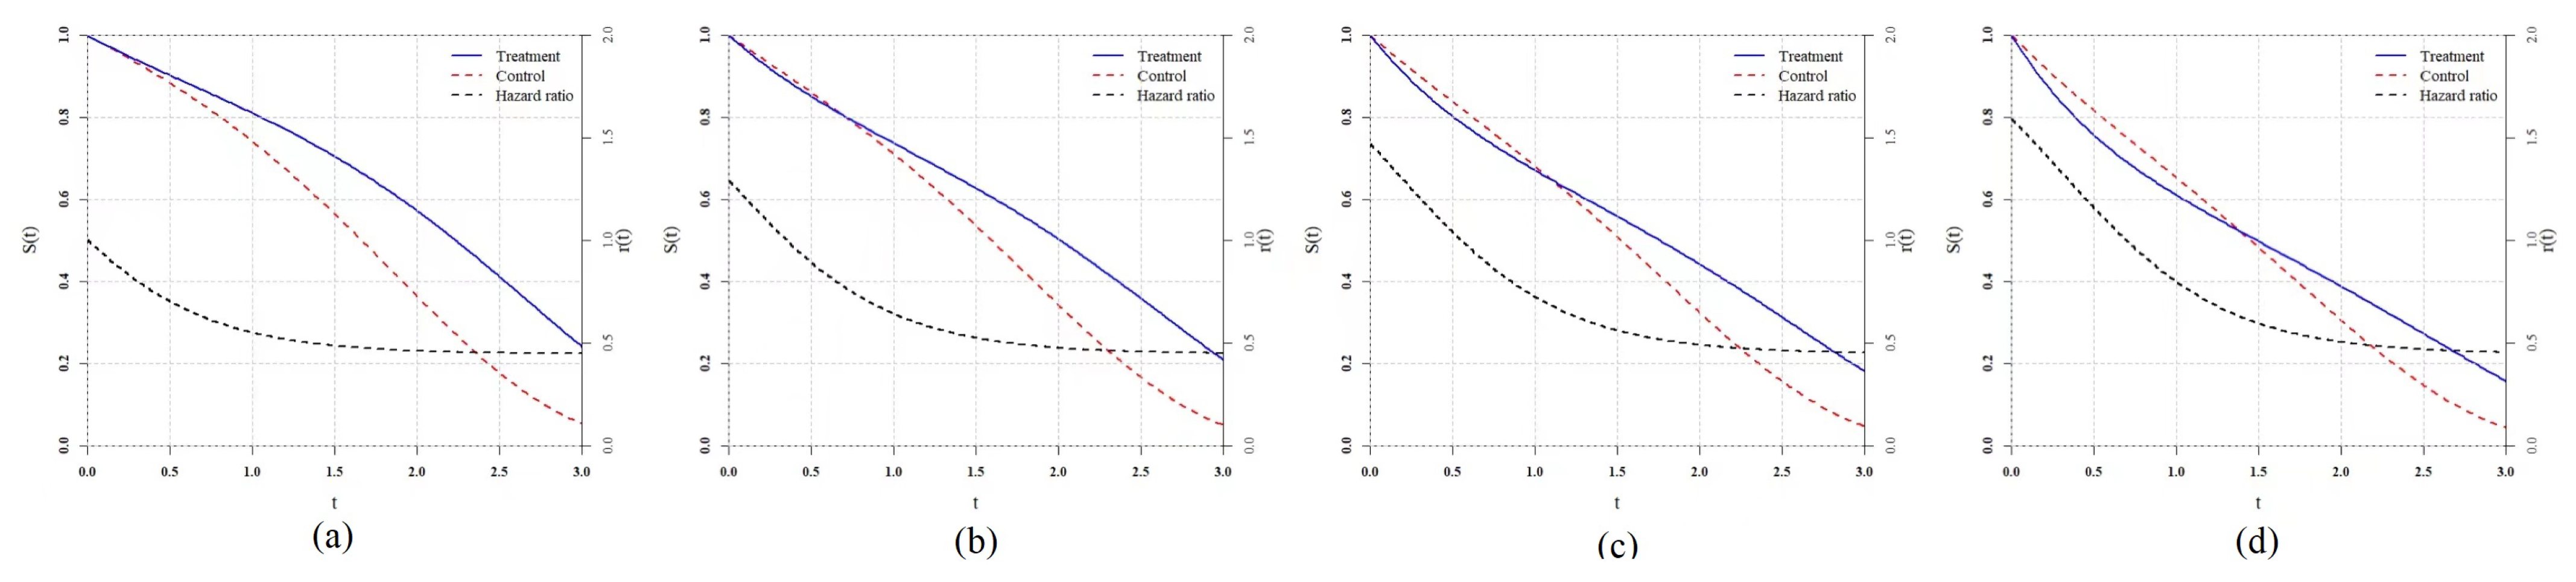
4.3. Clinical Trial Settings
In simple settings, we only consider the ideal situation in which time-to-event data follow the designate distribution completely and the settings of hazard function are relatively simple. However, the data in clinical trials have certain differences from the ideal situation:
The order of magnitude of hazard function will be smaller, while the order of magnitude of time will be larger. The duration will be longer.
Subjects will not be enrolled in the trial simultaneously but during a enrollment period lasting for several months one by one.
Due to the factors including cost and efficiency, the trial will be ended after a certain time, or a planned proportion of subjects will show endpoint events rather than all endpoints observed. In that case, there will be type III censoring in practice.
The existence of censoring may be the most influential factor for power of test statistics, and the features of real trials discussed above should be simulated to evaluate their practical performance. In this part, we do not consider the censoring caused by accidents such as a drop-out or adverse event. In this series of simulations, , , and are estimated by the hazard function of the control group before in each scenario.
Taking the study of Ray et al. [
13] as a reference, we set the time unit as month, and the patient enrollment follows a Poisson process with a parameter equal to 25. The total enrollment period lasts for 12 months, which means about 300 subjects will be enrolled in the trial. The end of the trial is set as
of the total, which is that about 210 subjects are observed to occur endpoint events. The group ratio is still
and the number of repetition is 5000.
To ensure the comparability, we take the simulation study settings in the study of Ray et al. [
13] as references and copy four delayed treatment effect scenarios denoted as
,
,
and
.
and
are two typical delayed treatment effect scenarios, while
and
are more complex with converging tails. To enrich the scenarios and evaluate the performance of statistics when prior information is lacking or unreliable, we set
and
where the delayed treatment effects do not take at
, so the distributions of analysis data are different from the distributions expected by prior information. Furthermore, we add two proportional hazard scenarios
and
to make the comparison, and statistics based on prior information keep the same parameter selection as above rather than the real. The specific hazard function settings are shown in the
Table 5.
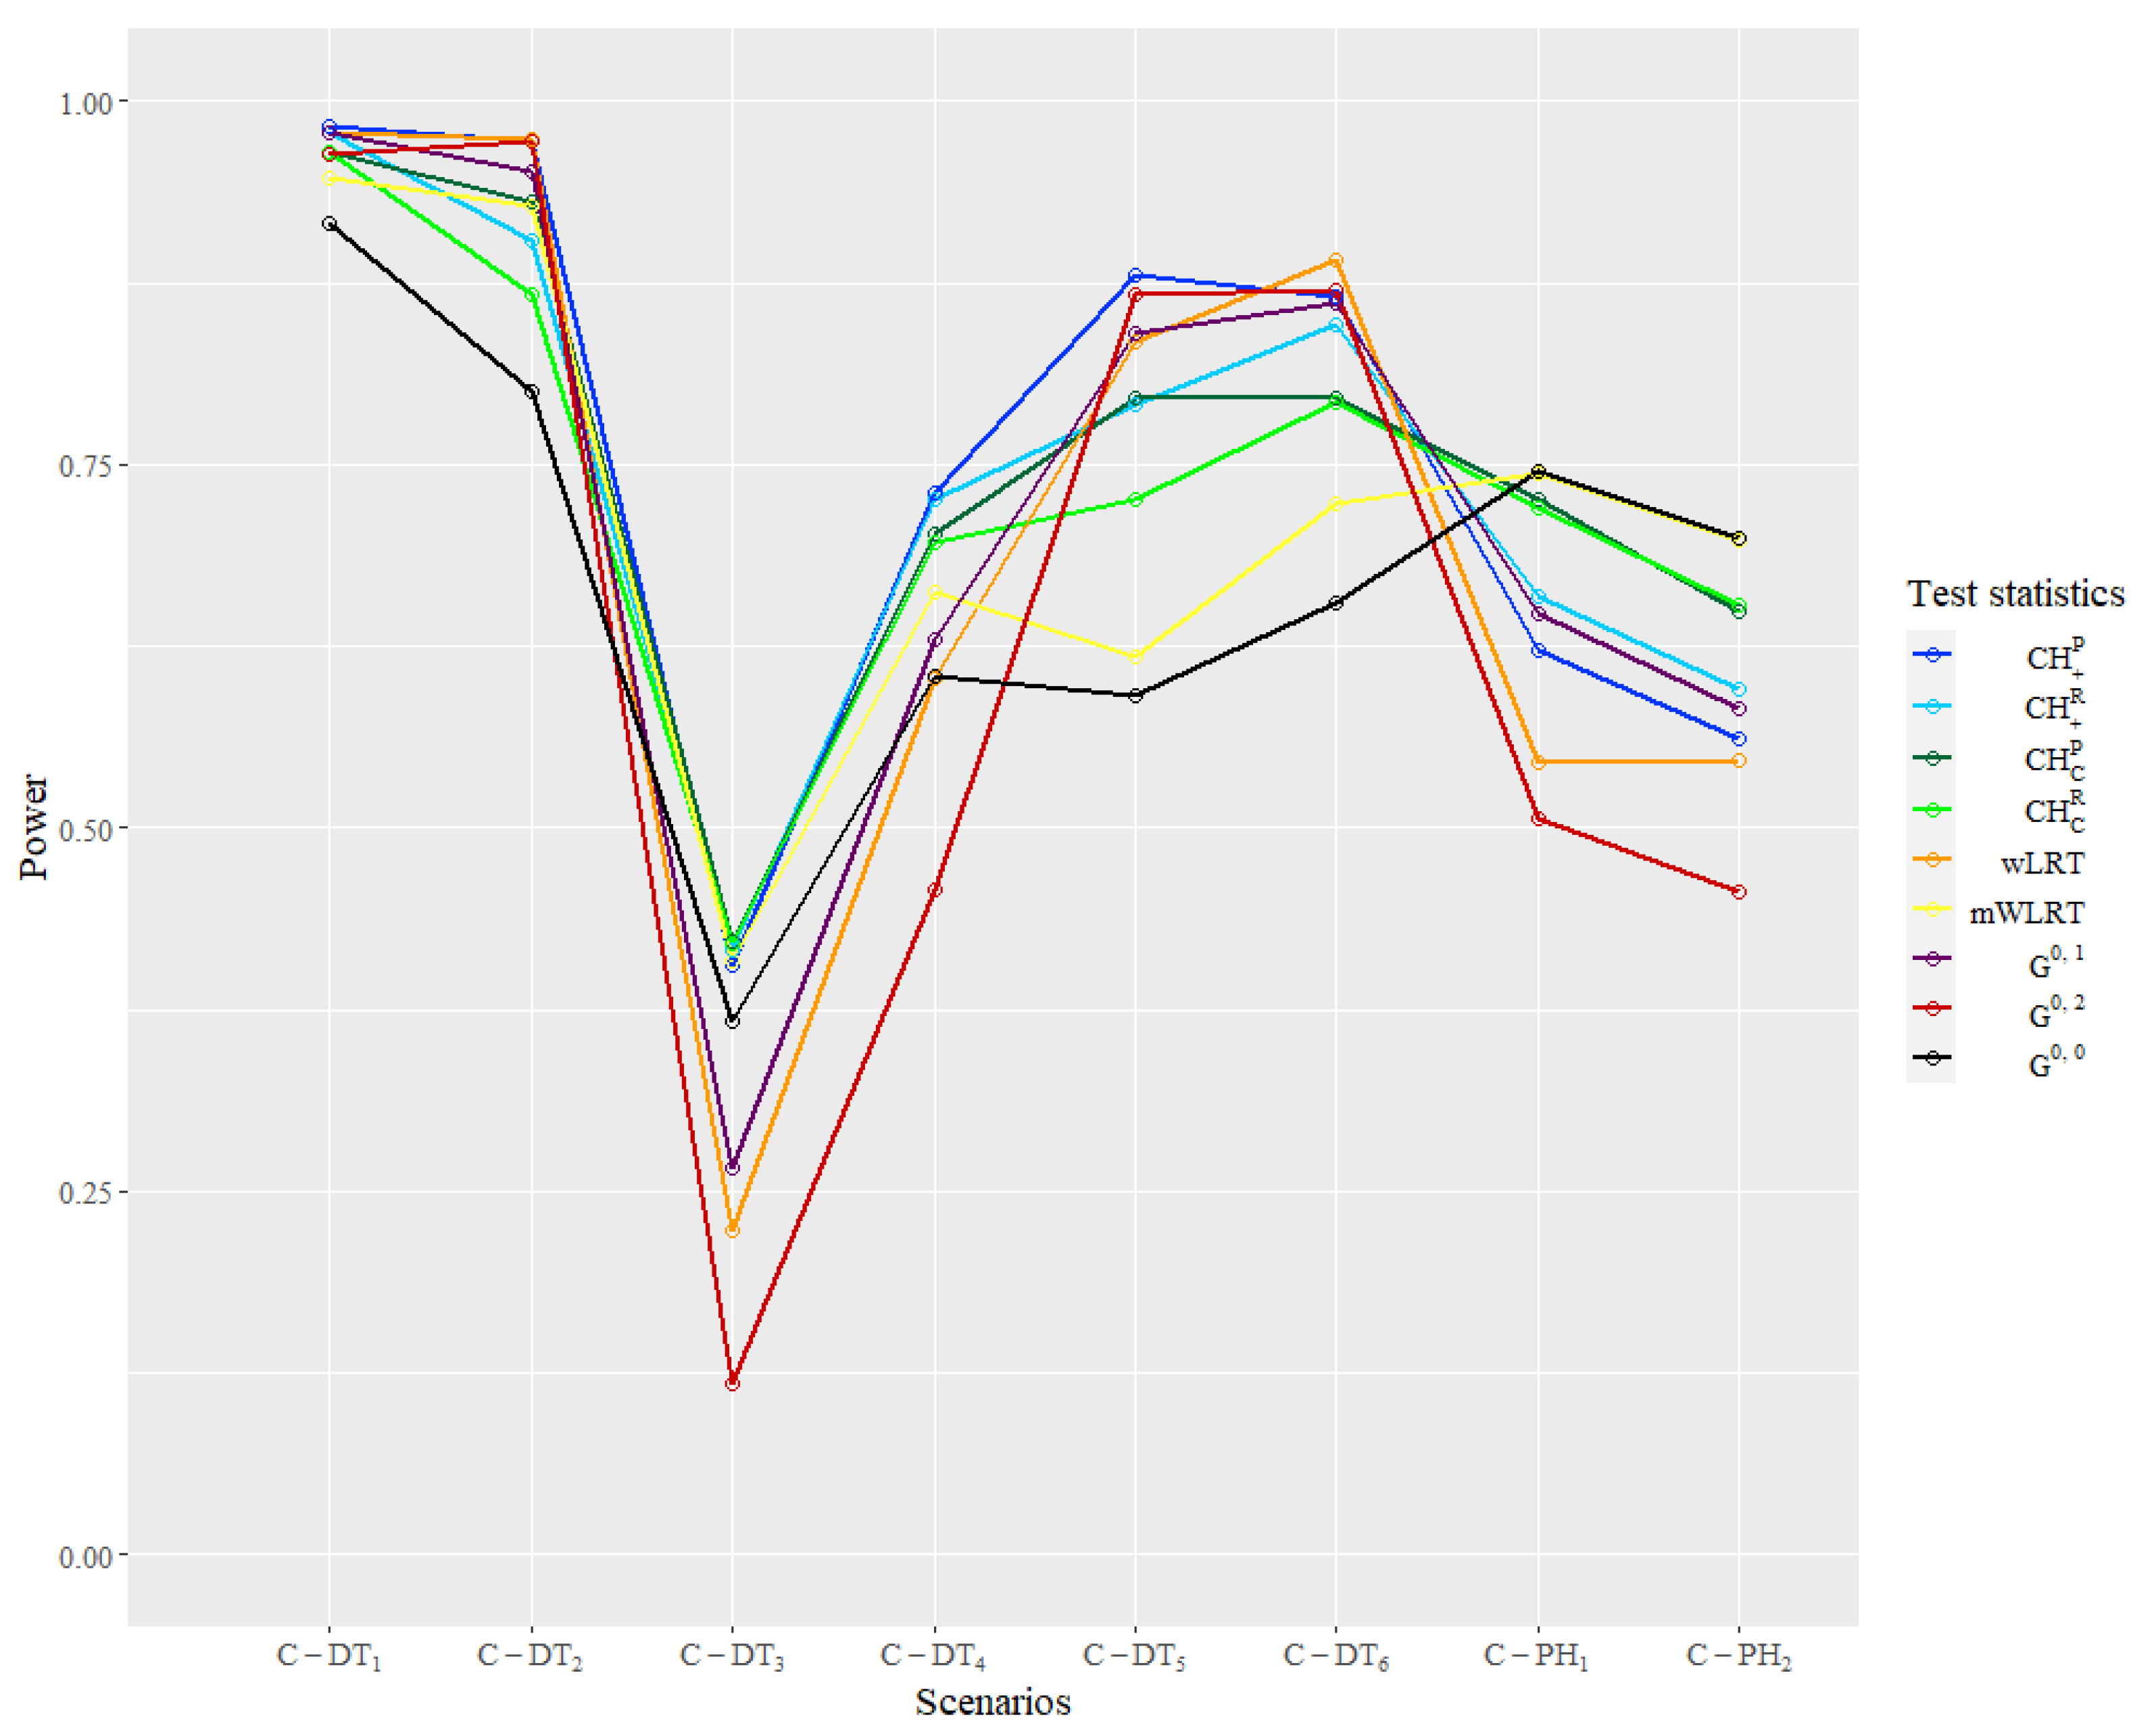
The empirical power result of the simulation in the clinical trial settings is reported in
Table 6 and
Figure 6. In the classic scenarios of
and
,
has the lowest power, while other statistics maintain good performance.
,
,
and
have relative higher powers over 0.9, and
and
are in the second tier. In
and
with a converging tail, the
family statistics manifest an obvious advantage over others. In
, only
and
statistics have power over 0.4, while other statistics perform very poorly. In
, the power of
statistics is over 0.1 above the power of the
family. The power of
and
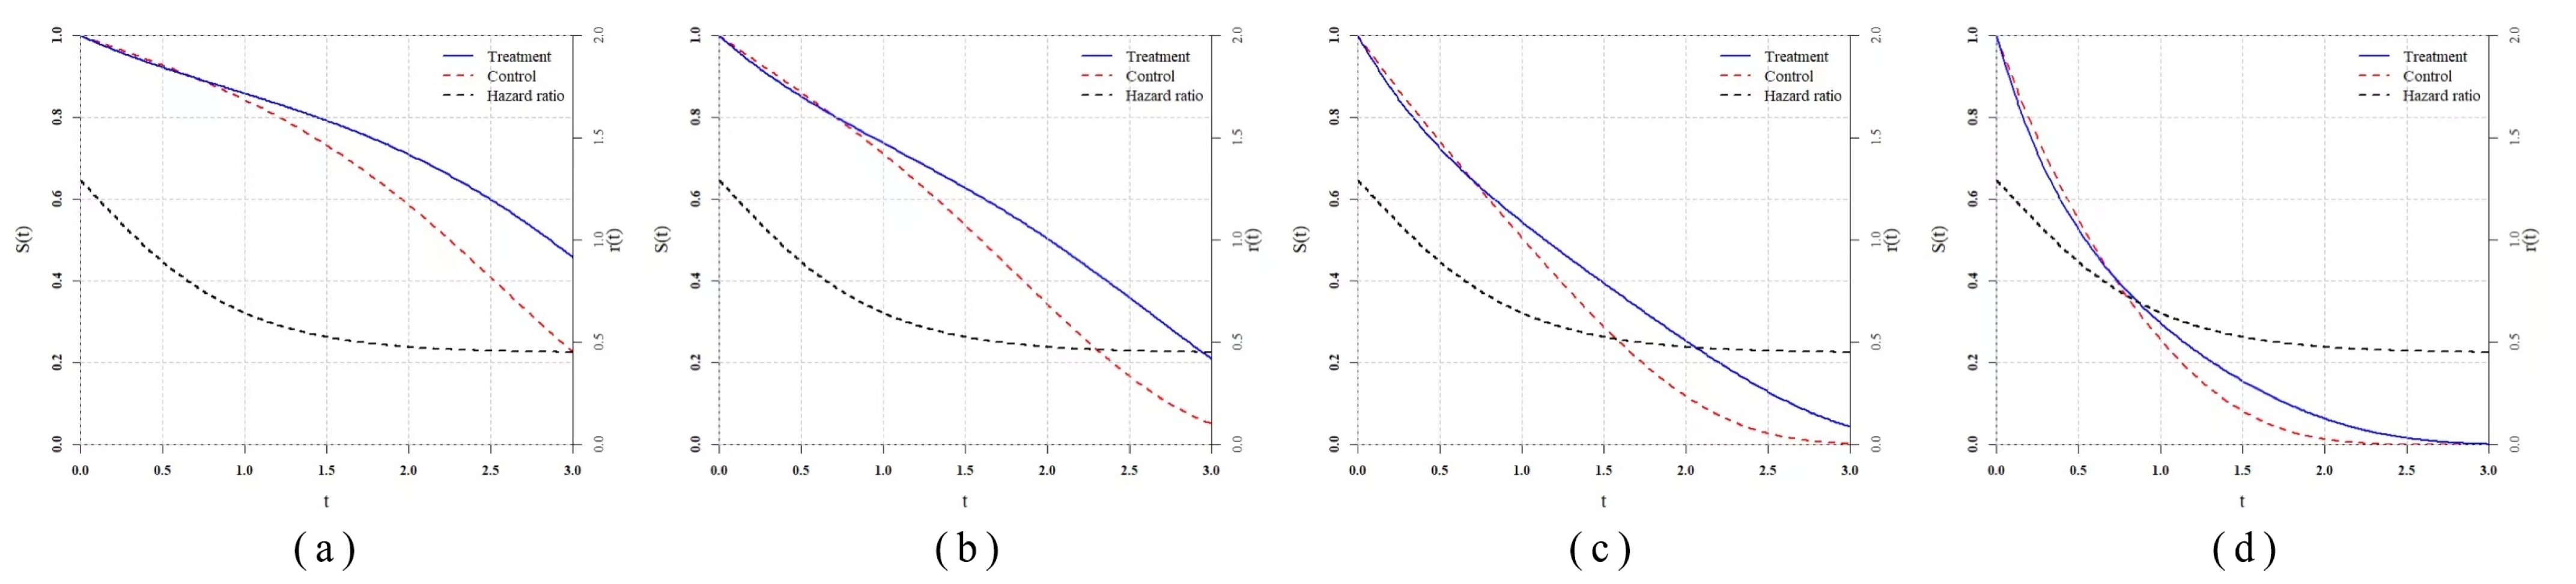
are the lowest in these two scenarios and have great contrasts with the first two scenarios, which shows relatively poor robustness of these two statistics. In
and
, where the delayed treatment effect occurs later, powers of
,
,
and
are the highest and over 0.8, while powers of the other three
statistics are in the second tier but higher than
and
obviously. In
and
that belong to the proportional hazard scenarios,
is the most powerful one as expected. Similar to the simple settings, the power of
is very close to the
, and the
family statistics also have robust performance. The powers of
and
are very close to the highest one with differences less than 0.05. The performance of
is relatively poor in the proportional hazard ratio when the prior information is unreliable and is only higher than
.
6. Discussion
How to deal with the delayed treatment effect and conduct a corresponding hypothesis test is a very significant topic in the clinical trial research. There has been rich work about WLRT, but their comparisons and adaptive scenarios remain to be figured out. We propose a novel parametric family of hazard function to fit the delayed treatment effect and derive the corresponding weight function based on the method develop by Fleming and Harrington. The flexibility of the
family parameters in fitting the delayed treatment effect and the good performance of
statistics show that setting up a useful and adaptive hazard function family first and then solving a corresponding weight function may be a feasible way to develop practical WLRT. Theoretically, the most powerful test can always be found through this idea, but how to improve the compatibility of the function family model and whether the result from Fleming and Harrington’s method has an analytical expression and meets the regularity conditions are problems that seem to be contradictory sometimes and need to be solved. Compared with methods defining the weight function directly, deriving the weight function based on a specific hazard function family can connect the statistical inference to the actual survival scenarios closely and thus have better clinical interpretations. This study offers an example, but the application of such ideas should not be limited. It should be mentioned that all WLRT, including
statistics, can be used for constructing combination tests according to the related large sample properties proposed by Fleming and Harrington [
20], so a similar Max–Combo test (for example,
) can also be constructed to improve the robustness.
No test statistic can remain the most powerful uniformly under all scenarios through the result of simulation, so the relatively high power under certain common scenarios and the property of robustness are very important. From this study, the performance of is poor and only better than the standard log-rank test. Its high power under proportional hazard scenarios reflects that it is a rather conservative weight compared to other WLRT. The performance of is a little extreme in the simulation: very high power in some settings and very low power in others. This phenomenon may be associated with its relatively extreme weight compared to others and the high dependence on the prior information. Apparently, such features will influence its practicability when little information is known before the trial. Generally, the test is the recommended single WLRT of this paper. Its similar power to the standard log-rank test under proportional hazard and relative high power dealing with the delayed treatment effect ensures its robustness in testing various scenarios. Moreover, different forms of in (A1) can be considered to derive test statistics that are more powerful and generalized. Both and have their advantages and disadvantages in different settings, but has a smoother and simpler expression, which also inspires us to find better correction forms. The power of test using the prior information method is generally higher than the default selection method, but the latter one still remains at a high level. Even when there is little or no information about the pattern of the treatment effect, the test can ensure a relative high power and increase the efficiency. In practice, the decision on the selection of test methods should be based on the properties of such test statistics and conditions of known information, and data simulation is recommended to be conducted in advance if the conditions permit.


