Article

DenSec: Secreted Protein Prediction in Cerebrospinal Fluid Based on DenseNet and Transformer

1
Key Laboratory of Symbol Computation and Knowledge Engineering of Ministry of Education, College of Computer Science and Technology, Jilin University, Changchun 130012, China
2
College of Computer Science and Technology, Changchun University, Changchun 130022, China
*
Author to whom correspondence should be addressed.
Mathematics 2022, 10(14), 2490; https://doi.org/10.3390/math10142490
Submission received: 14 June 2022 / Revised: 13 July 2022 / Accepted: 16 July 2022 / Published: 18 July 2022
(This article belongs to the Special Issue AI Algorithm Design and Application)

Abstract

:
Cerebrospinal fluid (CSF) exists in the surrounding spaces of mammalian central nervous systems (CNS); therefore, there are numerous potential protein biomarkers associated with CNS disease in CSF. Currently, approximately 4300 proteins have been identified in CSF by protein profiling. However, due to the diverse modifications, as well as the existing technical limits, large-scale protein identification in CSF is still considered a challenge. Inspired by computational methods, this paper proposes a deep learning framework, named DenSec, for secreted protein prediction in CSF. In the first phase of DenSec, all input proteins are encoded as a matrix with a fixed size of 1000 × 20 by calculating a position-specific score matrix (PSSM) of protein sequences. In the second phase, a dense convolutional network (DenseNet) is adopted to extract the feature from these PSSMs automatically. After that, Transformer with a fully connected dense layer acts as classifier to perform a binary classification in terms of secretion into CSF or not. According to the experiment results, DenSec achieves a mean accuracy of 86.00% in the test dataset and outperforms the state-of-the-art methods.

1. Introduction

Human body fluids, such as blood, urine and saliva, contain many disease-associated proteins. The research of body-fluid proteomics has attracted much interest from clinicians, pathologists and biologists for many years. Modern proteomic tools, such as two-dimensional gel electrophoresis (2-DE) [1], liquid chromatography (LC) [2] and mass spectrometry (MS) [3], have led to the identification of approximately 11,000 proteins in common human body fluids [4]. Cerebrospinal fluid (CSF) is a clear, proteinaceous fluid that exists in the surrounding spaces of mammalian central nervous systems (CNS) [5]. Because CSF is directly connected to extracellular fluid in brain tissue, the composition of CSF adjusts to the physiological state of the nervous system and is affected by infections, tumours, neurodegenerative diseases, etc. Therefore, there are numerous potential protein biomarkers associated with CNS disease in CSF, which leads to a wide application of CSF in clinical practice.
Nowadays, the availability of many public databases provides powerful tools that facilitate research in clinical body-fluid proteomics [6]. For instance, the human body-fluid proteome (HBFP) database (https://bmbl.bmi.osumc.edu/HBFP/, accessed on 15 November 2021) [7], our previous research, focuses on experimentally validated proteome and archives more than 11,000 unique proteins from 17 types of human body fluids. Among them, 4350 CSF proteins identified by biological experiments are collected from 12 public literature collections. Despite the success of bio experimental approaches for protein identification, however, large-scale protein identification is still considered a challenge due to the highly complex composition of body-fluid proteome.
As a result, many computational approaches have been proposed to predict the secreted protein of different body fluids based on machine learning (ML) and various neural network technologies. The first prediction model was based on a support vector machine (SVM), which adopted a binary classification to predict protein secretion into blood or not and used common features, e.g., amino acid composition, signal peptide and secondary structure, as the input [8]. Since then, some reports on urine and saliva protein prediction were published also using a SVM algorithm and protein common features [9,10]. Despite these models achieving promising performances, they generally suffered from some limitations such as manual intervention in the feature selection procedures. Recently, deep learning (DL) with neural network models, such as convolutional neural network (CNN), long short-term memory (LSTM) and gated recurrent unit (GRU), have been used for body-fluid protein prediction [11,12,13]. Du et al. proposed a DL model, named DeepUEP, which consists of a CNN module, a recurrent neural network (RNN) with LSTM and an attention module to predict the urine excretory proteins [12]. In addition, they proposed a DL model based on the capsule network and Transformer architecture, SecProCT, to predict secretory proteins in blood and saliva [13]. Additionally, a novel DL framework, DeepSec, our previous research, for prediction of 12 different types of human body fluids was presented using CNN and a bidirectional gated recurrent unit (BGRU) [11]. Instead of the common features, amino acid sequences were involved in the computational model as the input features. In addition, automatic feature extraction was adopted to dispense with the initial feature selection step and improve the prediction performance. However, most of these models still focus on secreted protein prediction of blood, urine and saliva. Therefore, building a model for CSF secreted protein prediction is essential.
During the years, dense convolutional network (DenseNet) has been successfully applied in various fields to improve accuracy and efficiency [14]. It has been verified that DenseNet is able to solve the problem of vanishing gradient and reinforce the propagation of features across networks when compared with a traditional CNN [15]. Additionally, recent research on Transformer architecture [16] has shown that it can focus more on solving the large-scale computing problems caused by the excessive length of the sequence and has surpassed CNNs in many tasks [17]. In this paper, we propose a DL-framework, named DenSec, to predict CSF secreted proteins based on protein sequence information. DenSec employs DenseNet as feature extractor and Transformer architecture with fully connected dense layer as a classifier. DenSec has demonstrated promising performances with high accuracies and outperformed existing state-of-the-art methods.

2. Protein Data

2.1. Data Collection

The CSF proteins were collected fromthe HBFP database (https://bmbl.bmi.osumc.edu/HBFP/, (accessed on 15 November 2021)) [7]. A total of 4350 CSF secreted proteins were obtained as positive samples of our model. For the negative samples, we have no clear evidence on which proteins are not secreted in the CSF, so we refer to the approach of our previous study, in which negative samples were filtered by the information of Pfam family [11]. We chose negative samples from Pfam families (Pfam release 33.1) [18] which do not contain any proteins in the positive samples. As a result, 4710 proteins are chosen as negative samples for our model. Finally, the entire sample space of DenSec contains 4350 positive samples and 4710 negative samples, respectively. Then, all samples are classified into a training dataset and a testing dataset, bearing the shares of 85% (i.e., 7800 proteins) and 15% (i.e., 1260 proteins), respectively. In addition, 10-fold cross validation is performed on the training dataset. Furthermore, to assess the robustness of the scores to perturbations of the test set, we resample these data for 1000 times randomly and perform prediction on all sets.

2.2. Encoding Protein

Instead of common protein features, in DenSec, we adopt a position-specific score matrix (PSSM) [19] as the input features of our model. The PSSMs are calculated by a position-specific iterative basic local alignment search (PSI-BLAST) [20] on UniRef 90 (released in 2020_01) database with inclusion 0.001 and 3 iterations. For each PSSM, the row represents 20 amino acid vocabulary, and the column indicates amino acid sequence of the protein. Since different proteins contain different amino acid composition, the column lengths of the corresponding PSSMs are also not consistent. To facilitate the subsequent model fitting operation, we standardize the specification of the PSSM to a 1000 × 20 matrix, where 1000 represents the amino acid sequence length of the protein and 20 represents 20 amino acids (aa). For protein sequences less than 1000 in length, the number 0 is filled after the sequence; as for the protein sequences more than 1000 in length, 500 aa from N-terminus and C-terminus of the protein sequence are preserved, respectively. This method of cutting the amino acid sequence has been used in many cases of secreted protein prediction [11,12]. We then transform the PSSM described in [21] by the Sigmoid function 1 / ( 1 + exp ( x ) ) , where x represents a single entry of the PSSM. It is worth noting that there are many “0” items in the PSSMs, which are used to fill sequences. During the transform process, the filled “0” cannot be transformed by the Sigmoid function in order not to affect the subsequent calculation of neural networks. We calculate the mean distribution of protein sequence length in the training and testing datasets after resampling 1000 times, respectively, as shown in Table 1.

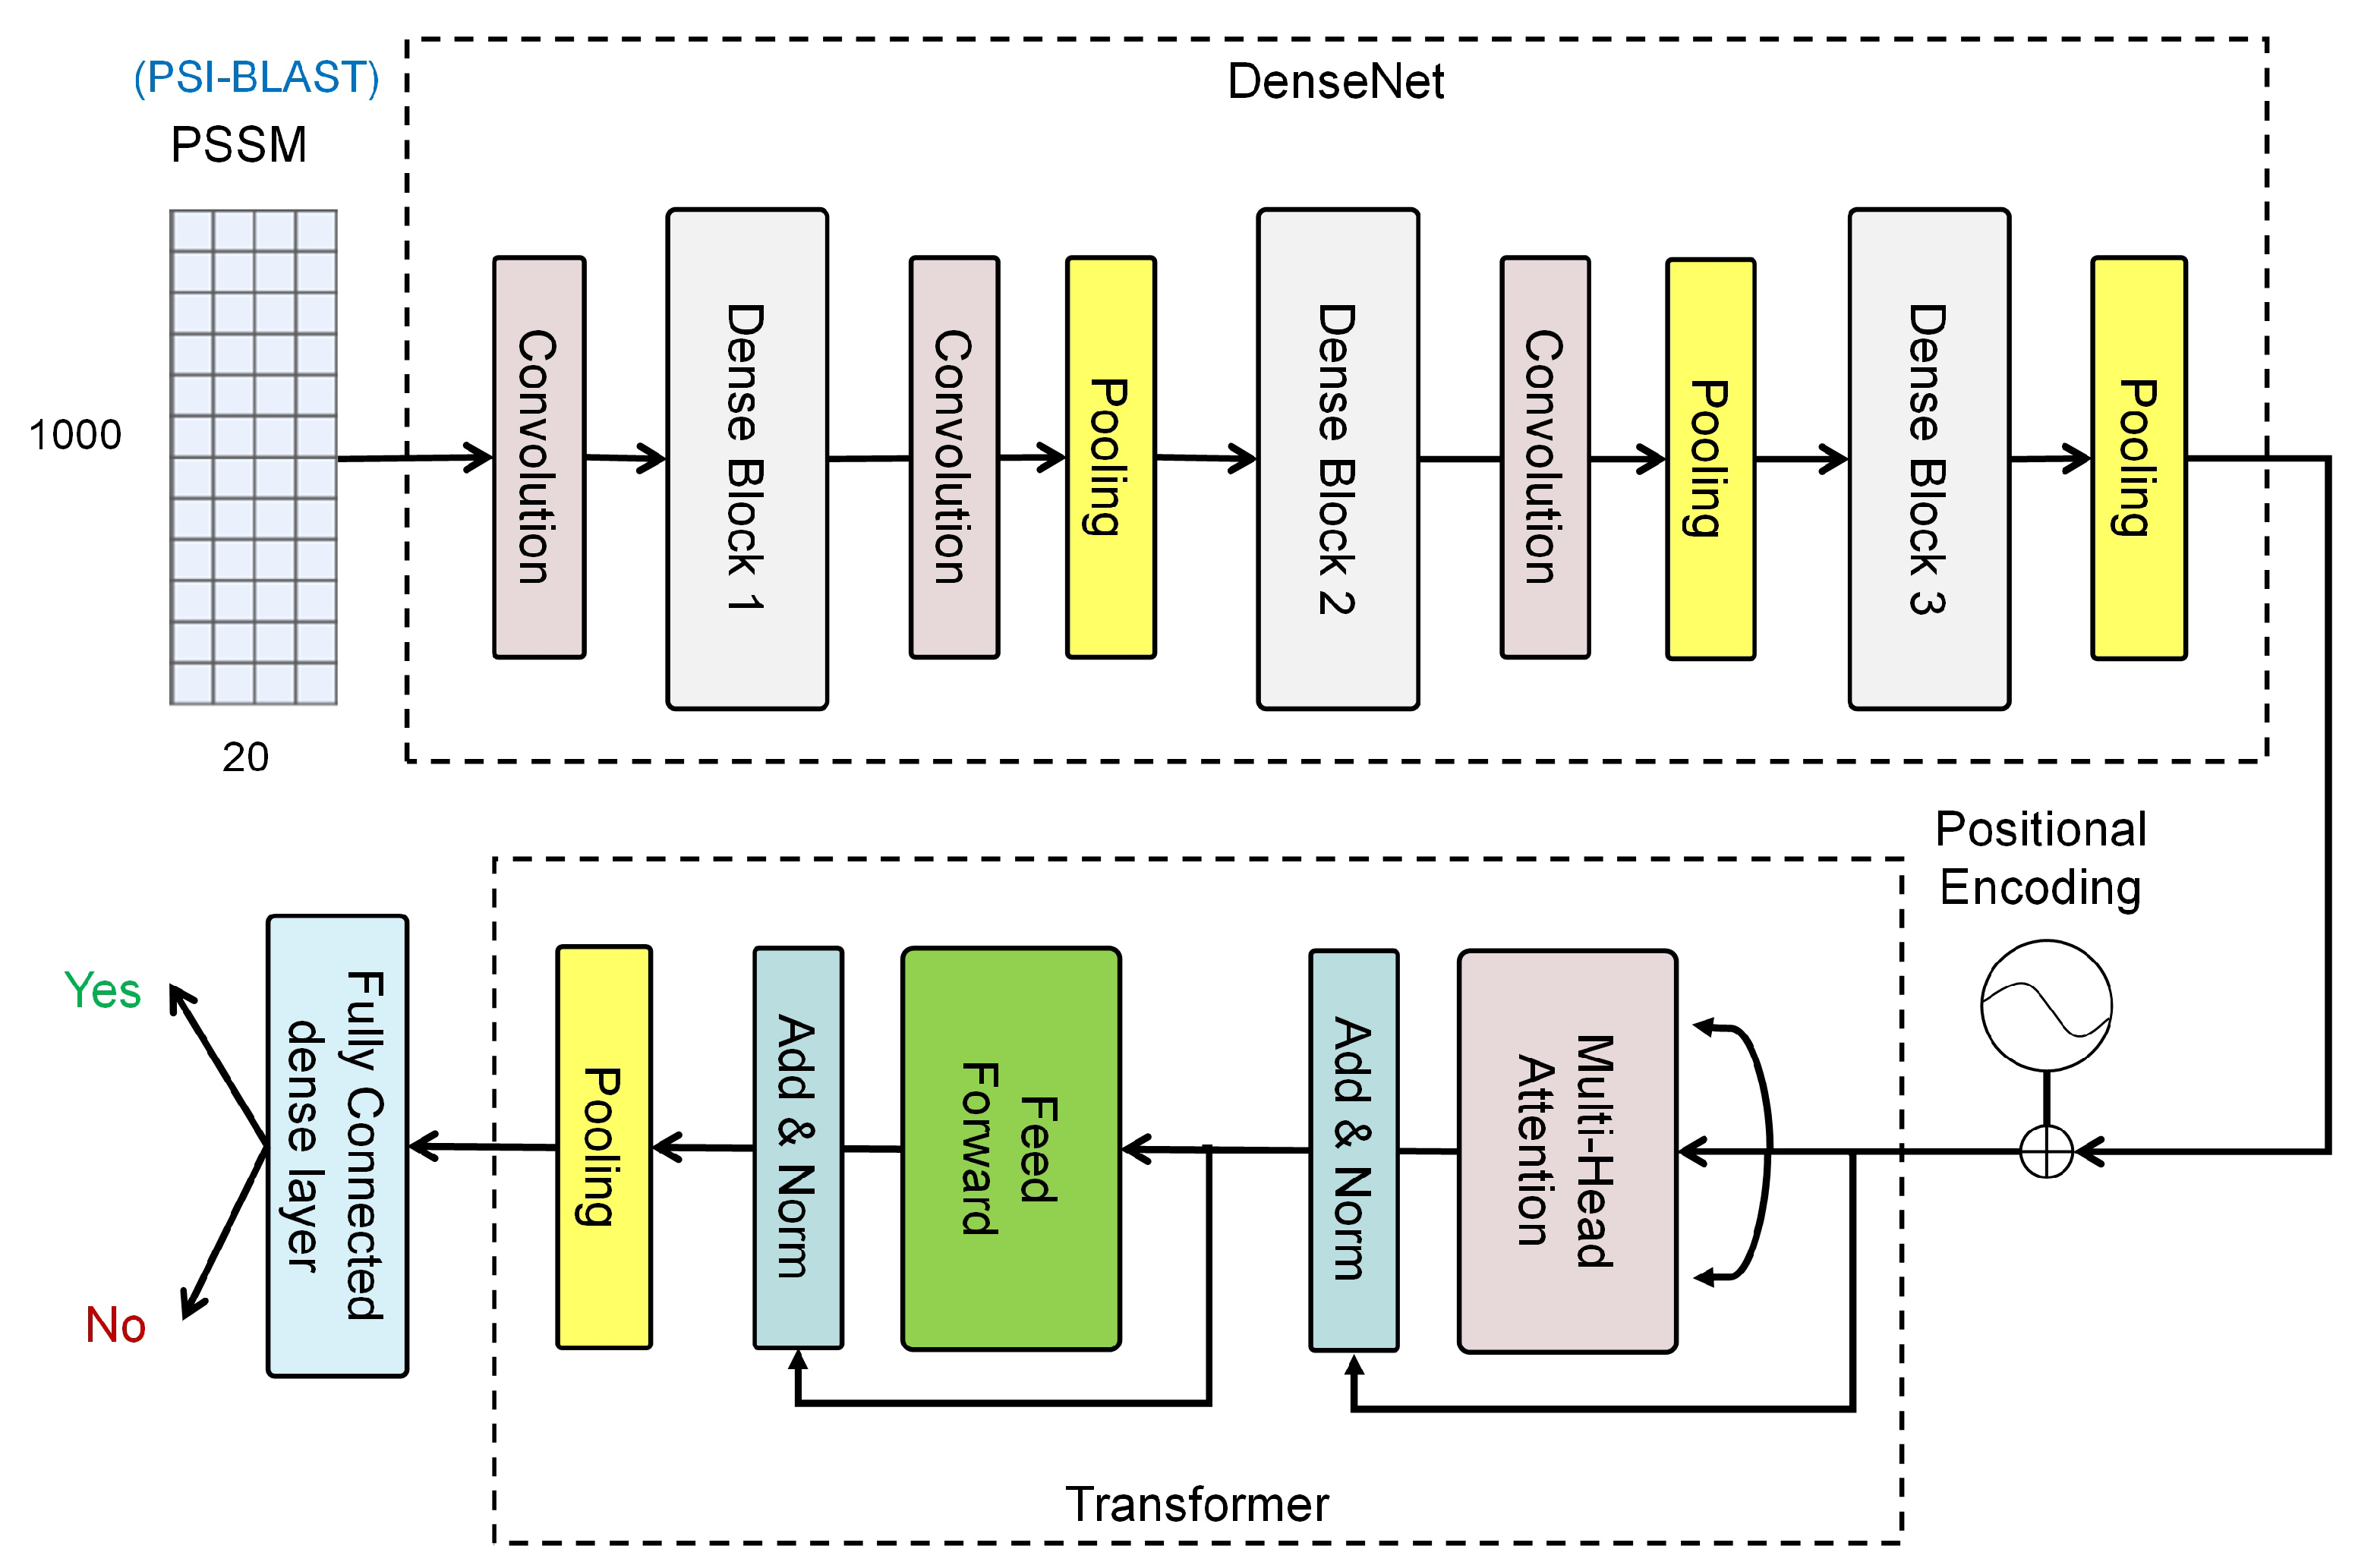
3. The Proposed Method

This paper introduces a DL-framework, DenSec, to predict secreted proteins in CSF. The overall DenSec model is shown in Figure 1. First, the input of the model is the PSSM of each protein, which is a 1000 × 20 matrix. Next, we employ the DenseNet, rather than the traditional CNNs, to capture the features of the protein sequences. Finally, Transformer with a fully connected dense layer is used as classifier.
To this end, the main contributions of this paper are as follows:
  • A new deep learning model is proposed to predict CSF proteins based on DenseNet and Transformer architecture;
  • We employ the DenseNet for feature extraction instead of traditional CNNs, which allows the model to achieve better performance with fewer parameters and computational costs;
  • We propose Transformer to capture possible long-range dependencies between protein sequence and secreted status of proteins, which contributes to the improved performance.

3.1. Feature Learning Using DenseNet

In DenSec, DenseNet is employed to extract the features of amino acid sequences. DenseNet has achieved great success in the field of image recognition. In the image task, every image is processed to a matrix which is similar to the PSSM matrix. Inspired by this, in this paper, we make a big attempt and apply it to the protein sequence. The results show that it also performs automatic feature extraction. DenseNet aims to improve the model performance from the perspective of feature reuse. As shown in Figure 1, a three-layer dense block with a growth rate of k = 12 is defined. In each dense block, rather than multiple convolution layers, single layers are connected one by one, and each subsequent layer takes all the preceding layers as its additional input. In addition, we employ a transition layer between blocks, which perform convolution and pooling. For a dense block, we define:
X = H X 0 , X 1 , , X 1
where X represents the l-th layer output, which is computed by the preceding layer outputs using a nonlinear transformation H l ( · ) . H l ( · ) is a composite function of three consecutive operations: batch normalization, the activation function ReLU and a convolution with kernel size of 3 × 3.

3.2. Classification Using Transformer

To capture the relationships of the protein sequences, we adopt Transformer for classification. In Transformer, a two-layer architecture is built, as shown in Figure 1. The first adopts a multi-head self-attention mechanism, and the second is a fully connected feedforward network. Around each of the two layers, a residual connection is used, followed by layer normalization.
h ˜ = LN h + MHAtt h
FFN h ˜ = max 0 , h ˜ W 1 + b 1 W 2 + b 2
h = LN h ˜ + FFN h ˜
where h = P o s E m b ( T ) and T is the output of DenseNet, P o s E m b is the operation of adding positional embedding (indicating the position of each sequence) to T, L N is the layer normalization operation [22], and M H A t t is the multi-head attention operation [23]. F F N is the feedforward network, which consists of two linear transformations with a ReLU activation in between. W and b are the weight vector and bias, respectively; h is the final result of Transformer.
The subsequent classification is performed by one fully connected layer with two hidden layers. The hidden layers compute a non-linear transformation, defined as follows:
f = max 0 , h · μ + v
where μ and v are the weight vector and bias respectively, and h is the output matrix of Tranformer.
One output layer computes the probability distribution, defined as follows:
y ^ = σ ( f · γ + τ )
where γ and τ are the weight vector and bias, respectively, and σ is the Softmax function.
In our model, we adopt cross-entropy as the loss function to measure the distance between the prediction and the ground truth:
L = 1 n i = 1 n y i · log y ^ i + ( 1 y ) · log 1 y ^ i
where y ^ represents the predicted value, y represents the ground truth value, and n represents the numbers of samples.

4. Results

For our experiment, all implementations and evaluation are performed on a computer with Microsoft Windows 10 OS, and the software environment is Keras 2.2.4 and TensorFlow 1.13.1. Additionally, these model’s hyperparameters are optimized using the Adam stochastic optimizer [24] with the following parameters: an exponential decay rate of 0.9 at the first moment estimation, an exponential decay rate of 0.999 at the second moment estimation, and an epoch of 600. All data are resampled 1000 times with 85% of the training dataset and 15% of the test dataset.

4.1. Result Analysis Method

The prediction performance is measured based on the testing dataset. Accuracy, sensitivity, specifically, Matthew’s correlation coefficient (MCC), and the Area under the ROC Curve (AUC) are applied.
Accuracy = T P + T N T P + T N + F P + F N
Sensitivity = T P T P + F N
Specificity = T N T N + F P
MCC = T P × T N F P × F N ( T P + F N ) ( T P + F P ) ( T N + F P ) ( T N + F N )
where T P represents the true positive, T N represents the true negative, F P represents the false positive, and F N represents the false negative. Accuracy represents how many predictions of the classifier are in fact correct. Sensitivity shows how many positive examples are correctly identified by the classifier. The specificity relates to the ability to correctly identify the negative examples. MCC is a correlation coefficient between the observed and predicted binary classifications. AUC presents the average value of sensitivity for all possible values of specificity.

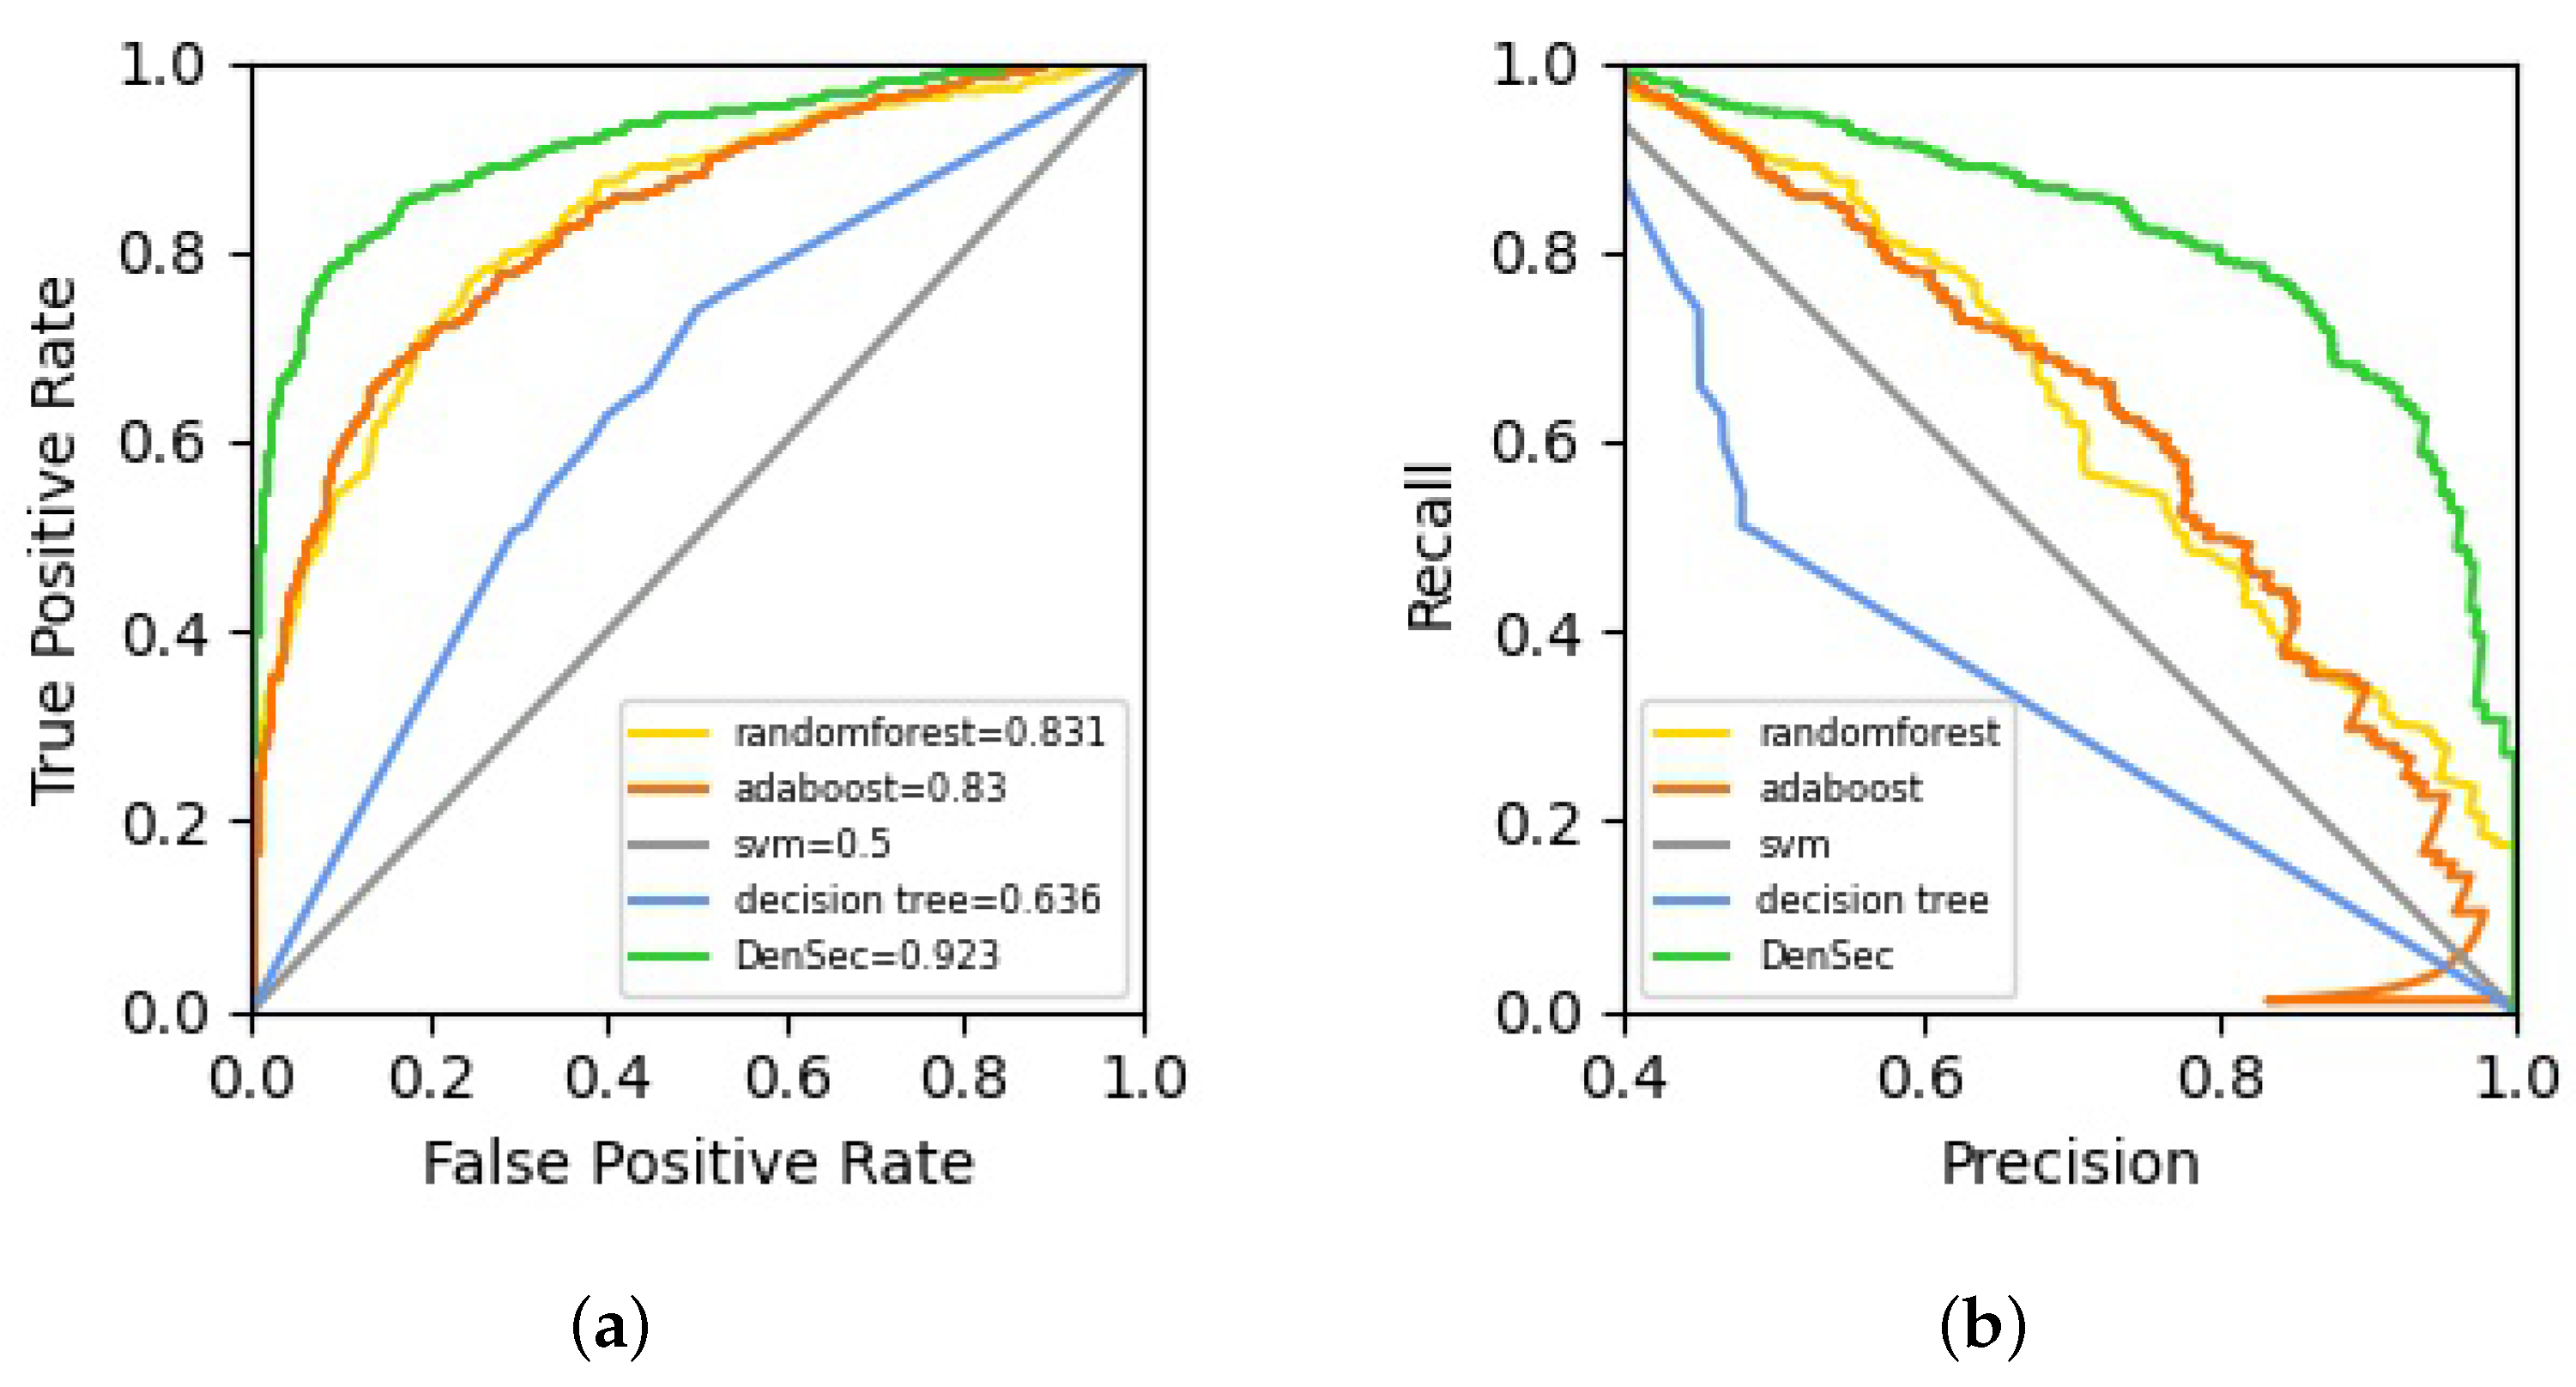
4.2. Evaluating the Performance of Classification

The input is sequence length (=1000) × size of amino acid vocabulary (=20). DenseNet uses three dense blocks with a growth rate of k = 12. The feature map sizes in the three dense blocks are {1000 × 20 × 75, 1000 × 20 × 100}, {500 × 10 × 62, 500 × 10 × 87}, and {250 × 5 × 68, 250 × 5 × 93}, respectively. Before entering the first dense block, a convolution with 50 filters of size 3 × 3 is performed on the input matrix. We use 1 × 1 convolution followed by 2 × 2 average pooling as transition layers between two contiguous dense blocks. At the end of the last dense block, a global average pooling followed by a reshaping is performed. In total, DenseNet gives a 31 × 3 dimensional output which is used as input to Transformer. Transformer uses three attention heads. Meanwhile, the feedforward neural network (FFN) is 2048 and 512 units in the two layers of Transformer, respectively. Subsequently, a global average pooling is adopted to produce outputs of dimension d = 3. Finally, the above result is fed to a fully connected dense layer that has two hidden layers of 256 and 32 units, respectively. All parameters were optimized by the Adam optimizer with a learning rate as 0.0001 and a dropout probability of 0.7 prior to the fully connected layer. We chose 0.5 as the prediction threshold, which means that a probability ≥ 0.5 indicates a positive class associated with secretion into CSF.
To evaluate DenSec against other exiting methods, 10-fold cross validation is performed on the training dataset. The same training dataset and validation dataset are used for all methods. We compare the performances between the DenSec model and other exiting models in terms of accuracy, sensitivity, specificity, MCC and AUC.
First, considering that ML algorithms have been used to predict protein secretion, we construct several models based on the common ML methods, including SVM, adaptive boosting (AdaBoost), Decision Tree and Random Forest. Gaussian kernel function is employed in SVM. The penalty coefficient is set as 0.1, while the coefficient of the kernel function is 10. Moreover, the learning rate is set as 0.6 and maximum iterations as 600 in AdaBoost. Furthermore, in Decision Tree, we set the maximum depth of the tree as 50 and minimum samples of leaf nodes as 3. Meanwhile, in Random Forest, we set the number of trees in the forest as 400. Other parameters are set to default values. After resampling and assessing 1000 times, the mean scores and the distribution [L,U] of scores are reported in Table 2, where L and U represent the lower and upper quantiles of that distribution. The DenSec classifier achieves the highest overall performance on testing dataset (average AUC: 0.923). In the meantime, it also attains the highest average values of accuracy (0.860) and MCC (0.726). The average ROCs and the Precision-Recall curves on testing datasets are plotted in Figure 2a,b, respectively.
Then, to ensure a comprehensive and systematic comparison, we also compare our model with the existing DL architectures, which include DeepSig (using CNN to detect signal peptides in proteins) [25], DanQ (using CNN with BLSTM to predict the characteristics and functions of DNA sequences) [26] and DeepSec (using CNN with BGRU to predict secretory proteins in 12 types of body fluids) [7]. As shown in Table 3, it can be seen that the performance of the DenSec classifier is better than that of the other DL methods in terms of accuracy, sensitivity, specificity, MCC and AUC. The average ROCs and the Precision-Recall curves are plotted in Figure 3a,b, respectively. Compared with traditional DL-based methods, DenseNet with Transformer is able to accurately predict the secreted protein just using the sequence information.
Finally, we apply DenSec to screen against all human proteins (20,386 unique proteins) in the UniProtKB/Swiss-Prot database (UniProt release 2022-02) and predict 6247 proteins as CSF proteins. Thus, 1897 potential new CSF proteins are discovered, which are available at https://github.com/quyl/DenSec, accessed on 12 June 2022.

4.3. Ablation Study on Classification

This experiment is used for model selection comparing the relative performances of the following model architectures:
  • Transformer
  • DenseNet
  • DenseNet with Transformer (DenSec)
The test performance is measured by training three models on the training dataset using 10-fold cross validation. In addition, the same training dataset and validation dataset are used for all models. In Table 4, we compare the performance of three models. The DenSec model achieves the highest performance predicting the secreted protein in CSF. From the results of the DenseNet without Transformer (accuracy 0.781), we can see that Transformer could improve prediction performance. These results confirm the benefit of Transformer for protein classification. In addition, DenseNet improves the performances of the model when comparing the first and third models. All in all, our model represents the best model architecture in predicting secreted protein in CSF based on protein sequence information.

5. Conclusions

We propose a new deep learning framework, named DenSec, for secreted protein prediction in CSF. The experimental results show that DenseNet with Transformer are able to accurately predict the secreted protein just using the sequence information. In DenSec, instead of traditional CNNs, DenseNet is employed for feature learning automatically. The feature maps learned by any of the layers can be accessed by all subsequent layers in DenseNet, which leads to feature reuse and allows the model to achieve better performance. In addition, Transformer is adopted to capture possible long-range dependencies between protein sequence and secreted status of proteins. A multi-head attention is beneficial to model performance. Furthermore, we have introduced the CSF protein collection and negative sample generation. The DenSec model trained on these datasets is able to generalize better than the current prediction models, including ML algorithms (SVM, AdaBoost, Decision Tree and Random Forest) and DL methods (DeepSig, DanQ and DeepSec). In addition, we also compared the performance against different model architectures: (1) DenseNet and (2) Transformer. The measured average accuracy of DenSec is very high at 86.0%.
Although DenSec has achieved excellent prediction results, there is still room for optimization. Our future effort will focus on improving the performance of the prediction accuracy by using different input or methods. For instance, ESM-1b can be used to generate an embedding of protein and predict straight from this embedding. In addition, we will plan to discover novel candidates of disease biomarkers in CSF.

Author Contributions

Conceptualization, L.H. and D.S.; methodology, Y.Q. and K.H.; writing Y.Q. and D.S.; project administration, Y.W. All authors have read and agreed to the published version of the manuscript.

Funding

This research was funded by the National Natural Science Foundation of China (number 62072212) and the Development Project of Jilin Province of China (number 20200401083GX, 2020C003).

Institutional Review Board Statement

Not applicable.

Informed Consent Statement

Not applicable.

Data Availability Statement

Publicly available datasets were analyzed in this study. Codes and data are available at https://github.com/quyl/DenSec accessed on 12 June 2022.

Conflicts of Interest

The authors declare no conflict of interest.

References

  1. Margolis, J.; Kenrick, K.G. Two-dimensional resolution of plasma proteins by combination of polyacrylamide disc and gradient gel electrophoresis. Nature 1969, 221, 1056–1057. [Google Scholar] [CrossRef] [PubMed]
  2. Zhao, Y.Y.; Lin, R.C. UPLC—MSE application in disease biomarker discovery: The discoveries in proteomics to metabolomics. Chem.-Biol. Interact. 2014, 215, 7–16. [Google Scholar] [CrossRef] [PubMed]
  3. Thomson, J.J. Rays of positive electricity and their application to chemical analyses. Nature 1914, 92, 549–550. [Google Scholar]
  4. Huang, L.; Shao, D.; Wang, Y.; Cui, X.; Li, Y.; Chen, Q.; Cui, J. Human body-fluid proteome: Quantitative profiling and computational prediction. Brief. Bioinf. 2021, 22, 315–333. [Google Scholar] [CrossRef] [PubMed] [Green Version]
  5. Khasawneh, A.H.; Garling, R.J.; Harris, C.A. Cerebrospinal fluid circulation: What do we know and how do we know it? Brain Circ. 2018, 4, 14–18. [Google Scholar]
  6. Shao, D.; Dai, Y.F.; Li, N.F.; Cao, X.Q.; Zhao, W.; Cheng, L.; Rong, Z.Q.; Huang, L.; Wang, Y.; Zhao, J. Artificial Intelligence in Clinical Research of Cancers. Brief. Bioinf. 2022, 23, 1–12. [Google Scholar] [CrossRef]
  7. Shao, D.; Huang, L.; Wang, Y.; Cui, X.T.; Li, Y.F.; Wang, Y.; Ma, Q.; Du, W.; Cui, J. HBFP: A new repository for Human Body-Fluid Proteome. Database 2021, 2021, baab065. [Google Scholar] [CrossRef]
  8. Cui, J.; Liu, Q.; Puett, D.; Xu, Y. Computational prediction of human proteins that can be secreted into the bloodstream. Bioinformatics 2008, 24, 2370–2375. [Google Scholar] [CrossRef]
  9. Wang, J.; Liang, Y.; Wang, Y.; Cui, J.; Liu, M.; Du, W.; Xu, Y. Computational prediction of human salivary proteins from blood circulation and application to diagnostic biomarker identification. PLoS ONE 2013, 8, e80211. [Google Scholar] [CrossRef]
  10. Sun, Y.; Du, W.; Zhou, C.; Zhou, Y.; Cao, Z.; Tian, Y.; Wang, Y. A computational method for prediction of saliva-secretory proteins and its application to identification of head and neck cancer biomarkers for salivary diagnosis. IEEE Trans. Nanobiosci. 2015, 14, 167–174. [Google Scholar] [CrossRef]
  11. Shao, D.; Huang, L.; Wang, Y.; He, K.; Cui, X.; Wang, Y.; Cui, J. DeepSec: A deep learning framework for secreted protein discovery in human body fluids. Bioinformatics 2022, 38, 228–235. [Google Scholar] [CrossRef] [PubMed]
  12. Du, W.; Pang, R.; Li, G.; Cao, H.; Li, Y.; Liang, Y. DeepUEP: Prediction of urine excretory proteins using deep learning. IEEE Access 2020, 8, 100251–100261. [Google Scholar] [CrossRef]
  13. Du, W.; Zhao, X.; Sun, Y.; Zheng, L.; Li, Y.; Zhang, Y. SecProCT: In silico prediction of human secretory proteins based on capsule network and transformer. Int. J. Mol. Sci. 2021, 22, 9054. [Google Scholar] [CrossRef] [PubMed]
  14. Shome, D.; Kar, T.; Mohanty, S.N.; Tiwari, P.; Muhammad, K.; AlTameem, A.; Saudagar, A.K.J. Covid-transformer: Interpretable covid-19 detection using vision transformer for healthcare. Int. J. Environ. Res. Public Health 2021, 18, 11086. [Google Scholar] [CrossRef] [PubMed]
  15. Huang, G.; Liu, Z.; Van Der Maaten, L.; Weinberger, K.Q. Densely connected convolutional networks. In Proceedings of the IEEE Conference on Computer Vision and Pattern Recognition, Honolulu, HI, USA, 21–26 July 2017. [Google Scholar]
  16. Bahdanau, D.; Cho, K.; Bengio, Y. Neural machine translation by jointly learning to align and translate. arXiv 2014, arXiv:1409.0473. [Google Scholar]
  17. Zhang, Z.; Miao, C.; Liu, C.; Tian, Q.; Zhou, Y. HA-RoadFormer: Hybrid attention transformer with multi-branch for large-scale high-resolution dense road segmentation. Mathematics 2022, 10, 1915. [Google Scholar] [CrossRef]
  18. El-Gebali, S.; Mistry, J.; Bateman, A.; Eddy, S.R.; Luciani, A.; Potter, S.C.; Finn, R.D. The Pfam protein families database in 2019. Nucleic Acids Res. 2019, 47, 427–432. [Google Scholar] [CrossRef]
  19. Maurer-Stroh, S.; Debulpaep, M.; Kuemmerer, N.; De La Paz, M.L.; Martins, I.C.; Reumers, J.; Rousseau, F. Exploring the sequence determinants of amyloid structure using position-specific scoring matrices. Nat. Methods 2010, 7, 237–242. [Google Scholar] [CrossRef]
  20. Altschul, S.F.; Madden, T.L.; Schäffer, A.A.; Zhang, J.; Zhang, Z.; Miller, W.; Lipman, D.J. Gapped BLAST and PSI-BLAST: A new generation of protein database search programs. Nucleic Acids Res. 1997, 25, 3389–3402. [Google Scholar] [CrossRef] [Green Version]
  21. Wang, S.; Peng, J.; Ma, J.; Xu, J. Protein secondary structure prediction using deep convolutional neural fields. Sci. Rep. 2016, 6, 18962. [Google Scholar] [CrossRef] [Green Version]
  22. Ba, J.L.; Kiros, J.R.; Hinton, G.E. Layer normalization. arXiv 2016, arXiv:1607.06450. [Google Scholar]
  23. Vaswani, A.; Shazeer, N.; Parmar, N.; Uszkoreit, J.; Jones, L.; Gomez, A.N.; Kaiser, L.; Polosukhin, I. Attention is all you need. In Proceedings of the 31st Conference on Neural Information Processing Systems (NIPS 2017), Long Beach, CA, USA, 4–9 December 2017. [Google Scholar]
  24. Kingma, D.P.; Ba, J. Adam: A method for stochastic optimization. arXiv 2014, arXiv:1412.6980. [Google Scholar]
  25. Savojardo, C.; Martelli, P.L.; Fariselli, P.; Casadio, R. DeepSig: Deep learning improves signal peptide detection in proteins. Bioinformatics 2018, 34, 1690–1696. [Google Scholar] [CrossRef] [PubMed] [Green Version]
  26. Quang, D.; Xie, X. DanQ: A hybrid convolutional and recurrent deep neural network for quantifying the function of DNA sequences. Nucleic Acids Res. 2016, 44, e107. [Google Scholar] [CrossRef] [Green Version]
Figure 1. The architecture of DenSec which supports input as PSSM of protein sequences, feature extraction through DenseNet, classification based on Transformer with fully connected dense layer, and the outputs as the probability of being secreted protein in CSF.
Mathematics 10 02490 g001
Figure 2. The ROC and Precision-Recall curves for CSF protein prediction differentiation of DenSec versus other machine learning models: (a) the ROCs on the testing dataset; (b) the Precision-Recall curves on the testing dataset.
Mathematics 10 02490 g002
Figure 3. The ROC curves and the Precision-Recall curves for CSF protein prediction differentiation of DenSec versus other deep learning models: (a) the ROCs on the testing dataset; (b) the Precision-Recall curves on the testing dataset.
Mathematics 10 02490 g003
Table 1. The ratio of protein sequence length distribution of the training and testing datasets.
Sequence Length RangeTraining DatasetTesting Dataset
# of ProteinsProportion# of ProteinsProportion
<500476361.06%88970.56%
500–1000209526.86%26320.87%
>100094212.08%1088.57%
Table 2. The performance evaluation based on testing dataset, grouped by several machine learning methods.
MethodsAccuracySensitivitySpecificityMCCAUC
SVM0.5630.5470.6560.4050.500
[0.525, 0.596][0.505, 0.597][0.594, 0.703][0.362, 0.466][0.483, 0.527]
AdaBoost0.7380.6050.8480.4710.830
[0.694, 0.784][0.528, 0.701][0.723, 0.897][0.412, 0.526][0.774, 0.882]
Decision Tree0.6010.4580.7450.4120.636
[0.569, 0.645][0.393, 0.581][0.590, 0.796][0.386, 0.504][0.584, 0.688]
RandomForest0.7420.6060.8610.4890.831
[0.692, 0.778][0.543, 0.736][0.815, 0.883][0.408, 0.541][0.765, 0.874]
DenSec0.8600.8590.8700.7260.923
[0.844, 0.873][0.830, 0.885][0.857, 0.889][0.688, 0.765][0.858, 0.937]
Note: The highest scores are in bold.
Table 3. The performance evaluation based on the testing dataset, grouped by several deep learning methods.
MethodsAccuracySensitivitySpecificityMCCAUC
DeepSig0.7420.6840.7840.4690.805
[0.701, 0.779][0.627, 0.730][0.716, 0.862][0.435, 0.497][0.774, 0.828]
DanQ0.7590.7110.7920.5020.829
[0.712, 0.803][0.651, 0.758][0.727, 0.841][0.429, 0.548][0.797, 0.843]
DeepSec0.8230.8000.8460.5710.858
[0.808, 0.842][0.753, 0.833][0.821, 0.868][0.537, 0.614][0.826, 0.889]
DenSec0.8600.8590.8700.7260.923
[0.844, 0.873][0.830, 0.885][0.857, 0.889][0.688, 0.765][0.858, 0.937]
Note: The highest scores are in bold.
Table 4. Comparison of performances for different model architectures.
MethodsAccuracySensitivitySpecificityMCCAUC
Transformer0.5960.3810.8320.4400.579
[0.576, 0.615][0.331, 0.422][0.794, 0.851][0.425, 0.483][0.548, 0.604]
DenseNet0.7810.7530.8020.5520.767
[0.752, 0.803][0.729, 0.788][0.786, 0.849][0.534, 0.577][0.731, 0.804]
DenSec0.8600.8590.8700.7260.923
[0.844, 0.873][0.830, 0.885][0.857, 0.889][0.688, 0.765][0.858, 0.937]
Note: The highest scores are in bold.
Publisher’s Note: MDPI stays neutral with regard to jurisdictional claims in published maps and institutional affiliations.

