Abstract
Currently, with the quick increase in global population, the energetic crisis, the environmental problematic, and the development of the power electronic devices generated the need to include new technologies for supporting and potentiating electrical distributions systems; Distribution Static Compensators (D-STATCOMs) are highly used for this task due to the advantages that this technology presents: reduction in power loss, operation costs, and chargeability of branches, among others. The possibility to include this kind of technology within the electrical system has shown the need to develop efficient methodologies from the point of view of quality solution, repeatability and processing times by considering operation and investment costs as well as the technical conditions of the electrical grids under a scenario of variable power demand and then representing the real operation of the electrical grid. With the aim to propose a solution for this requirement, this paper presents a new Discrete-Continuous Particle Swarm Optimization (DCPSO) algorithm to solve the problem of the optimal integration of D-STATCOMs into Electrical Distribution Systems (EDSs). In this case, the objective function is the minimization of annual operating costs by using a weighted mono-objective function composed of the annual power loss and the investment cost and by including all constraints associated with the operation of an EDS in a distributed reactive compensation environmentinside the mathematical formulation. In order to evaluate the effectiveness and robustness of the proposed solution method, this study implemented two tests systems (i.e., 33- and 69-bus), as well as four comparison methods, and different considerations related to the inclusion of D-STATCOMs in the EDSs. Furthermore, for evaluating the repeatability of the solution obtained by each solution methods used, each algorithm was executed 100 times in Matlab software. The results obtained demonstrated that the proposed DCPSO/HSA methodology achieved the best trade-off between solution quality and processing time, with low standard deviation values for EDSs of any size.
Keywords:
D-STATCOM devices; electrical distribution networks; particle swarm optimization algorithm; discrete continuous optimization algorithm; power loss; annualized investment costs MSC:
37N40; 46N10; 68N19; 68R01
1. Introduction
In recent years, the world’s population growth has generated a considerable increase in power demand, affecting the quality of electrical services in terms of power loss, voltage profiles, and branch loadability, among others [1]. In order to solve this problem, the electrical sector and multiple authors have developed various Distributed Energy Resources (DERs) that can be used to improve the operational conditions of electrical grids [2], e.g., voltage profiles, power loss, branch loadability, power factor, operating costs, and others. DERs include distributed generators, energy storage systems, ultracapacitors, and D-STATCOMs [2,3]. These technologies provide the grid with active and reactive power in order to improve the technical, economical, and environmental indicators related to the operation of the grid [4]. However, the positive or negative effects of these devices on the electrical grid depend on the location and sizing of the DERs within the electrical system [5]. Therefore, the key to improving the technical and economical conditions of EDSs is to use an optimization algorithm to solve the mathematical formulation that represents the problem of the optimal integration of DERs into electrical grids.
The injection of reactive power into EDSs is widely used in electrical industries for improving the operating conditions of the electrical network [6]. This technology mainly aims to improve voltage profiles and branch loadability, as well as aiming to reduce the power loss. The main advantage of D-STATCOMs is that they operate with power from the grid and do not depend on external energy resources that can be highly variable during some periods of time (e.g., photovoltaic generation and wind generation) [7]. Thus, they reduce the impact of DERs on the electrical network in scenarios of low power generation. This does not happen with Distribution Static Compensators (D-STATCOMs) because they take their power from the grid and convert it from active to reactive power; afterwards, they supply this power to the grid at specific locations and at a different power level. As a result, they enhance the technical and economic conditions proposed by the operator or owner of the EDS. After describing the advantages of D-STATCOMs, the purpose of this study is to solve the problem of the optimal integration of D-STATCOMs into EDSs while reducing annual operating costs caused by the annual power loss and investment costs associated with D-STATCOMs.
In the literature, different authors have solved the problem studied here using commercial software and open source solution methodologies based on sequential programming. For example, ref. [8] addressed the problem of the optimal reconfiguration and allocation of distributed generators based on photovoltaic systems and D-STATCOMs in an EDS. For that purpose, they proposed a combination of a fuzzy multi-objective approach with three metaheuristic optimization algorithms: a genetic algorithm, a particle swarm optimization algorithm, and an ant colony optimization algorithm. They used three objective functions: voltage profile improvement, power loss reduction, and branch loadability reduction through a weighted mono-objective function. The problem with this solution methodology is that it excludes the variation in power generation (associated with PV systems) and power demand (associated with users). Consequently, its results cannot represent a real solution for the authors because the behavior of sunlight and the users varies significantly throughout the day. In addition, their paper does not present an analysis of the repeatability of and processing times required by the different hybrid methodologies they used. Another study [9] presented a solution to the problem of optimal location and sizing of D-STATCOMs in EDSs to reduce the power loss. In it, the power loss cost was analyzed with and without D-STATCOMs in electrical grids. As a result, the authors proposed an index vector method for radial distribution networks considering the reconfiguration of the network. They compared their results with those of optimization techniques reported in other studies and demonstrated the effectiveness of the proposed methodology. However, in that paper, they did not analyze the convergence or processing times of the solution methods. In [10], the authors solved the problem of the optimal integration of D-STATCOMs in electrical distribution systems by considering a techno-economic index as the objective function and by using the gravitational search algorithm as the solution algorithm. The results obtained in the 33-bus test systems demonstrate the effectiveness of the solution proposed but does not compare the results obtained with other works reported in the literature. Furthermore, they did not analyze the processing time required by the solution. By using the same test systems, the authors of [11] evaluated a solution methodology that used an improved version of bald eagle search optimization algorithms for solving the problem studied here and by using the reduction in power loss as the objective function. The results obtained showed superior computational characteristics than all compared works, by demonstrating that the integration of D-STATCOMs in the electrical grid caused significant loss reduction, voltage profile improvement, and voltage stability enhancement. However, in this paper, the processing times and repeatability of the solution used were not analyzed. Finally, in [12], a discrete-continuous version of the vortex search algorithm was proposed, which allowed a reduction in the complexity of the problem of optimal location and sizing of distributed energy resources in electrical distribution systems. The authors used two optimization solvers from GAMS (i.e., COUENNE and BONMIM) to make a comparison. The results they reported demonstrate the effectiveness of the proposed method, as well as its adequate convergence and solution quality in relation to the two GAMS solvers used for comparison. They implemented a mathematical model that uses a reduction in annual operating and investment costs as the objective function, including all the constraints associated with the operation of the EDSs in an environment of reactive compensation. However, they did not report the processing times required by the proposed solution or the methods used for comparison, and they did not evaluate the repeatability of the solution obtained with each method. Due to the complete mathematical model proposed in this work, it is used in this paper for representing the problem of the optimal integration of D-STATCOMs in electrical grids.
In the literature, multiple solution methodologies for evaluating the effect of D-STATCOMs on EDSs have been reported. They are mainly focused on the technical operation of these devices inside the electrical grid [13,14,15]. However, few studies have investigated methodologies associated with their optimal integration of D-STATCOMs in electrical grids by considering the economic impact of these devices under a scenario of variable power demand, which is currently a gap in the state of the art due to its representation of the real operation of electrical systems and the currents needs of electrical distribution companies. For generating a realistic scenario that can be applied in real EDSs, the mathematical formulation should include the effect of variations in power generation (related to renewable energy resources) and power demanded by users, as well as the economic impact related to the annual power loss and investment costs (such as the mathematical model reported in [12]). Furthermore, the works reported, in most cases, did not analyze the results obtained from the point of view of repeatability and processing times; these technical aspects are important for guaranteeing that the solution method will be able to obtain a solution of good quality with short processing times each time it is executed.
In view of these needs and different problems identified in the state of the art reviewed in this article, we used the mathematical formulation described in [12], whcih permits addressing the problem of the optimal integration of D-STATCOMs in electrical grids for reducing the annual power loss and investment costs. For solving this problem and finding the location and sizing of D-STATCOM that present the best results in economic terms, a master–slave strategy that combines a new Discrete-Continuous version of the PSO (DCPSO) in the master stage with an hourly power flow method based on Successive Approximations (HSA) in the slave stage is proposed. The master stage locates and alters the size of the D-STATCOMs in the EDS, and the slave stage evaluates the objective function and the constraints of each possible solution proposed by the master stage. The purpose of this DCPSO/HSA methodology is to solve the problem of optimal integration of D-STATCOMs in EDSs while reducing the annual operating costs associated with the power loss and the investment costs of the integration of D-STATCOMs. This study implemented two test systems (i.e., 33- and 69-bus) and four other methods to make a comparison and, thus, evaluate the effectiveness, robustness, and repeatability of the DCPSO/HSA: (1) COUNNE and (2) BONMIN from GAMS (General Algebraic Modeling System), which comprises commercial solver software; (3) a master–slave methodology that combines the genetic algorithm and particle swarm optimization (GA/PSO); (4) a Discrete-Continuous version of the Vortex Search Algorithm (DCVSA). The selection of these solution methodologies was based on their outstanding results reported in the literature and their wide implementation to solve the problem of the optimal integration of DERs into EDSs. Furthermore, all these solution methodologies used HSA as the evaluator of the objective function and the constraints thanks to its excellent results in terms of convergence and processing times reported in [16]. The results obtained in this study demonstrate the superiority of the DCPSO/HSA over the other four methods in terms of solution quality and processing times for EDSs of any size. Additionally, this study evaluated the standard deviation of all the solution methods, which showed good results in terms of repeatability. The main contributions of this paper are listed below:
- A new Discrete-Continuous Particle Swarm Optimization method (i.e., DCPSO) to solve problems with discrete and continuous variables;
- A new master–slave methodology (i.e., DCPSO/HSA) to solve the problem of optimal integration of D-STATCOMs into EDSs that reduces operating and investment costs;
- The best results reported in the literature (in terms of solution quality, repeatability, and processing times) in the solution to the problem of the optimal location and sizing of D-STATCOMs in EDSs.
As the main contributions to the mathematical sciences, this paper presents the following:
- A complete description of a mathematical model and codification that represents the problem of the optimal integration of D-STATCOMs in electrical networks for reducing the annual operating cost, which can then be used as basis for developing new mathematical solution methods;
- An efficient comparison method (DCPSO) for evaluating the performance of the new mathematical method developed in terms of quality solution, repeatability of the solution, and processing times.
Finally, from the point of view of applicability, this paper presents the following contributions:
- A methodology that allows the integration of electrical grid operators within their electrical networks reactive power by using a distributed static compensator that considers the reduction in energy purchasing and investment costs;
- A numerical validation of the positive effect for installing distributed static compensators in electrical grids in economical and technical terms;
- A fast and efficient methodology that allows the electrical grid’s operators to solve the problem of the optimal integration of D-STATCOMs in electrical networks, allowing the exploration of multiple load scenarios in short processing times, which is vital inside the public and private processes for obtaining contracts around the world due to the short time-period offers for carrying out this kind of process.
This paper is structured as follows. Section 2 presents the mathematical problem that represents the optimal integration of D-STATCOMs by considering operating and investment costs in a scenario of a variable power demand. Section 3 describes the solution methodology, including the DCPSO and the hourly power flow method used here to evaluate the objective function and its set of constraints. Section 4 details the test systems and considerations used to solve the problem addressed here. Section 5 reports the simulation results obtained by the proposed methodology and the other four methods used for comparison, as well as their respective analyses. Finally, Section 6 draws conclusions and proposes future studies.
2. Mathematical Formulation
The D-STATCOM’s devices allow injections inside the electrical system reactive power in a controlled manner realtive to the electrical network by obtaining different technical and economic benefits that are related to the objective function fixed by the operator of the electrical grid [17]. The benefits are more commonly related to the reduction in power loss, improvements in voltage profiles, chargeability of the branches, harmonic mitigation, power loss cost, energy purchasing cost, and investment costs, among others [18,19,20]. It is important to highlight that these benefits depend on the location and sizing of D-STACOMs within the electrical network, for which it is vital to propose a mathematical model that evaluates the effect of the integration of D-STATCOMs, allowing the identification of the location and nominal power of D-STATCOMs that present the best impact in terms of an objective function established by the grid operator [21]. This paper seeks to reduce the annual operating costs of distribution systems. For modelling this problem, in this paper, was used the non-linear, non-convex formulation reported in [12] to represent the problem of optimal location and sizing of D-STATCOMs in electrical distribution systems. The said formulation, presented in Equation (1), uses a weighted multi-objective function to reduce the annual operating cost of distribution systems by considering the annual power energy loss () and the investment costs associated with the purchase of D-STATCOMs ().
The equations that describe each objective function are presented and explained below.
Equation (2) describes the cost of the annual power loss and calculates the power loss for one day of operation () by taking into account the annual average active and reactive power demand of the electrical network and the parameters that represent the electrical system (see Equation (3)). Additionally, the total power loss obtained in this equation is multiplied by and T, which are the energy cost per kWh and a constant used to evaluate the implemented time horizon (1 year).
Equation (3) is used to calculate . In this equation, and represent the sets that contain all the periods of time used and the buses that compose the electrical network, respectively. and are the magnitude and angle of the nodal admittance matrix associated with buses i and j, respectively. and denote the voltages at nodes i and j, respectively, at hour h. In addition, variables and represent the voltage angle for the same buses in the same period of time. Finally, denotes the fraction of time that has passed when the data about power demand for one day of operation are obtained. In this study, those values change every 1/2 h.
The annual investment cost associated with the integration (location and sizing) of D-STATCOMs in electrical systems is described in Equation (4). In the latter, and are two constants used to annualize the operating cost and useful life. , , and are the constants that compose the mathematical model used to obtain the variable investment cost of the integration of the D-STATCOMs. This equation operates as a function of the reactive power assigned to each D-STATCOM located in the electrical network ().
This mathematical formulation considers all the technical constraints that represent electrical distribution systems in a D-STATCOM environment. The set of constraints used here is presented in Equations (5) to (10), which are explained below.
The nodal active and reactive power balance is guaranteed by Equations (5) and (6). In these equations, and represent the active and reactive power, respectively, generated at bus i in period h. and are the active and reactive power, respectively, demanded at the same bus and period. Note that, in these equations, is the reactive power injected by the D-STATCOM into bus i in period h. The voltage and current limits are established by Equations (7) and (8), where and are the minimum and maximum allowable bus voltage, respectively, and and are the current conducted through the branch and the maximum allowable level for such branch, respectively. The reactive power limits assigned to each D-STATCOM located at bus i are presented in Equation (9), which establishes the maximum () and minimum () limits for the injection of reactive power. Furthermore, in said equation, is a binary variable that takes a value of 1 when a D-STATCOM is located at a bus, and it is 0 when it is not located at the bus. Finally, Equation (10) limits the maximum number of D-STATCOMs that can be installed in the distribution system.
The parameters associated with the mathematical model previously described are found in Table 1 and described in [12,22].

Table 1.
Parameters used to evaluate the mathematical model.
3. Proposed Solution Methodology
This paper proposes a master–slave methodology that combines the DCPSO and the HSA to solve the problem of optimal integration of D-STATCOMs into EDSs while reducing the annual operating cost related to the power loss and investment costs. The next subsection explains the stages proposed in the DCPSO/HSA.
3.1. Discrete-Continuous Particle Swarm Optimization Method
Although the DCPSO uses the same steps as the traditional PSO [23] described in Algorithm 1, its main difference is the codification used to represent the problem. More precisely, the DCPSO uses a discrete-continuous codification to integrate the discrete and continuous variables that represent the problem of optimal location and sizing of D-STATCOMs in EDSs into a single vector. The proposed codification, presented in Figure 1, is composed of a vector of size 1 × 2. This vector is divided into two parts to generate information about the location and power established for each D-STATCOM to be installed in the EDS. The first half of the vector contains the buses where the D-STATCOMs will be located; the second half contains the power that will be injected by each one of them. Note that the first position in the first and second parts stores the information on the first D-STATCOM to be located; the second position stores information on the second D-STATCOM and so on. As an example, Figure 1 shows the codification used to locate and size three D-STATCOMs in an EDS. In this case, the first D-STATCOM is located at Bus 2, with a reactive power of 0.11 kVAR; the second one is installed at Bus 10, with a power of 1.18 kVAR; the third D-STATCOM is located at Bus 29, with a power of 2 kVAR. As observed, the location and sizing data established for each possible solution proposed by the DCPSO are included in the same codification, which eliminates the need for a binary optimization algorithm to solve the location problem, which is commonly used in the literature [24].
| Algorithm 1: Pseudo-code for the DCPSO algorithm |
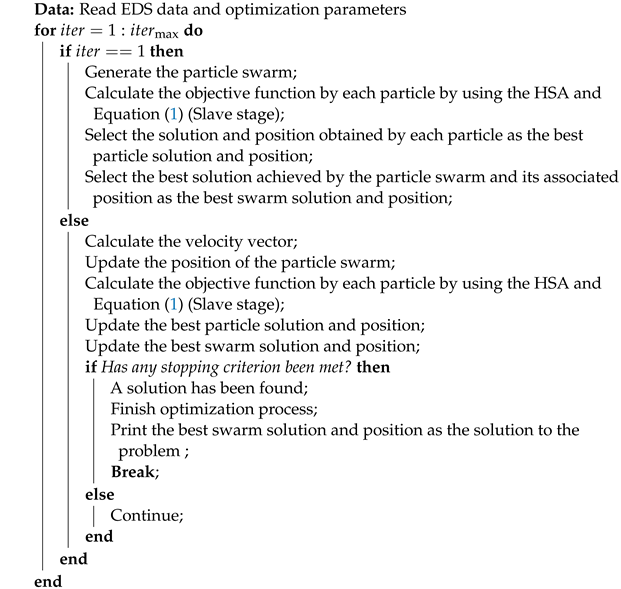 |
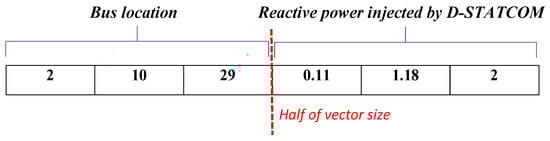
Figure 1.
Proposed Discrete-Continuous codification.
Algorithm 1 describes the iterative process of the DCPSO. As observed, it is similar to the classic PSO; however, the difference is the creation of particles that compose the swarm by using the codification proposed here. All the data related to the electrical system and the optimization algorithm parameters are read before starting with the iterative process of the DCPSO. Then, the process starts, and the particle swarm is generated at the first iteration. Note that, since the classic PSO algorithm was developed for continuous variables, in the DCPSO, it is necessary to approximate each value fixed for the location of D-STATCOMs in the EDS to the next discrete number, always satisfying the maximum number of buses in the EDSs. The values assigned by each particle as power to be injected by the D-STATCOMs should only satisfy the maximum reactive power value allowed for them inside the EDSs.
The effect of the D-STATCOMs in the EDS is evaluated after generating the particle swarm algorithm. The hourly power flow operates by considering the D-STATCOMs’ information contained in each particle, the power generation associated with the photovoltaic systems, and the power demanded by the users using the HSA (slave stage). This evaluation provides the values of the objective function and constraints associated with the reactive power values injected. Since we are in the first iteration of the DCPSO, the value of each objective function obtained for the different particles is fixed as the best particle solution, and their positions are stored as the best particle position. In this case, the particle with the lowest objective function value is assigned as the incumbent (best swarm solution).
From the second iteration onwards, the velocity vector is calculated at each iteration. This and the current information of each particle are used to update the position of the particle swarm. Subsequently, the HSA runs for each particle, and the best particle solution and position are updated with the objective function values obtained, as well as the best swarm solution and position. Finally, the stopping criterion of the maximum number of iterations () is analyzed. If this value is achieved, the iterative process is completed, and the algorithm is printed; as a result, the best swarm solution and position are obtained until the current iteration. Otherwise, a new particle swarm is generated and the iterative process continues.
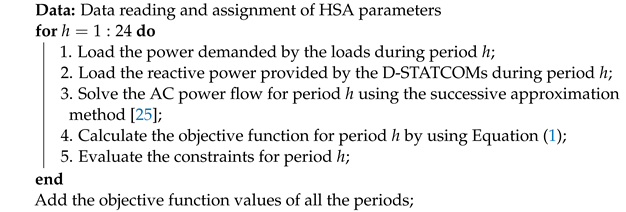
3.2. Hourly Power Flow Method Based on Successive Approximations
This study implemented the HSA proposed in [16]. The latter employs an iterative power flow method based on successive approximations, updating the data about power demand and distributed generation at each iteration until it analyzes the fixed period of time. The hourly power flow method proposed in [16] includes updating the reactive power injected by the D-STATCOMs at each iteration. This allows the calculation of the hourly power loss of an electrical system during an operation day and evaluates all the constraints this system represents in a distributed energy environment (i.e., distributed generators + D-STATCOMs). Equation (1) is calculated with the value of power loss for one day of operation, the sizing of the D-STATCOMs integrated into the grid, and the guarantee that all constraints were satisfied. In the particular case that some constraints are not satisfied, the objective function is penalized by adding a large value (10,000 in this case), with the aim that this solution will not be considered as a solution to the problem; this value is obtained through trial and error. Thus, the annual operating cost for a particular location and the sizing of D-STATCOMs in the EDS (recommended by the DCPSO) are evaluated. The steps required to run the HSA are described in Algorithm 2.
| Algorithm 2: Slave stage algorithm: HSA |
 |
The successive approximation method and the HSA used here can be found in [16,25].
4. Test Systems, Methods Used for Comparison, and Considerations
This section presents the test systems, parameters, scenarios, and considerations used here for evaluating the effectiveness, robustness, and repeatability of the proposed DCPSO/HSA.
4.1. 33-Bus Test System
Figure 2a illustrates the electrical diagram of the 33-bus test system, which is composed of 33 buses, 32 branches, and 1 slack generator. The parameters of this test system are described in [26], where voltage values of 12.66 kV and 100 kVA were used as the base values. In order to establish the maximum operating current of this electrical system, a power flow with the maximum power demand reported in Figure 3 was run, obtaining a maximum current of 380 A. A 400 kcmil conductor was selected for all the branch segments of the network. Furthermore, the voltage limits for this system were set at 10% of the fixed nominal voltage.
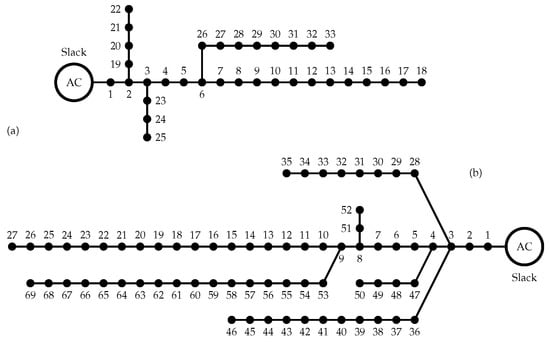
Figure 2.
Electrical diagram of (a) the 33-bus test system and (b) the 69-bus test system [12].
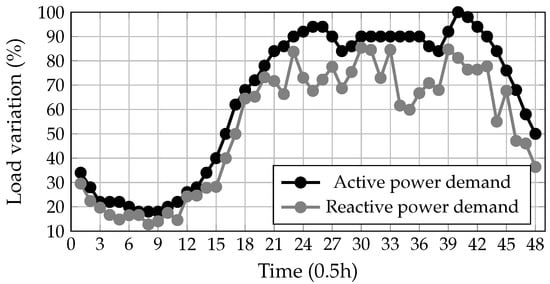
Figure 3.
Active and reactive power demand in a Colombian EDS [12].
4.2. 69-Bus Test System
Figure 3b presents the electrical diagram of the 69-bus test system. This electrical network contains 33 buses, 32 branches, and 1 slack generator. The parameters of this test system are described in [23], where voltages of 12.66 kV and 100 kVA were used as base values. It also presents a maximum current of 380 A when a power flow is run with the maximum power data reported in Figure 3 and a 400 kcmil conductor for all the branch segments in the electrical grid. As in the 33-bus test system, the voltage limits assigned in this system were set at 10% of the fixed nominal voltage.
Considering the hourly variation of active and reactive power consumption, Figure 4 presents the consumption data of an EDS in intervals of 0.5 h. This figure shows the power demand behavior of a Colombian EDS [12]. These data were used for both test systems, resulting in annual operating costs of 112.74 USD × and 119.70 USD × in the 33- and 69-bus test systems, respectively. These costs are associated with the power loss over a year of operation.
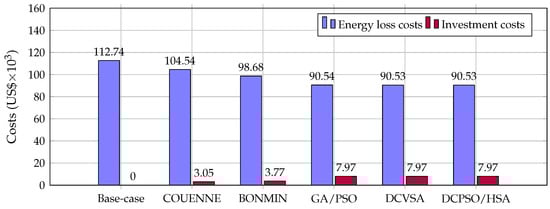
Figure 4.
Comparison of operating and investment costs in the 33-bus system.
4.3. Methods Used for Comparison and Parameters
In this study, two solver methods of GAMS (i.e., BONMIN and COUENNE), which is commercial software, were used for comparison [12]. In addition, two optimization methods based on sequential programming were also implemented: a discrete version of the vortex search algorithm (DCVSA) [12] and the GA/PSO proposed in [26]. The latter was selected since it is the most commonly used methodology for the optimal integration of distributed energy resources in the specialized literature. The optimization parameters of BONMIN, COUENNE, and the DCPSO were also taken from the literature. The parameters of the GA/PSO and DCPSO/HSA were tuning by using a PSO algorithm, thus obtaining the optimization parameters reported in Table 2. The selection and implementation of the PSO for proposing a discrete-continuous version is associated with the excellent results that present this algorithm for solving electrical problems as the optimal power flow and optimal location of distributed energy resources, among others [27,28,29]. Furthermore, in this paper, the hybrid methodology GA/PSO was used as a comparison method for the same reason; this solution methodology is highly used in the specialized literature for solving electrical planning problems and presents excellent results in terms of quality solution, repeatability, and processing times [30,31,32]. For obtaining the descriptions and mains steps that compose the comparison methods used, please refer to the documents cited previously.
Table 2.
Parameters of the proposed master–slave methodology.
5. Simulation Results
Table 3 and Table 4 show the simulation results obtained for the optimal integration of D-STATCOMs in the 33- and 69-bus test systems, respectively. These tables detail, from left to right, the solution methodology used, the bus location and power assigned to each D-STATCOM, the annual operating cost and the reduction percentage obtained by each methodology, the processing time required for solving the problem discussed here, the standard deviation (STD) percentage obtained after 1000 executions, and the worst voltage profile and current obtained when the hourly power flow is executed considering the integration of D-STATCOMs. The analysis of the results for the 33- and 69-bus test systems is presented below.
Table 3.
Simulation results obtained by different methodologies in the 33-bus test system.
Table 4.
Simulation results obtained by different methodologies in the 69-bus test system.
5.1. 33-Bus Test System
The simulation results of the optimal integration of D-STATCOMs into the 33-bus test system are presented in Table 3. A total reduction of 12.63% obtained by DCPSO/HSA with respect to the base case (without D-STATCOMs integrated in the EDS) was calculated by analyzing the results in terms of . By comparing these results with those of the other solution methodologies, we can see that the proposed solution achieved the same impact in terms of annual operating cost as the DCVSA/HSA, while the GA/PSO produced a 12.62% reduction. The worst results in terms of reduction were obtained by the BONMIN and COUENNE solvers: 9.13% and 4.56%, respectively. These results indicate that DCPSO/HSA produced a significant improvement of 63.89%, 27.71%, and 0.07% compared to COUENNE, BONMIN, and GA/PSO, respectively.
It is important to remember that is composed of the annual power loss and the investment costs related to the D-STATCOMs. Figure 2 presents the operating and investment costs obtained by each solution methodology.
Note that the lowest annual power loss energy costs were obtained by the proposed solution methodology and the DCVSA, outperforming the reduction achieved by COUENNE, BONMIN, and GA/PSO by 13.40%, 8.26%, and 0.014%, respectively. The COUENNE and BONMIN solvers obtained a reduction in investment costs of 161.36% and 111.56%, respectively, because they decided to install D-STATCOMs with lower power values than DCPSO/HSA. These lower investments generated a smaller impact on power loss costs, which affected the annual operating costs calculated by these solvers. The GA/PSO solution method obtained an increase of 0.004% in investment costs with respect to DCPSO/HSA. Therefore, the DCPSO/HA methodology achieved a lower cost of power loss with a smaller investment in D-STATCOMs. Finally, the annual power loss and investment costs of the DCVSA and the DCPSO/HSA are the same in the 33-bus test system.
The proposed methodology needed a longer processing time than the commercial solvers, i.e., COUENNE and BONMIN; it required 6.6 s and 2.03 s more, respectively. However, the solution quality obtained by these solvers is low compared to that of the DCPSO/HSA; therefore, their shorter processing times are not important. In addition, the DCPSO/HSA required a considerably shorter processing time than the GA/PSO and the DCVSA, that is, 99% and 61% shorter, respectively. These results demonstrate that, in the 33-bus test system, the proposed methodology achieved the best trade-off between solution quality and processing time.
All the solution methodologies discussed here are considered adequate since all their STDs, after 1000 executions, were lower than 0.25%. These values demonstrate the high repeatability of the best solution achieved by the solution methods each time they were executed. Finally, regarding voltage and current limits, all the solution methods satisfied the maximum allowable levels (see columns 6 and 7 in Table 3).
5.2. 69-Bus Test System
The results achieved by each solution methodology in the 69-bus test system are reported in Table 4. The results of COUENNE and BONMIN are not presented because these solvers failed to solve the mathematical formulation for the 69-bus test system. This proves the high effectiveness of the solution methods based on the sequential programming used here.
The annual operating costs of the 69-bus test system obtained by all the solution methods are similar to those calculated for the 33-bus test system. The best results were achieved by the DCPSO/HSA and the DCVSA. These two methods produced a 12.63% reduction in with respect to the base case and achieved a 0.079% reduction compared to the GA/PSO. The annual power loss and investment costs obtained by each method are presented in Figure 5. This Figure shows that both methods (i.e., the DCPSO/HSA and the DCVSA) obtained a reduction of 0.079% and 4 × 10 in relation to the annual power loss energy and investment costs achieved by GA/PSO, respectively. Therefore, with a similar investment cost, the proposed methodology improved the reduction in power loss costs obtained for the 69-bus test system.
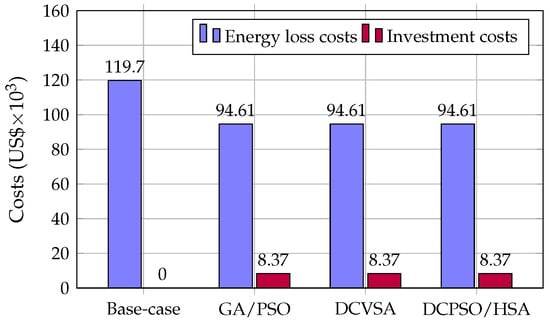
Figure 5.
Comparison of operating and investment costs in the 69-bus system.
The proposed methodology (i.e., DCPSO/HSA) improved the processing times required for solving the problem of optimal integration of D-STATCOMs into DESs. The said methodology achieved a reduction in processing times of 99.15% and 73.18% compared to the GA/PSO and the DCVSA, respectively. This confirms that the DCPSO/HSA offers the best trade-off between solution quality and processing times. Furthermore, the STD values obtained by the solution methods are lower than 0.15%. Every time the solution methods were executed for the 69-bus test system, all the solutions obtained were close to the best one. Finally, columns 6 and 7 in Table 4 confirm that all the solution methods respected the voltage and current limits fixed for the 69-bus test system.
6. Conclusions and Future Work
This paper proposed a new optimization methodology (i.e., DCPSO/HSA) for solving the problem of optimal integration of D-STATCOMs into EDSs to reduce the annual power loss and investment costs. Said methodology was compared with four other methodologies that have been implemented in the literature to solve the problem discussed here. These five methodologies were evaluated in the 33- and 69-bus test systems.
The results show that all the solution methodologies reduced investment costs and annual power loss, with additional economical and technical benefits for EDS operators. Furthermore, the worst voltage and current in the 24 h operation scenario presented in Table 3 and Table 4 indicate that the integration of the D-STATCOMs into the EDS improves voltage profiles and reduces the current in the branches, thus improving the loadability of the EDS.
The results were similar in both test systems; that is, the DCPSO/HSA and DCVSA took the first place in terms of the reduction in annual operating costs, with better results than the COUENNE and BONMIN solvers in terms of solution quality. The GA/PSO required a lower investment level to obtain a lower annual power loss cost in both test systems. In terms of solution quality, the DCPSO/HSA and DCVSA produced the same results; however, in terms of processing times, the DCPSO/HSA was the fastest compared to the other sequential programming methods (i.e., the DCVSA and the GA/PSO). The COUENNE and BONMIN solvers were faster than the DCPSO/HSA, but they achieved negative results in terms of solution quality (reduction in annual operating costs). Hence, this advantage was not considered by the authors. Finally, all the solution methods studied here presented standard deviation values lower than 0.2%; therefore, all of them are considered adequate in terms of repeatability.
Based on the results obtained in the 33- and 69-bus test systems and the comparison above with other methods reported in the specialized literature, it can be concluded that the proposed methodology (i.e., the DCPSO/HSA) is the most efficient solution method for solving the problem of the optimal integration of D-STATCOMs into EDSs because it presents the best trade-off between reductions in annual operating costs (annual power cost + investment cost) and processing times required for electrical systems of any size.
One of disadvantages of this work is related to the lack of inclusion of renewable energies and energy storage systems. However, the main objective of this study was to evaluate the effect of distributed reactive energy in the electrical grid, which was reached. Based on what was last mentioned, future studies can investigate the integration of distributed generators and batteries with D-STATCOMs into EDSs in order to include renewable sources and the management of electrical resources EDSs. For that purpose, the mathematical component proposed in this paper should be reformulated, and the solution methodology should be adapted. Other disadvantages of the proposed methodology are associated with the longer processing times required for solving the problem studied here in comparison with the commercial software, such as COUENNE and BONMIN of GAMS. This problem can be addressed by using parallel processing tools to evaluate the objective function and the constraints of each individual in the population of DCPSO, which allow a reduction in the required processing times. This reduction in processing time can be used for improving the exploration performed by the algorithm or to analyze large EDSs during shorter processing times. Finally, for solving the problem of the optimal integration of D-STATCOMs in distribution systems, new Discrete-Continuous methodologies that consider the quality solution, processing times, and repeatability of the solution in the analysis of the results can be proposed. Furthermore, the mathematical model can include objective functions related to the technical and environmental aspects, such as the reduction in power loss, improvement in the voltages profiles, reduction in the chargeability of the electrical system, and reduction in emissions.
Author Contributions
Conceptualization; methodology; software; and writing, revising, and editing the manuscript: L.F.G.-N., O.D.M., J.C.H., C.A.R.-P. and A.-J.P.-M. All authors have read and agreed to the published version of the manuscript.
Funding
This research was supported by Minciencias, Universidad Nacional de Colombia, Universidad del Valle, and Instituto Tecnológico Metropolitano under the research project “Dimensionamiento, planeación y control de sistemas eléctricos basados en fuentes renovables no convencionales, sistemas de almacenamiento y pilas de combustible para incrementar el acceso y la seguridad energética de poblaciones colombianas”, (Minciencias code 70386), which belongs to the research program “Estrategias para el desarrollo de sistemas energéticos sostenibles, confiables, eficientes y accesibles para el futuro de Colombia”, (Minciencias code 1150-852-70378, Hermes code 46771).
Institutional Review Board Statement
Not applicable.
Informed Consent Statement
Not applicable.
Data Availability Statement
The data used in this study is available in the figures and tables of the manuscript.
Conflicts of Interest
The authors declare no conflict of interest.
Abbreviations
| DCPSO | Discrete-continuous particle Swarm optimization algorithm. |
| D-STATCOMs | Distribution static compensators. |
| EDS | Electrical Distribution Systems. |
| HSA | Hourly power flow Method based on successive approximations. |
| GAMS | General algebraic modeling system. |
| BONMIN | Solver of GAMS. |
| COUNNE | Solver of GAMS. |
| GA | Genetic algorithm. |
| PSO | Particle swarm optimization algorithm. |
| DCVSA | Discrete-continuous version of the Vortex Search Algorithm. |
| Constant of quadratic term of investment cost of the integration of the D-STATCOMs. | |
| Constant of lineal term of investment cost of the integration of the D-STATCOMs. | |
| Fraction of time that has passed when the data about power demand for one day of operation are obtained. | |
| Voltages angle at nodes i at hour h. | |
| Voltages angle at nodes j at hour h. | |
| Constant of investment cost of the integration of the D-STATCOMs. | |
| Set that contains all the periods of time used. | |
| Sets that contains he buses that compose the electrical network. | |
| Angle of the nodal admittance matrix associated with buses i and j. | |
| Weighted multi-objective function to reduce the annual operating cost. | |
| Constant used to annualize the operating cost. | |
| Constant used to annualize the useful life. | |
| Variable that limit the maximum number of D-STATCOMs that can be installed in the distribution syste. | |
| Active power generation consumed at node j in period of time h. | |
| Active power generation injected at node i in period of time h. | |
| Reactive power generation consumed at node i in period of time h. | |
| Reactive power generation injected at node i in period of time h. | |
| Reactive power assigned to each D-STATCOM located in the electrical network. | |
| Maximum limit for the injection of reactive power by D-STATCOMs. | |
| Minimum limit for the injection of reactive power by D-STATCOMs. | |
| T | Constant used to evaluate the implemented time horizon. |
| Voltages at nodes i at hour h. | |
| Voltages at nodes j at hour h. | |
| Maximum bus voltage allowable in the electrical system. | |
| Minimum bus voltage allowable in the electrical system. | |
| Magnitude of the nodal admittance matrix associated with buses i and j. | |
| Energy cost per kWh. | |
| Cost of the annual power loss. | |
| Annual investment cost associated with the integration of D-STATCOMs. | |
| Binary variable that takes a value of 1 when a D-STATCOM is located at a bus, and 0 when it is not. |
References
- Kirkerud, J.; Nagel, N.O.; Bolkesjø, T. The role of demand response in the future renewable northern European energy system. Energy 2021, 235, 121336. [Google Scholar] [CrossRef]
- Akorede, M.F.; Hizam, H.; Pouresmaeil, E. Distributed energy resources and benefits to the environment. Renew. Sustain. Energy Rev. 2010, 14, 724–734. [Google Scholar] [CrossRef]
- López González, D.M.; Garcia Rendon, J. Opportunities and challenges of mainstreaming distributed energy resources towards the transition to more efficient and resilient energy markets. Renew. Sustain. Energy Rev. 2022, 157, 112018. [Google Scholar] [CrossRef]
- Copp, D.A.; Nguyen, T.A.; Byrne, R.H.; Chalamala, B.R. Optimal sizing of distributed energy resources for planning 100% renewable electric power systems. Energy 2022, 239, 122436. [Google Scholar] [CrossRef]
- Grisales-Noreña, L.F.; Montoya, O.D.; Hincapié-Isaza, R.A.; Echeverri, M.G.; Perea-Moreno, A.J. Optimal location and sizing of DGs in DC networks using a hybrid methodology based on the PPBIL algorithm and the VSA. Mathematics 2021, 9, 1913. [Google Scholar] [CrossRef]
- Sirjani, R.; Jordehi, A.R. Optimal placement and sizing of distribution static compensator (D-STATCOM) in electric distribution networks: A review. Renew. Sustain. Energy Rev. 2017, 77, 688–694. [Google Scholar] [CrossRef]
- Siddiqui, A.S.; Sarwar, M.; Althobaiti, A.; Ghoneim, S.S. Optimal Location and Sizing of Distributed Generators in Power System Network with Power Quality Enhancement Using Fuzzy Logic Controlled D-STATCOM. Sustainability 2022, 14, 3305. [Google Scholar]
- Tolabi, H.B.; Ali, M.H.; Rizwan, M. Simultaneous reconfiguration, optimal placement of DSTATCOM, and photovoltaic array in a distribution system based on fuzzy-ACO approach. IEEE Trans. Sustain. Energy 2014, 6, 210–218. [Google Scholar] [CrossRef]
- Gupta, A.R.; Kumar, A. Energy saving using D-STATCOM placement in radial distribution system under reconfigured network. Energy Procedia 2016, 90, 124–136. [Google Scholar] [CrossRef]
- Salkuti, S.R. An efficient allocation of D-STATCOM and DG with network reconfiguration in distribution networks. Int. J. Adv. Technol. Eng. Explor. 2022, 9, 299. [Google Scholar]
- Rani, K.R.; Rani, P.S.; Chaitanya, N.; Janamala, V. Improved Bald Eagle Search for Optimal Allocation of D-STATCOM in Modern Electrical Distribution Networks with Emerging Loads. J. Intell. Eng. Syst. 2021, 15, 554–563. [Google Scholar]
- Montoya, O.D.; Gil-González, W.; Hernández, J.C. Efficient Operative Cost Reduction in Distribution Grids Considering the Optimal Placement and Sizing of D-STATCOMs Using a Discrete-Continuous VSA. Appl. Sci. 2021, 11, 2175. [Google Scholar] [CrossRef]
- Choudhury, S.; Bhowmik, P.; Rout, P.K. Economic load sharing in a D-STATCOM integrated islanded microgrid based on fuzzy logic and seeker optimization approach. Sustain. Cities Soc. 2018, 37, 57–69. [Google Scholar] [CrossRef]
- Mehouachi, I.; Abbes, M.; Chebbi, S. Design of a high power D-STATCOM based on the isolated dual-converter topology. Int. J. Electr. Power Energy Syst. 2019, 106, 401–410. [Google Scholar] [CrossRef]
- Roy, N.K.; Hossain, M.J.; Pota, H.R. Voltage profile improvement for distributed wind generation using D-STATCOM. In Proceedings of the IEEE Power and Energy Society General Meeting, Detroit, MI, USA, 24–29 July 2011; pp. 1–6. [Google Scholar] [CrossRef]
- Grisales-Noreña, L.F.; Montoya, O.D.; Ramos-Paja, C.A. An energy management system for optimal operation of BSS in DC distributed generation environments based on a parallel PSO algorithm. J. Energy Storage 2020, 29, 101488. [Google Scholar] [CrossRef]
- Khaleel, M.M.; Adzman, M.R.; Zali, S.M. An Integrated of Hydrogen Fuel Cell to Distribution Network System: Challenging and Opportunity for D-STATCOM. Energies 2021, 14, 7073. [Google Scholar] [CrossRef]
- Rohouma, W.; Metry, M.; Balog, R.S.; Peerzada, A.A.; Begovic, M.M.; Zhou, D. Analysis of the Capacitor-Less D-STATCOM for Voltage Profile Improvement in Distribution Network with High PV Penetration. IEEE Open J. Power Electron. 2022, 3, 255–270. [Google Scholar] [CrossRef]
- Chakraborty, S.; Mukhopadhyay, S.; Biswas, S.K. Coordination of D-STATCOM & SVC for Dynamic VAR Compensation and Voltage Stabilization of an AC Grid Interconnected to a DC Microgrid. IEEE Trans. Ind. Appl. 2021, 58, 634–644. [Google Scholar]
- Rohouma, W.; Balog, R.S.; Peerzada, A.A.; Begovic, M.M. D-STATCOM for harmonic mitigation in low voltage distribution network with high penetration of nonlinear loads. Renew. Energy 2020, 145, 1449–1464. [Google Scholar] [CrossRef]
- Castiblanco-Pérez, C.M.; Toro-Rodríguez, D.E.; Montoya, O.D.; Giral-Ramírez, D.A. Optimal Placement and sizing of D-STATCOM in radial and meshed distribution networks using a discrete-continuous version of the genetic algorithm. Electronics 2021, 10, 1452. [Google Scholar] [CrossRef]
- Montoya, O.D.; Alvarado-Barrios, L.; Hernández, J.C. An Approximate Mixed-Integer Convex Model to Reduce Annual Operating Costs in Radial Distribution Networks Using STATCOMs. Electronics 2021, 10, 3102. [Google Scholar] [CrossRef]
- Grisales-Noreña, L.F.; Gonzalez Montoya, D.; Ramos-Paja, C.A. Optimal sizing and location of distributed generators based on PBIL and PSO techniques. Energies 2018, 11, 1018. [Google Scholar] [CrossRef] [Green Version]
- Montoya, O.D.; Fuentes, J.E.; Moya, F.D.; Barrios, J.Á.; Chamorro, H.R. Reduction of Annual Operational Costs in Power Systems through the Optimal Siting and Sizing of STATCOMs. Appl. Sci. 2021, 11, 4634. [Google Scholar] [CrossRef]
- Montoya, O.D.; Garrido, V.M.; Gil-González, W.; Grisales-Noreña, L.F. Power flow analysis in DC grids: Two alternative numerical methods. IEEE Trans. Circuits Syst. II Express Briefs 2019, 66, 1865–1869. [Google Scholar] [CrossRef]
- Moradi, M.H.; Abedini, M. A combination of genetic algorithm and particle swarm optimization for optimal DG location and sizing in distribution systems. Int. J. Electr. Power Energy Syst. 2012, 34, 66–74. [Google Scholar] [CrossRef]
- Gomez-Gonzalez, M.; López, A.; Jurado, F. Optimization of distributed generation systems using a new discrete PSO and OPF. Electr. Power Syst. Res. 2012, 84, 174–180. [Google Scholar] [CrossRef]
- Soroudi, A.; Afrasiab, M. Binary PSO-based dynamic multi-objective model for distributed generation planning under uncertainty. IET Renew. Power Gener. 2012, 6, 67–78. [Google Scholar] [CrossRef] [Green Version]
- Diaz-Acevedo, J.A.; Escobar, A.; Grisales-Norena, L.F. Optimization of corona ring for 230 kV polymeric insulator based on finite element method and PSO algorithm. Electr. Power Syst. Res. 2021, 201, 107521. [Google Scholar] [CrossRef]
- Mozafar, M.R.; Moradi, M.H.; Amini, M.H. A simultaneous approach for optimal allocation of renewable energy sources and electric vehicle charging stations in smart grids based on improved GA-PSO algorithm. Sustain. Cities Soc. 2017, 32, 627–637. [Google Scholar] [CrossRef]
- Jafari, A.; Ganjehlou, H.G.; Khalili, T.; Mohammadi-Ivatloo, B.; Bidram, A.; Siano, P. A two-loop hybrid method for optimal placement and scheduling of switched capacitors in distribution networks. IEEE Access 2020, 8, 38892–38906. [Google Scholar] [CrossRef]
- Grisales, L.F.; Grajales, A.; Montoya, O.D.; Hincapie, R.A.; Granada, M.; Castro, C.A. Optimal location, sizing and operation of energy storage in distribution systems using multi-objective approach. IEEE Lat. Am. Trans. 2017, 15, 1084–1090. [Google Scholar] [CrossRef]
Publisher’s Note: MDPI stays neutral with regard to jurisdictional claims in published maps and institutional affiliations. |
© 2022 by the authors. Licensee MDPI, Basel, Switzerland. This article is an open access article distributed under the terms and conditions of the Creative Commons Attribution (CC BY) license (https://creativecommons.org/licenses/by/4.0/).