1. Introduction
Urban function is the foundation to ensure a city running normally. Urban functions consist of the ones of the social, economic, cultural, and political aspects of a city [
1]. The structure of the urban functions in a megacity is very complicated. Especially in China, some megacities, such as Shenzhen and Shanghai, are put on complete lockdown when the corona virus disease (COVID-19) outbreaks, which makes great changes in the urban functions. Due to the influences of COVID-19 on the world, it is very important to study the urban functions of a megacity under the lockdown of COVID-19. The complex network is an effective approach to analyze the changes and renewal of the urban functions of a city [
2].
From the previous studies, which are discussed in
Section 2 ‘Literature review’ in detail, the spatial distribution and mixing degree of urban functions have been paid more attention, and the complex network is used to study urban traffic and transportation, urban road and industry structure. There are few studies on the complex network of urban function, and no literature has been published for the urban functions and the corresponding complex network under COVID-19.
The emergence and development of COVID-19 has a major impact on the world economy and society [
3], and it has a significant and substantial influence on many industries [
4]. The lifestyle of people is directly affected by COVID-19, so that the urban functions have changed as a result. The lockdown and control of high and medium risk areas, the closure of some cinemas and restaurants, the rapid development of COVID-19 testing and vaccine-related industries, and the adjustment of producer services have all contributed to the change and renewal of urban functions. Thus, it is necessary to investigate the urban functions under the lockdown of COVID-19 and compare the differences of the urban functions before and under the lockdown of COVID-19.
There are many measures, such as vaccine development and management, social alienation measures, etc., to curb the spread of COVID-19. Strict restrictions, such as lockdown, remain the basic tools among these measures [
5]. Countries around the world, such as Italy, Australia, Spain, France, etc., implemented the lockdown measures to control the pandemic at the beginning of the outbreak of COVID-19 [
5,
6,
7]. The lockdown can alleviate the pandemic, but it is unfavorable for industry and economic development [
3,
8,
9]. It also has an impact on the development of urban functions. For example, in 2021, Italy carried out different risk controls for red, orange and yellow regions, gymnasiums, theatres and cinemas were closed, and a curfew was imposed after 22:00.
Shenzhen is a megacity of China with 2.77 trillion CNY of gross domestic product (GDP) and 17.63 million residents [
10]. The lockdown for a week was implemented from March 14, 2022, in Shenzhen due to COVID-19 pandemic, which makes Shenzhen to be the third city implemented the lockdown in China following Wuhan and Xi’an. Social order and people’s lives were greatly affected by this lockdown. Under the lockdown, the change and renewal of urban functions are directly related to the supply and deployment of necessary materials for people’s life.
The lockdown in Shenzhen involved three aspects as follows.
- (1)
The staff of government departments and institutions work at home
Except the staff who undertake pandemic prevention tasks, all staff in government departments and institutions at all levels in the city should work at home or turn into community volunteers.
- (2)
The enterprises which are not for living guarantee stop operation and the staff work at home
Except for the public service enterprises, such as water, electricity, oil, gas, communication, sanitation, grain, edible oil, meat and vegetable supply, for citizens’ life and the basic operation of the city, all other enterprises should work at home and suspend production and business activities. The supermarkets, farmers’ markets, pharmacies, medical institutions and catering enterprises only providing express delivery services are open to ensure the basic needs of citizens, but other business places and stores are closed.
- (3)
Public transport is suspended
In addition to ensuring the city operation and the transportation of goods for Hong Kong, buses and subways should be suspended.
In this paper, considering the lockdown of COVID-19 in Shenzhen of China, the complex network of the urban functions is studied. The location quotient is used to obtain the dominant urban functions of the districts in Shenzhen before and under the lockdown of COVID-19. The interdependencies between the urban functions are proposed to obtain the complex networks of urban functions and their clusters. From the complex networks, the relationships between the urban functions, and the overall and cluster characteristics of the urban functions before and under the lockdown of COVID-19 are analyzed. The mean degree and mean weighted degree of the primary categories of the urban functions are obtained to discuss the classification characteristics of the urban functions before and under the lockdown of COVID-19. Then, the differences and changes of the urban functions before and under the lockdown of COVID-19 are compared, and the corresponding policy implications under the lockdown of COVID-19 are presented.
The contributions of this study are that: (1) The complex networks of urban functions and their clusters are presented; (2) Based on the complex network, the urban functions before and under the lockdown of COVID-19 are explored; (3) The interdependencies between the urban functions before and under the lockdown of COVID-19 are investigated; (4) The relationships between the urban functions, and the overall, classification and cluster characteristics of the urban functions before and under the lockdown of COVID-19 are discussed; (5) The differences and changes of the urban functions before and under the lockdown of COVID-19 are compared and analyzed.
2. Literature Review
The literature review includes spatial distribution of urban functions, mixing degree of urban functions, lockdown of the pandemic, and the complex network related to cities.
For the research on spatial distribution of urban functions, Chen et al., used the location quotient, clustering analysis and principal component analysis method to investigate the functions of urban economy and industry from the urban size, industrial gradient difference and leading industry, identify the urban function of the cities in Northern Xinjiang in China, and point out the shortages of similar urban functions [
11]. Myint used cross K function and network cross K function to explore the spatial distribution, spatial pattern and relationship of the socio-economic, cultural and political sectors of the internal structure and activities of the urban system [
1]. Tian et al., analyzed the spatial pattern of Beijing through the urban functions and identified five concentric zones in this city [
12]. Crooks et al., studied the evolutionary nature of urban form and function based on social media, track and traffic data by using comprehensive open-source data analysis [
13]. Mozuriunaite analyzed the key factors of urban function transformation in Lithuania according to new technology, economy, globalization, lifestyle and other factors, explored the technological factors affecting the urban function mutation, and proposed a method to determine the urban function transformation [
14]. Zhou et al., used topographic maps and urban land use maps from 2003, 2007, 2010 and 2013 to analyze the spatial pattern of the urban functions in four cities in Changchun of China, explained the spatial pattern of urban functions by using urban land development and redevelopment, and identified three concentric zones based on the evolution of urban functions [
15]. Tao et al., presented a probabilistic factor model to explore high-order interactive population flows and their impact on urban structural change, and identified the urban function and connectivity strength of each region [
16]. Zhen et al., considered economic, information, transportation, and financial flows between cities, and measured the combined situation of cities in Hebei Province of China [
17]. Zhou et al., analyzed the relationship between urban land development and redevelopment using urban land use maps and superposition analysis, and transfer matrix is applied to measure the enhancement and degradation of urban functions and their spatial differences [
18]. Chai et al., analyzed urban function differences among the cities in the Yangtze River economic belt, and explored their impacts on land prices from 2009 to 2016 based on two-stage least-squares regression and fixed effects model [
19]. Stanković et al., investigated the major urban functions of 39 global cities and their influences on city size [
20]. The results show that urban functions related to cultural interaction and accessibility have a positive impact on global urban population size, while functions of research and development have a negative impact on it. Sun et al., described the main functions of a region in terms of human activity-based function vectors by designing a method using Sina Weibo which can provide location information [
21].
As regards the mixing degree of urban functions, Chen et al., proposed a co-location method to analyze the commonness and uniqueness of urban activities and spatial organization of urban functions in 25 major cities in China. The results show that urban functions in most cities are spatially mixed [
22]. Yuan et al., proposed a spatial information entropy model to investigate the mixing degree of different spatial urban functions in Xi’an of China, and analyzed the spatial distribution and evolution characteristics of residents’ taxi travel demands using the kernel density estimation method. Based on the geographical weighted regression model, the temporal and spatial effects of the degree of functional mixing within a city on the demand for taxi travel are discussed [
23].
Social distancing measures, including strict restrictions such as lockdown, play important roles in containing the spread of COVID-19, and the strategies of short-term lockdown can increase the collective gain [
5]. Yang et al., analyzed the impact of the spread of COVID-19 on economic recovery from the perspectives of time, industry and region of Hubei province in China using the generalized moment method, and discussed the influence of urbanization on the urban economy [
4]. The results show that tourism and catering industry are influenced more greatly than audio-visual and digital entertainment, and the service functions and the development of facilities should be improved. Yang explored the causal relationship between the incidence of COVID-19 disease and the incidence of new COVID-19 cases in Wuhan of China using panel data from 279 cities [
24]. The result shows that lockdown can be an effective short-term tool to contain and slow the spread of the virus. Shimul et al., compared the predictions of COVID-19 cases in the Kingdom of Saudi Arabia using the data before and after the lockdown period, and analyzed the economic costs and health benefits of lockdown based on susceptible-infected-recovered model and time series model [
9]. The results show that lockdown measures have a positive impact on the pandemic, but countries must decide on the best timing and strategies for exiting the lockdown measures according to the capacity of their economies and health systems, in order to safely return to normal life with minimal loss of life and economic losses. Based on the agent-level pandemic simulation model, Wu et al., proposed a multivariable analysis model, including the time of implementation and unlocking, population mobility and other factors, to investigate the community lockdown for COVID-19 [
25]. The results show that an early lockdown can greatly limit the spread of the disease, and once the situation can be prevented and controlled, population movements must be gradually restored.
For the complex network related to cities, Saidi et al., proposed a network analysis of urban rail transit systems in six cities in the world, and evaluated the bus systems based on generalized passenger cost [
26]. Wang et al., applied complex network theory to investigate urban road traffic network topology, and proposed a new method to represent urban road network [
27]. Saberi et al., applied complex network driven approach to describe urban travel demand patterns by analyzing the statistical characteristics of the point-to-destination demand network, and proposed an interdisciplinary and quantitative framework for identifying the mobility characteristics of urban areas [
28]. Ma et al., explored the coordinated coupling development between urban public transport and urban commercial complex, and measured the centrality of urban public transport based on multi-centrality assessment and urban network analysis model [
29]. Jia et al., presented the complex network model of bus stops to analyze the optimization of the public traffic network [
30]. Lobsang et al., analyzed the characteristics of urban morphological structure based on open street network data, and explored the relationship between urban street morphological structure and urban economic development level [
31]. Lobsang et al., used multi-scale urban spatial characteristics analysis to investigate the spatial structure and organizational relations based on complex networks according to urban resident flow data [
32]. Li et al., presented a comprehensive evaluation model based on input-output analysis and social network analysis to quantify the evolution trend of industrial structure, analyze the internal relationship between different sectors, and investigate the carbon emissions related to industrial structure [
33]. Heo and Lee analyzed industrial convergence in 29 industries based on Korea’s input-output table and explored the backbone network of convergence to reveal the structural characteristics of interindustry linkages [
34]. Yang et al., quantified the spatial distribution of information services and its sub-industries in Beijing in 2008 and 2013, and examined the spatial path dependence by using standard deviation ellipse and back propagation neural network algorithm [
35]. Cheng et al., studied the optimization of industrial structure in Jiangxi Province of China using complex network of industrial space [
2].
From the previous studies, the spatial distribution and mixing degree of urban functions have been paid more attention, and the complex network is used to study urban traffic and transportation, urban road and industry structure. There are few studies on the complex network of urban function. For the lockdown under COVID-19, most research pays attention to the effectiveness of the lockdown on the spread of pandemic and the influence of lockdown on economy, society and people’s mental health, and no literature has been published for the urban functions and the corresponding complex network under COVID-19.
3. Methodology
In this paper, based on the complex networks proposed by Hidalgo et al., and Muneepeerakul et al., for products [
36] and occupations [
37], respectively, the complex networks of the urban functions in Shenzhen before and under the lockdown of COVID-19 are obtained.
The point of interest (POI) is considered as the urban function. Based on the policy of the lockdown in Shenzhen, the POI of the urban functions under the lockdown of COVID-19 is removed accordingly. The location quotient is presented to obtain the dominant urban functions of the districts in Shenzhen before and under the lockdown of COVID-19. Based on the conditional probability, the interdependencies between the urban functions are proposed to establish the complex networks of urban functions and their clusters to show the relationships between the urban functions, the overall and cluster characteristics of the urban functions before and under the lockdown of COVID-19. The mean degree and mean weighted degree of the primary categories of the urban functions are obtained to discuss the classification characteristics of the urban functions before and under the lockdown of COVID-19. Then, the differences and changes of the urban functions before and under the lockdown of COVID-19 are compared and analyzed, and the corresponding policy implications are presented.
By using location quotient, the dominant urban functions of the districts before and under the lockdown of COVID-19 in Shenzhen are obtained. The location quotient indicates the leading level of the urban functions of the districts in Shenzhen. The equation of the location quotient is [
37],
where
is the location quotient for urban function
in district
,
is the quantities of POI for urban function
in district
,
is the total quantities of POI in district
,
is the total quantities of POI for urban function
in Shenzhen, and
is the total quantities of POI in Shenzhen.
means that urban function is dominant in district . The higher is, the more dominate the urban function is.
Based on the conditional probability, the interdependency between functions is proposed to explore the relationship between urban functions before and under the lockdown of COVID-19. The interdependency means the probability that two urban functions are dominant in the same districts, i.e., [
37]
where
is the independency between urban functions
and
,
is the location quotient of urban function
,
is the location quotient of urban function
,
and
are the probabilities that urban function
and
is dominant in all the districts in Shenzhen, respectively, and
is the probability that urban functions
and
are both dominant in all the districts in Shenzhen.
When , the urban functions and are more possible to be dominant in the same district. When , and are more impossible to be dominant in the same district. In addition, when , and are uncorrelated and independent.
Based on the interdependency, the complex networks of urban functions before and under the lockdown of COVID-19 are presented using the software Gephi. The complex networks are obtained to analyze the relationship between the urban functions and the overall characteristics of the urban functions before and under the lockdown of COVID-19 in Shenzhen.
The classification characteristics of the urban functions before and under the lockdown of COVID-19 are explored by calculating the mean degree and mean weighted degree of the primary categories of the POI for the urban functions.
The complex networks of the urban function clusters are established to analyze the cluster characteristics of the urban functions before and under the lockdown of COVID-19. The suitable value of the interdependency that the cluster characteristics show the most significant is selected as the filtering threshold to form the complex networks by using gravity layout in Gephi. The typical clusters of urban functions are discussed by analyzing the clusters of the urban functions with high internal correlation in the complex networks before and under the lockdown of COVID-19.
4. Data
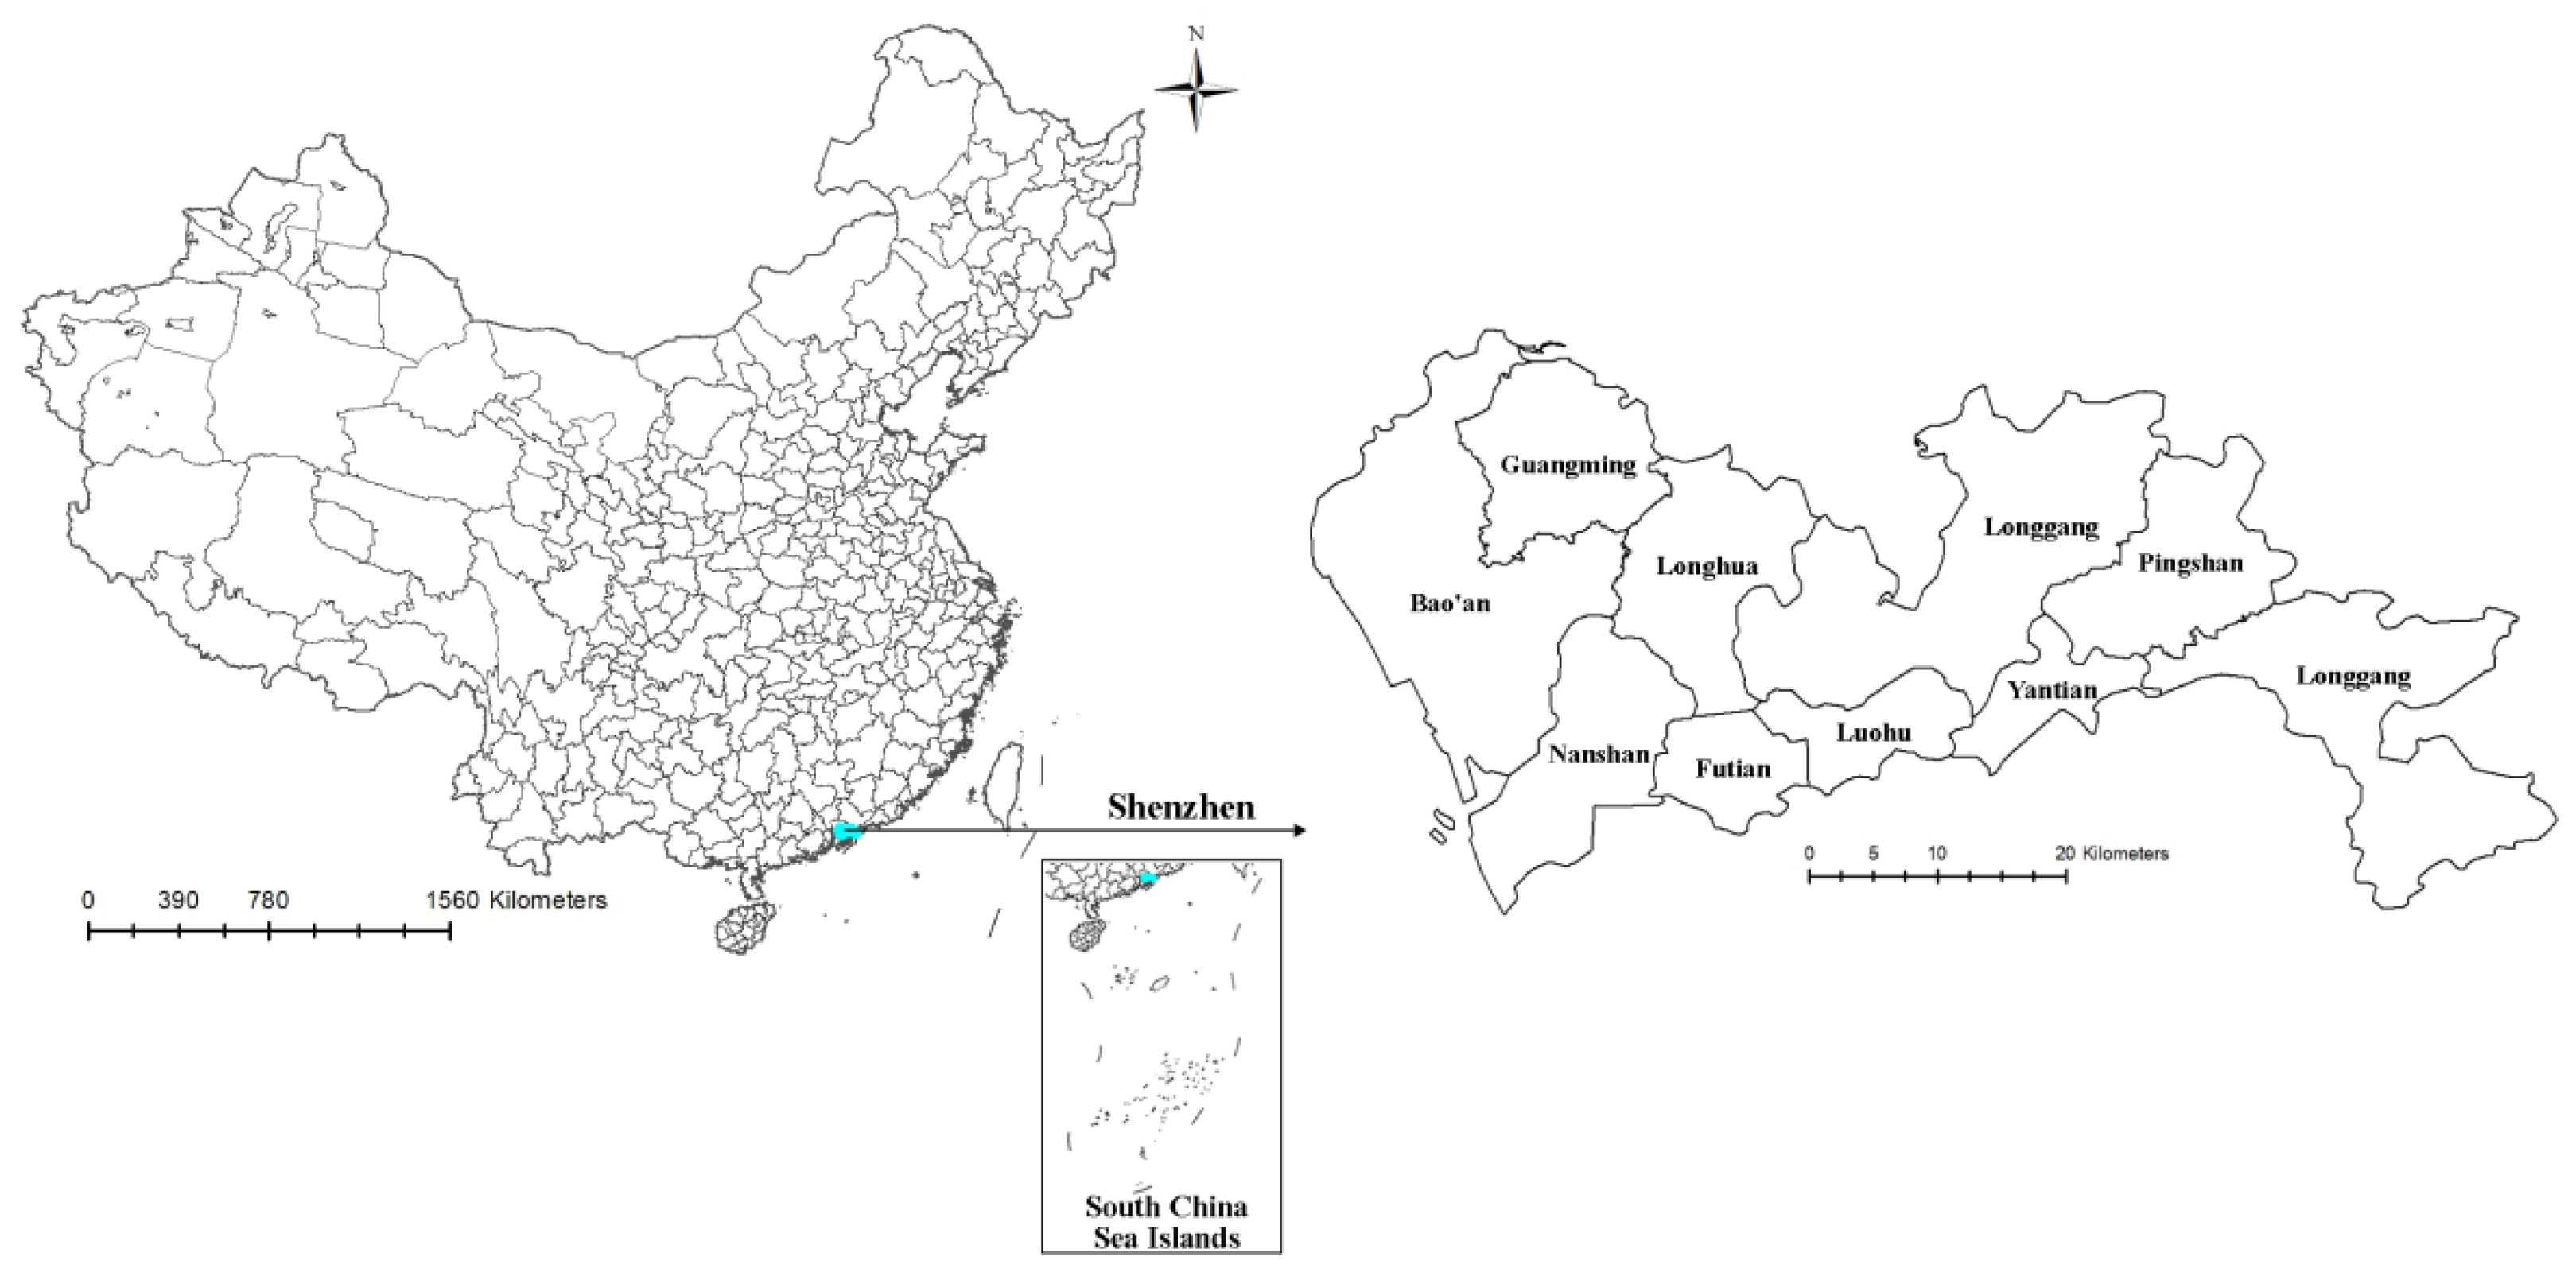
The POI data is collected as the urban functions in 9 districts in Shenzhen from Google Map. The districts include the district of Futian, Bao’an, Nanshan, Luohu, Longgang, Longhua, Yantian, Guangming and Pingshan. The POI data include longitude, latitude, name, classification, etc. The POI data is collected by using the software Vectordown, which is used to download vector data of internet map. Firstly, the download area of Shenzhen is selected. Secondly, the POI data can be extracted from the map by setting the longitude and latitude of a selected area. By using the ArcGIS, which is a software of geographical information system, the POI data is arranged and classified according to its primary and minor categories, and the quantities of each primary and minor category of POI data in each district in Shenzhen are obtained. 17 primary categories and 129 minor categories are collected, as shown in
Table 1.
For the data before the lockdown of COVID-19, all categories of POI are considered. As regards the data under the lockdown of COVID-19, some categories of POI are removed according to the policy of the lockdown in Shenzhen, as shown in
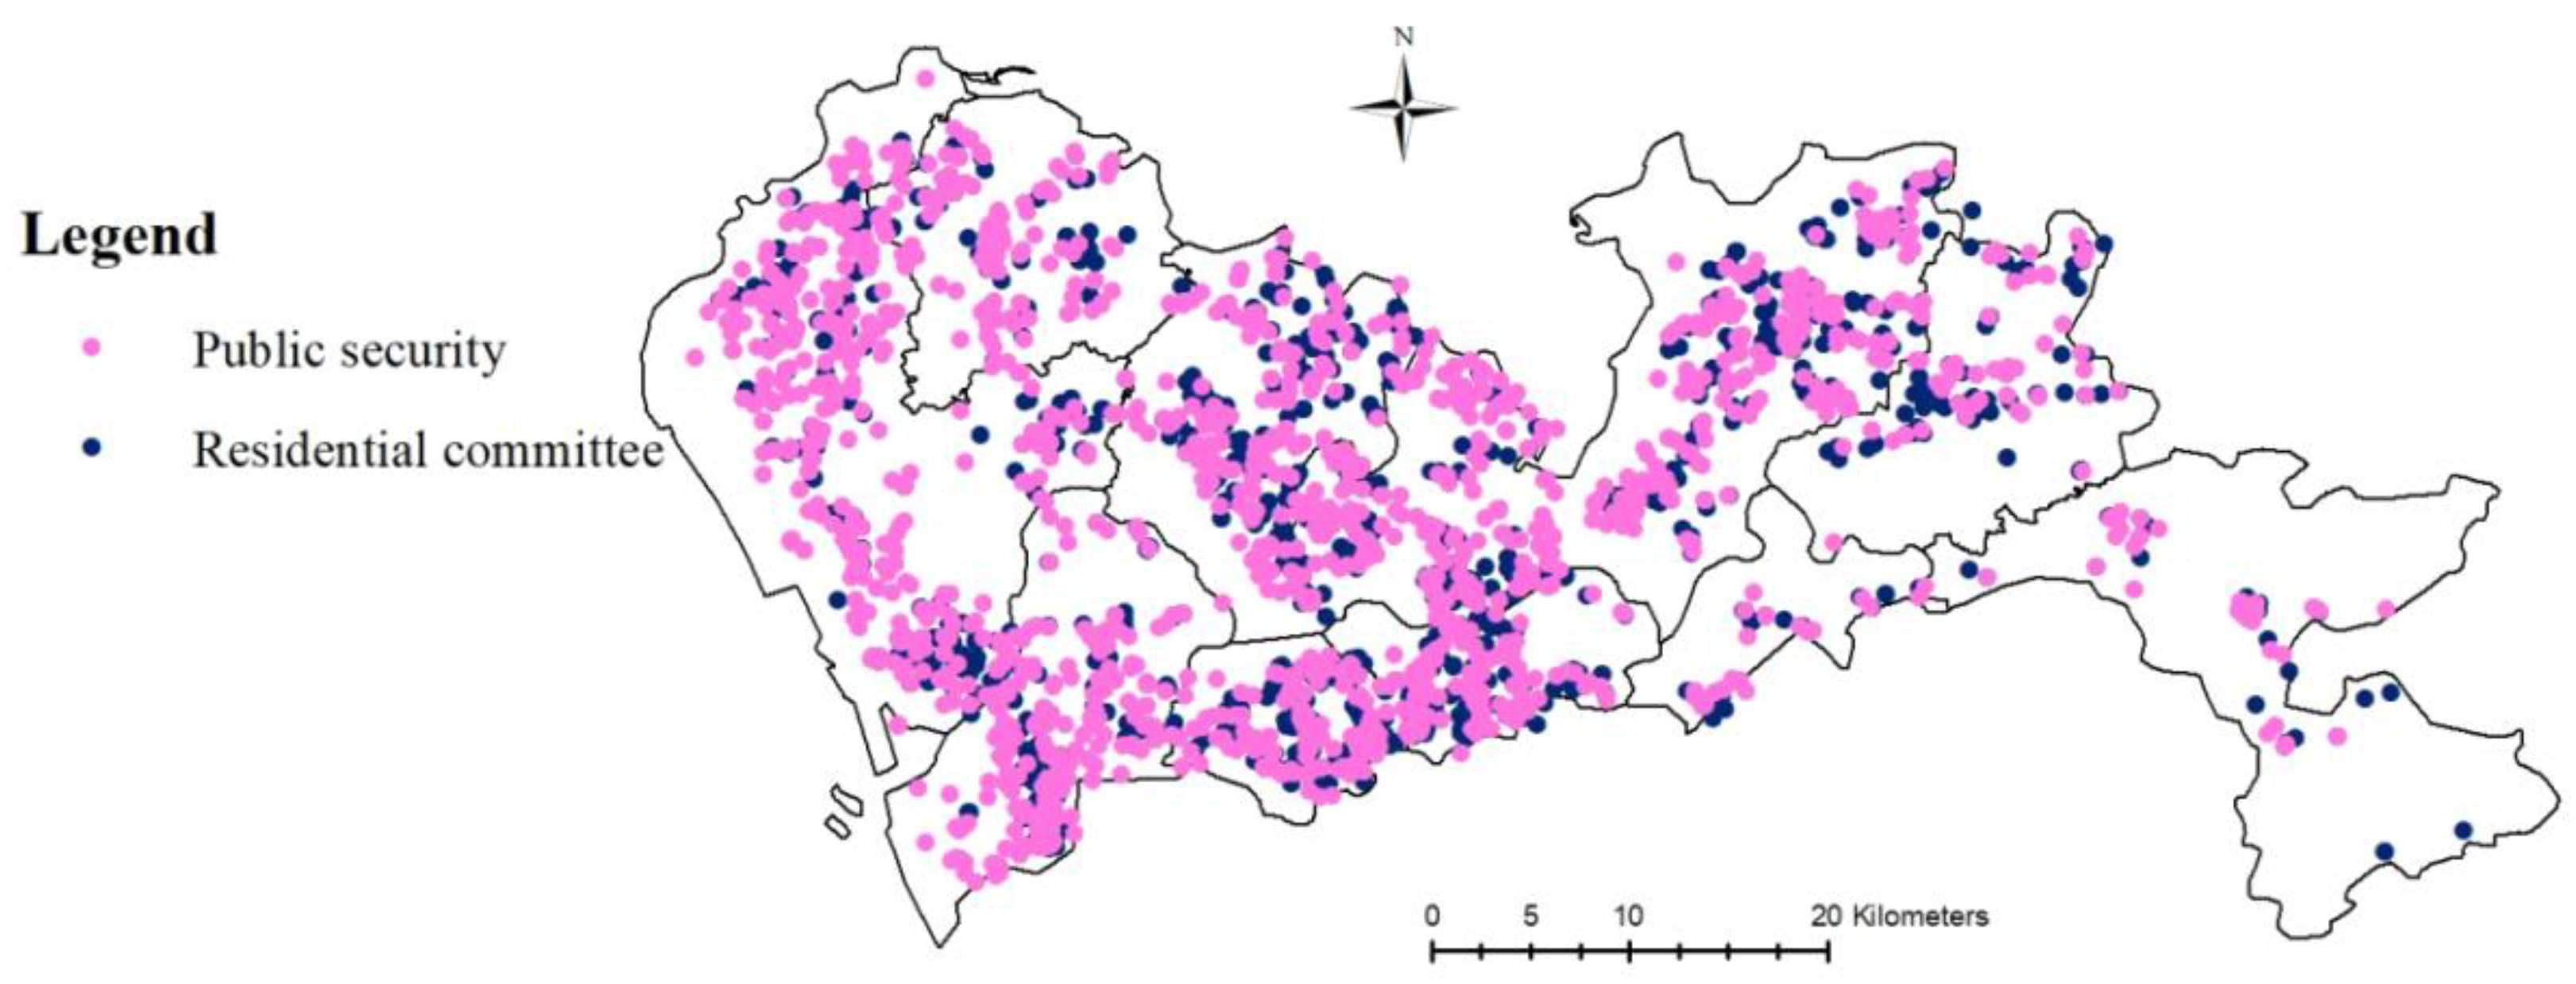
Table 1. The public security departments for maintaining public order, residential committees for providing basic needs and solving the problems for residents under the lockdown, public utility, supermarkets, convenience stores, pharmacies, hospitals, clinics, emergency centers, sanatoriums, and centers for disease control and prevention (CDC) for ensuring citizens’ life and the basic operation of the city, ATM for offering the financial needs of the citizens, catering, such as Chinese restaurant, coffee bar, cake and dessert shop, snack bar, tea bar and western restaurant, for providing delivery services of food and beverages to the citizens are retained. Airport, charging station and gasoline station for supplying the necessary traffic operation are retained. The residential area and dormitory are also retained. The POI data is sort out and calculated using software ArcGIS.
The geographical location of Shenzhen in China is shown in
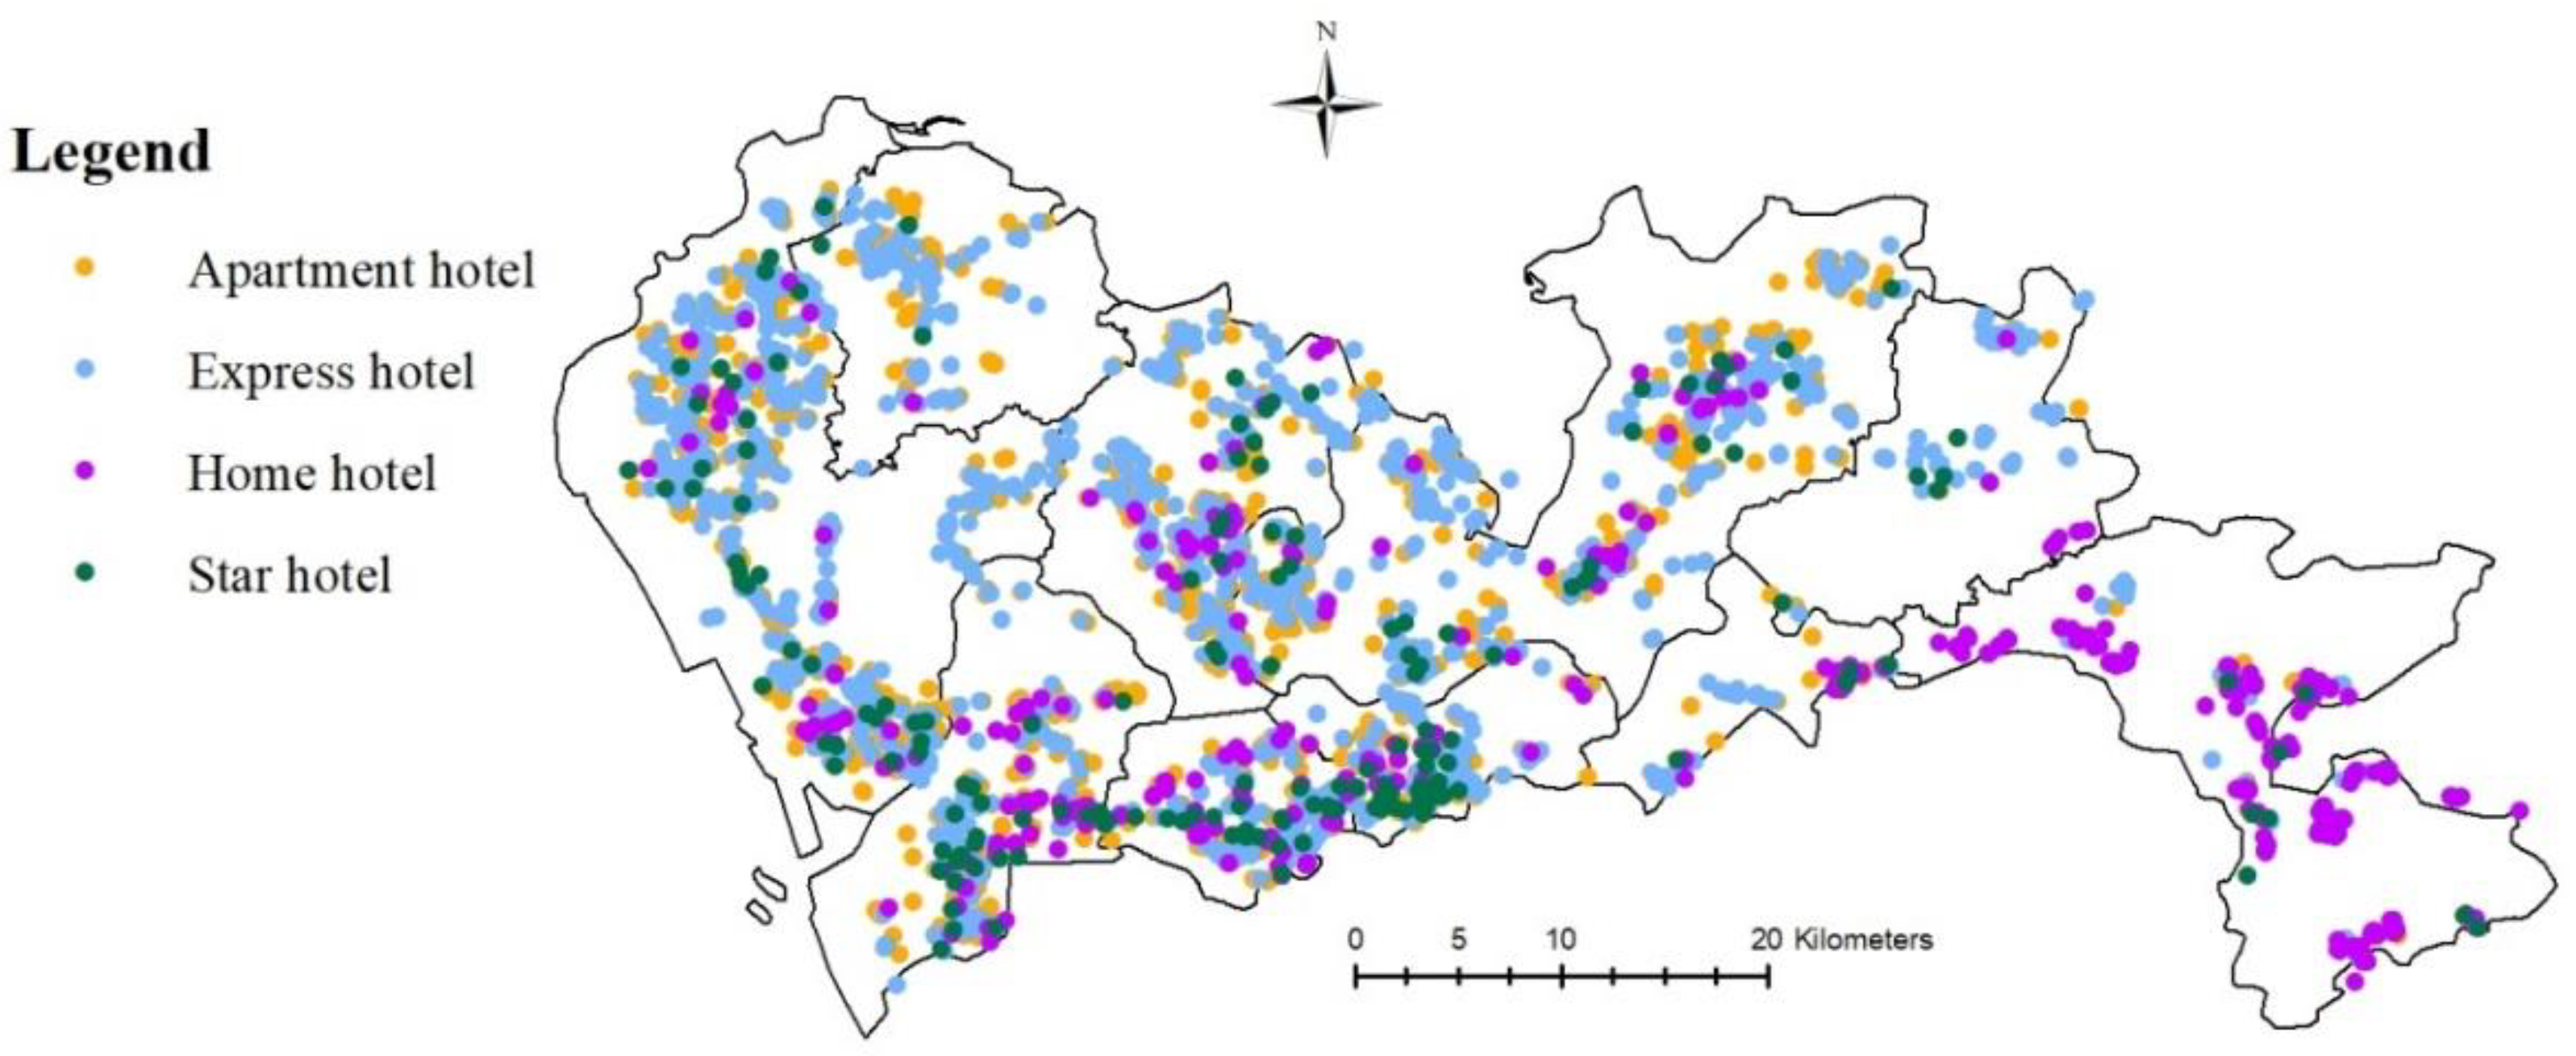
Figure 1. The distribution of POI for hotels is shown in
Figure 2. The distribution of POI for government departments under the lockdown of COVID-19 is shown in
Figure 3.
5. Results and Discussion
5.1. Interdependency between the Urban Functions
From calculating Equation (1), the dominant urban functions of every district in Shenzhen are obtained. Based on the dominant urban functions, the interdependencies between two urban functions can be computed by Equation (2). The results of the interdependencies between the urban functions before and under the lockdown of COVID-19 are shown in
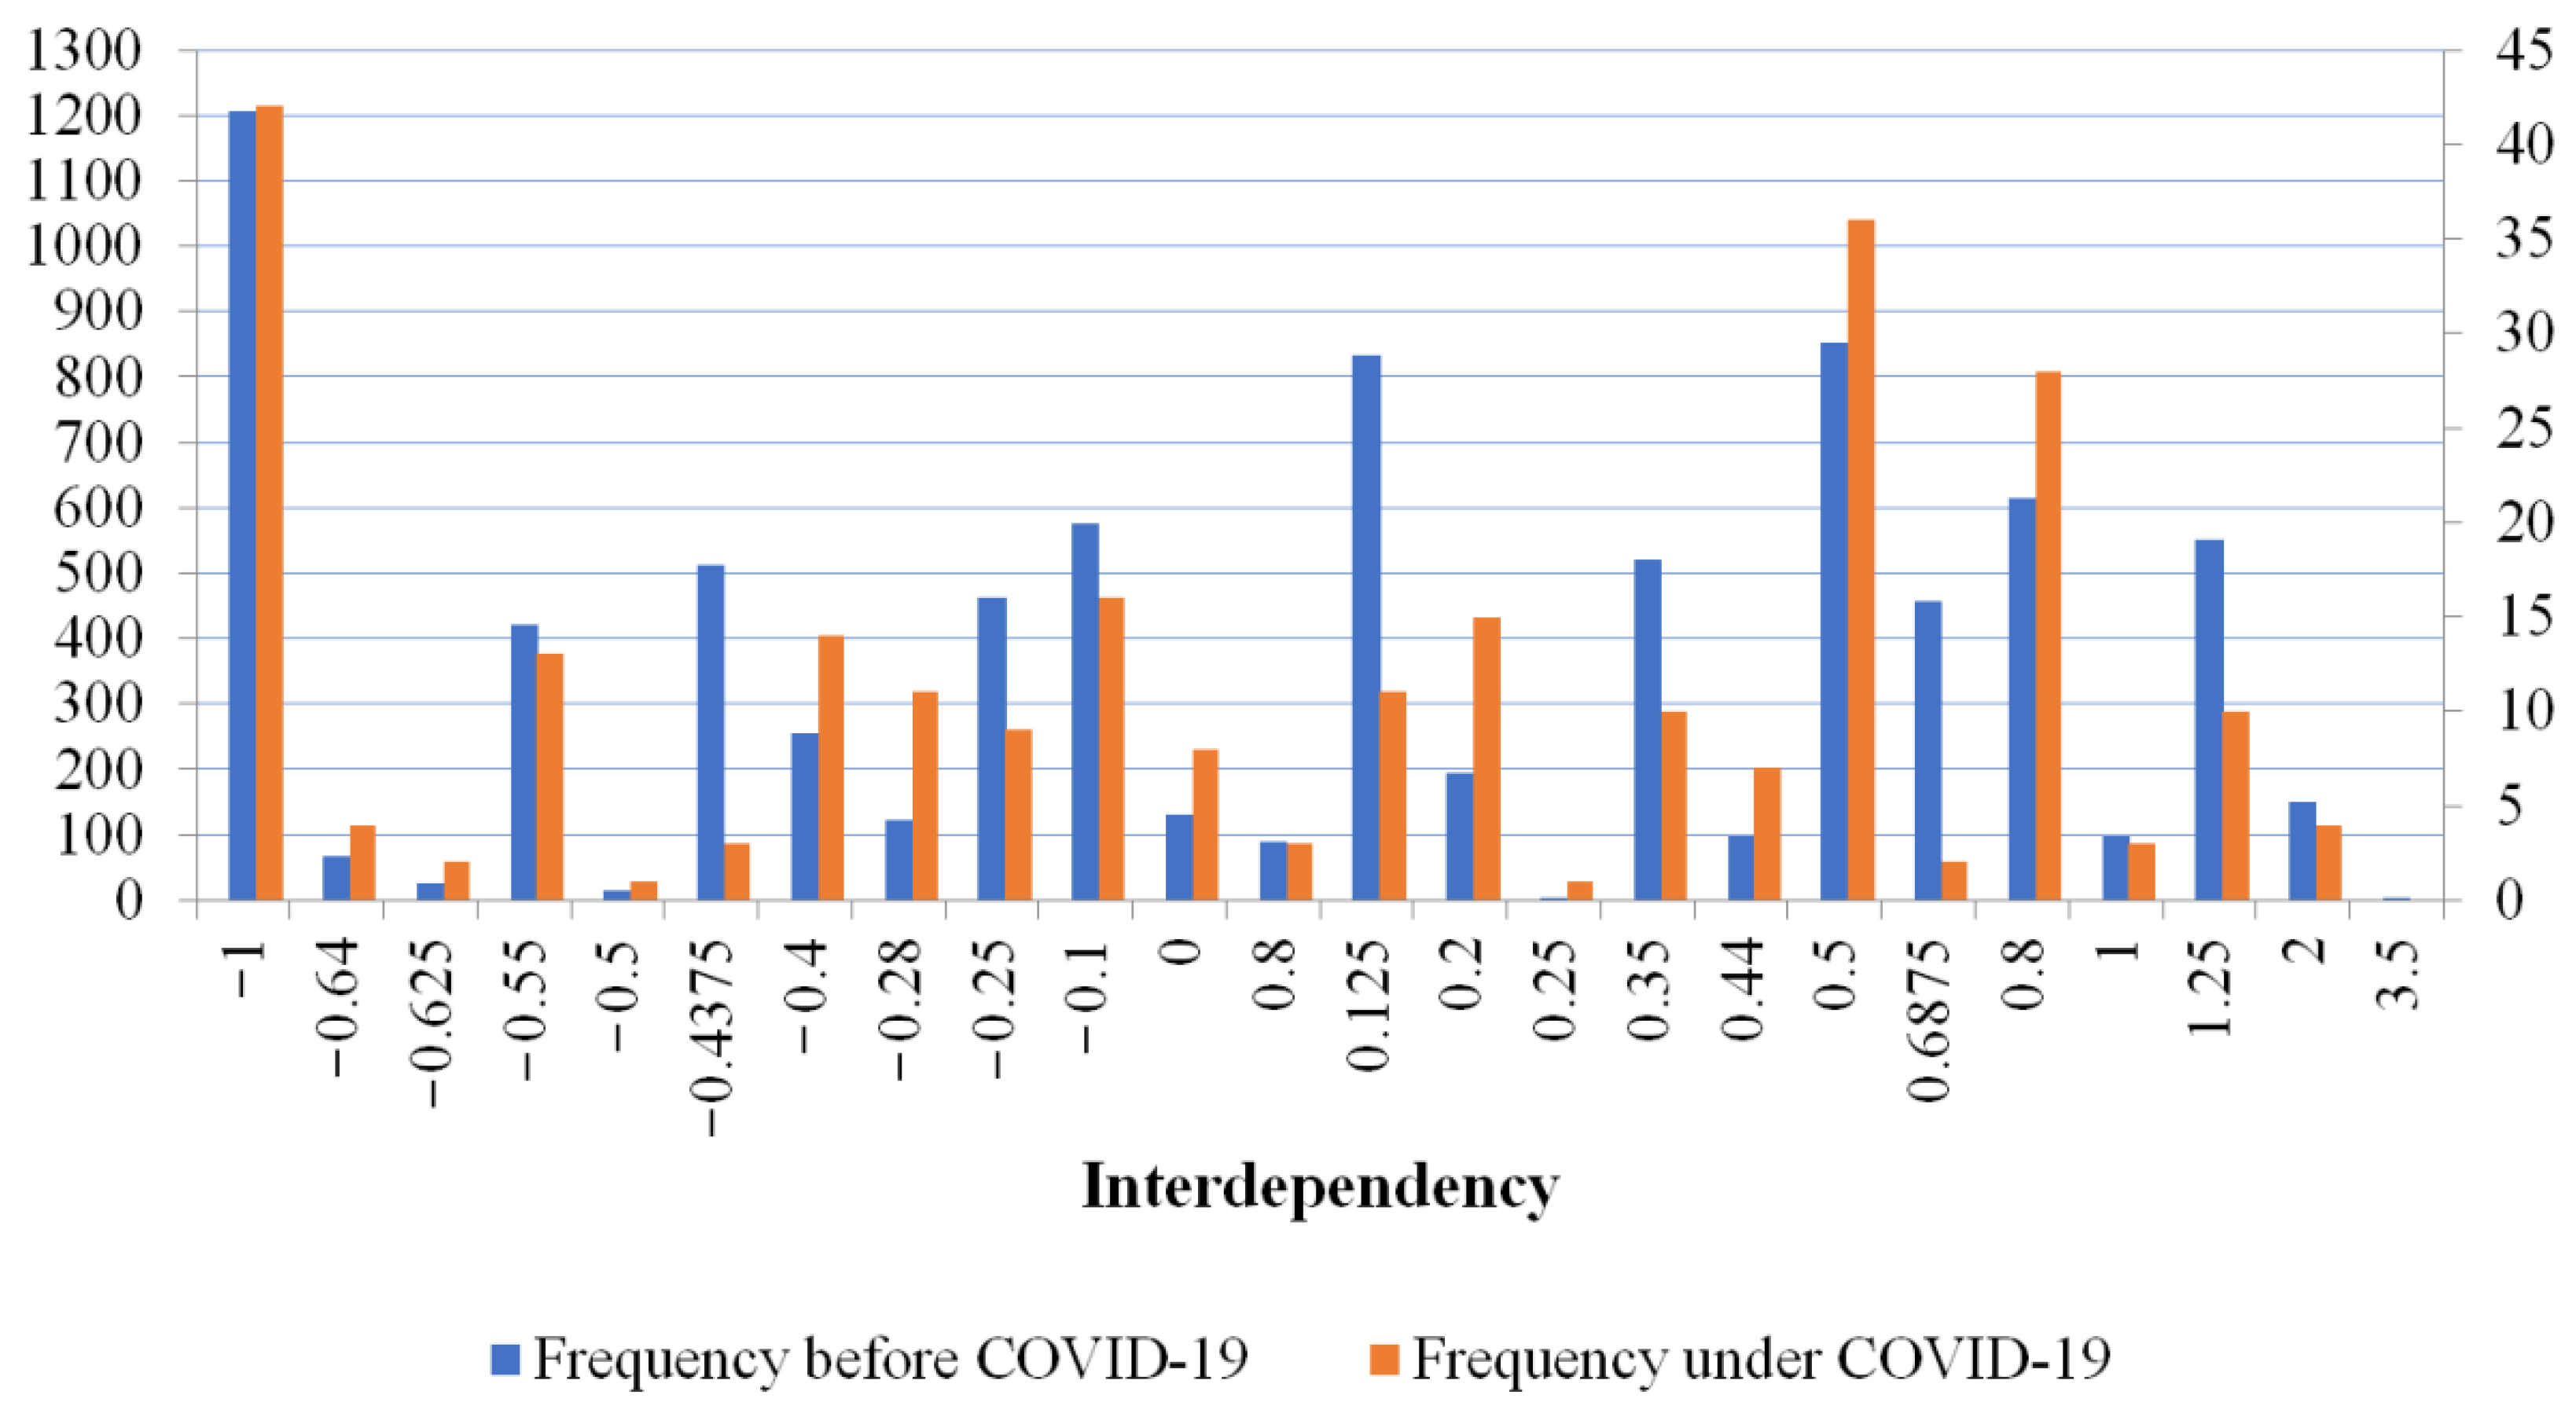
Table 2. The frequency of the interdependencies between the urban functions before and under the lockdown of COVID-19 is shown in
Figure 4.
From
Table 2, for the interdependency before the lockdown of COVID-19, the positive interdependencies between the urban functions are more than negative ones. There are 4462 positive and 3662 negative interdependencies between the urban functions, respectively. The positive interdependencies account for 54.05%. For the negative interdependencies, there are 1878 interdependencies between the urban functions in the interval of −0.5 and −0.75, and 1207 interdependencies between the urban functions equal to −1, showing that most negative interdependencies are relatively strong. For the positive interdependencies, there are 2486 interdependencies between the urban functions in the interval of 0.1 and 0.5, and 1414 interdependencies between the urban functions are greater than 0.75, meaning that most positive interdependencies are also moderately strong. As shown in
Figure 4, the interdependencies with the highest frequency are 0.125 and 0.5, indicating that most urban functions with positive interdependency show moderately strong.
As regards the interdependency under the lockdown of COVID-19, there are more positive interdependencies between the urban functions than negative ones. The positive interdependencies take up 51.38%, and the negative ones account for 45.46%. There are 51 interdependencies between the urban functions in the interval of 0.25 and 0.5, and in
Figure 4, the highest frequency is 0.5, which shows that most urban functions have modestly positive interdependencies. 45 interdependencies between the urban functions are greater than 0.75, indicating that more urban functions have stronger positive interdependencies. For the negative interdependencies, there are 57 interdependencies are between −0.25 and −0.75, and in
Figure 4, the frequency of −0.25, −0.28, −0.4 and −0.55 shows relatively high, which shows that most urban functions have stronger negative interdependencies. 42 interdependencies between the urban functions are equal to −1, which illustrates that there are strongest negative interdependencies between more urban functions.
Thus, whatever before or under the lockdown of COVID-19, there are more urban functions possible to be dominant in the same district. The interdependencies of most urban functions show moderately strong in Shenzhen before the lockdown of COVID-19. The interdependencies of most urban functions show stronger under the lockdown of COVID-19.
5.2. Overall Characteristics of Urban Functions
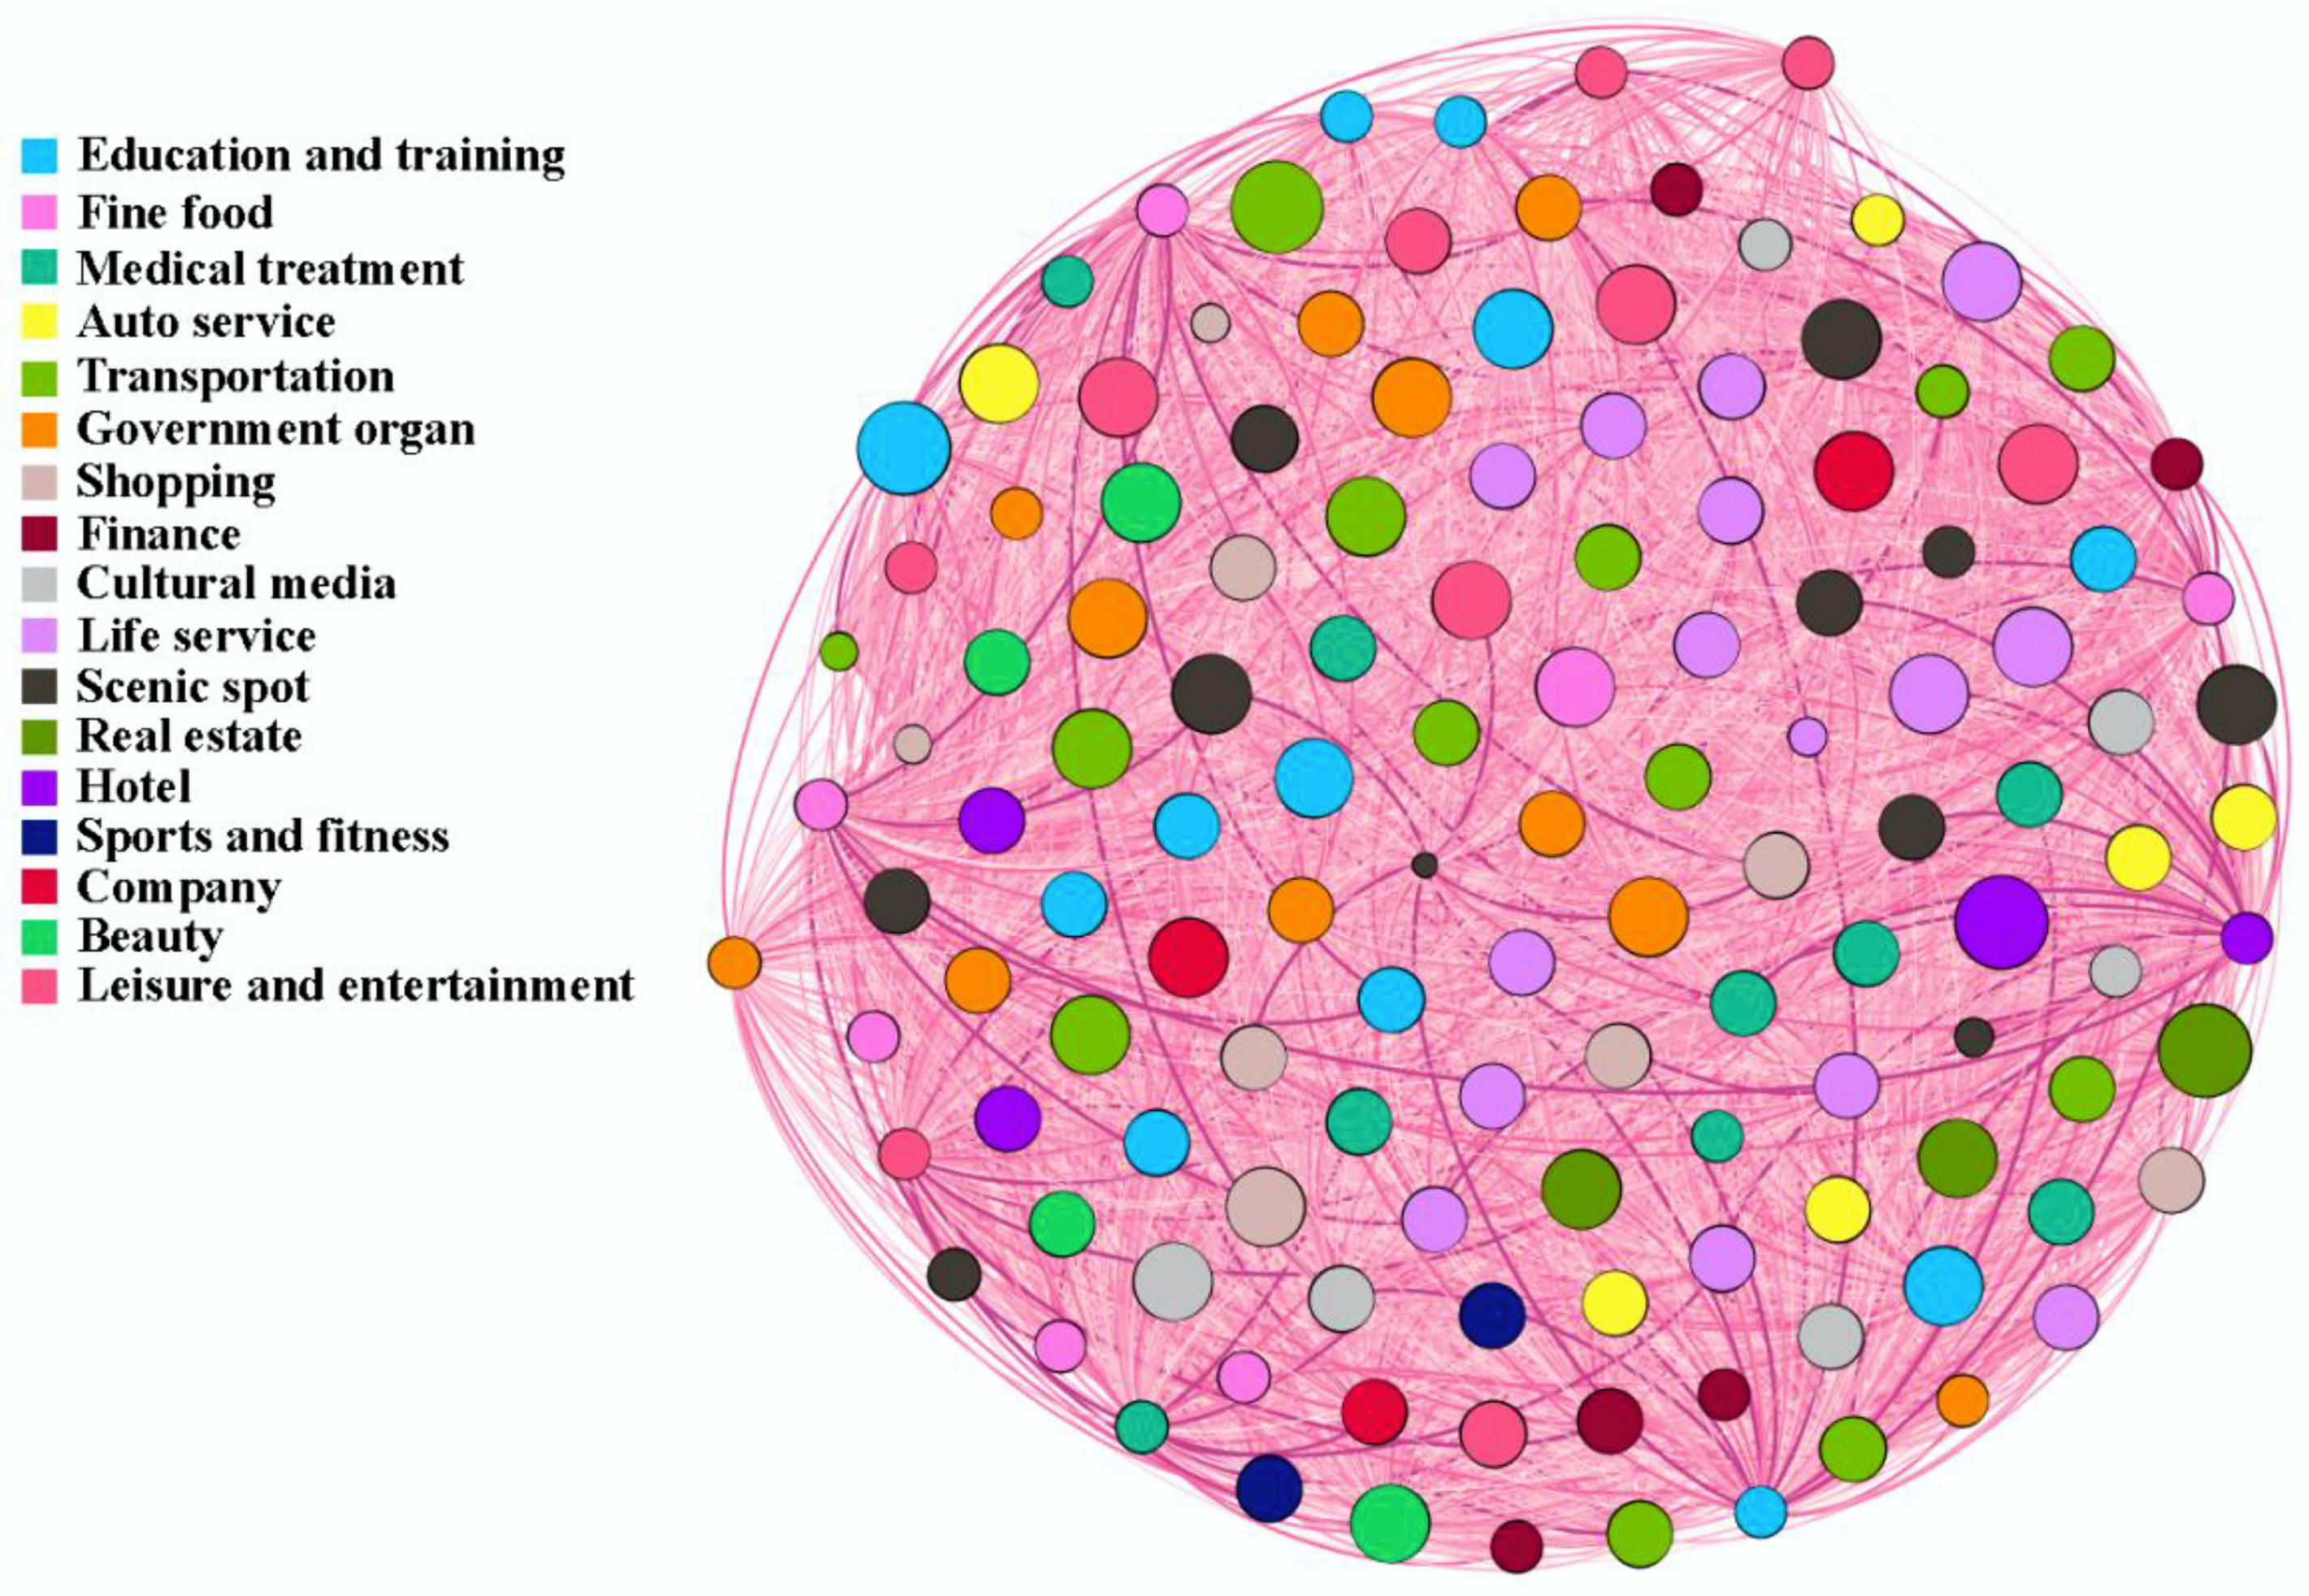
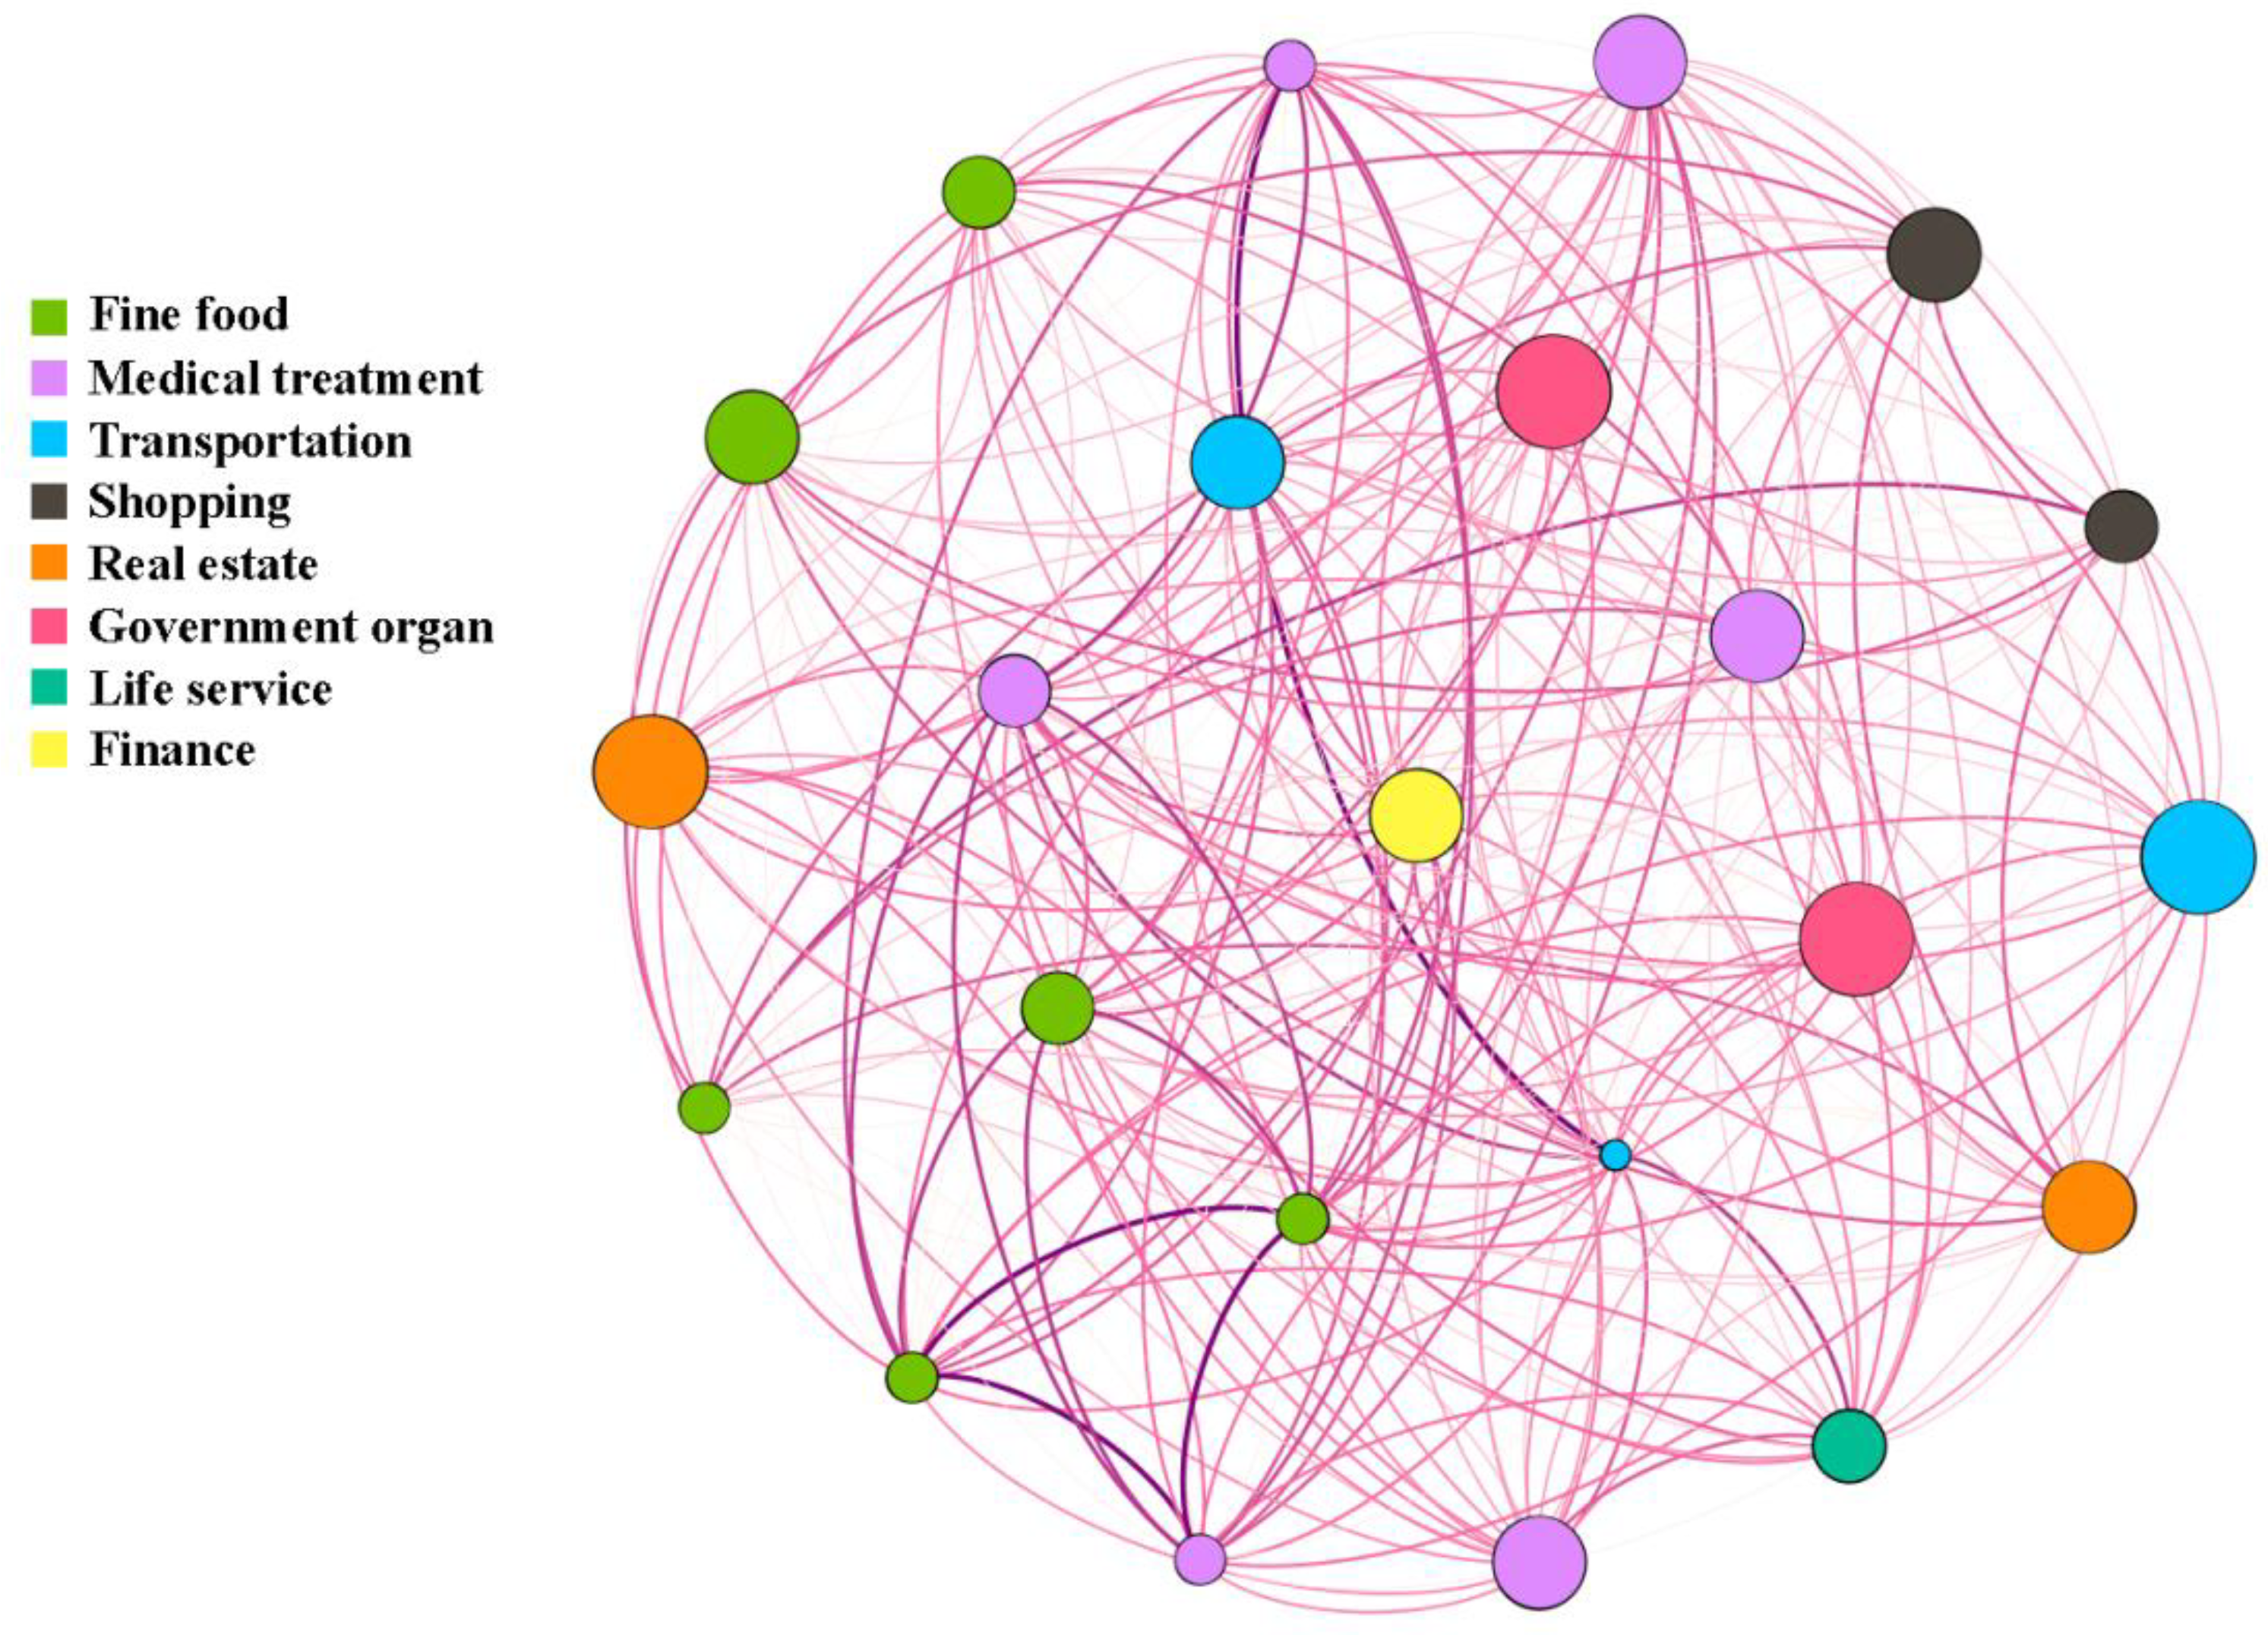
To explore the overall characteristics of the urban functions, the interdependency between the urban functions is considered as the edge, and number of urban functions being dominant is regarded as the node, then the complex network of the urban functions is established by Gephi according to the primary categories of POI. The complex networks of the urban functions in Shenzhen before and under the lockdown of COVID-19 are shown in
Figure 5 and
Figure 6 respectively.
In
Figure 5 and
Figure 6 the larger the node is, the more the number of the dominant urban functions calculating in districts is; and the wider the edge is, the stronger the interdependency between the urban functions is. From
Figure 5, small nodes represent rare urban functions, and the large nodes mean common urban functions. There are fewer small nodes and more large nodes, which shows that more common urban functions are dominant before the lockdown of COVID-19. The interdependencies between relatively small nodes, such as airport and auto inspection, etc., show strong positive. The interdependencies between larger nodes are weak, and these urban functions cannot easily be affected by the change of other functions. From
Figure 6, there are fewer nodes under the lockdown of COVID-19 than those before it, because most urban functions are out of operation and only the necessary urban functions are remained due to the lockdown of COVID-19. The larger nodes are relatively more than the smaller ones, and similarly, the interdependencies show stronger between the small nodes than those between the larger ones. It shows that more common urban functions are dominant, and the interdependencies between the common urban functions are weak in Shenzhen under the lockdown of COVID-19.
The degree of the urban functions with positive and negative interdependencies before and under the lockdown of COVID-19 is computed by using Gephi, and the results are shown in
Table 3 and
Table 4. In these tables, ‘Before’ represents before the lockdown of COVID-19, ‘Under’ represents under the lockdown of COVID-19. Degree means the total number of edges connected to a node.
From
Table 3, the mean degree decreases along with the increase of
, which illustrates that more urban functions show positive interdependencies than strong positive ones. Before the lockdown of COVID-19, when
, there is more than 10% probability that the post office or public utility and other 86 urban functions are dominant in the same district; when
, the probability that the star hotel and other 80 urban functions are dominant in the same district is larger than 25%; when
, the probability that the zoo and other 67 urban functions are dominant in the same district is more than 50%; and when
, there is more than 75% probability that the zoo and other 67 urban functions are dominant in the same district.
Under the lockdown of COVID-19, for ATM, coffee bar, hospital, sanatorium, tea bar or western restaurant, the probability that these functions and other 15 urban functions are dominant in the same district is larger than 10%. There is more than 25% probability that the coffee bar, hospital, sanatorium or western restaurant and other 14 urban functions are dominant in the same district. For coffee bar, hospital, sanatorium or western restaurant, there is more than 50% probability that these functions and other 67 urban functions are dominant in the same district. There is more than 75% probability that the coffee bar, hospital, western restaurant and other 67 urban functions are dominant in the same district.
From
Table 4, the mean degree declines as the increase of
, which indicates that more urban functions show negative interdependencies than strong negative ones. Before the lockdown of COVID-19, when
, there is less than 10% probability that the store and other 75 urban functions are dominant in the same district; when
, the probability that the snack bar or store and other 70 urban functions are dominant in the same district is less than 25%; when
, the probability that the zoo and other 57 urban functions are dominant in the same district is smaller than 50%; and when
, there is less than 75% probability that the zoo and other 57 urban functions are dominant in the same district.
Under the lockdown of COVID-19, for ATM, clinic, coffee bar, hospital, sanatorium, tea bar or western restaurant, there is less than 10% probability that these functions and other 15 urban functions are dominant in the same district. There is less than 25% probability that the clinic and other 17 urban functions are dominant in the same district. There is less than 50% probability that the clinic and other 21 urban functions are dominant in the same district. There is less than 75% probability that the CDC, clinic or public utility and other 22 urban functions are dominant in the same district.
Above all, the life service and hotel play vital roles in urban development before the lockdown of COVID-19, and finance, fine food and medical treatment are essential under the lockdown of COVID-19 in Shenzhen.
5.3. Classification Characteristics of Urban Functions
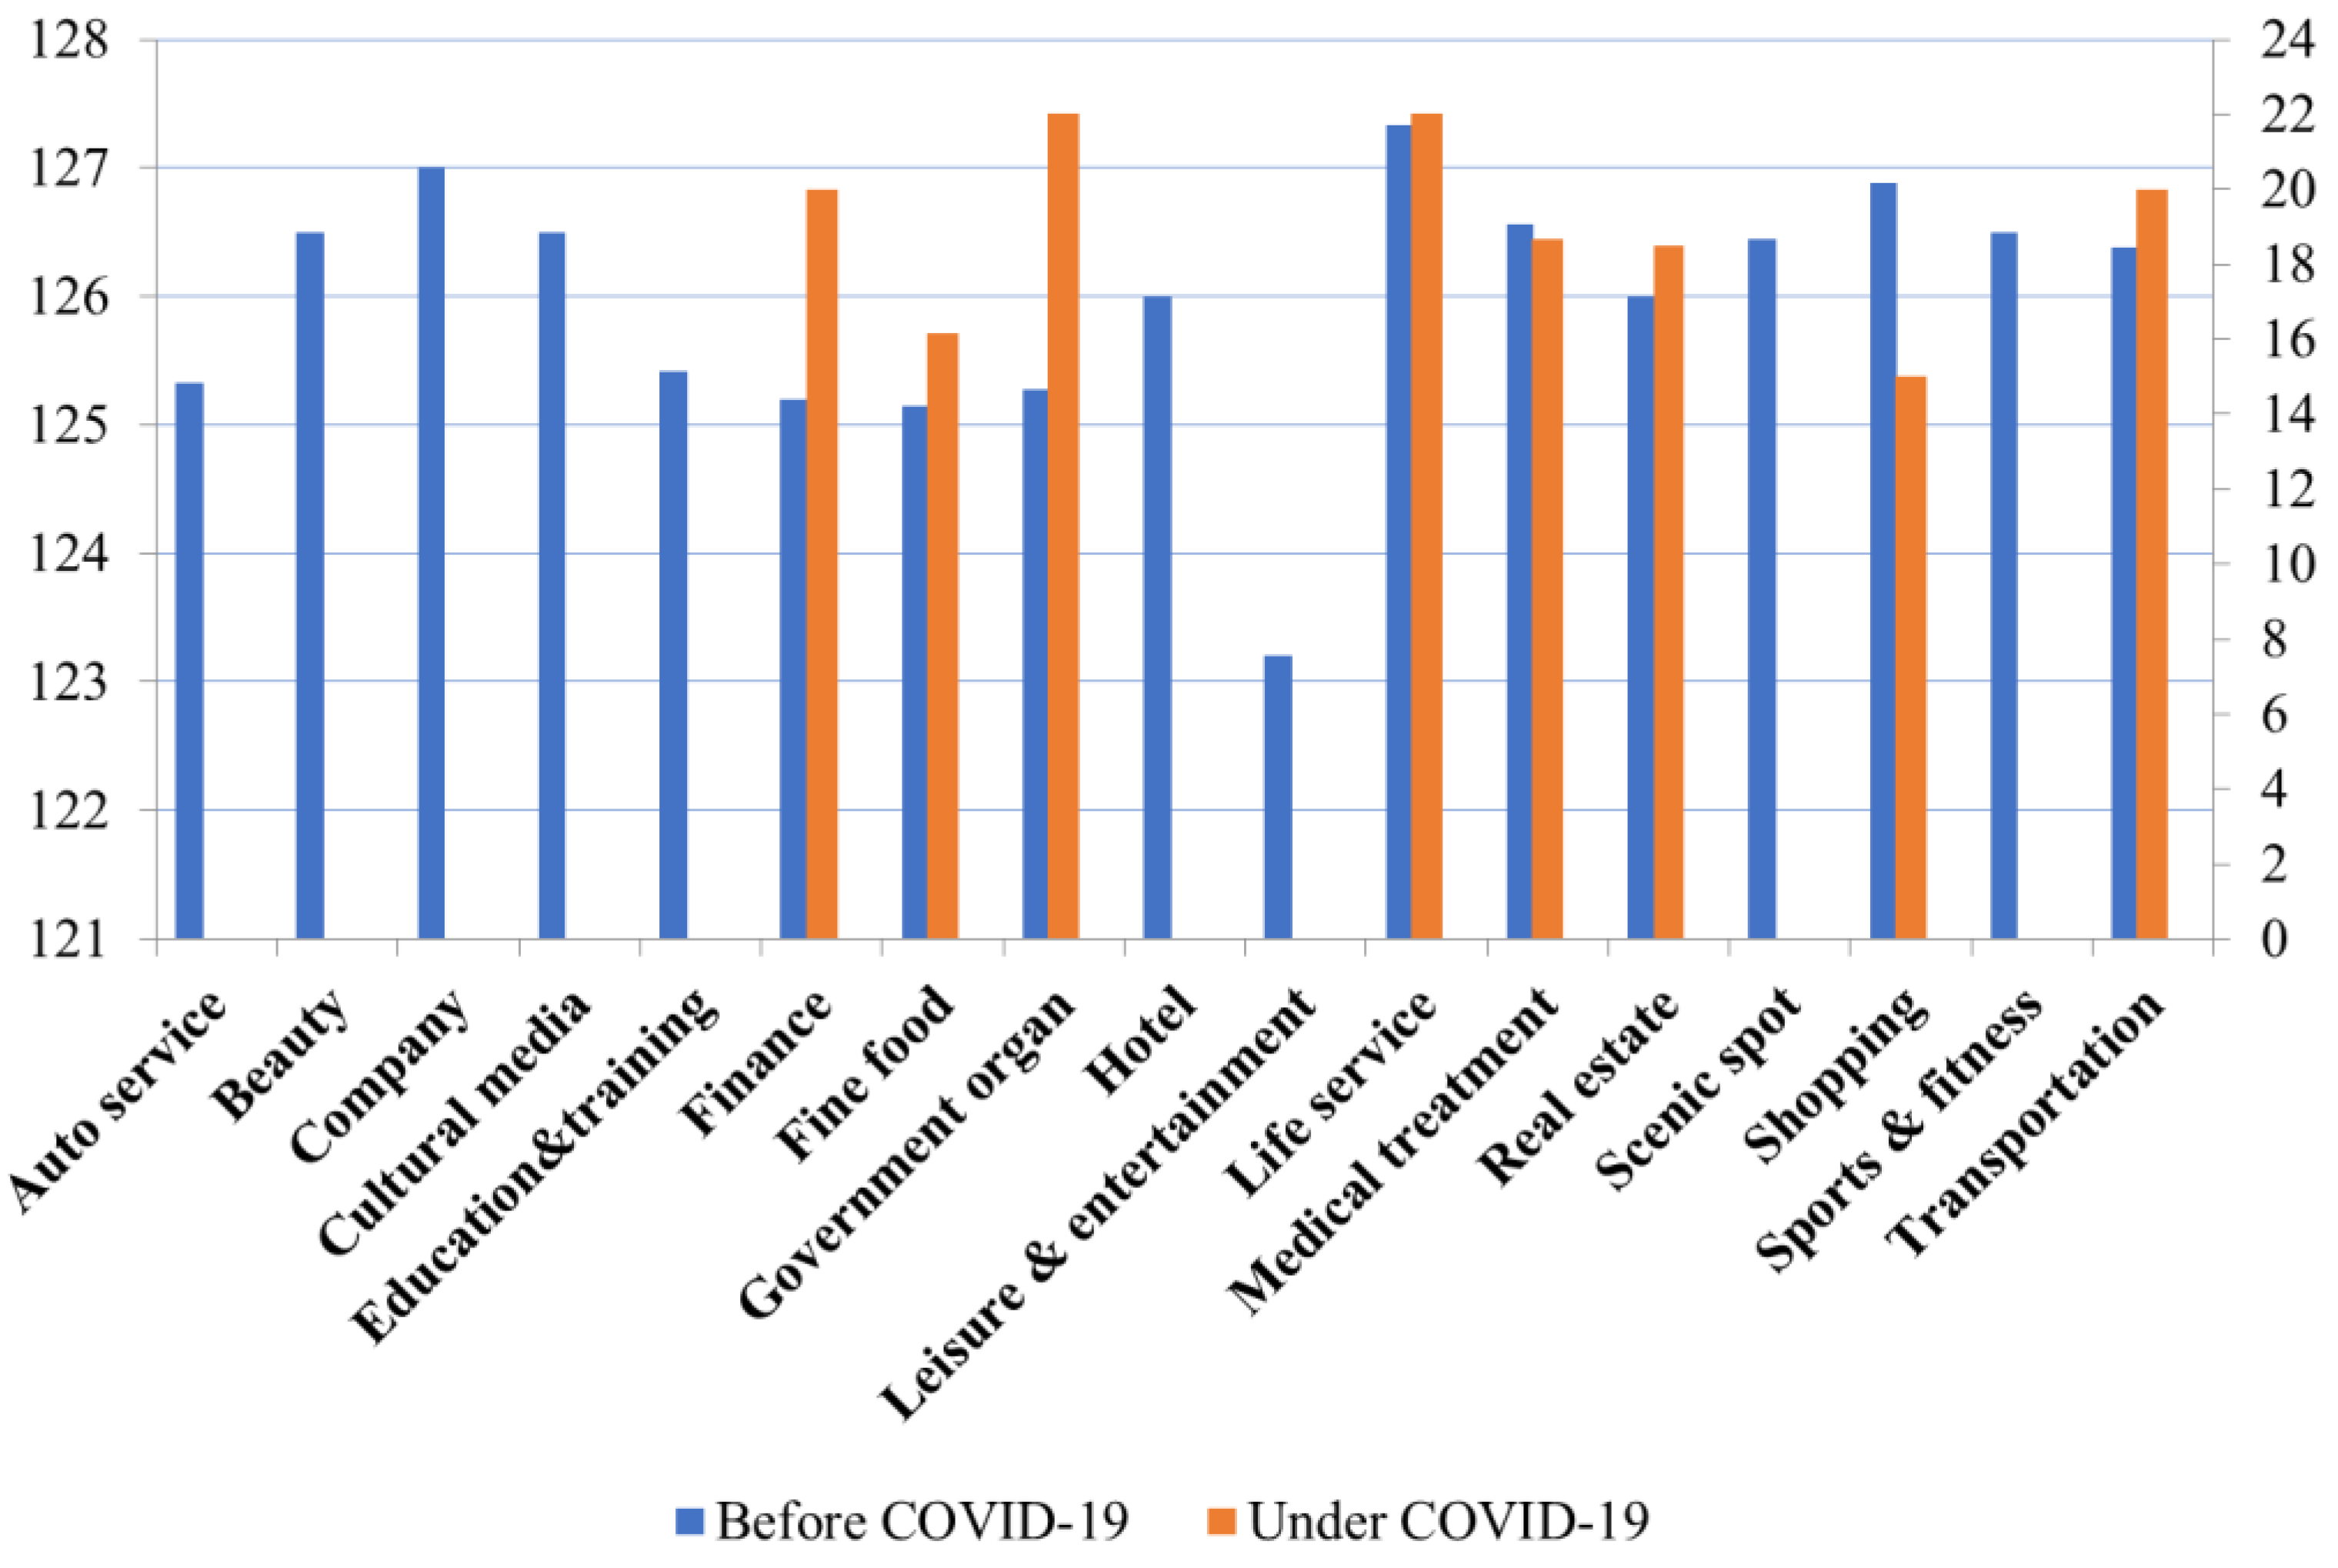
The classification characteristics of the urban functions are investigated by calculating the mean degree and mean weighted degree of primary categories before and under the lockdown of COVID-19 based on Gephi, and results are shown in
Figure 7 and
Figure 8. Weighted degree is the sum of the weights of all edges connected to a node, which represents the sum of the interdependency of each function and the rest functions. The weighted degree reflects the overall mixing degree between urban functions.
From
Figure 7, before the lockdown of COVID-19, life service and company have the highest mean degree of 127.33 and 127, which illustrates that they have most positive correlation with other categories of urban functions. Leisure and entertainment has the least correlation with other urban functions. Under the lockdown of COVID-19, there are the highest mean degrees of 22 for government department and life service. It indicates that life service still has the most positive relationship with other urban functions, which is the same as the government department. The government departments, including public security departments and residential committee, have a close relationship with the residents’ needs and society order under the lockdown of COVID-19. The mean degree of transportation also plays an important role due to the necessary of transport of pandemic prevention for personnel and materials, medical care and public security. In addition, the mean degree of fine food shows the smallest, because all catering stops eating in the hall.
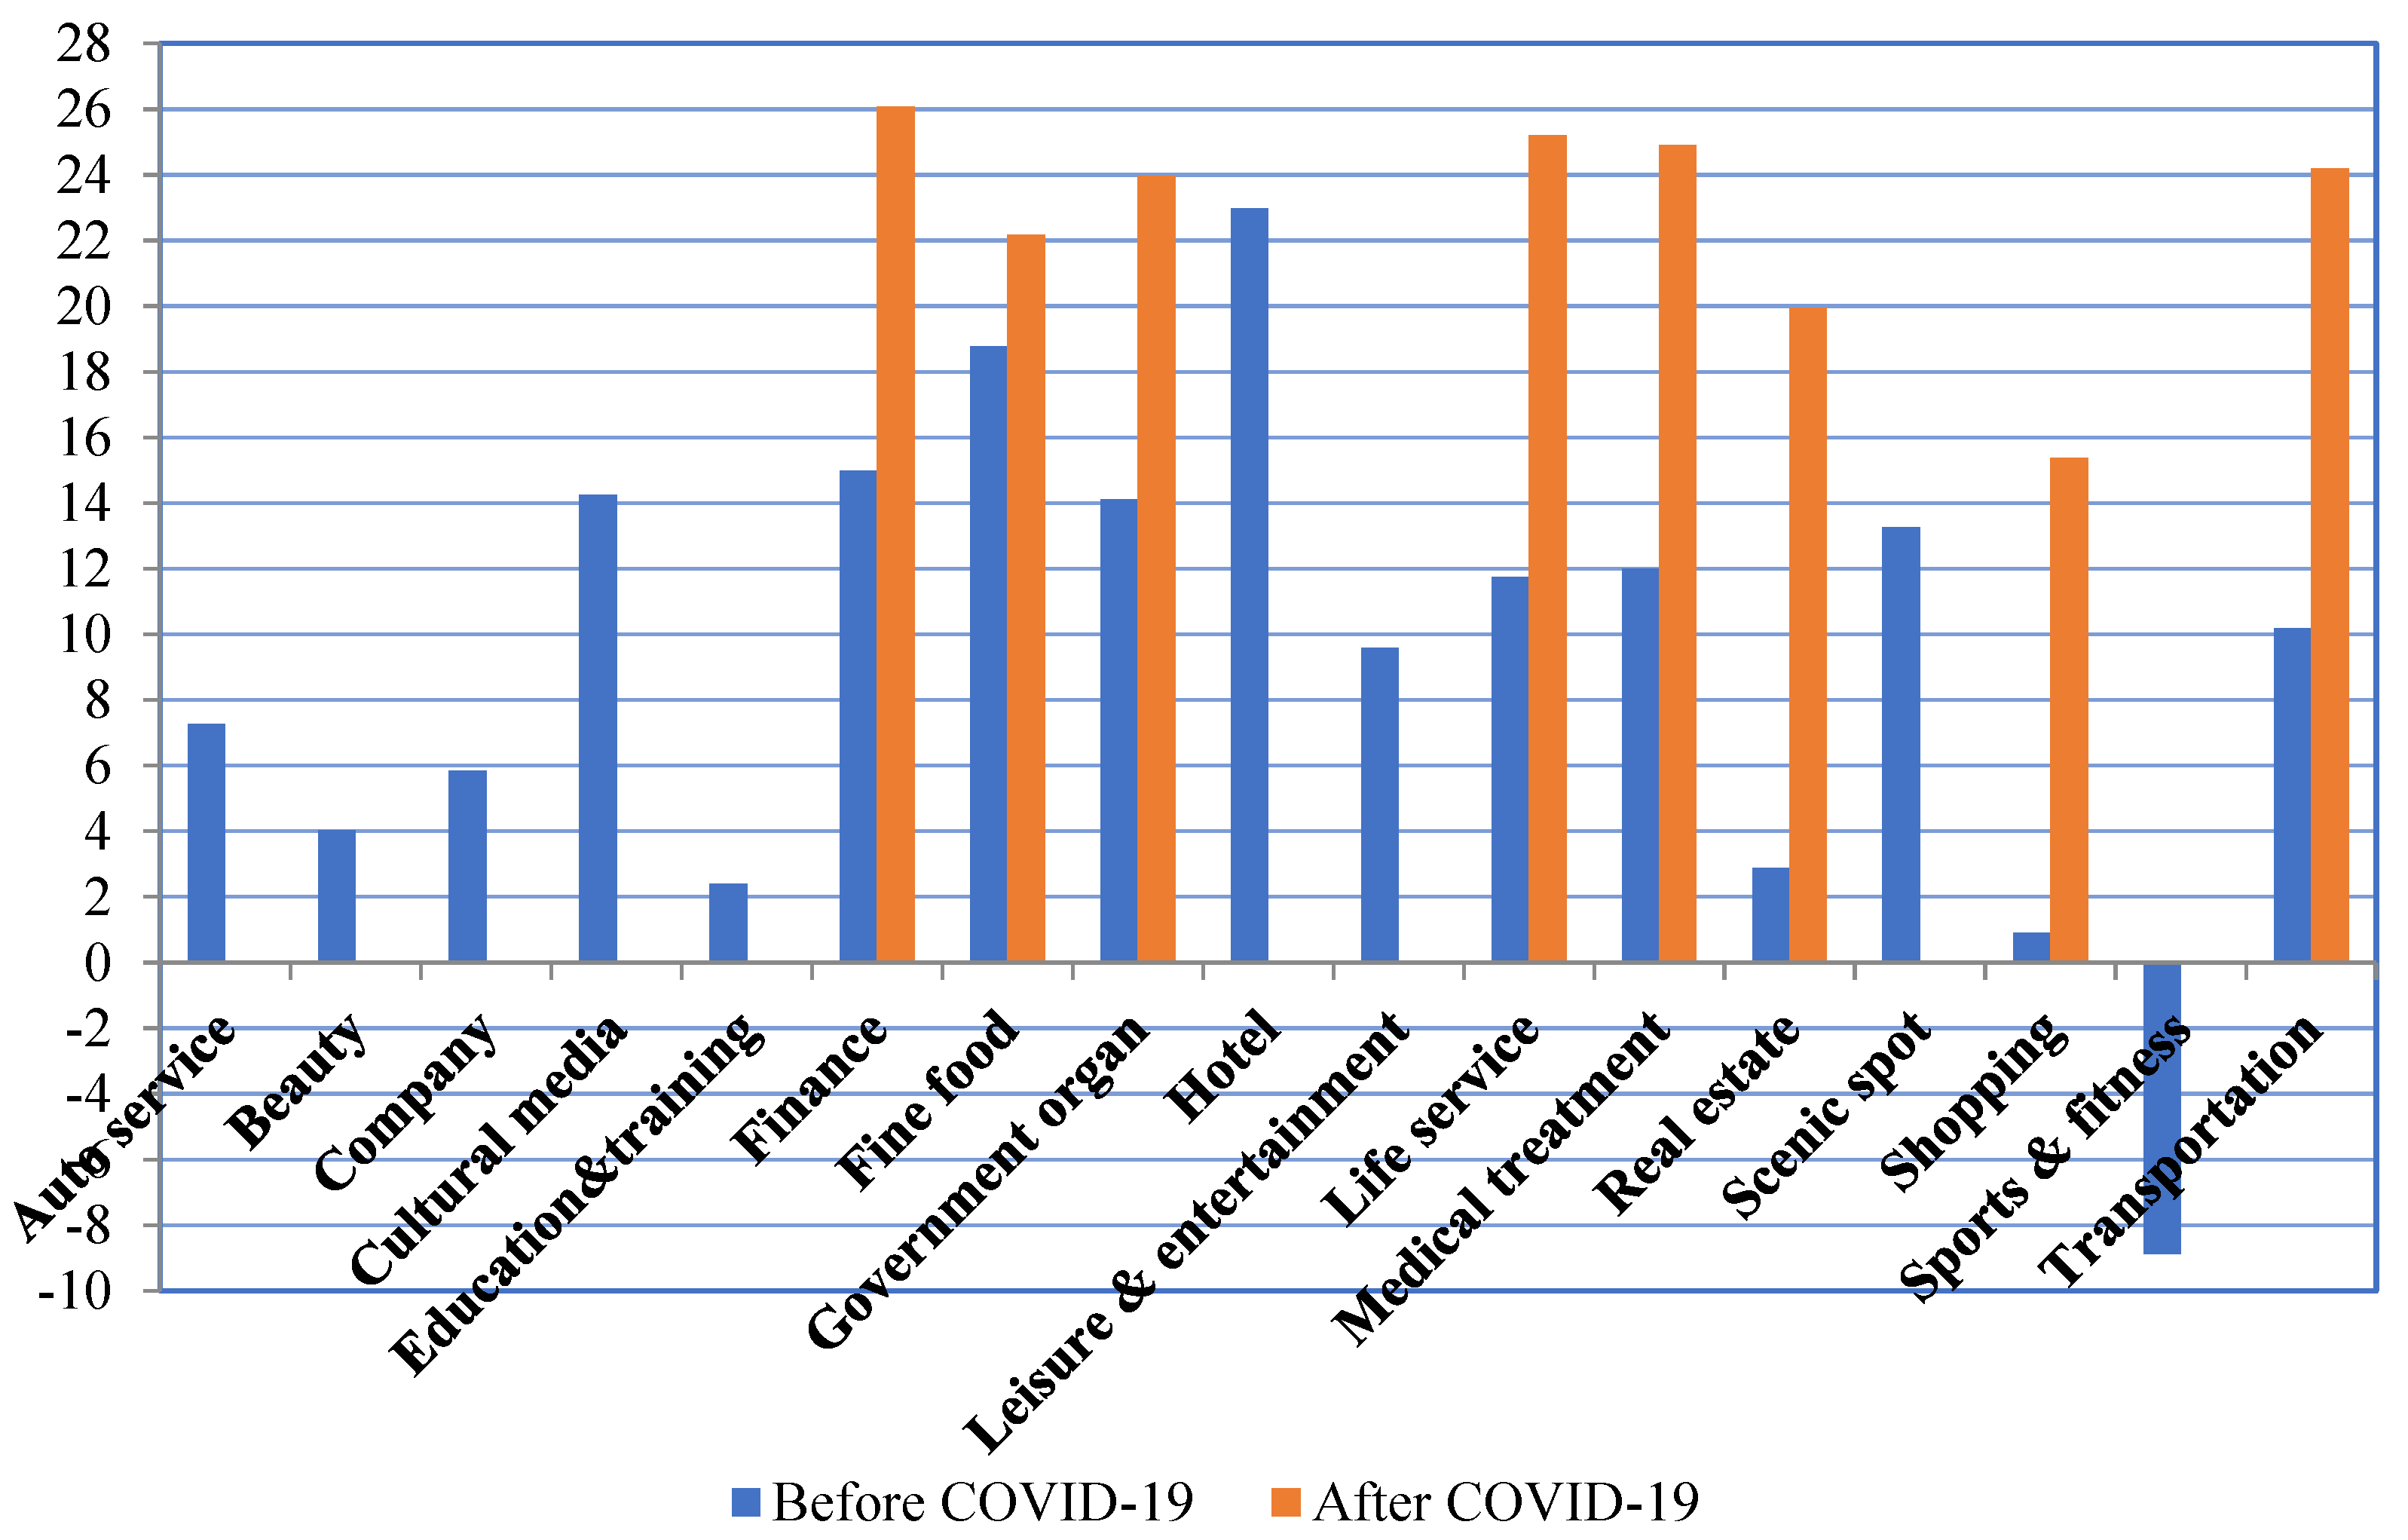
From
Figure 8, before the lockdown of COVID-19, hotel and fine food have the highest mean weighted degree of 22.99 and 18.77, respectively, showing that they have the most obvious spatial agglomeration distribution trend. Finance, cultural media, government department and scenic spot rank second, and the agglomeration trend for sports and fitness and shopping is weak. Under the lockdown of COVID-19, there is the highest mean weighted degree of 26.07 for finance, which means that it has the most significant spatial agglomeration distribution trend. Life service, such as public utility, and medical treatment, such as CDC, clinic, emergency center, hospital, pharmacy and sanatorium, have higher spatial agglomeration distribution trend, while shopping has the lowest one.
Thus, the public service and employment place have most positive correlation with other urban functions, and there is the highest spatial agglomeration distribution trend for the consumption service before the lockdown of COVID-19 in Shenzhen. There is the most positive relationship between public service and government departments and other urban functions, and finance service has the highest spatial agglomeration distribution trend under the lockdown of COVID-19.
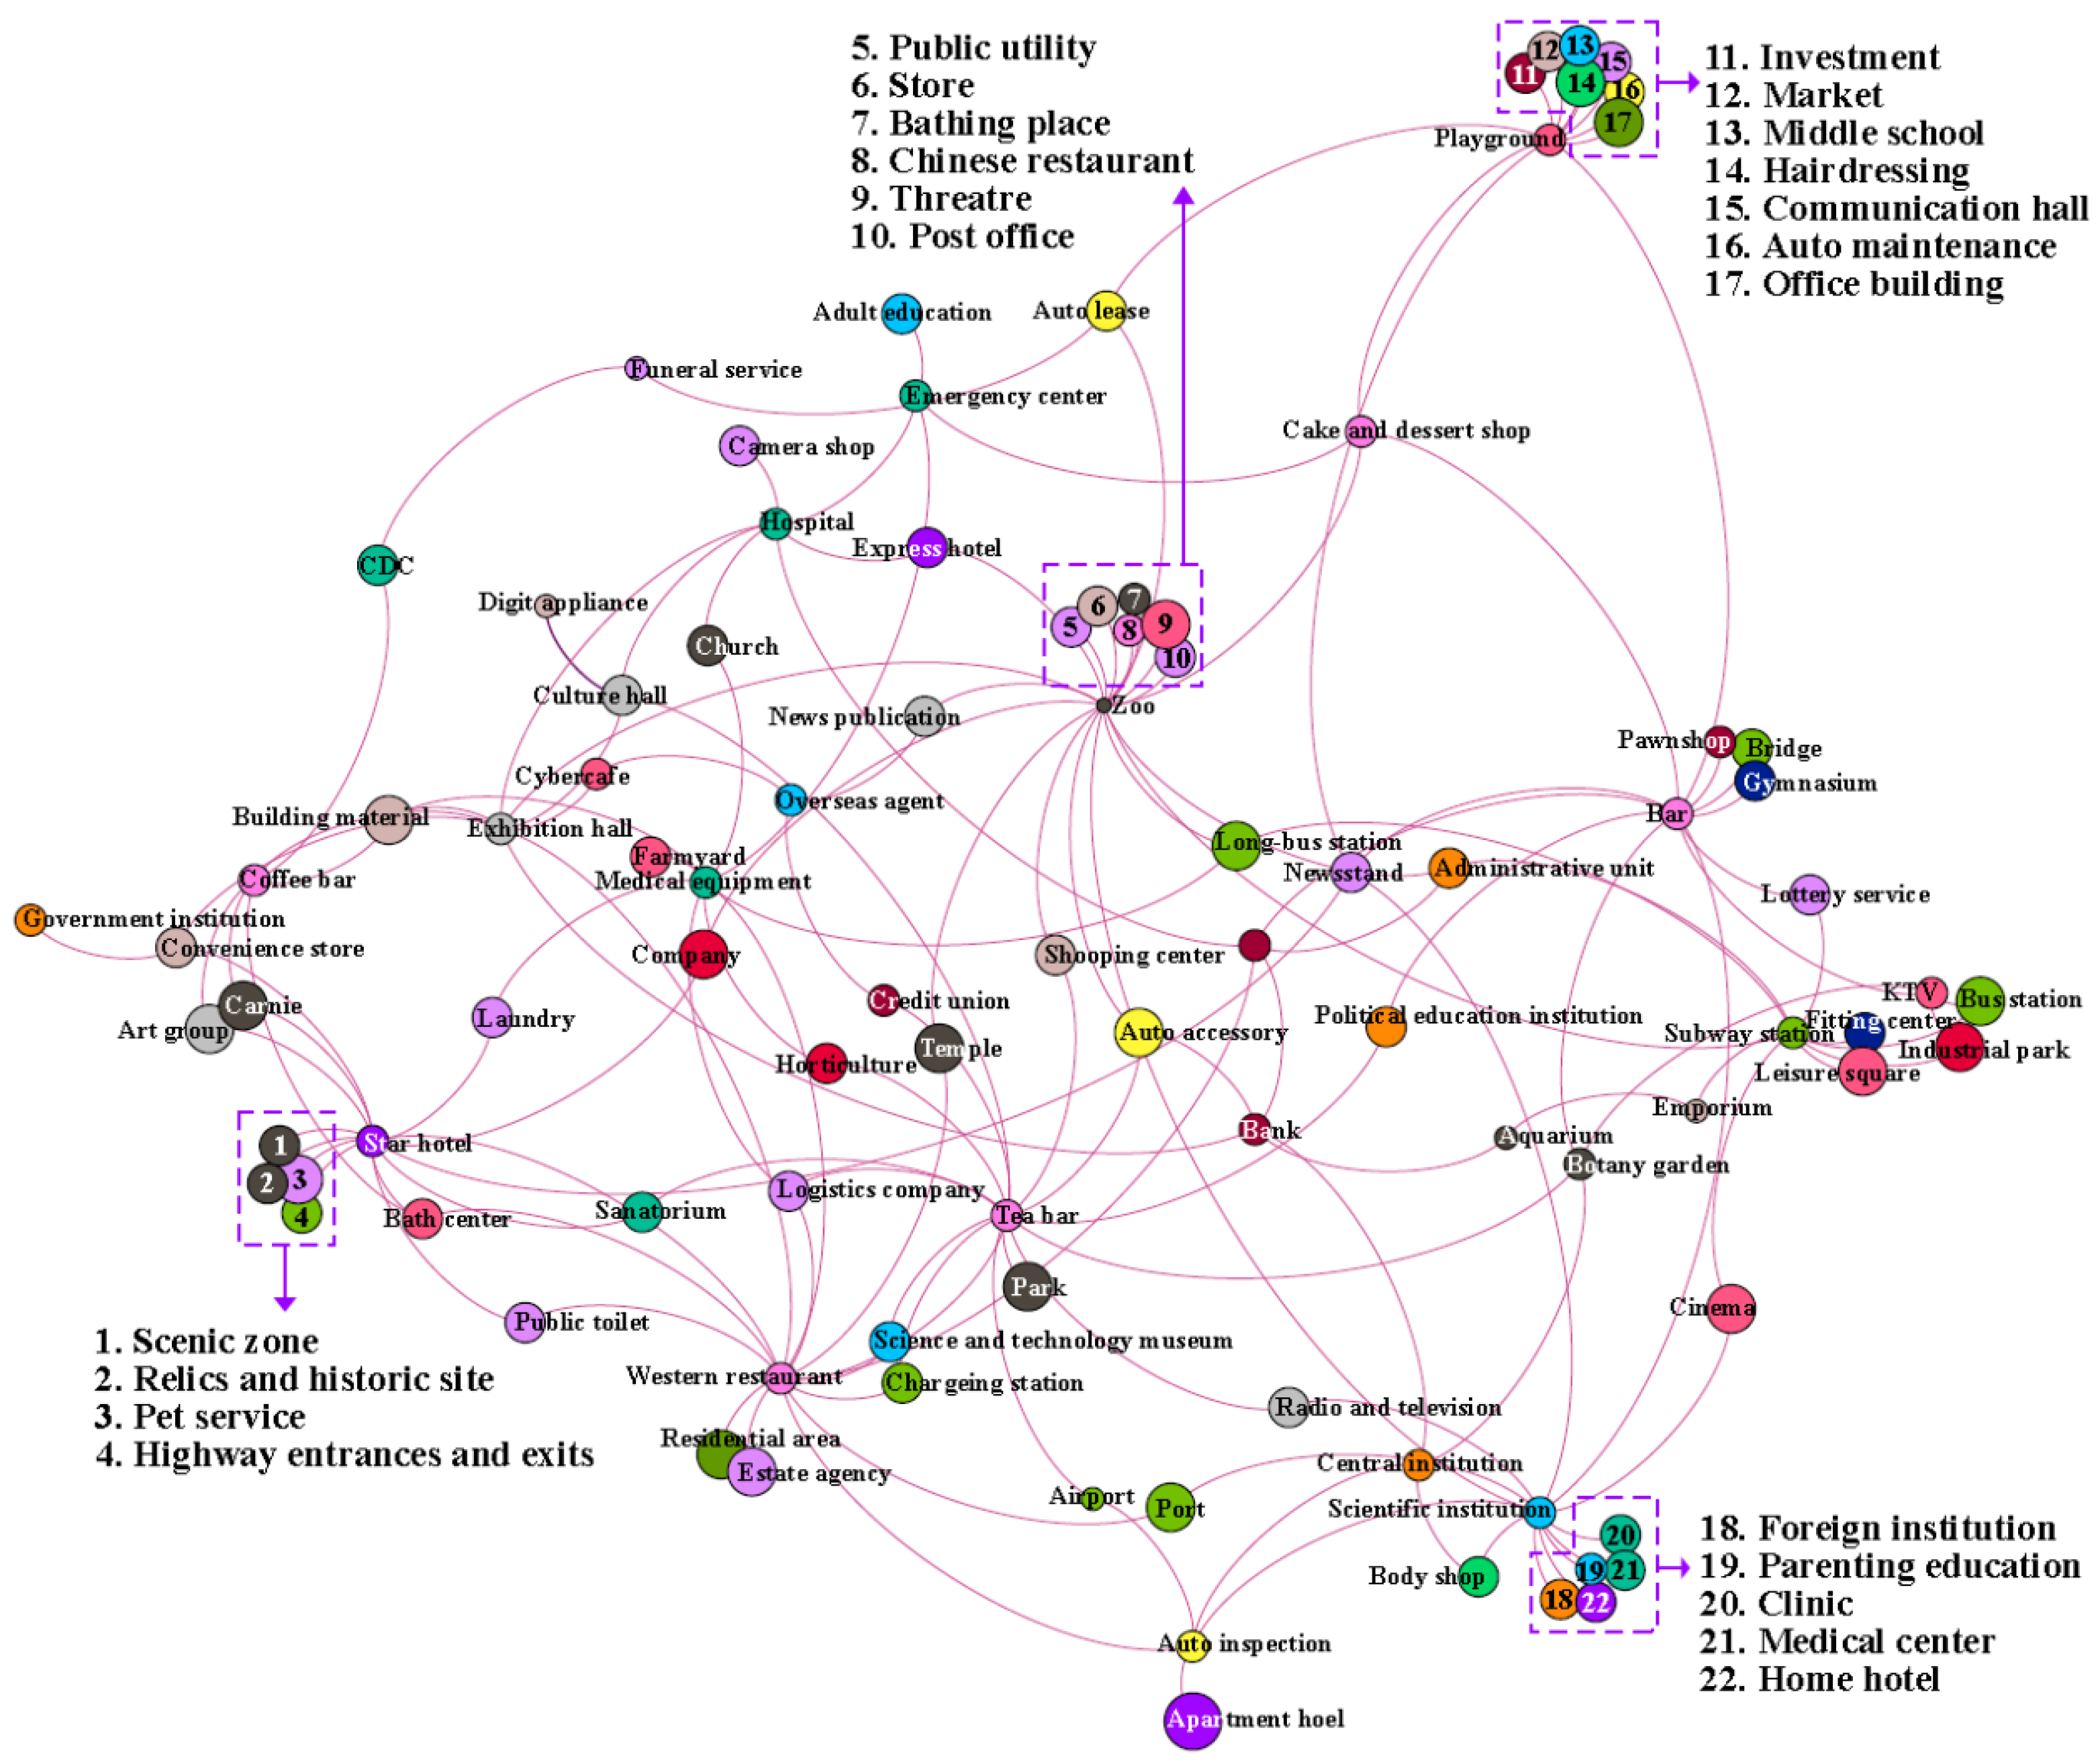
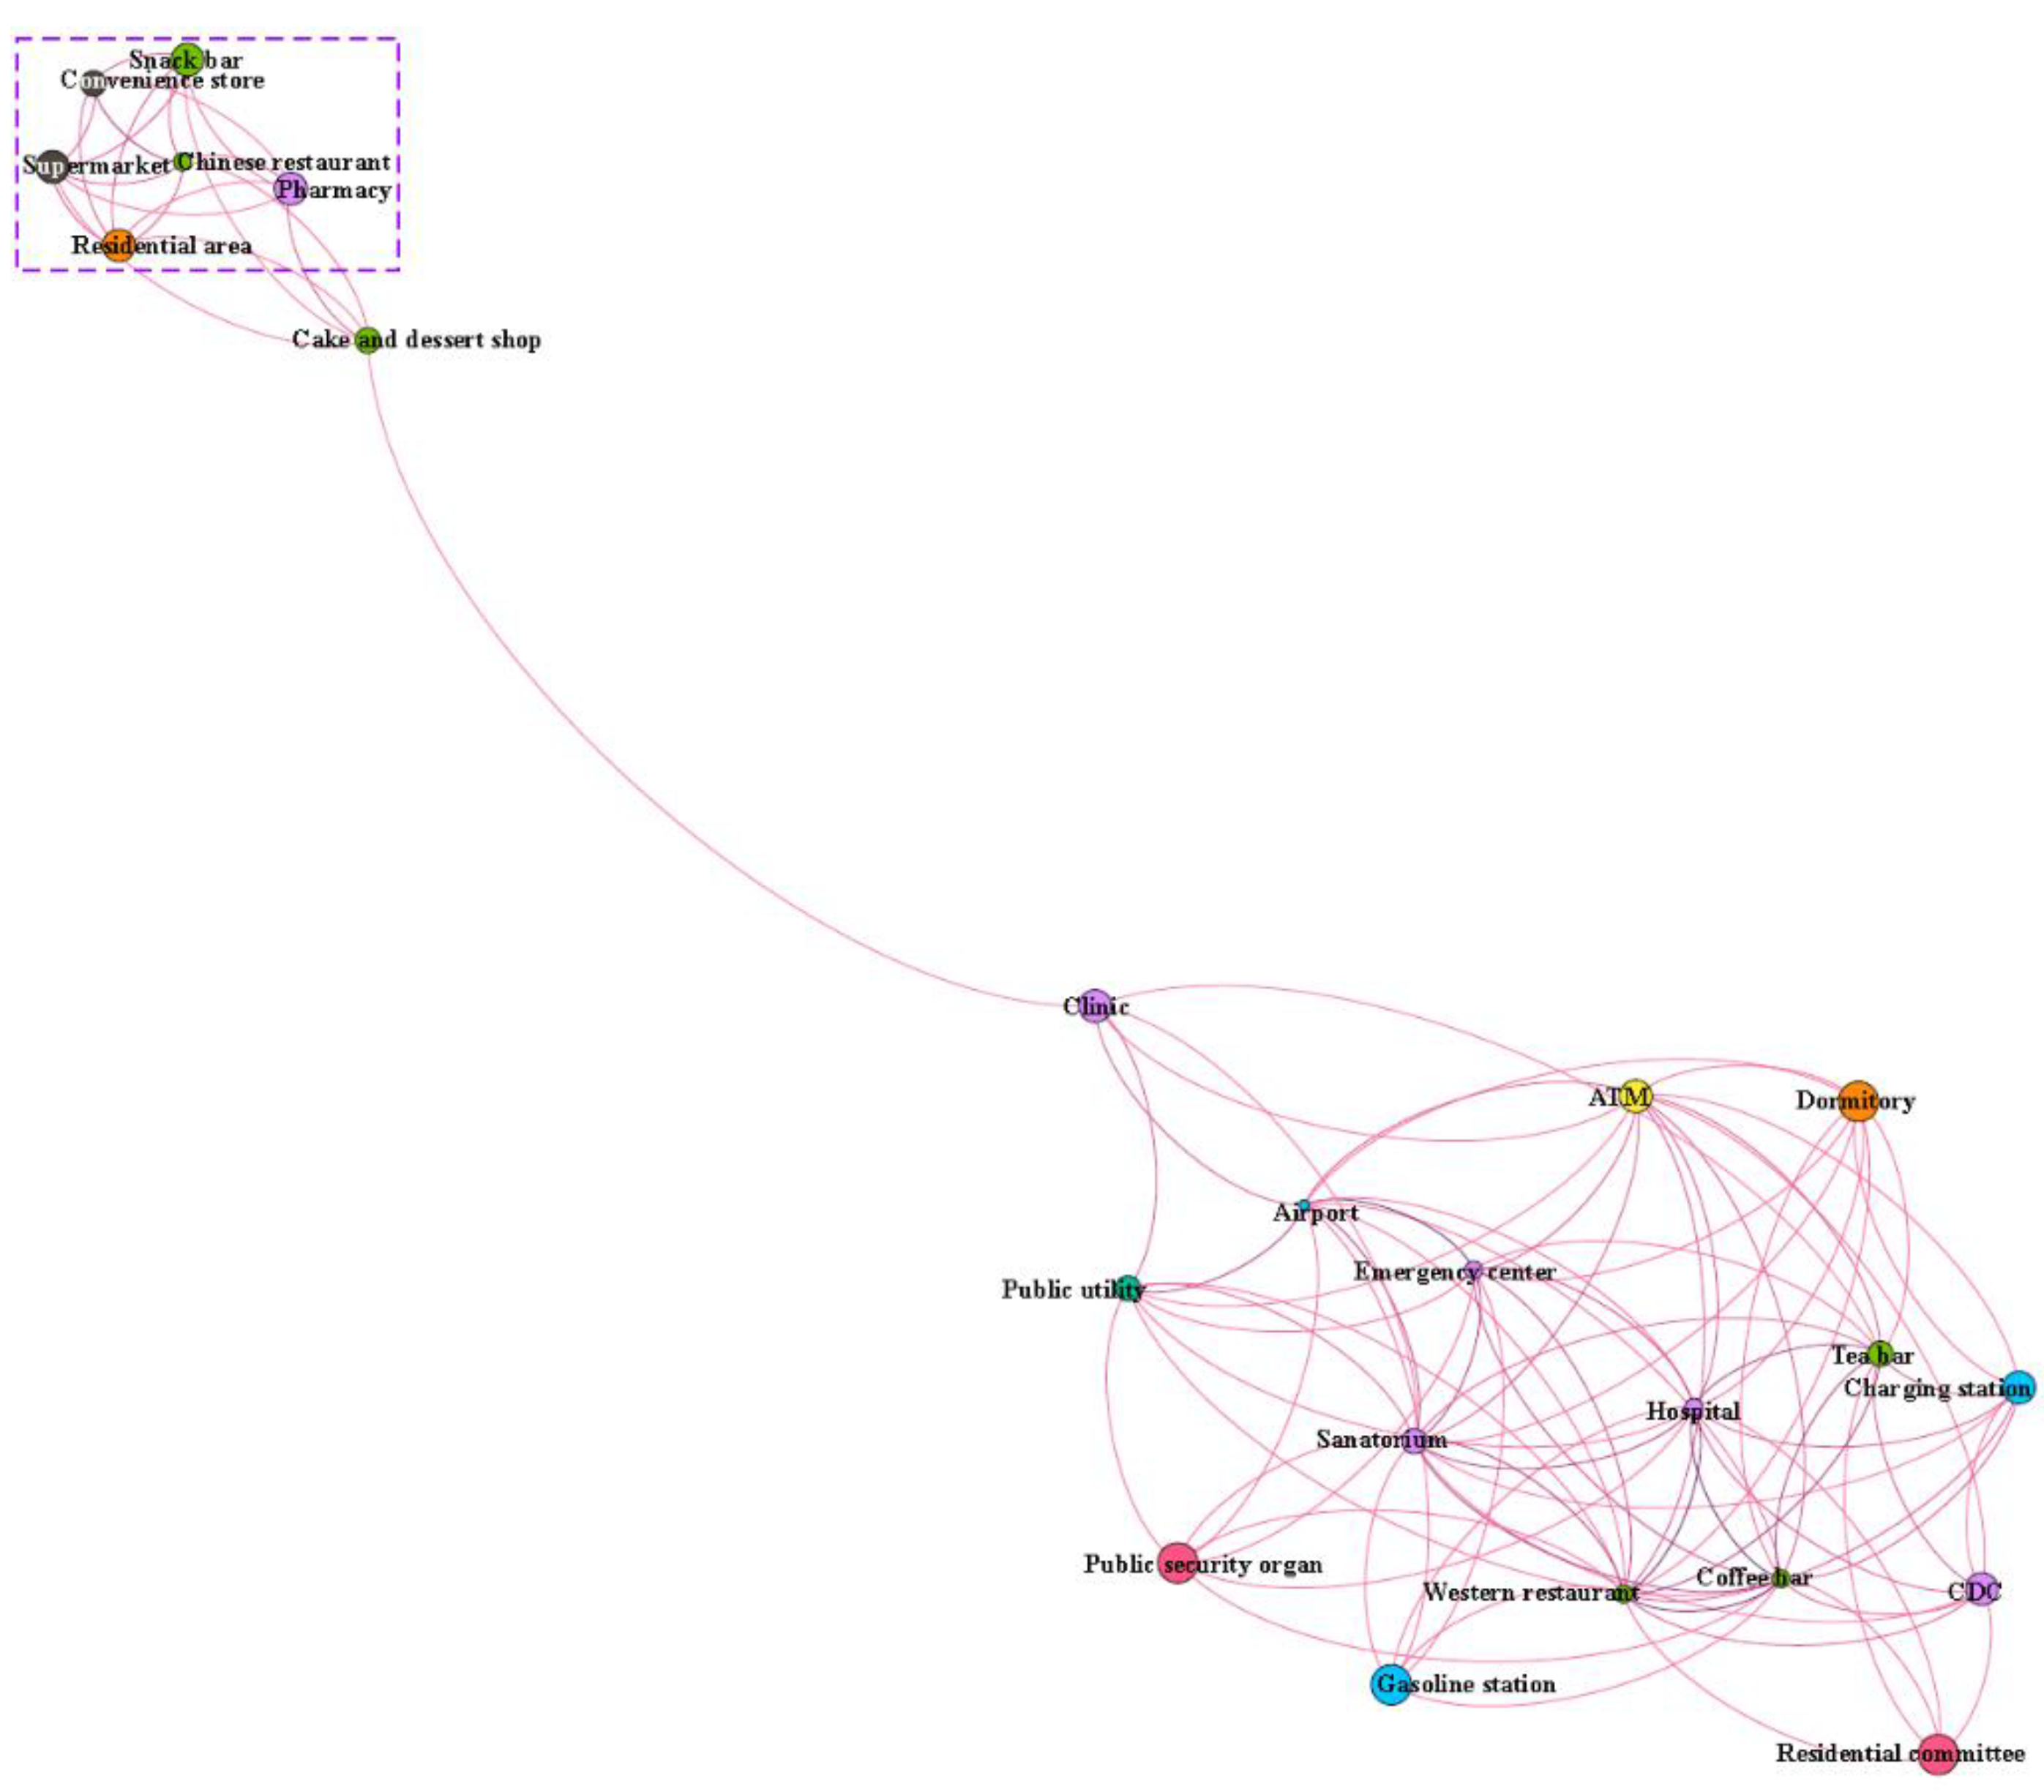
5.4. Cluster Characteristics of Urban Functions
By using Gephi, the complex network of urban function clusters is presented. The cluster characteristics of the urban functions in Shenzhen are analyzed and the node clusters with high internal correlation is discussed based on this complex network. The edge weight of 1.25 and 0.35 is selected as the filtering threshold for establishing the complex networks before and after the lockdown of COVID-19, respectively, because there show the most significant cluster characteristics. The typical clusters of the urban functions before and under the lockdown of COVID-19 are obtained in
Figure 9 and
Figure 10.
In
Figure 9, before the lockdown of COVID-19, there are 4 significant urban function clusters, including the cluster of scenic zone, pet service, relics and historic site, and highway entrances and exits, the cluster of theatre, public utility, store, post office, bathing place, and Chinese restaurant, the cluster of medical center, clinic, parenting foreign institution, education, and home hotel, and the cluster of communication hall, investment, office building, market, auto maintenance, middle school, and hairdressing. It is shown that scenic spots and life services need the support of transportation systems. Leisure and entertainment, shopping, fine food and life services, can constitute a commercial center or commercial integrated community. Health care, education and training, and government agencies can develop public services, which can ensure public participation in social, economic, political and scientific activities, and make the city to be a comprehensive national science center. Finance, real estate, life services, education and training, shopping, beauty and automotive services can form job centers, and strengthen consumer and educational services around job centers in Shenzhen.
In
Figure 10, under the lockdown of COVID-19, one typical cluster of the urban functions is obvious, which is Chinese restaurant, snack bar, convenience store, supermarket, pharmacy and residential area. It is possible that the catering for providing the food and beverage, shopping for daily demands, medical treatment for offering the medical needs of the residents is significantly associated with residential area where large amounts of residents live under the lockdown of COVID-19. Most residents stay at home and cannot go out under the lockdown of COVID-19; thus, they need catering delivery service, shopping service and medical service to maintain the normal life. The rest of the urban functions are relatively scattered and not very clustered.
5.5. Differences and Changes of Urban Functions before and under the Lockdown of COVID-19
5.5.1. Overall Characteristics of Urban Functions
From the interdependencies of the urban functions, for the interdependencies before or under the lockdown of COVID-19, there are more positive interdependencies than negative ones, because the positive ones exceed the half of the total. No matter before or under the lockdown of COVID-19, there are more urban functions possible to be dominant in the same district. However, according to the proportion of each interval and the frequency of the interdependencies, the interdependencies of most urban functions show moderately strong in Shenzhen before the lockdown of COVID-19, and those of most urban functions show stronger under the lockdown of COVID-19. Compared with the correlation of the urban functions before the lockdown of COVID-19, that of the urban functions may become stronger under the lockdown of COVID-19.
From the complex networks of the urban functions before and under the lockdown of COVID-19, there are more common urban functions than rare urban functions. The interdependencies between relatively rare urban functions are positively strong, and those between relatively common urban functions are weak, which means that the common urban functions cannot be easily affected by the change of other functions. Compared with complex network of the urban functions before the lockdown of COVID-19, the smaller nodes decline, which represents the rare urban functions decrease, and common urban functions are more useful and essential under the lockdown of COVID-19. The life service and hotel play important roles in urban development before the lockdown of COVID-19, showing that the service, such as public utility, providing the basic demands for the residents, and hotel representing the well-developed tourism and external exchange are prosperous and necessary in Shenzhen. The finance, fine food and medical treatment are essential under the lockdown of COVID-19, which means that capital demands, basic daily needs, and medical care and aids are more important for lockdown of COVID-19 in Shenzhen.
5.5.2. Classification Characteristics of Urban Functions
The public service and employment place have most positive correlation with others, and the consumption service shows the highest spatial agglomeration distribution trend before the lockdown of COVID-19 in Shenzhen. There is the most positive relationship between public service and government departments and other urban functions, and finance service has the highest spatial agglomeration distribution trend under the lockdown of COVID-19.
Specifically, compared with the mean degree of the primary categories before the lockdown of COVID-19, the government departments, such as public security departments and residential committee, and public utility providing gas, electricity, water, etc. have the most connection with the residents’ needs and society order under the lockdown of COVID-19. The community, such as residential committee, has a positive impact on dealing with the major public health events [
38]. Compared with the mean weighted degree of the primary categories before the lockdown of COVID-19, that of the primary categories increases and the urban functions is more agglomerated under the lockdown of COVID-19. Since the lockdown makes large quantities of urban functions decreases due to stopping operation or shutting down the service, thus the retained urban functions become more agglomerated. The mean weighted degree of real estate rises rapidly, because most people stay at home during the policy of lockdown. The mean weighted degree of finance, government department, life service and medical treatment also increases, especially for life service and medical treatment, because these functions can largely meet the resident’s demands and enlarge the intensity of pandemic prevention measures.
5.5.3. Cluster Characteristics of Urban Functions
Compared with typical clusters before the lockdown of COVID-19, the cluster characteristics of urban functions have the obvious differences under the lockdown of COVID-19.
The various urban functions, such as scenic spot, life service, and transportation; leisure and entertainment, shopping, life service, and fine food; medical treatment, education and training, and government department; and finance, life service, real estate, shopping, education and training, auto service, and beauty, are highly clustered before the lockdown of COVID-19. Only one typical cluster of the urban functions, including Chinese restaurant, snack bar, convenience store, supermarket, pharmacy and residential area, is significant under the lockdown of COVID-19. In this cluster, the core urban function is residential area which is surrounded by catering, shopping and medical treatment. The catering, such as restaurants and food shops, orders food and drinks for the residents. The shopping service, such as supermarket and convenience store, can provide daily necessities, vegetables, fruits, meats, etc. for the residents under the policy of going out for an hour for shopping in two days. The medical treatment, such as pharmacy, can offer the medicines in urgent, pandemic prevention articles and hygienic products such as disinfectant, alcohol spray, etc. Community pharmacies play key roles in medicines, information and safety measures to prevent the spread of COVID-19 [
39].
Thus, under the lockdown of COVID-19, the cluster characteristics of urban functions are more related to people’s livelihood. The urban functions show incomplete and cannot be operated for long term, which is unfavorable for the urban development and sustainability. After the beginning of COVID-19, the lockdown policy should be more relaxed and mildly, unless the society is threatened by the pandemic. The severity, duration and potential economic and health costs of the lockdown depend largely on the ability of the economic system during periods of suspension of economic activity without damaging its structure, as well as measures to improve the ability of the health system to respond to the pandemic [
6].
6. Conclusions
In this paper, the complex networks of urban functions and their clusters are presented. Based on the complex network, the urban functions and the corresponding interdependencies before and under the lockdown of COVID-19 are investigated. The relationship between the urban functions, and the overall, classification and cluster characteristics of the urban functions before and under the lockdown of COVID-19 are discussed. In addition, the differences and changes of the urban functions before and under the lockdown of COVID-19 are compared and analyzed.
The conclusions can be obtained as follows.
- (1)
The correlation of the urban functions is stronger under the lockdown of COVID-19 than that before the lockdown of COVID-19;
- (2)
The common urban functions are more useful and essential, and finance, fine food and medical treatment are important under the lockdown of COVID-19;
- (3)
There is the most positive relationship between public service and government departments and other urban functions, and finance service has the highest spatial agglomeration distribution trend under the lockdown of COVID-19;
- (4)
Under the lockdown of COVID-19, the cluster characteristics of urban functions are more related to people’s livelihood, and the urban functions show incomplete and cannot be operated for long term, which is unfavorable for the urban development and sustainability.
From the results and the discussion, the corresponding policy implications are presented as follows.
Firstly, the government can develop more basic industries or common urban functions, such as the services of catering, shopping, etc., which is more useful and necessary under the special situation of pandemic.
Secondly, some relatively important urban functions without the crowd gathering, such as transportation which can restrict the flow of people, shifts and stations, can be operated under the special situation of pandemic to balance the people’s normal life, government revenues and pandemic prevention. Many people need necessary transportation to go to hospitals or do something urgent, and some staffs working for the basic operation of the city need public transportation to go for work.
Thirdly, the government should restrict the lockdown for a few days which is approximately to a week to maintain the stability of pandemic and the sustainable development of the city. If there is a long lockdown and the urban functions show incomplete under the lockdown, people’s life order, urban normal operation, supply of daily necessities and economy condition will be unbalanced and fall into disorder, such as some diseases going untreated, lack of daily necessities, disorder of work, loss of the sources of income for small cost enterprises, low GDP, etc.
This study can identify the characteristics of the urban functions under the lockdown of COVID-19 and provides some suggestions to ensure the normal order of cities better under the lockdown of COVID-19, which can promote the stable and sustainable development of the cities and improve the balance of people’s life order, urban normal operation and pandemic prevention under the COVID-19.
The methodologies and policy implications of this paper can not only be applied in other cities of China under the lockdown of COVID-19 or other pandemic, but also can offer a reference to other countries all over the world facing the similar lockdown and establish a more complete mechanism to renew the urban functions considering the influence of COVID-19.


