Article

Application of Data Science for Cluster Analysis of COVID-19 Mortality According to Sociodemographic Factors at Municipal Level in Mexico

by
Joaquín Pérez-Ortega
1,*,
Nelva Nely Almanza-Ortega
2,*,
Kirvis Torres-Poveda
3,4,
Gerardo Martínez-González
1,
José Crispín Zavala-Díaz
5 and
Rodolfo Pazos-Rangel
6
1
Tecnológico Nacional de México/CENIDET, Cuernavaca 62490, Mexico
2
Tecnológico Nacional de México/IT de Tlalnepantla, Tlalnepantla de Baz 54070, Mexico
3
Centro de Investigación Sobre Enfermedades Infecciosas, Instituto Nacional de Salud Pública, Cuernavaca 62100, Mexico
4
CONACyT-Instituto Nacional de Salud Pública, Cuernavaca 62100, Mexico
5
Administración e Informática, Facultad de Contaduría, Universidad Autónoma de Morelos, Cuernavaca 62209, Mexico
6
Tecnológico Nacional de México/IT de Cd. Madero, Madero 89440, Mexico
*
Authors to whom correspondence should be addressed.
Mathematics 2022, 10(13), 2167; https://doi.org/10.3390/math10132167
Submission received: 14 May 2022 / Revised: 16 June 2022 / Accepted: 19 June 2022 / Published: 22 June 2022

Abstract

:
Mexico is among the five countries with the largest number of reported deaths from COVID-19 disease, and the mortality rates associated to infections are heterogeneous in the country due to structural factors concerning population. This study aims at the analysis of clusters related to mortality rate from COVID-19 at the municipal level in Mexico from the perspective of Data Science. In this sense, a new application is presented that uses a machine learning hybrid algorithm for generating clusters of municipalities with similar values of sociodemographic indicators and mortality rates. To provide a systematic framework, we applied an extension of the International Business Machines Corporation (IBM) methodology called Batch Foundation Methodology for Data Science (FMDS). For the study, 1,086,743 death certificates corresponding to the year 2020 were used, among other official data. As a result of the analysis, two key indicators related to mortality from COVID-19 at the municipal level were identified: one is population density and the other is percentage of population in poverty. Based on these indicators, 16 municipality clusters were determined. Among the main results of this research, it was found that clusters with high values of mortality rate had high values of population density and low poverty levels. In contrast, clusters with low density values and high poverty levels had low mortality rates. Finally, we think that the patterns found, expressed as municipality clusters with similar characteristics, can be useful for decision making by health authorities regarding disease prevention and control for reinforcing public health measures and optimizing resource distribution for reducing hospitalizations and mortality.

1. Introduction

The public health impact of the ongoing COVID-19 pandemic has been estimated globally by the number of reported COVID-19 deaths and estimates of excess mortality in different populations and locations [1].
Given the availability of public epidemiological data on COVID-19 in many countries, several studies have focused on the analysis of patterns of similarity in incidence and mortality rates of COVID-19 and clustering by geographical areas [2,3]. Some of the approaches of these studies have been the analysis of temporal trends of mortality rates [4,5,6,7] as well as the identification of geospatial patterns and critical points of mortality rates and their relationship with socioeconomic, political and environmental variables [8,9,10,11]. A recent study evaluated the spatial pattern of the COVID-19 mortality rate as well as hotspots and health and socioeconomic predictor variables in contiguous United States counties, finding that hotspots for COVID-19 mortality 19, as well as socioeconomic variables, are primarily delineated in the south, Midwest, and northeast of the contiguous United States. COVID-19 mortality exhibited a positive and significant association with poverty, black race, and minority ethnicity [12].
Additionally, in most studies, the exploration of clustering algorithms has been performed to predict the risk of spreading COVID-19 [13,14,15,16,17,18,19,20]. Some studies have used clustering algorithms to analyze COVID-19 mortality data for various countries and territories [21,22,23,24,25]. Of these studies, only one has been carried out in the Latin American region, in which groups were formed within ten South American countries according to the number of infected cases and deaths from COVID-19 through principal component analysis [25].
Mexico is the country ranked fifth with the highest number of COVID-19 deaths in the world, after the United States, Brazil, India and Russia, with 324,334 deaths recorded as of early May 2022 [26]. The most recent estimate of sex- and age-specific case fatality rate for COVID-19 in Mexico was reported at 0.47% considering deaths based on death certificates up to November 2020 and 0.30% using sentinel surveillance-based deaths, which is comparable with Infection case Fatality Rates (IFR) observed in countries such as Brazil [27]. Likewise, a great heterogeneity of IFRs has been reported within the country [28], so structural factors of the population such as population density and socioeconomic level [29] and the response of the system could be influencing this heterogeneity [30,31].
In the context of Mexico, to the best of our knowledge, few studies have explored the characterization of the geographic patterns of mortality for COVID-19 as well as the socioeconomic determinants that could be related to the mortality clusters found. The exploration has been at the state level with excess data of mortality and risk of death among individuals diagnosed with COVID-19 until April 2020. In 2021, Dahal et al. evaluated the geospatial variability of all-cause excess mortality at the state level and its relationship to sociodemographic and climatic factors using Serfling regression models and multiple linear regression analyses [32]. Additionally, in 2021, Ramírez et al. analyzed the risk of mortality from COVID-19 and its association with spatial predictors at the state level. This was carried out using statistical methods and spatial clustering through local indicators of spatial autocorrelation [9].
Therefore, the objective of this research was to perform cluster analysis of COVID-19 mortality related to sociodemographic factors at the municipal level in Mexico. We used the hybrid variant OK-means++ clustering algorithm to determine not only one but a set of factors that altogether could be considered as the main determinants related to the mortality clusters. To this end, we selected 1,086,743 available death certificates from the year 2020, census data for 2020, geographic and socioeconomic information of 2469 municipalities, among other official data sets. From our experiments, we identified two relevant factors that correspond to two indicators: population (density) and poverty percentage for municipalities. Based on the two indicators, a set of clustering experiments was designed and implemented using different parameter configurations. For each solution, the mean mortality rate for cluster was determined. The solution whose clusters had the best separation of values of the mortality average were selected. As a result of analyzing the best clustering solutions, on the one hand, it was found that the clustering with high population density and low poverty level had a high COVID-19 mortality rate. On the other hand, clustering with low population density and high poverty level had a low mortality rate. We think that our analysis approach is simple and applicable to other countries, in particular those of Latin America because they have conditions that are similar to those of Mexico.
The results of this study, using a methodology that combines the most relevant aspects of epidemiology within a Data Science framework, provide valuable information about relations between mortality due to COVID-19 and sociodemographic factors at the municipal level in Mexico.
The structure of this article is organized as follows. Section 2 elaborates the detailed methodologies. Section 3 reports the results obtained from cluster analysis, discusses the main results of the study, and described the strengths and limitations. Conclusions and ideas for future research are given in Section 4.

2. Methodology

Data Science is an emerging discipline with few development methodologies. According to [33], there are two methodologies proposed by the industry: the Team Data Science Process [34] proposed by Microsoft (Redmond, WA, USA) and the Foundation Methodology for Data Science proposed by IBM (Armonk, NY, USA). Microsoft’s methodology has a high link with its commercial products, while IBM’s methodology does not show a direct link with its products, which makes it more general.
For carrying out this research, we relied on the Batch FMDS [35] methodology, which is a variant of the methodology proposed by IBM [36]. Specifically, in this article, basic concepts of epidemiology were combined with particularities of data preparation and modeling of Data Science. In this way, we followed a systematic process that allowed us to have a better understanding of the mortality indicators for COVID-19 in Mexico at the municipal level. Figure 1 shows the sequence of tasks from posing the research question in the Business understanding task to Data visualization and Knowledge extraction. The following subsections describe the tasks of Business understanding, Data collection, Data preparation, and Modeling.

2.1. Business Understanding

According to the Data Science methodology, it is necessary at the project outset to formulate the research question and objectives.
The question of this research was the following: what sociodemographic factors have in common those municipalities clusters in Mexico for COVID-19 in the year 2020?
The objective of the research consisted in applying a methodological approach of Data Science for generating clusters of Mexican municipalities with similar determinant sociodemographic indicators and mortality rates for COVID-19 in 2020.

2.2. Data Collection

For our study, data from six official sources were obtained. Table 1 includes the name of the source or responsible institution, the name of the dataset used, and the number of records of each dataset.

2.3. Data Preparation

This subsection describes the criteria for data inclusion and exclusion as well as its preprocessing for creating a data warehouse.
Those municipalities with populations smaller than 100,000 inhabitants were excluded as well as those that did not have recorded deaths from COVID-19. The number of municipalities selected for this study was 233.
Regarding death records, the deaths included were those whose death code was U071 (COVID-19, virus identified) or U072 (COVID-19, virus not identified) and whose normal residence was one of the municipalities selected. Records whose age attribute was smaller than 15 years were excluded.
Table 2 shows for each dataset which attributes were selected for the study.
For each municipality, the mortality rate for COVID-19 was calculated for each 100,000 inhabitants for the year 2020 by using Formula (1):
r a t e = d e a t h p o p u l a t i o n 100,000
The calculation of population density was calculated by using information of the total population and the area of the municipality and using Formula (2):
p o p u l a t i o n   d e n s i t y = l a n d   a r e a p o p u l a t i o n
The values of latitude, longitude, average age, percentage of inhabitants in poverty, and mortality rate were normalized according to Formula (3):
X = x x m i n x m a x x m i n
  • x = to be normalized
  • xmax = maximal value
  • xmin = minimal value
As a result of the preparation of data, the data warehouse was built as shown in Table 3.

2.4. Modeling

In this step, tests were conducted using different algorithms for making sure that the variables used were really necessary. The success of data collection, preparation and modeling depends on the understanding of the problem and the adequate analytic approach selected.
It is known that several techniques for the analysis of clusters have been used successfully for increasing the knowledge on the COVID-19 disease from large datasets that have been collected. Some of these techniques are hierarchical and partitional algorithms. Examples of partitional algorithm are Fuzzy C-means, K-medoids and K-means. The K-means algorithm has been preferred above other clustering algorithms because of the ease that it provides for interpreting its results and its theoretical foundation [3]. In particular, it has been used in several research studies on contagion and mortality from COVID-19 [7,22,23,43,44,45,46]. In most of the research projects, computational implementations of the standard K-means have been used, which are included in software packages such as SPSS and Statistica or are implemented in languages such as R and Python [7,22,44,45,46].
In contrast, in this article, we are proposing a new hybrid variant of the K-means clustering algorithm [47,48,49], which based on experimental results, outperforms the standard algorithm concerning solution quality and number of iterations (or computational time). This variant, which we will call OK-means++, integrates an algorithm for the optimized selection of the initial centroids, called k++ [50], and an algorithm for accelerating the convergence of the K-means algorithm called OK-means [51].
The K-means clustering algorithm is one of the most important, widely studied and utilized algorithms [49,52]. Its popularity is mainly due to the ease that it provides for the interpretation of results. This algorithm is an iterative method that consists in partitioning a set of n objects into k ≥ 2 clusters, so that the objects in one cluster are similar to each other and different from those of other clusters [51]. The formulation of the K-means algorithm is described next:
Let X = {x1, …, xn} be the set of n objects to be partitioned according to a similarity criterion, where xi ∈ ℜd for i = 1, …, n and d ≥ 1 is the number of dimensions. Additionally, let k ≥ 2 be an integer number and K = {1, …, k}. For a k-partition P= {G(1), …, G(k)} of X, vj denotes the center of cluster G(j), for jK, and let V = {v1, …, vk} and W = {w11, …, wij}.
Expression (4) shows the clustering problem as an optimization problem [53]:
P :   minimize   z ( W , V ) = i = 1 n j = 1 k w i j D ( x i , v j )
subject   to j = 1 k w i j = 1 ,   for   i = 1 , , n ,
wij = 0 or 1, for i = 1, …, n and j = 1, …, k,
where wij = 1 ⇔ object xi is a member of cluster G(j) and D(xi, vj) denotes the Euclidian distance between xi and vj for i = 1, …, n and j = 1, …, k.
The k++ algorithm, proposed in [50], initializes the cluster centroids of the K-means algorithm by selecting objects from the set of data that are the farthest from each other in a probabilistic way. This method accelerates convergence, thus theoretically guaranteeing it to be O(log k).
The OK-means algorithm [51] accelerates the convergence process by stopping the algorithm when the number of objects that change cluster membership in an iteration is smaller than a threshold. The value of the threshold expresses a relation between the computational effort and the solution quality.
The pseudocode of the hybrid variant OK-means++ is shown in Algorithm 1. Given a set of data X and the value of k, it generates the optimized set of centroids (lines 1–9) according to algorithm k++. From lines 10 through 23, the pseudocode of the OK-means algorithm is shown. At line 10, the threshold value is assigned for the OK-means algorithm, which in our case was set to 0.72. At line 15, γ represents the percentage of objects that change cluster membership at iteration t, and it was calculated as follows: γt = 100(ot/n), where ot is the number of objects that change cluster membership.
Algorithm 1: OK-means++.
1Initialization:
2  X:= {x1, …, xn};
3  Assign the value for k;
4  V:= Ø;
5  V:= V U {v1};//Select randomly the first centroid v1 from set X.
6  for i = 2 to k do
7    Select the i-th centroid vi from X with probability D(xi, vj)/∑xϵX D(xi, vj);
8    V:= V U {vi};
9  V:= {v1, …, vk};
10  ɛok:= value of the threshold for determining the convergence;
11Classification:
12  for xi ϵ X and vk ϵ V do
13    Calculate the Euclidian distance from each xi to the k centroids;
14    Assign object xi to the closest centroid vk;
15    Calculate γ;
16Centroid calculation:
17  Calculate the new centroids of set V;
18Convergence:
19  if (γɛok) then
20    Stop the algorithm;
21  else
22    Go to Classification
23End of algorithm
The experimental analyses with the OK-means++ algorithm performed here were carried out using a computer with the following characteristics: (i) OS: Windows 10 Home; (ii) RAM: 8 Gigabytes; and (iii) Processor: Intel® CoreTM i7-7700. The OK-means++ algorithm was implemented by the authors in C language using the GCC 7.4.0 compiler.
For the visualization, a computer with the following characteristics was used: (i) OS: Windows 10 for 64 bits; (ii) RAM: 16 Gigabytes; (iii) Processor: 11th Gen intel(R) Core (TM) i7-1165G7. To display the municipalities on a map of the Mexican Republic, the software package “Mapa Digital de México para escritorio versión 6.3” [54] was used.

3. Applications

This section is divided into two subsections, the Results and the Discussion. The first shows the results of the Cluster analysis, Data visualization and Knowledge extraction tasks. In the second subsection, we contrast our results with other related research.

3.1. Results

In this subsection, the main results obtained from cluster analysis are described. Several clustering experiments were conducted using different configurations and attributes. For example, experiments were performed which included the latitude, longitude and altitude of municipalities; however, it was not found that they were determinant, so they were excluded. In particular, it was observed that population density and percentage of population in poverty were determinant for generating clusters whose elements had similar values of mortality rate for COVID-19.
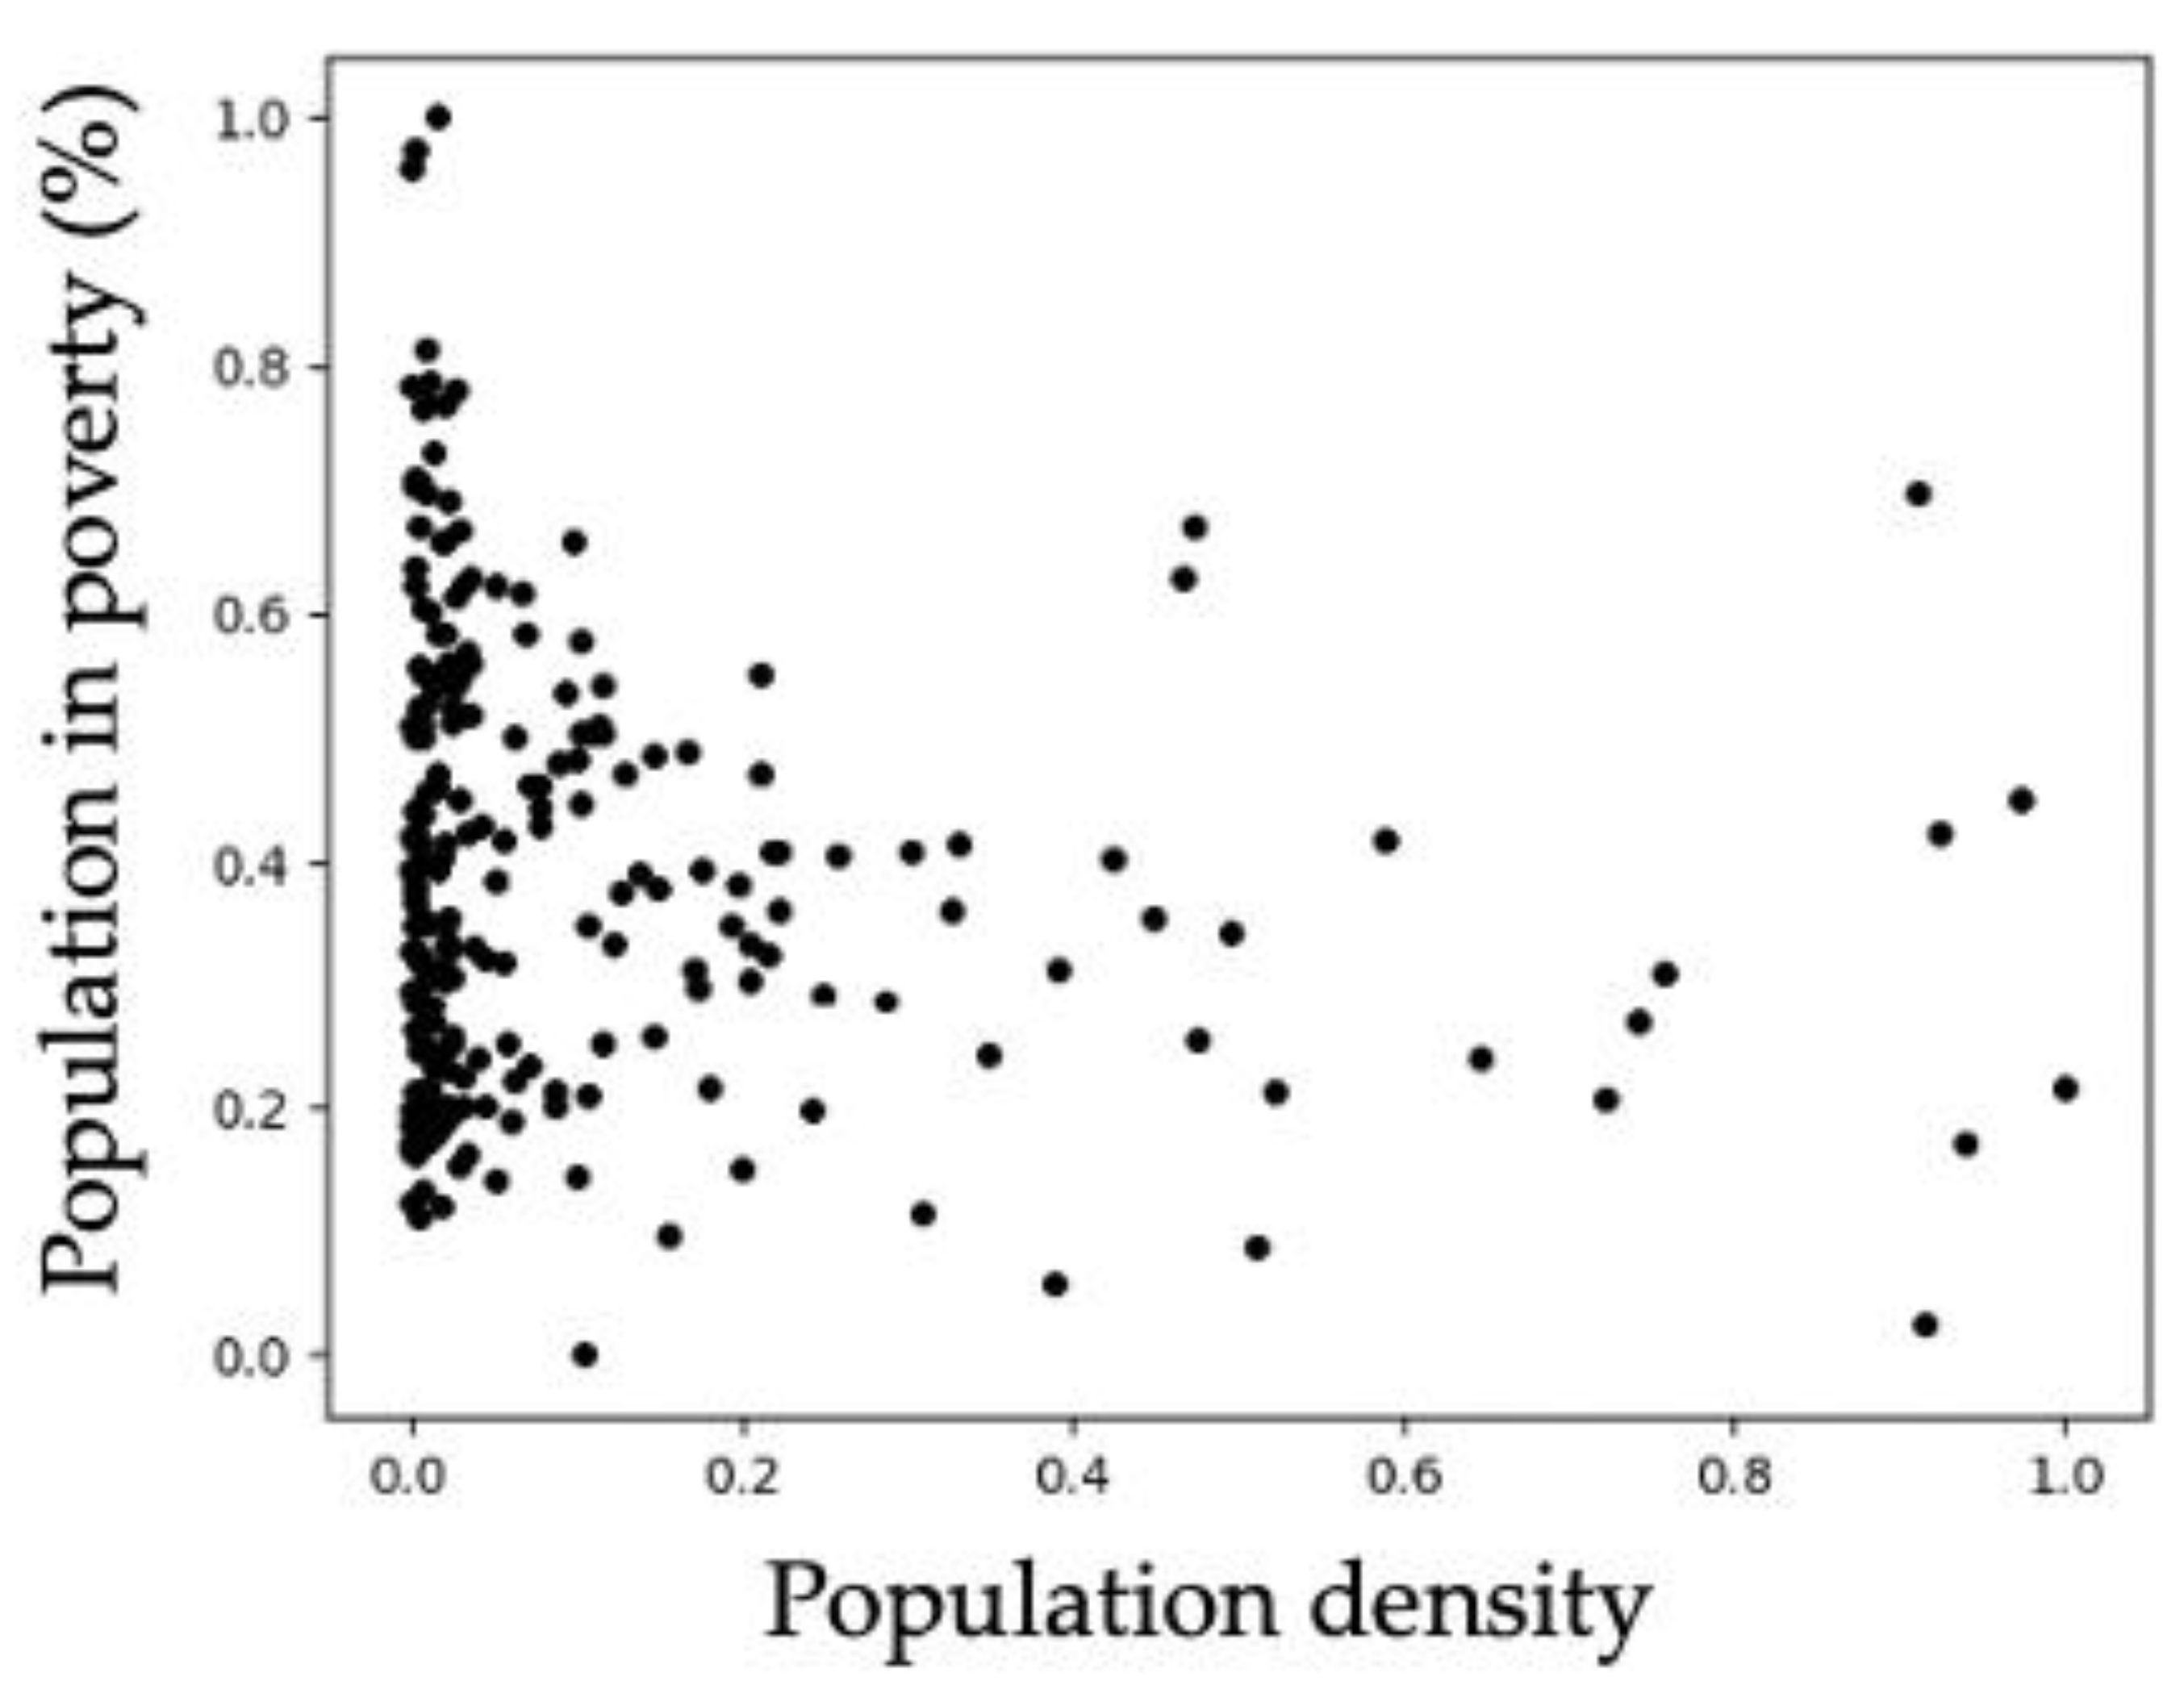
For visualizing the distribution of municipalities according to population density and poverty percentage, the graph of Figure 2 was generated, which shows municipalities represented by dots. The values of the attributes are normalized in the range from 0 to 1. Notice that most of the dots have low values of population density. Additionally, the dots show that the values of poverty are more dispersed.
Table 4 shows the clustering results for 233 municipalities in a partition of 16 clusters. The first three rows correspond to the clusters with the highest mortality rates, and the last three rows correspond to the lowest mortality. These clusters are called extreme clusters. The first column contains the cluster identifier, the second and third columns include the cluster centroids, which have population density and percentage of poverty as attributes. The fourth column shows the number of municipalities in each cluster, and the last column includes the average mortality rate of the municipalities in the cluster. The values of the last two columns were determined after the clustering.
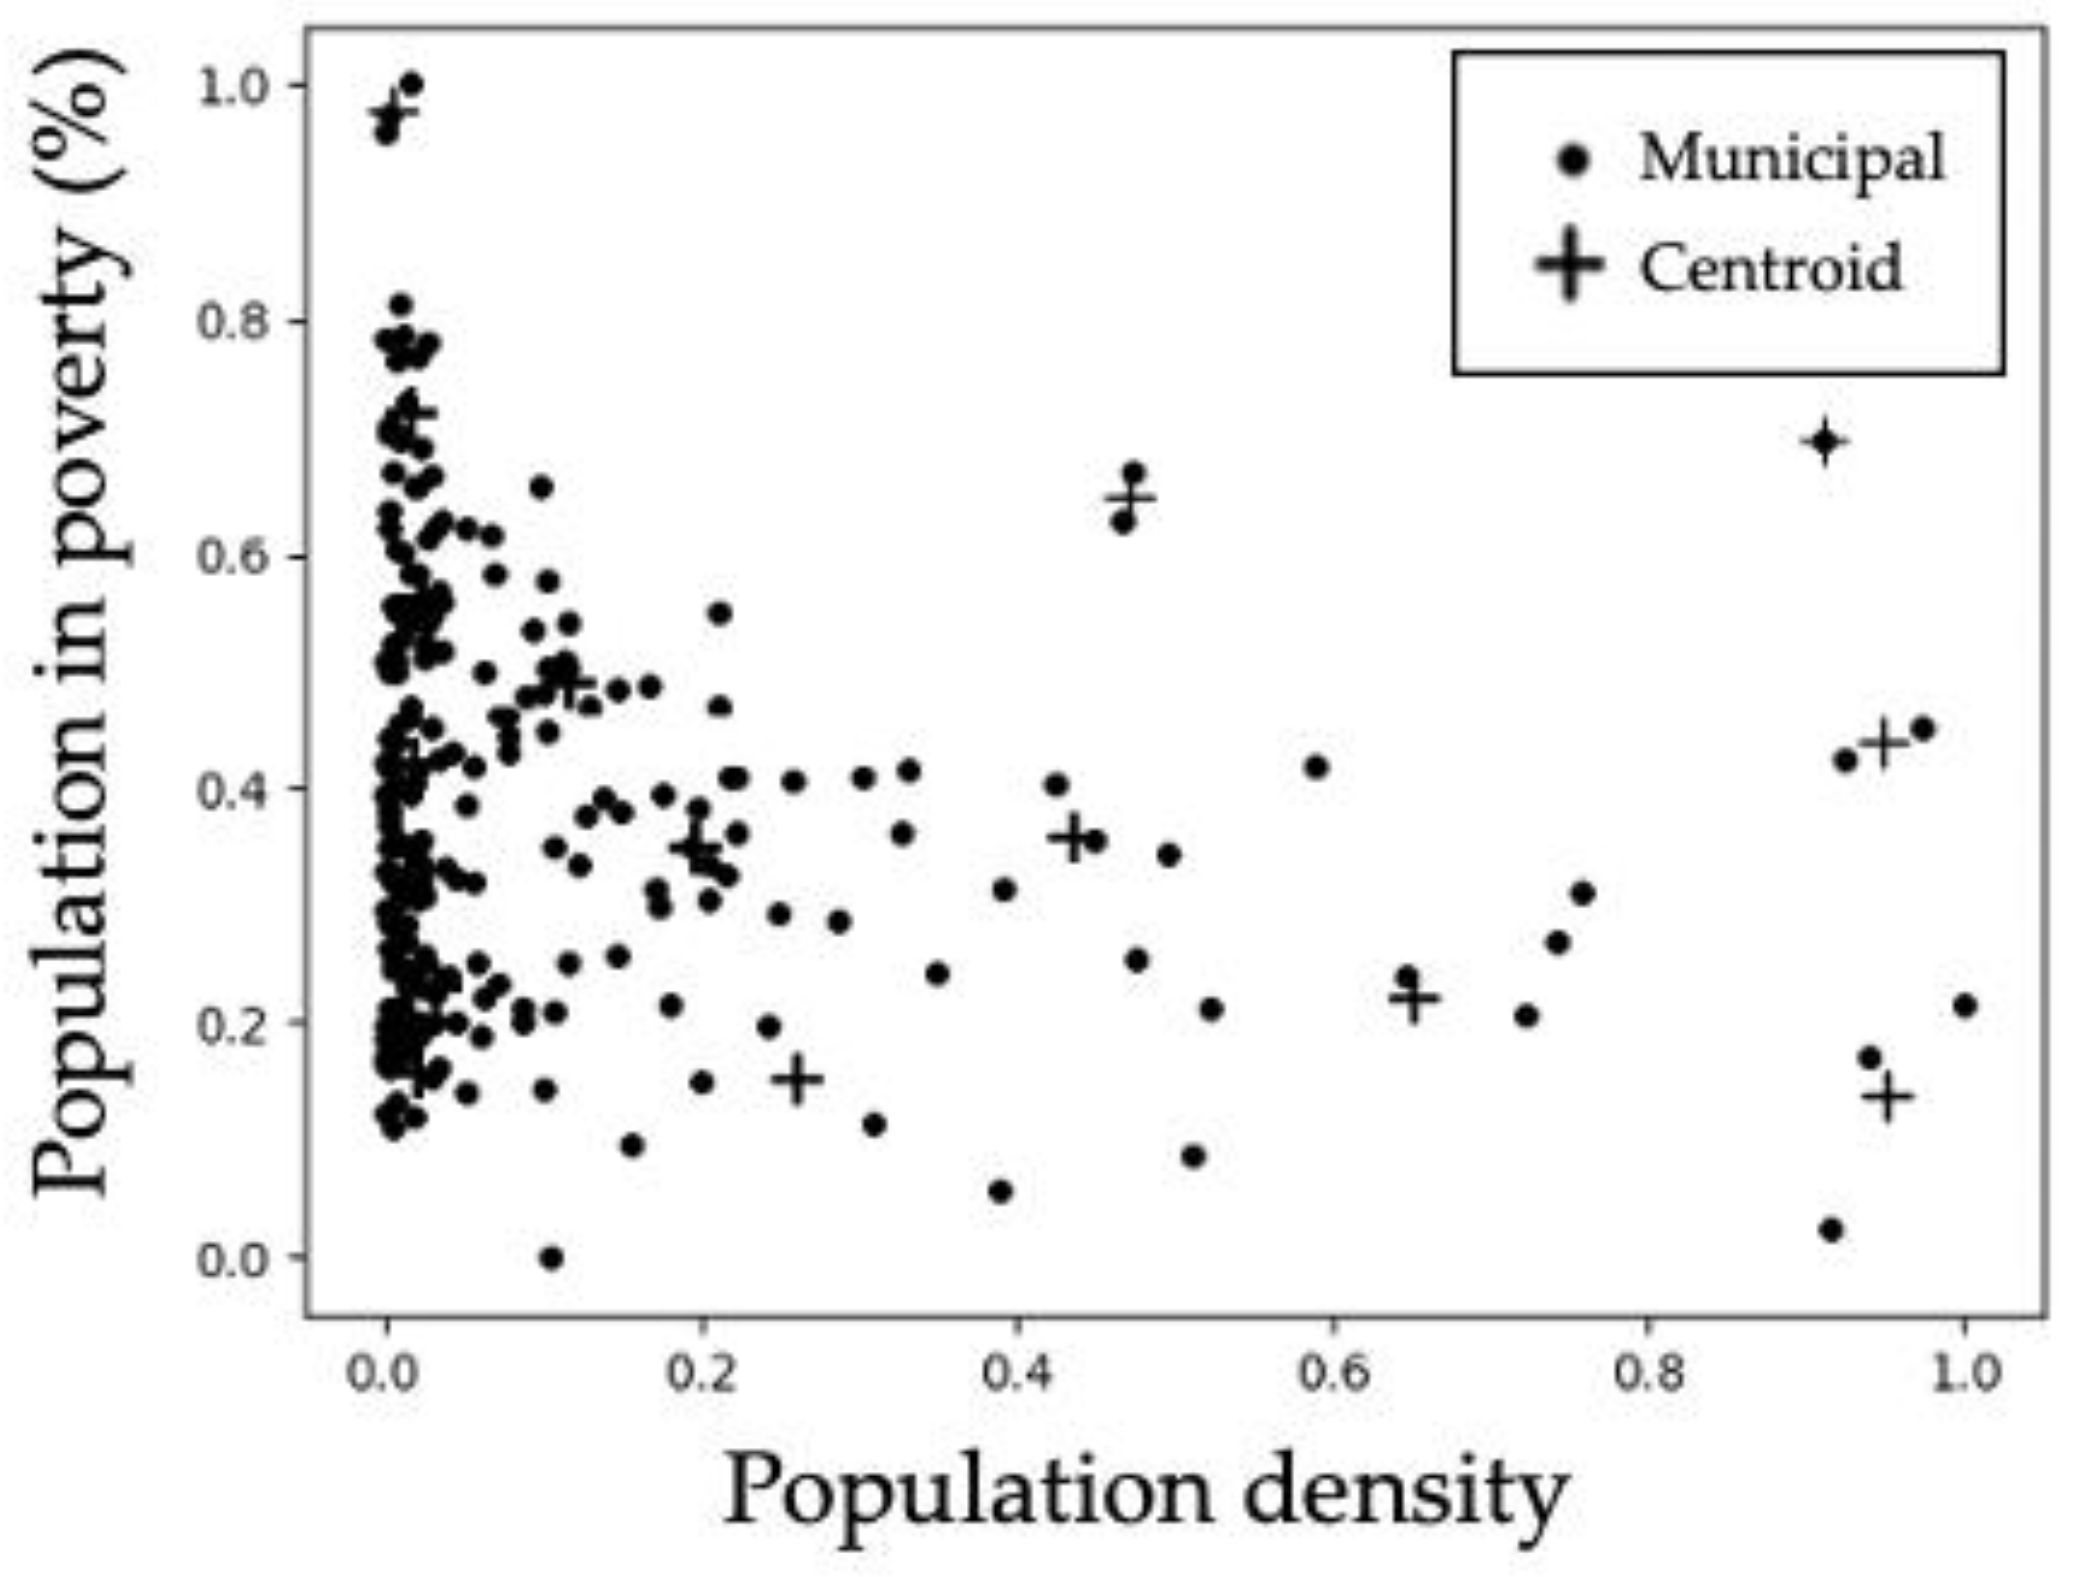
Figure 3 allows visualizing the distribution of the cluster centroids and the municipalities close to the centroids. Some of the centroids are overlapped in the areas of high dots density.
Table 5 includes only the extreme clusters (distinguished with colors) from Table 4 for facilitating their identification.
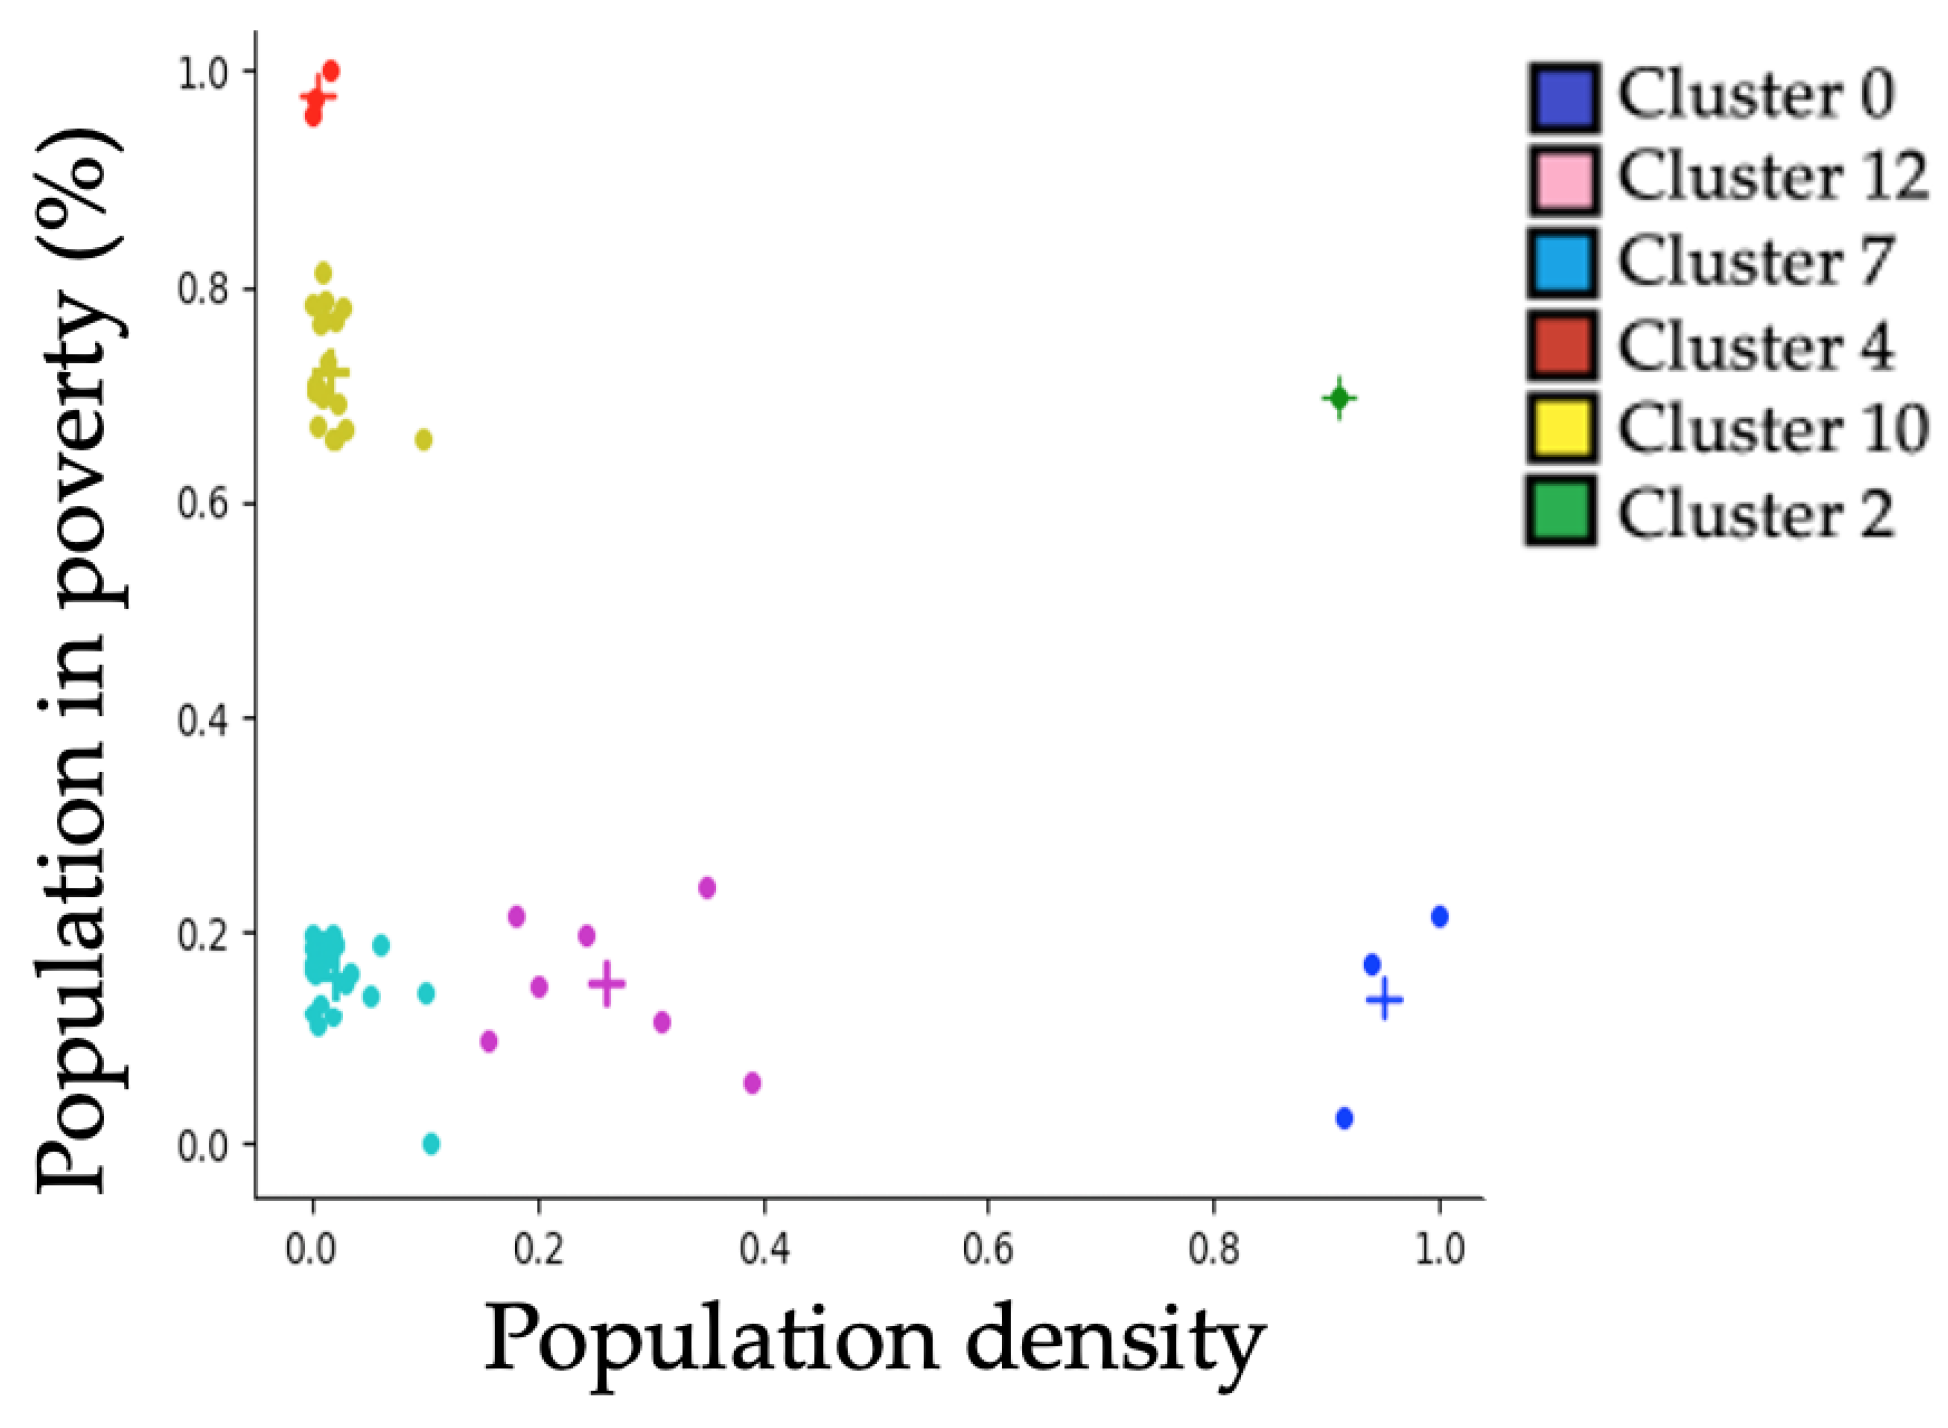
In order to visualize the distribution of municipalities in extreme clusters, the graph in Figure 4 was generated, which shows municipalities represented by dots and cluster centroids denoted by crosses. The color of each dot corresponds to the color of the cluster of which the municipality is a member. It is worth mentioning that the cluster with the highest mortality rate lies in the lower right corner, while the cluster with the lowest mortality rate is in the upper left corner.
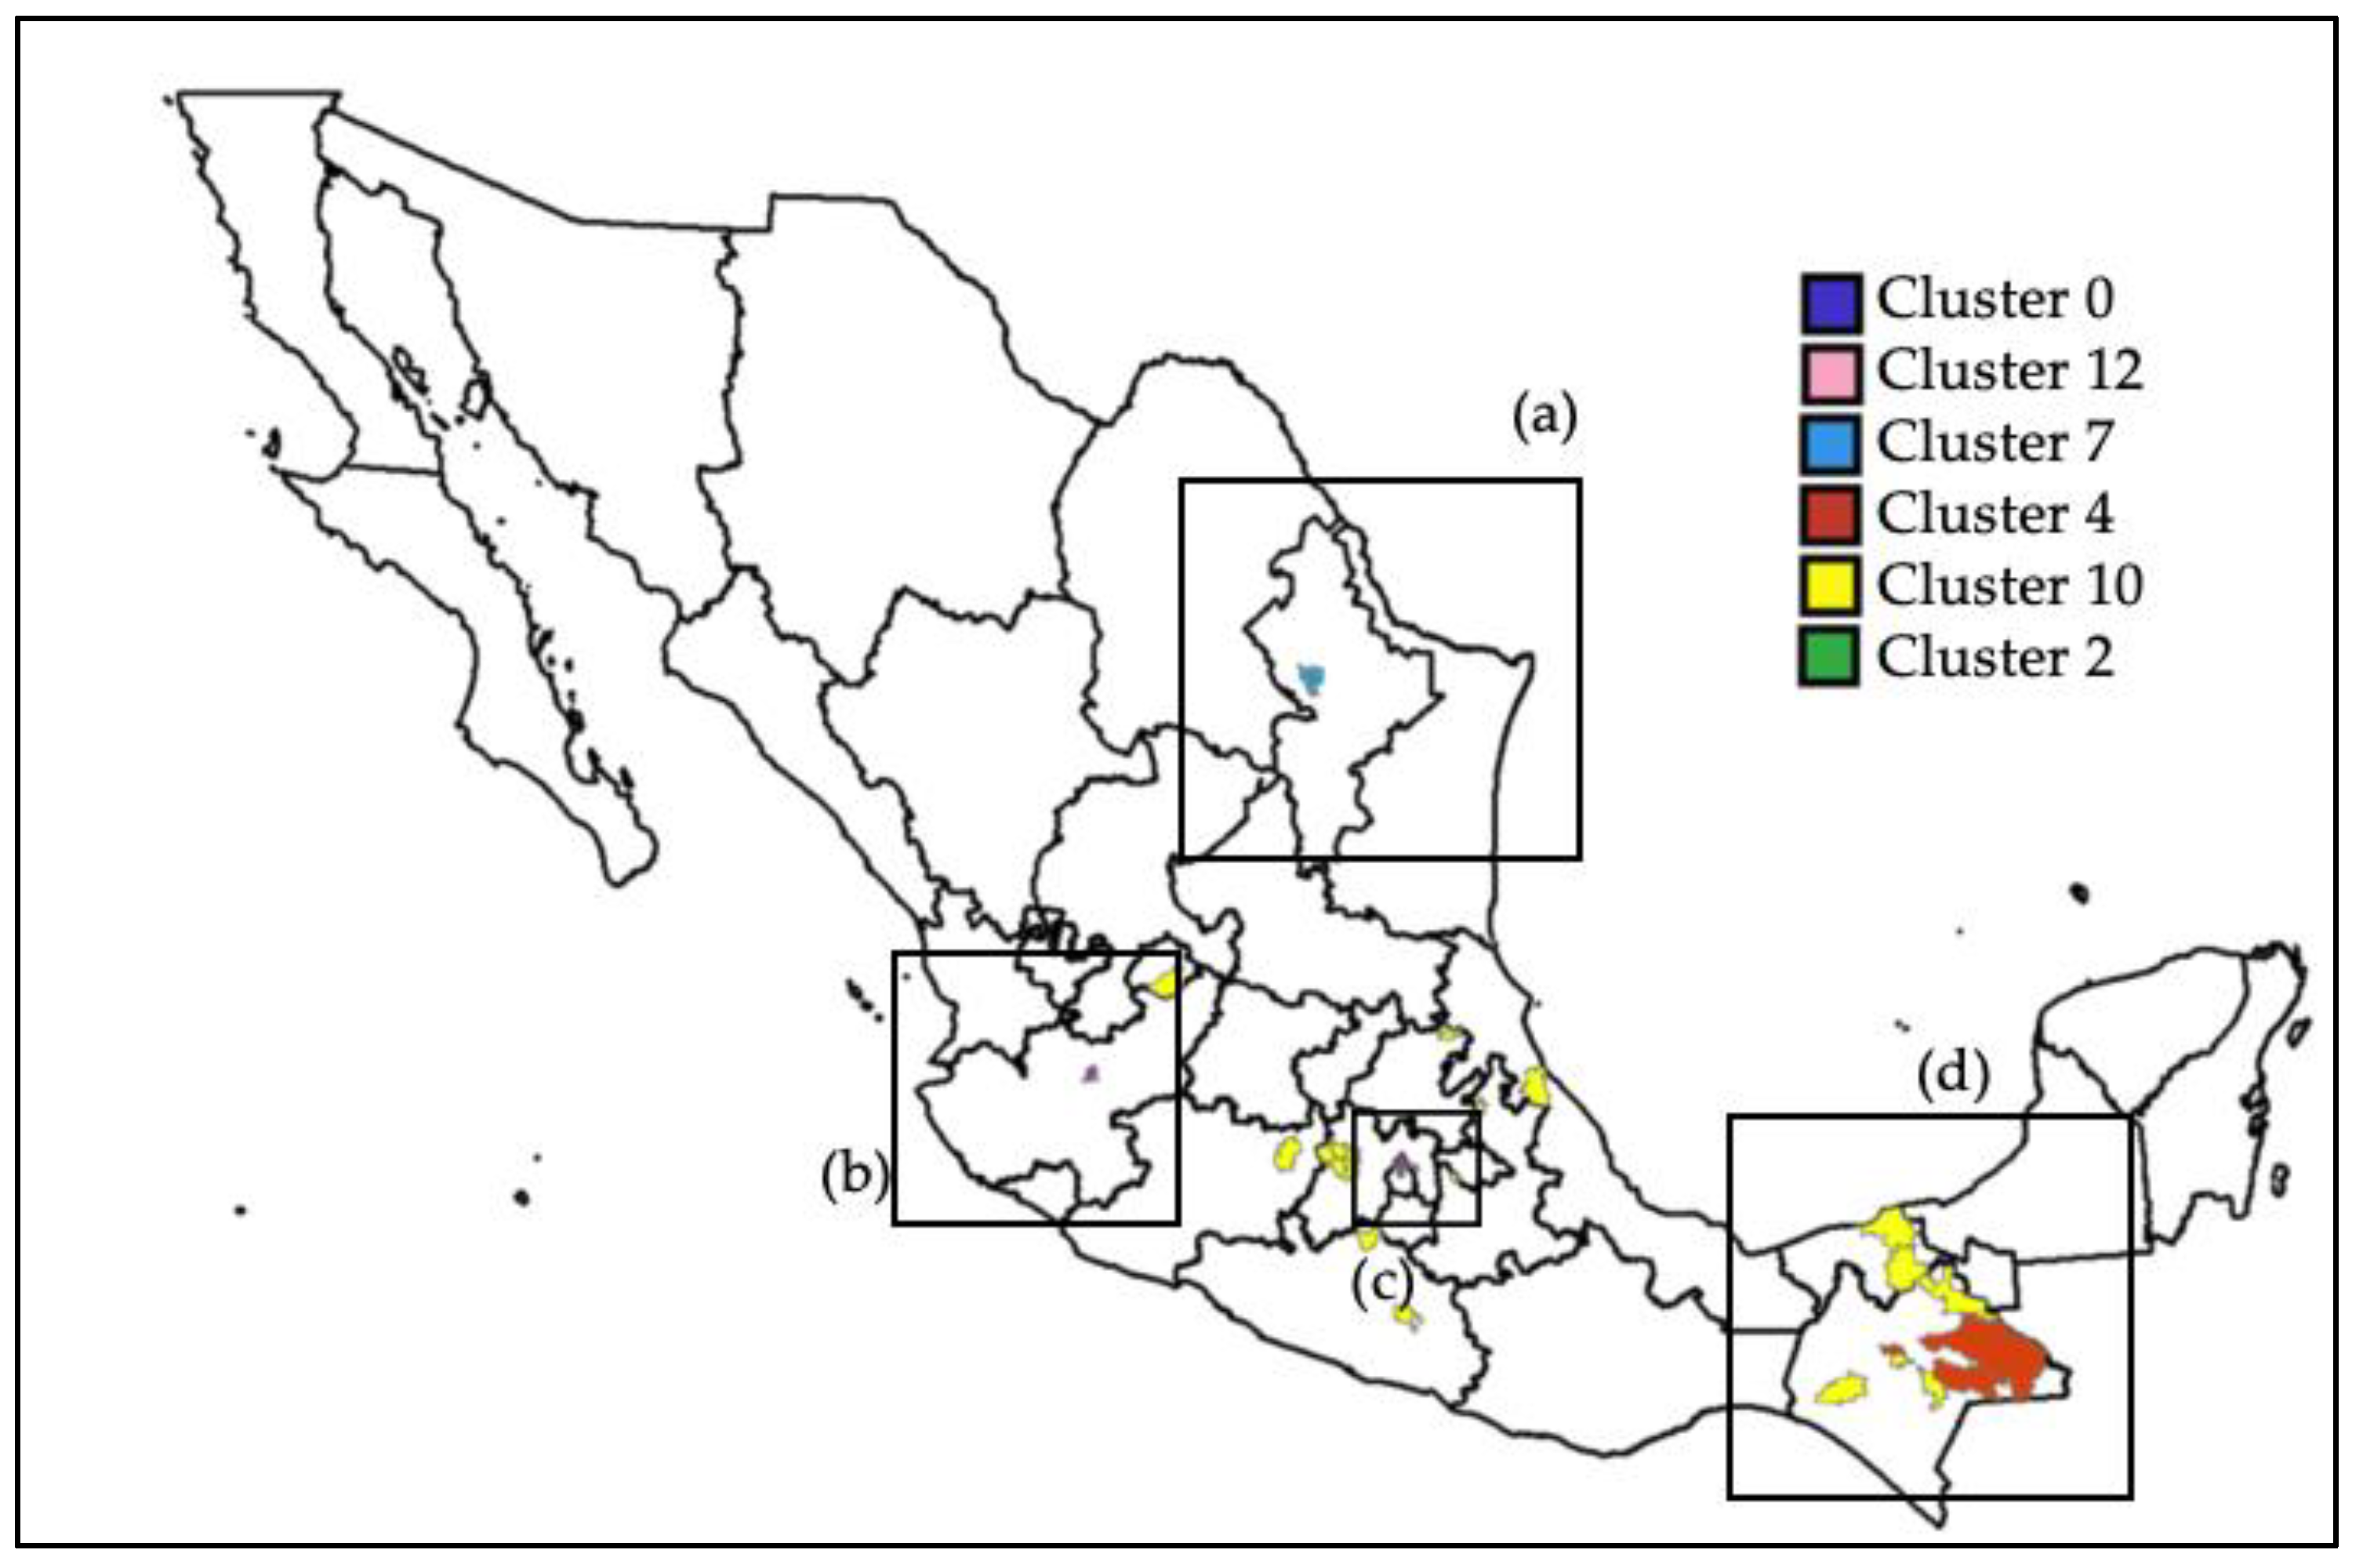
Table 6 shows the municipalities that are members of each of the following clusters: 0, 12, 7, 2, 10 and 4.
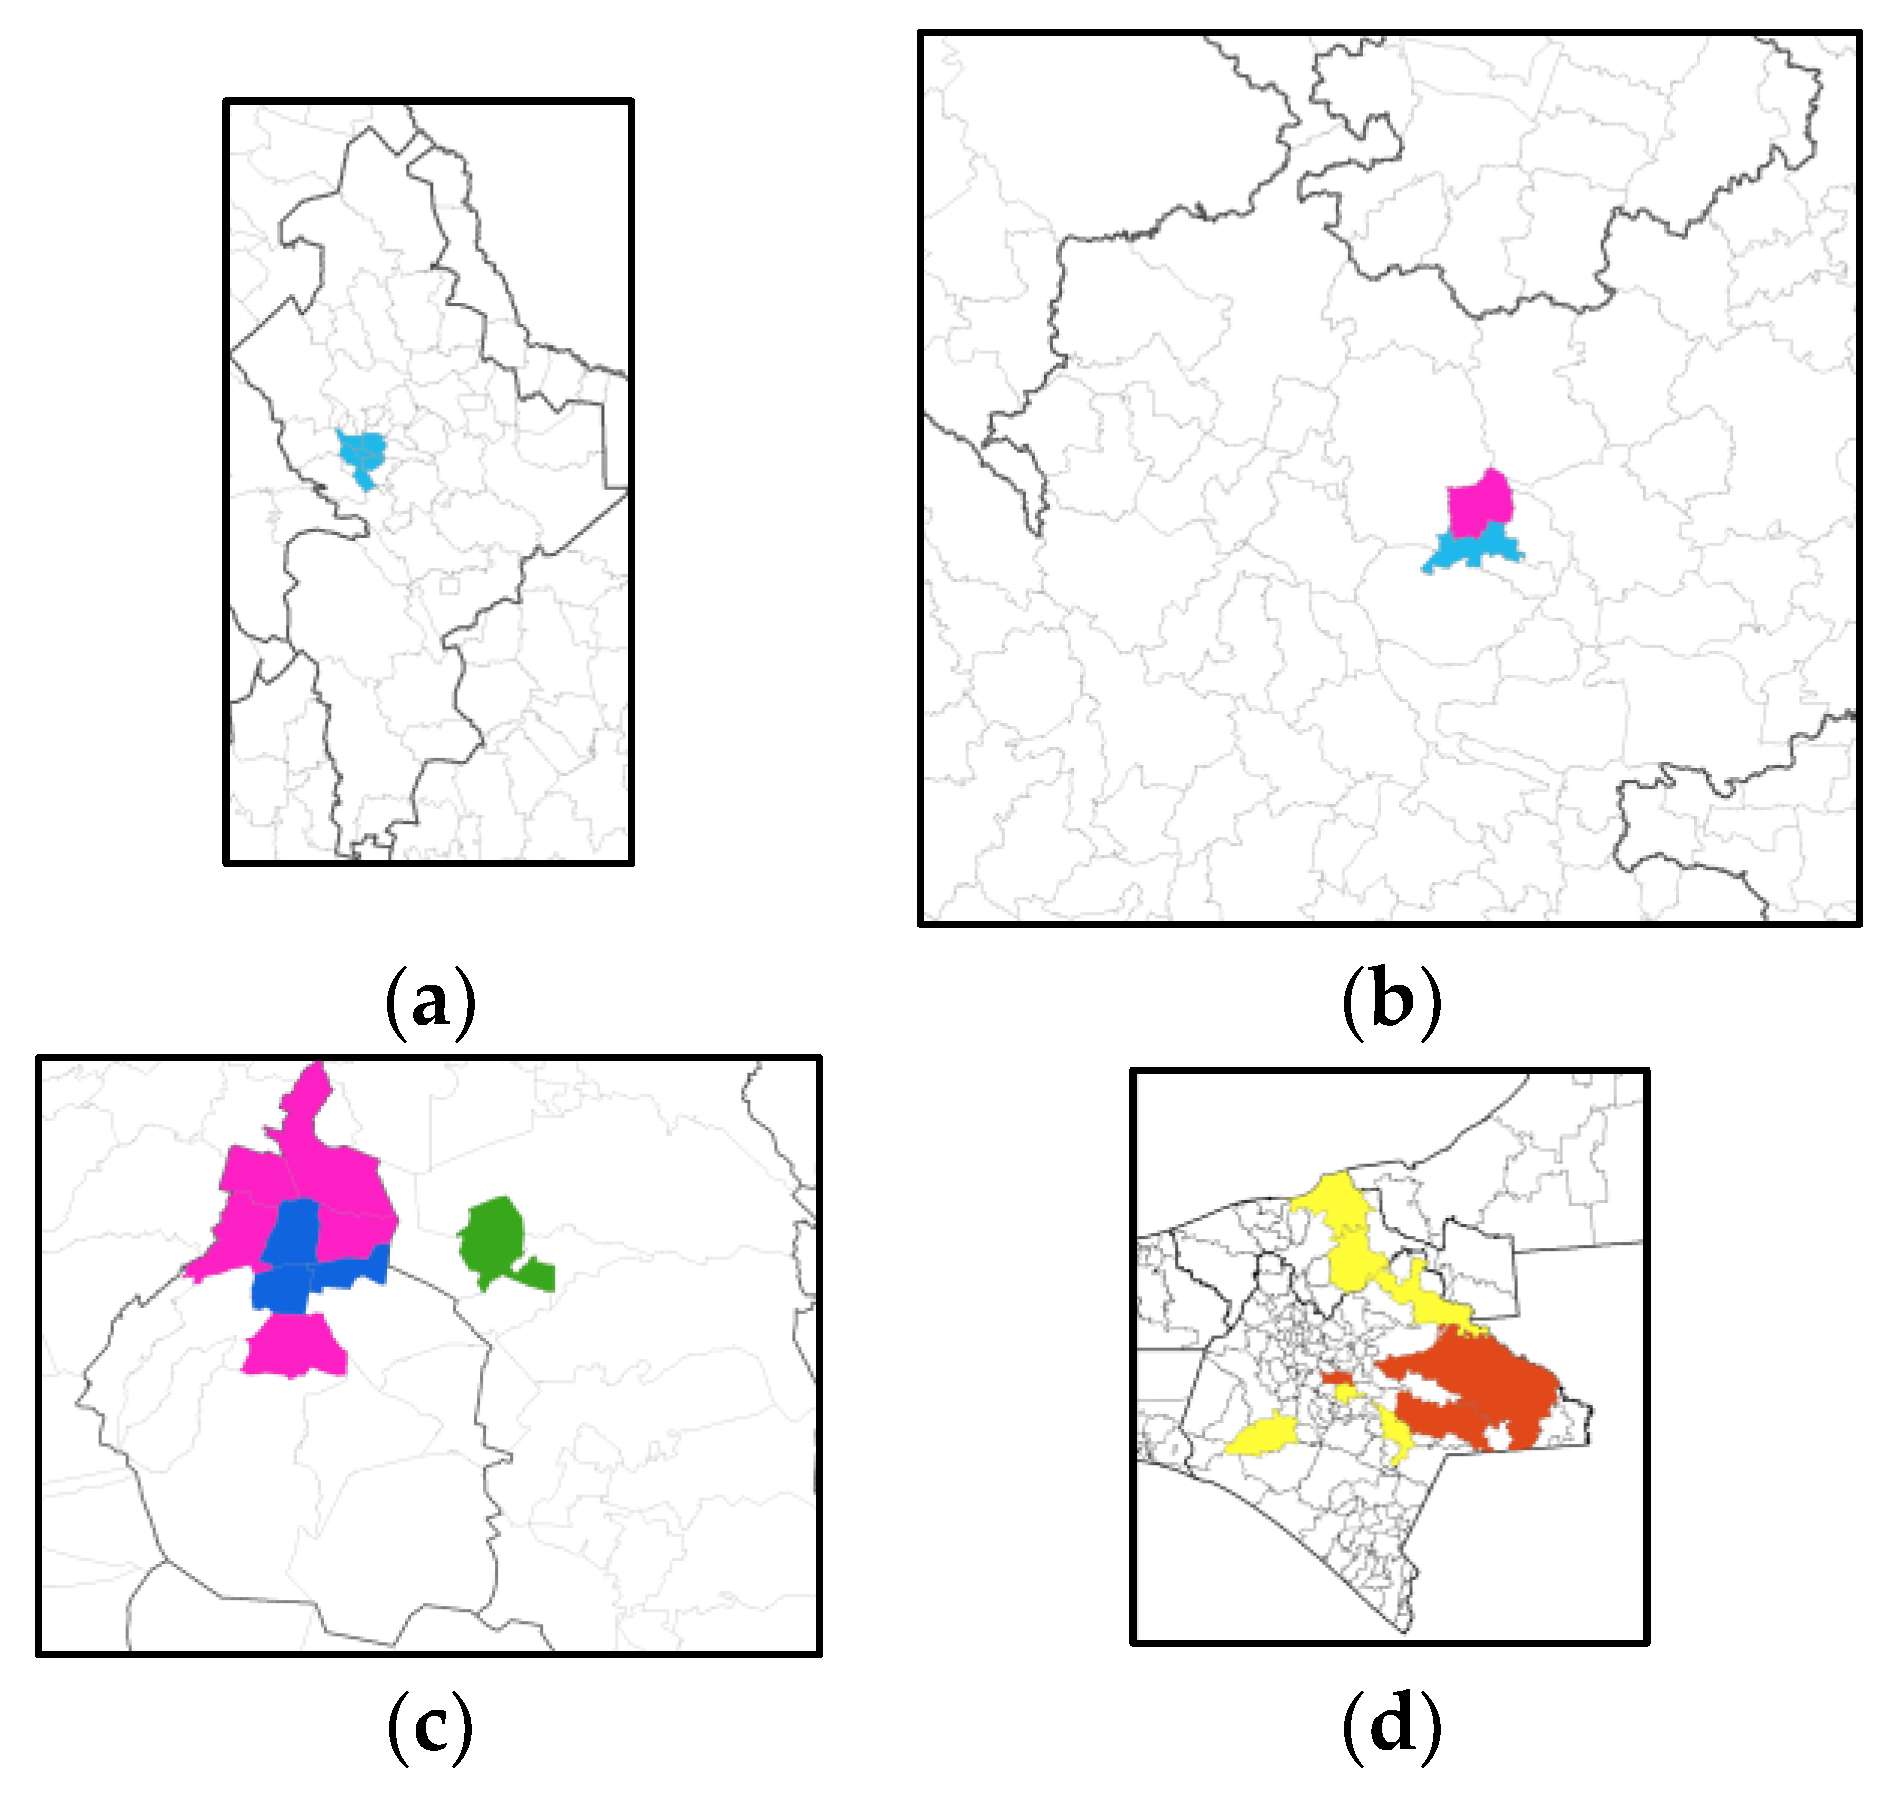
Figure 5 shows a map of Mexico where each municipality is highlighted according to the cluster where it is a member. Square (a) includes several municipalities of the state of Nuevo León; notice that these municipalities have high mortality values. Square (b) contains the municipality of Guadalajara, which also has a high mortality level. Square (c) comprises the three municipalities of the cluster with the highest mortality rates, the highest population densities and the lowest percentages of population in poverty. Notice the contrast to the municipalities in square (d), where those painted in orange are the ones in the cluster with the lowest mortality rate, the lowest population density and the highest percentage of population in poverty. Magnified reproductions of these squares are shown in Figure 6.

3.2. Discussion

The results of this study, through a methodology that combines the most relevant aspects of epidemiology within a Data Science framework, provide valuable information on clustering of the COVID-19 mortality according to sociodemographic factors at the municipal level in Mexico. This allows us to characterize the shapes of COVID-19 mortality rate curves in different clusters that describe the geospatial variability in mortality rates.
Among the previous studies that have used clustering algorithms to analyze mortality data from COVID-19, as in our study, but for several countries, there is that of Cerqueti et al. 2022, in which the analysis of conglomerates of 35 countries was carried out selected based on new deaths per million COVID-19 data and using a K-means approach to clustering. In this study, the main determinants for the grouping between countries were the days with peak deaths, the stability of the number of victims and the waves of COVID-19 endured, which showed similarities and divergences between the countries described by the results of the procedure grouping [21]. Gohari et al. propose a three-step approach to pool specific COVID-19 mortality trends for 203 countries and territories, and they consider a K-means pooling algorithm as well. As a relevant finding, they report that countries such as Germany, Greece, Canada, the Russian Federation, Ukraine, and Mexico apparently had more success in controlling the spread of the disease than in patient survival [3].
Likewise, Garg et al. grouped 208 countries with similar values of risk factors for COVID-19 using an unsupervised machine learning model (K-means) and determined as shared risk factors in the countries grouped with the highest mortality rate by COVID-19, a high median age, as well as a high proportion of people over 65 years of age, a high gross domestic product (GDP) per capita, low population, greater population of women smokers, considerable number of hospital beds per 1000, and human development index [22]. Cornelius et al. evaluated the prediction of COVID-19 patient mortality using demographics data in the United States through a machine learning approach. Clustering K-means allowed them to observe clear trends of minority older people in the northeast and south who are at elevated risk of COVID-19 mortality and to rank the severity of outcome for COVID-19 patients [23].
Another study conducted by Vahabi et al. evaluated the growth trajectories of the COVID-19 mortality/incidence ratio and found contiguous United States county-level clusters with similarities over time. In this study, cardiac complications and cancer were statistically significant pre-existing comorbidities related to the mortality/incidence ratio of COVID-19 in the United States. Tuberculosis, drug use disorder, Human Immunodeficiency Virus (HIV)/Acquired Immunodeficiency Syndrome (AIDS), diabetes and hepatitis were explicitly associated with a higher probability of being in the most vulnerable group [24].
In the Latin American context, Martin-Barreiro et al. 2021 used disjoint and functional principal components analysis to classify ten South American countries (Argentina, Bolivia, Brazil, Chile, Colombia, Ecuador, Peru, Paraguay, Uruguay and Venezuela) with respect to the number of infected and deaths due to COVID-19. In addition, they designed an algorithm that allows summarizing the multivariate methods used to detect changes in the data using a sensor and thus have an updated analysis. Finally, they carried out an analysis of alternating clusters of k-means for the formation of groups within the countries, highlighting more reliable results with the analysis of principal components [25].
The research question that was formulated in this study was the following: what sociodemographic factors do the Mexican municipalities with similar mortality rates have in common? One of the remarkable results of the study was uncovering that the indicators of population density and percentage of population in poverty are related to the mortality rates for COVID-19 at the municipal level. Because such indicators are constituted by other factors, they allowed us to indirectly measure other variables. For example, high population density is associated with factors such as mobility in mass transport systems such as subways and commuter trains, among others. It was observed that there exists a high direct correlation between mortality rate and percentage of population density. However, an inverse correlation was found between mortality rate and percentage of population in poverty.
This relationship between COVID-19 mortality rates and low percentage of poor was recently reported by Yao et al., where they found higher COVID-19 mortality rates in high-income or developed countries associated with multiple factors, including transportation, population density and population aging [55]. Similarly, the direct correlation between mortality rate and population density found in the present study is supported by Chang et al., who show that population density has a significantly positive effect on confirmed deaths, confirming that this demographic factor plays a facilitating role in the speed of spread of the virus [56].
Our findings are backed by previous national and international studies that have found geographic clusters of infections, hospitalizations and deaths from COVID-19 [57,58,59,60].
Individual risk factors or a combination, such as a high population density and a high proportion of vulnerable population, may influence the spatial clustering of people infected with COVID-19, which increases the risk in close neighboring municipalities [10,61]. Similarly, the mobility of residents in very densely populated areas may facilitate the introduction, propagation and persistence of COVID-19. Thus, it has been reported that population density might be an indicator of a high rate of contact due to mobility rather than physical proximity [62].
In the context of Mexico, similar findings have been reported in previous studies in relation to the association between higher mortality rates for COVID-19 and higher population density and overcrowding conditions. Ríos et al. found that patients lived in municipalities with the highest overcrowding had a higher risk of dying from COVID-19 as compared to those who lived in a municipality with low overcrowding [63]. Likewise, Contreras et al. and Villa et al. reported population density as a factor associated to higher mortality rates and adverse results for COVID-19, respectively [64,65].
Initially in Mexico, the propagation of COVID-19 started among people of a high socioeconomic level that live in the most developed municipalities of the country. Considering that the hospital and diagnosis infrastructure is concentrated in large cities, therefore, records of positive diagnosis and access to hospital treatment and death from COVID-19 at hospitals were more prevalent in municipalities with a high-income level. In agreement, a study where the level of social deprivation was evaluated which estimates social disadvantage and structural inequality at the municipal level based on census data found a rural–urban dissociation of factors that affecting mortality from COVID-19 in Mexico.
In contrast to what was found in the previous study, as the pandemic evolved, some studies have documented that living in municipalities with overcrowding conditions is associated with a higher risk of mortality from COVID-19 in the Mexican adult population. Similarly, Arce et al. in 2022 mentioned that those with lower income levels had four times more probability of being hospitalized and undergo a more serious disease than wealthier people.
Other studies that have aimed at evaluating the spatial distribution by clusters of mortality from COVID-19 and associated factors in Mexico have used excess mortality data, which include deaths from all the causes directly or indirectly related to the pandemic. Additionally, the estimation was performed with data reported up to April 2020, thus finding that population density was a factor associated with higher mortality from COVID-19. Specifically, the latter study reports findings similar to the present study regarding the unexpected association of lower mortality rates and municipalities with high poverty rates in the state of Chiapas.
Our study has strengths and limitations. Its main strength is the use of a new hybrid clustering algorithm as a useful tool in the analysis of groups of municipalities with similar mortality rates and sociodemographic factors. A key contribution of this work is that it is the first study in Mexico where the analysis of mortality is conducted at the municipal level and algorithms are used to group by similarity in sociodemographic factors, which is relevant given that in our study, we show that even municipalities in the same state can have very different values of mortality rates from COVID-19. In addition to the fact that due to the lag in the availability of official mortality data in Mexico, there are few studies based on COVID-19 death records, most of the studies with data from the year 2020 come from COVID-19 tests.
The main limitation of this study is the use of data collected from COVID-19 death records, since the database was reviewed and validated only by the Mexican Ministry of Health. Finally, this study was conducted for the Mexican population, so caution should be applied in generalizing its results to other populations with a different demographic profile.

4. Conclusions

The clusters of municipalities with similar mortality rates in Mexico had an analogous population density and poverty percentage. We found that there is a high direct correlation between mortality rate and population density and an inverse correlation between the mortality rate and the percentage of poor people. This finding should be of great importance to public health decision-makers, since it indicates where public health measures should be strengthened to improve control of the COVID-19 disease and optimize the allocation of resources to reduce hospitalizations and mortality. For further research, this study can be replicated considering other variables such as environmental variables, response of health systems variables, and population behavioral variables among others that could explain the clustering pattern of municipalities by mortality rates in Mexico and in other regions of Latin America with similar characteristics.

Author Contributions

Conceptualization, J.P.-O. and K.T.-P.; Data curation, N.N.A.-O. and G.M.-G.; Formal analysis, J.P.-O., N.N.A.-O. and R.P.-R.; Funding acquisition, J.P.-O. and J.C.Z.-D.; Investigation, J.P.-O., N.N.A.-O., G.M.-G. and J.C.Z.-D.; Methodology, J.P.-O., N.N.A.-O., K.T.-P. and G.M.-G.; Project administration, J.P.-O.; Resources, N.N.A.-O. and G.M.-G.; Software, N.N.A.-O. and G.M.-G.; Supervision, J.P.-O.; Validation, J.P.-O. and K.T.-P.; Visualization, J.P.-O., N.N.A.-O. and G.M.-G.; Writing—original draft, J.P.-O., N.N.A.-O. and K.T.-P.; Writing—review and editing, J.P.-O., K.T.-P. and R.P.-R. All authors have read and agreed to the published version of the manuscript.

Funding

This research was funded by Tecnológico Nacional de México, grant number 13869.22-P, grant number 13541.22-P and by PRODEP grant number 28022. The Student Gerardo Martínez González acknowledges him scholarship (grantee No. 1076416) to the Consejo Nacional de Ciencia y Tecnología, Mexico.

Institutional Review Board Statement

Not applicable.

Informed Consent Statement

Not applicable.

Data Availability Statement

Dirección General de Información Sanitaria, DGIS. http://www.dgis.salud.gob.mx/contenidos/basesdedatos/da_defunciones_gobmx.html (accessed on 21 February 2022). Instituto Nacional de Estadística y Geografía, INEGI. https://www.inegi.org.mx/programas/ccpv/2020/#Datos_abiertos (accessed on 21 February 2022). Catálogo Único de Claves de Áreas Geoestadísticas, Estatales, Municipales y Localidades, AGEE. https://www.inegi.org.mx/app/ageeml/ (accessed on 21 February 2022). Centro Mexicano para la Clasificación de Enfermedades y Centro Colaborador para la Familia de Clasificaciones Internacionales de la OMS en México, CEMECE. https://www.gob.mx/salud/acciones-y-programas/menu-clasificacion-de-enfermedades-dgis?state=published (accessed on 22 February 2022). Consejo Nacional de Evaluación de la Política de Desarrollo Social, CONEVAL. https://www.coneval.org.mx/Medicion/Paginas/Pobreza-municipio-2010-2020.aspx (accessed on 15 March 2022). Sistema Nacional de Información Municipal, SNIM. http://snim.rami.gob.mx/ (accessed on 16 March 2022).

Conflicts of Interest

The authors declare no conflict of interest. The funders had no role in the design of the study; in the collection, analyses, or interpretation of data; in the writing of the manuscript, or in the decision to publish the results.

References

  1. Wang, H.; Paulson, K.R.; Pease, S.A.; Watson, S.; Comfort, H.; Zheng, P.; Aravkin, A.Y.; Bisignano, C.; Barber, R.M.; Alam, T.; et al. Estimating excess mortality due to the COVID-19 pandemic: A systematic analysis of COVID-19-related mortality, 2020–2021. Lancet 2022, 399, 1513–1536. [Google Scholar] [CrossRef]
  2. Halat, A.H.; Adnan, A.M. COVID-19 pandemic datasets based on machine learning clustering algorithms: A review. PalArch's J. Archaeol. Egypt/Egyptol. 2021, 18, 2672–2700. [Google Scholar]
  3. Kimiya, G.; Anoshirvan, K.; Ali, S.; Sarah, H. Clustering of countries according to the COVID-19 incidence and mortality rates. BMC Public Health 2022, 22, 632. [Google Scholar] [CrossRef]
  4. Bucci, A.; Ippoliti, L.; Valentini, P.; Fontanella, S. Clustering spatio-temporal series of confirmed COVID-19 deaths in Europe. Spat. Stat. 2021, 6, 100543. [Google Scholar] [CrossRef] [PubMed]
  5. Andrade, L.A.; da Paz, W.S.; Lima, A.G.F.; da Conceição Araújo, D.; Duque, A.M.; Peixoto, M.V.S.; Góes, M.A.O.; de Souza, C.D.F.; Ribeiro, C.J.N.; Lima, S.V.A.; et al. Spatiotemporal Pattern of COVID-19-Related Mortality during the First Year of the Pandemic in Brazil: A Population-based Study in a Region of High Social Vulnerability. Am. J. Trop. Med. Hyg. 2021, 106, 132–141. [Google Scholar] [CrossRef]
  6. Scimone, R.; Menafoglio, A.; Sangalli, L.M.; Secchi, P. A look at the spatio-temporal mortality patterns in Italy during the COVID-19 pandemic through the lens of mortality densities. Spat. Stat. 2021, 49, 100541. [Google Scholar] [CrossRef] [PubMed]
  7. Siqueira, T.S.; Silva, J.R.S.; do Rosário Souza, M.; Leite, D.C.F.; Edwards, T.; Martins-Filho, P.R.; Gurgel, R.Q.; Santos, V.S. Spatial clusters, social determinants of health and risk of maternal mortality by COVID-19 in Brazil: A national population-based ecological study. Lancet Reg. Health Am. 2021, 3, 100076. [Google Scholar] [CrossRef]
  8. Ivan, F.P.; Brian, M.N.; Fernando, R.V.; Lawal, B. Spatial analysis and GIS in the study of COVID-19. Rev. Sci. Total Environ. 2020, 739, 140033. [Google Scholar] [CrossRef]
  9. Ricardo, R.A.; Juan Carlos, G.V.; Omar Yaxmehen, B.C.; Carmen, G.P. Spatial epidemiological study of the distribution, clustering, and risk factors associated with early COVID-19 mortality in Mexico. PLoS ONE 2021, 16, e0254884. [Google Scholar] [CrossRef]
  10. Osvaldo, F.R.; Per, G.; Miguel, S.S.; Anne-Marie, F.C. Spatial clustering and contextual factors associated with hospitalisation and deaths due to COVID-19 in Sweden: A geospatial nationwide ecological study. BMJ Glob. Health 2021, 6, e006247. [Google Scholar] [CrossRef]
  11. Arijit, D.; Sasanka, G.; Kalikinkar, D.; Tirthankar, B.; Ipsita, D.; Manod, D. Living environment matters: Unravelling the spatial clustering of COVID-19 hotspots in Kolkata megacity, India. Sustain. Cities Soc. 2021, 65, 102577. [Google Scholar] [CrossRef]
  12. Akinola, A.S.; Olawale, O.; Yahaya, M.; Jacob, W.M. Geospatial evaluation of COVID-19 mortality: Influence of socio-economic status and underlying health conditions in contiguous USA. Appl. Geogr. 2022, 141, 102671. [Google Scholar] [CrossRef]
  13. Charles, N.; Lex, B.; Matthew, B.; Talayeh, R.; Sixia, C. A machine learning and clustering-based approach for county-level COVID19 analysis. PLoS ONE 2022, 17, e0267558. [Google Scholar] [CrossRef]
  14. Norio, W. A k-means method for trends of time series: An application to time series of COVID-19 cases in Japan. Jpn. J. Stat. Data Sci. 2022, 4, 1–17. [Google Scholar] [CrossRef]
  15. Peilei, F.; Jicuan, C.; Tanni, S. Roles of Economic Development Level and Other Human System Factors in COVID-19 Spread in the Early Stage of the Pandemic. Sustainability 2022, 14, 2342. [Google Scholar] [CrossRef]
  16. Dahlan, A.; Susilo, S.; Ansari, S.A.; Rusli, R.; Rahmat, H. The application of K-means clustering for province clustering in Indonesia of the risk of the COVID-19 pandemic based on COVID-19 data. Qual. Quant. 2022, 56, 1283–1291. [Google Scholar]
  17. Syeda, A.R.; Muhammad, U.; Muhammad, A.C. Clustering of countries for COVID-19 cases based on disease prevalence, health systems and environmental indicators. Chaos Solitons Fractals 2021, 151, 111240. [Google Scholar] [CrossRef]
  18. Shahanka, R.V.; Sai, N.B.; Eric, A.S.; Amod, A. Prediction of the number of COVID-19 confirmed cases based on K-means-LSTM. Array 2021, 11, 100085. [Google Scholar] [CrossRef]
  19. Vasilios, Z.; Stavros, G.P.; Zoe, G.; Efthimios, Z. Clustering analysis of countries using the COVID-19 cases dataset. Data Brief 2020, 31, 105787. [Google Scholar] [CrossRef]
  20. Nezir, A.; Gökhan, Y. Assessing countries’ performances against COVID-19 via WSIDEA and machine learning algorithms. Appl. Soft Comput. 2020, 97, 106792. [Google Scholar] [CrossRef]
  21. Roy, C.; Valerio, F. Combining rank-size and k-means for clustering countries over the COVID-19 new deaths per million. Chaos Solitons Fractals 2022, 158, 111975. [Google Scholar] [CrossRef]
  22. Poojita, G.; Deepak, J. A region-specific clustering approach to investigate risk-factors in mortality rate during COVID-19: Comprehensive statistical analysis from 208 countries. J. Med. Eng. Technol. 2021, 45, 284–289. [Google Scholar] [CrossRef]
  23. Erwin, C.; Olcay, A.; Dan, H. COVID-19 Mortality Prediction Using Machine Learning-Integrated Random Forest Algorithm under Varying Patient Frailty. Mathematics 2021, 9, 2043. [Google Scholar] [CrossRef]
  24. Nasim, V.; Masoud, S.; Julio, D.D.; Abolfazl, M.; George, M. County-level longitudinal clustering of COVID-19 mortality to incidence ratio in the United States. Sci. Rep. 2021, 11, 3088. [Google Scholar] [CrossRef]
  25. Carlos, M.B.; John, R.F.; Xavier, C.; Víctor, L.; Purificación, G.V. Disjoint and Functional Principal Component Analysis for Infected Cases and Deaths Due to COVID-19 in South American Countries with Sensor-Related Data. Sensors 2021, 21, 4094. [Google Scholar] [CrossRef]
  26. Statista. Number of Novel Coronavirus (COVID-19) Deaths Worldwide as of May 2, 2022, by Country 2021. Available online: https://www.statista.com/statistics/1093256/novel-coronavirus-2019ncov-deaths-worldwide-by-country/ (accessed on 2 May 2022).
  27. Leticia, T.I.; Ana, B.A.; Martha, C.; Rossana, T.A.; Francisco, R.S.; Juan, H.A.; Lina, P.M.; Celia, A.A.; Teresa, S.L.; Juan, R.; et al. SARS-CoV-2 infection fatality rate after the first epidemic wave in Mexico. Int. J. Epidemiol. 2022, 51, 429–439. [Google Scholar] [CrossRef]
  28. Eric, M.F.; María, R.V.; Juan, E.M.; Bernardo, H.; Simón, B.; Víctor, V.D.; Ismael, C.N. Characterizing a two-pronged epidemic in Mexico of non-communicable diseases and SARS-Cov-2: Factors associated with increased case-fatality rates. Int. J. Epidemiol. 2021, 50, 430–445. [Google Scholar] [CrossRef]
  29. Juan Pablo, G.; Stefano, B. Non-communicable diseases and inequalities increase risk of death among COVID-19 patients in Mexico. PLoS ONE 2020, 15, e0240394. [Google Scholar] [CrossRef]
  30. Felicia Marie, K.; Michael, T.; Héctor, A.O.; Rifat, A.R.; Juan, C.A.; Julio, F.; Adolfo, M.V.; Tim, M.; Thalia, P.; Mariano, S.T.; et al. Punt Politics as Failure of Health system Stewardship: Evidence from the COVID-19 Pandemic Response in Brazil and Mexico. Lancet Reg. Health Am. 2021, 4, 100086. [Google Scholar] [CrossRef]
  31. Ondrej, H.; Arnost, K. Demographic and public health characteristics explain large part of variability in COVID-19 mortality across countries. Eur. J. Public Health 2021, 31, 12–16. [Google Scholar] [CrossRef]
  32. Sushma, D.; Ruiyan, L.; Mónica, S.; Gerardo, C. Geospatial Variability in Excess Death Rates during the COVID-19 Pandemic in Mexico: Examining Socio Demographic, Climate and Population Health Characteristics. Int. J. Infect. Dis. 2021, 113, 347–354. [Google Scholar] [CrossRef]
  33. What Is the Team Data Science Process? Available online: https://docs.microsoft.com/en-us/azure/architecture/data-science-process/overview (accessed on 3 April 2022).
  34. Ruiz-Lopez, F.; Perez-Ortega, J.; Ortiz-Hernandez, J.; Hernandez-Perez, Y.; Saenz-Sanchez, S. Systematic Review of Methodologies in Data Science. In Proceedings of the 2021 Mexican International Conference on Computer Science (ENC), Morelia, Mexico, 9 August 2021. [Google Scholar]
  35. Joaquín, P.O.; Andrea, V.V.; Nelva Nely, A.O.; Rodolfo, P.R.; Crispín, Z.D.; José María, R.L.; Yazmín, H. Prediction of Diabetes Mortality in Mexico City Applying Data Science. Int. Workshop Artif. Intell. Pattern Recognit. 2021, 1, 211–218. [Google Scholar]
  36. IBM Analytics. Metodología fundamental para la Ciencia de Datos. Available online: https://www.ibm.com/downloads/cas/WKK9DX51 (accessed on 28 May 2021).
  37. Dirección General de Información Sanitaria (DGIS). Available online: http://www.dgis.salud.gob.mx/contenidos/basesdedatos/da_defunciones_gobmx.html (accessed on 7 March 2022).
  38. Instituto Nacional de Estadística y Geografía (INEGI). Available online: https://www.inegi.org.mx/programas/ccpv/2020/#Datos_abiertos. (accessed on 7 March 2022).
  39. Catálogo Único de Claves de Áreas Geoestadísticas, Estatales, Municipales y Localidades (AGEE). Available online: https://www.inegi.org.mx/app/ageeml/ (accessed on 7 March 2022).
  40. Centro Mexicano para la Clasificación de Enfermedades y Centro Colaborador para la Familia de Clasificaciones Internacionales de la OMS en México (CEMECE). Available online: https://www.gob.mx/salud/acciones-y-programas/menu-clasificacion-de-enfermedades-dgis?state=published (accessed on 7 March 2022).
  41. Consejo Nacional de Evaluación de la Política de Desarrollo Social (CONEVAL). Available online: https://www.coneval.org.mx/Medicion/Paginas/Pobreza-municipio-2010-2020.aspx (accessed on 7 March 2022).
  42. Sistema Nacional de Información Municipal (SNIM). Available online: http://snim.rami.gob.mx/ (accessed on 7 March 2022).
  43. Ocampo, L.; Aro, J.L.; Evangelista, S.S.; Maturan, F.; Selerio, E., Jr.; Atibing, N.M.; Yamagishi, K. On K-Means Clustering with IVIF Datasets for Post-COVID-19 Recovery Efforts. Mathematics 2021, 9, 2639. [Google Scholar] [CrossRef]
  44. Manuel, S.M.; Pablo, R.B.; Antonio, J.S.L.; Emilio, S.O.; Yasser, A.M. Machine Learning for Mortality Analysis in Patients with COVID-19. Int. J. Environ. Res. Public Health 2020, 17, 8386. [Google Scholar] [CrossRef]
  45. Amin, K.; Hanadi, S.R.; Winston, L. Assessing COVID-19 risk, vulnerability and infection prevalence in communities. PLoS ONE 2020, 15, e0241166. [Google Scholar] [CrossRef]
  46. Anastasiya, D. Analysis of the distribution of COVID-19 in italy using clustering algorithms. In Proceedings of the 2020 IEEE Third International Conference on Data Stream Mining & Processing (DSMP), Lviv, Ukraine, 21–25 August 2020; IEEE: Piscataway, NJ, USA, 2020; pp. 325–328. [Google Scholar]
  47. Jancey, R.C. Multidimensional group analysis. Aust. J. Bot. 1966, 14, 127–130. [Google Scholar] [CrossRef]
  48. James, M. Some methods for classification and analysis of multivariate observations. In Proceedings of the Fifth Berkeley Symposium on Mathematical Statistics and Probability, Oakland, CA, USA, 1 January 1967; Volume 1, pp. 281–297. [Google Scholar]
  49. Joaquín, P.O.; Nelva Nely, A.O.; Andrea, V.V.; Rodolfo, P.R.; Crispín, Z.D.; Alicia, M.R. The k-means algorithm evolution. In Introduction to Data Science and Machine Learning; Sud, K., Erdogmus, P., Kadry, S., Eds.; IntechOpen: London, UK, 2019; Volume 1, pp. 1–22. [Google Scholar]
  50. Arthur, D.; Vassilvitskii, S. k-means++: The Advantages of Careful Seeding. In Proceedings of the Eighteenth Annual ACM-SIAM Symposium on Discrete Algorithms, New Orleans, LA, USA, 7–9 January 2007; Volume 1, pp. 1027–1035. [Google Scholar]
  51. Joaquín, P.O.; Nelva Nely, A.O.; David, R.V. Balancing effort and benefit of K-means clustering algorithms in Big Data realms. PLoS ONE 2018, 13, e0201874. [Google Scholar] [CrossRef]
  52. Naldi, M.C.; Campello, R.J.G.B. Comparison of distributed evolutionary k-means clustering algorithms. Neurocomputing 2015, 163, 78–93. [Google Scholar] [CrossRef]
  53. Selim, S.Z.; Ismail, M.A. K-Means-Type Algorithms: A Generalized Convergence Theorem and Characterization of Local Optimality. IEEE Trans. Pattern Anal. Mach. Intell. 1984, 6, 81–87. [Google Scholar] [CrossRef]
  54. Mapa Digital de México. Available online: https://www.inegi.org.mx/temas/mapadigital/ (accessed on 17 April 2022).
  55. Yao, L.; Aleya, L.; Howard, S.C.; Cao, Y.; Wang, C.Y.; Day, S.W.; Graff, J.C.; Sun, D.; Gu, W. Variations of COVID-19 mortality are affected by economic disparities across countries. Sci. Total Environ. 2022, 832, 54770. [Google Scholar] [CrossRef]
  56. Dianna, C.; Xin, C.; Yu, H.; Kelvin, J.K.T. The determinants of COVID-19 morbidity and mortality across countries. Sci. Rep. 2022, 12, 5888. [Google Scholar] [CrossRef]
  57. Shariati, M.; Mesgari, T.; Kasraee, M.; Jahangiri-Rad, M. Spatiotemporal analysis and hotspots detection of COVID-19 using geographic information system. J. Environ. Health Sci. Eng. 2020, 18, 1499–1507. [Google Scholar] [CrossRef] [PubMed]
  58. Deguen, S.; Kihal-Talantikite, W. Geographical pattern of COVID-19- Related outcomes over the pandemic period in France: A nationwide Socio-Environmental study. Int. J. Environ. Res. Public Health 2021, 18, 1824. [Google Scholar] [CrossRef] [PubMed]
  59. Amdaoud, M.; Arcuri, G.; Levratto, N. Are regions equal in adversity? A spatial analysis of spread and dynamics of COVID-19 in Europe. Eur. J. Health Econ. 2021, 22, 29–42. [Google Scholar] [CrossRef] [PubMed]
  60. Peter, C. COVID-19 Mortality in English Neighborhoods: The Relative Role of Socioeconomic and Environmental Factors. J. 2021, 4, 131–146. [Google Scholar] [CrossRef]
  61. Kim, S.; Castro, M.C. Spatiotemporal pattern of COVID-19 and government response in South Korea. Int. J. Infect. Dis. 2020, 3, 28–33. [Google Scholar]
  62. Olga, C.; Valentin, C.; David, C. Facing a second wave from a regional view: Spatial patterns of COVID-19 as a key determinant for public health and Geoprevention plans. Int. J. Environ. Res. Public Health 2020, 17, 8468. [Google Scholar] [CrossRef]
  63. Viridiana, R.; Edgar, D.G.; Simón, B.S. Association between living in municipalities with high crowding conditions and poverty and mortality from COVID-19 in Mexico. PLoS ONE 2022, 17, e0264137. [Google Scholar] [CrossRef]
  64. Alejandra, C.M.; Carlos, M.G.L.; Mercedes, A.; Ana, C.S.; Héctor, L.F. Municipality-level predictors of COVID-19 mortality in Mexico: A cautionary tale. Disaster Med. Public Health Prep. 2020, 16, 1–9. [Google Scholar] [CrossRef]
  65. Antonio-Villa, N.E.; Fernandez-Chirino, L.; Pisanty-Alatorre, J.; Mancilla-Galindo, J.; Kammar-García, A.; Vargas-Vázquez, A.; González-Díaz, A.; Fermín-Martínez, C.A.; Márquez-Salinas, A.; Guerra, E.C.; et al. Comprehensive Evaluation of the Impact of Sociodemographic Inequalities on Adverse Outcomes and Excess Mortality During the Coronavirus Disease 2019 (COVID-19) Pandemic in Mexico City. Clin. Infect. Dis. 2022, 74, 785–792. [Google Scholar] [CrossRef]
Figure 1. Pipeline flowchart.
Mathematics 10 02167 g001
Figure 2. Distribution of municipalities by population density and poverty percentage.
Mathematics 10 02167 g002
Figure 3. Distribution of centroids into clusters.
Mathematics 10 02167 g003
Figure 4. Distribution of municipalities in extreme clusters.
Mathematics 10 02167 g004
Figure 5. Spatial distribution of municipalities in extreme clusters.
Mathematics 10 02167 g005
Figure 6. Magnified neighborhoods of municipalities. (a) Nuevo León. (b) Jalisco. (c) CDMX. (d) Chiapas.
Mathematics 10 02167 g006
Table 1. Data source and its official source.
SourceDatasetNumber of Records
DGIS (Dirección General de Información Sanitaria)Death records 2020 [37]1,086,743
INEGI (Instituto Nacional de Estadística y Geografía)Population and housing census 2020 [38]195,662
AGEE (Áreas Geoestadísticas Estatales)Latitude, longitude and altitude records [39]14,483
CEMECE (Centro Mexicano para la Clasificación de Enfermedades)International catalogue of diseases [40]300,689
CONEVAL (Consejo Nacional de Evaluación de la Política de Desarrollo Social)Poverty indicators 2020 [41]2469
SNIM (Sistema Nacional de Información Municipal)Municipal information records [42]2469
Table 2. Attributes selected for each dataset.
DatasetAttributes
Population and housing census 2020State code, state name, municipality code, municipality name, total population, and age.
Death records 2020State code, municipality code, death cause, and deceased age.
Spatial geostatistical areasState code, municipality code, decimal latitude, decimal longitude, and altitude.
International catalogue of diseasesDisease code.
Poverty indicators 2020State code, municipality code, percentage of population in poverty.
Municipal information State   name ,   municipality   name ,   and   municipality   area   in   km 2 .
Table 3. Attributes of the data warehouse.
Attribute_IdAttribute
1State code
2State name
3Municipality code
4Latitude
5Longitude
6Altitude
7Area
8Total population
9Total deaths from COVID-19
10Average age
11Mortality rate
12Percentage of inhabitants in poverty
13Population density
Table 4. Results of the clustering.
ClusterPopulation Density% of Population in PovertyNumber of MunicipalitiesAverage Mortality Rate of Cluster
00.91380.026430.7970
120.72230.205960.5524
70.19950.150970.2471
90.19470.3491210.2463
80.47340.669620.2420
30.42500.404280.2365
110.97170.451520.2103
140.03450.1630250.2037
130.13930.3910180.1911
10.03990.2401300.1889
150.00320.3271300.1571
50.00590.4185250.1437
60.02700.6145330.1316
20.91080.698210.0714
100.00890.7676190.0579
40.00090.958230.0080
Table 5. Extreme clusters.
ClusterPopulation Density% of Population in PovertyNumber of MunicipalitiesAverage Mortality Rate of Cluster
00.91380.026430.7970
120.72230.205960.5524
70.19950.150970.2471
20.91080.698210.0714
100.00890.7676190.0579
40.00090.958230.0080
Table 6. Municipalities in each of the extreme clusters.
MunicipalityDensity% of Population in PovertyAverage Mortality Rate of Municipality
Benito Juárez16,079.747.90935.845
Iztacalco17,595.4325.20696.327
Cuauhtémoc16,541.9420.90634.933
Azcapotzalco12,711.9124.20915.769
Miguel Hidalgo9010.2213.50858.687
Coyoacán11,378.6527.10471.318
Gustavo A. Madero13,333.5333.80410.278
Guadalajara9176.3524.80392.962
Venustiano Carranza13,050.1230.0095.334
San Nicolás de los Garza6869.9810.80575.935
Ciudad Madero4290.2723.40393.332
Monterrey3516.9019.20379.530
Guadalupe5450.3615.80151.444
Apodaca2746.7114.20113.030
General Escobedo3186.8425.0020.157
San Pedro Tlaquepaque6135.0627.4011.206
Chimalhuacán16,027.1168.9068.634
Huejutla de Reyes321.7865.40131.723
Comitán de Domínguez169.9268.80125.769
Taxco de Alarcón162.1975.00113.651
Ixtlahuaca476.6076.40105.533
San Felipe del Progreso392.7575.4084.872
Macuspana65.2969.3076.923
San Martín Texmelucan1730.4265.3062.926
Chilapa de Álvarez164.9675.2054.154
San Andrés Tuxtla169.7379.3048.637
Huauchinango414.1368.4047.140
San Cristobal del las Casas547.9066.1045.397
Palenque45.8069.9038.559
Centla40.0076.8038.058
Villaflores57.6269.5021.911
Almoloya de Juárez1269.5526.6019.475
San José del Rincón205.0977.0018.984
Papantla109.8369.7011.882
Hidalgo109.9866.308.750
Villa Victoria255.1871.906.470
Ocosingo24.7392.5014.063
Las Margaritas46.7894.1010.636
Chamula295.5696.300.981
Publisher’s Note: MDPI stays neutral with regard to jurisdictional claims in published maps and institutional affiliations.

