

Analytics Methods to Understand Information Retrieval Effectiveness—A Survey


Abstract
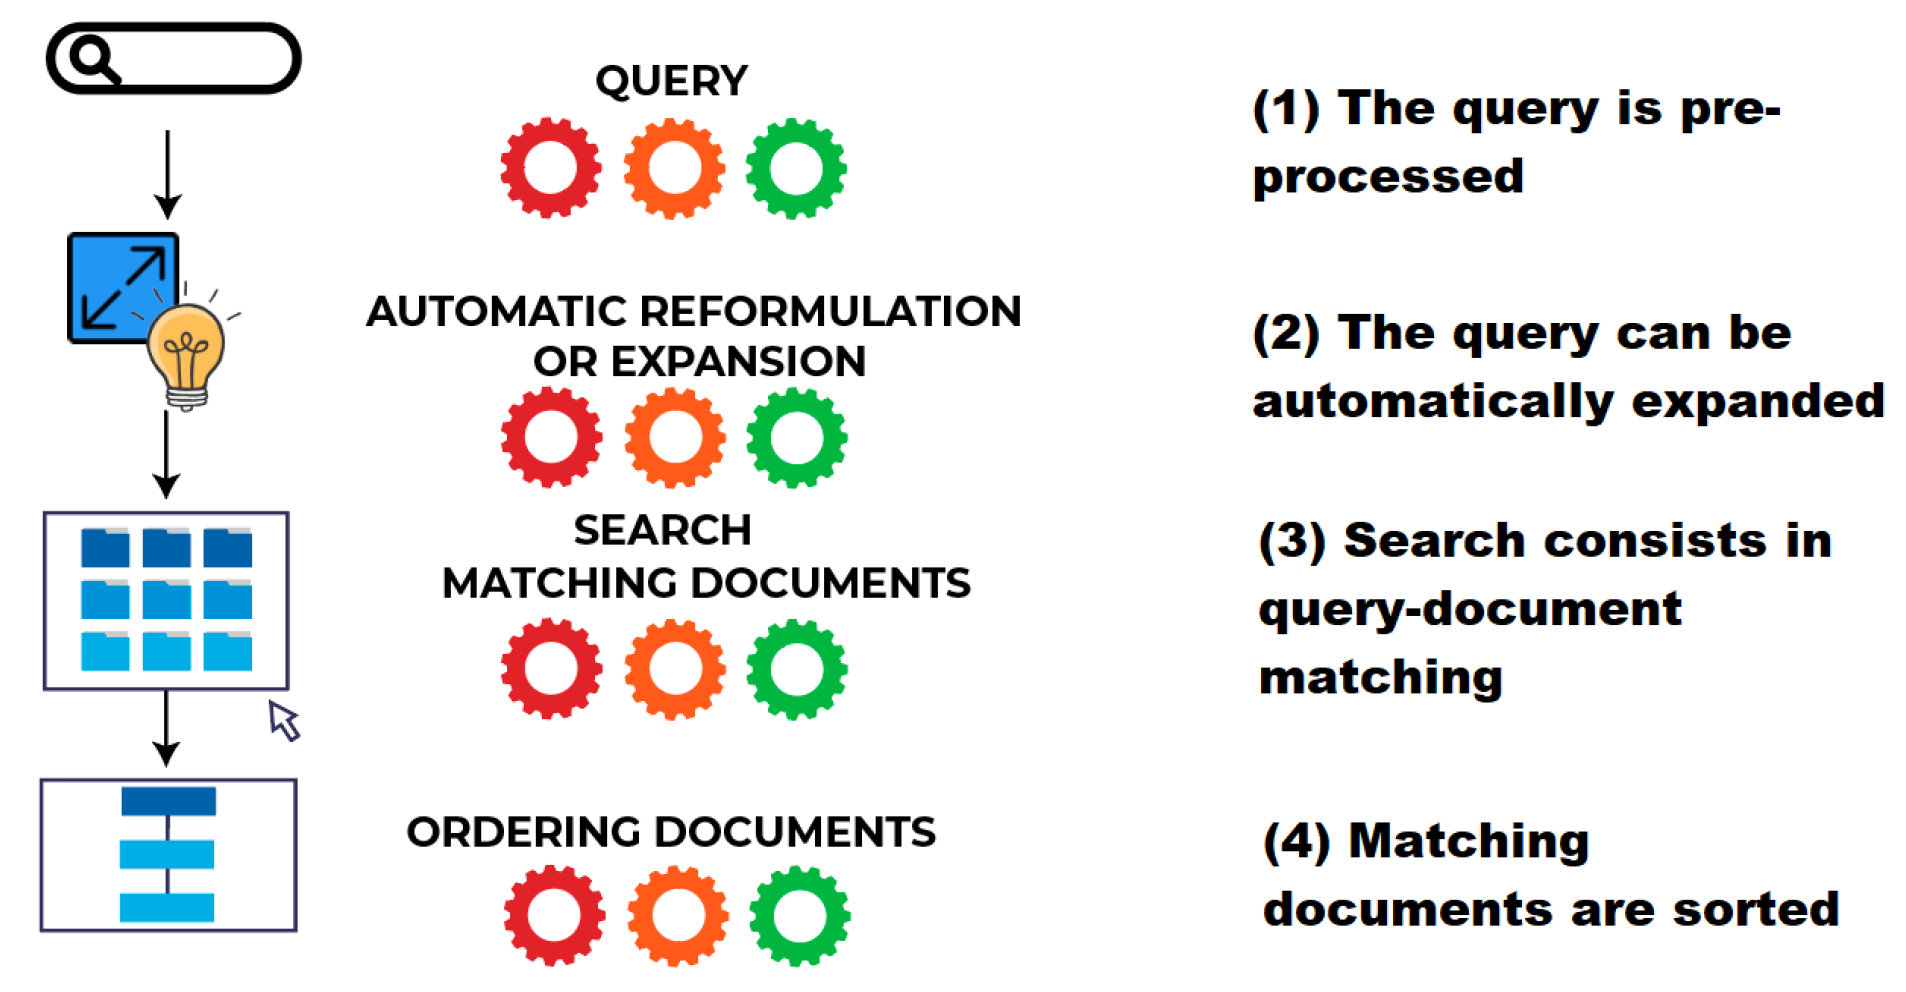
:1. Introduction
- Can we understand better the IR system effectiveness, that is to say successes and failures of systems, using data analytics methods?
- Did the literature allow conclusions to be drawn from the analysis of international evaluation campaigns and the analysis of the participants’ results?
- Did data driven analysis, based on thorough examination of IR components and hyper-parameters, lead to different or better conclusions?
- Did we learn from query performance prediction?
- Can system effectiveness understanding be used in a comprehensive way in IR to solve system failures and to design more effective systems? Can we design a transparent model in terms of its performance on a query?
2. Related Work
2.1. Surveys on a Specific IR Component
2.2. Effectiveness and Relevance
2.3. Typical Evaluation Report in IR Literature
3. Materials and Methods
3.1. Data Analysis Methods
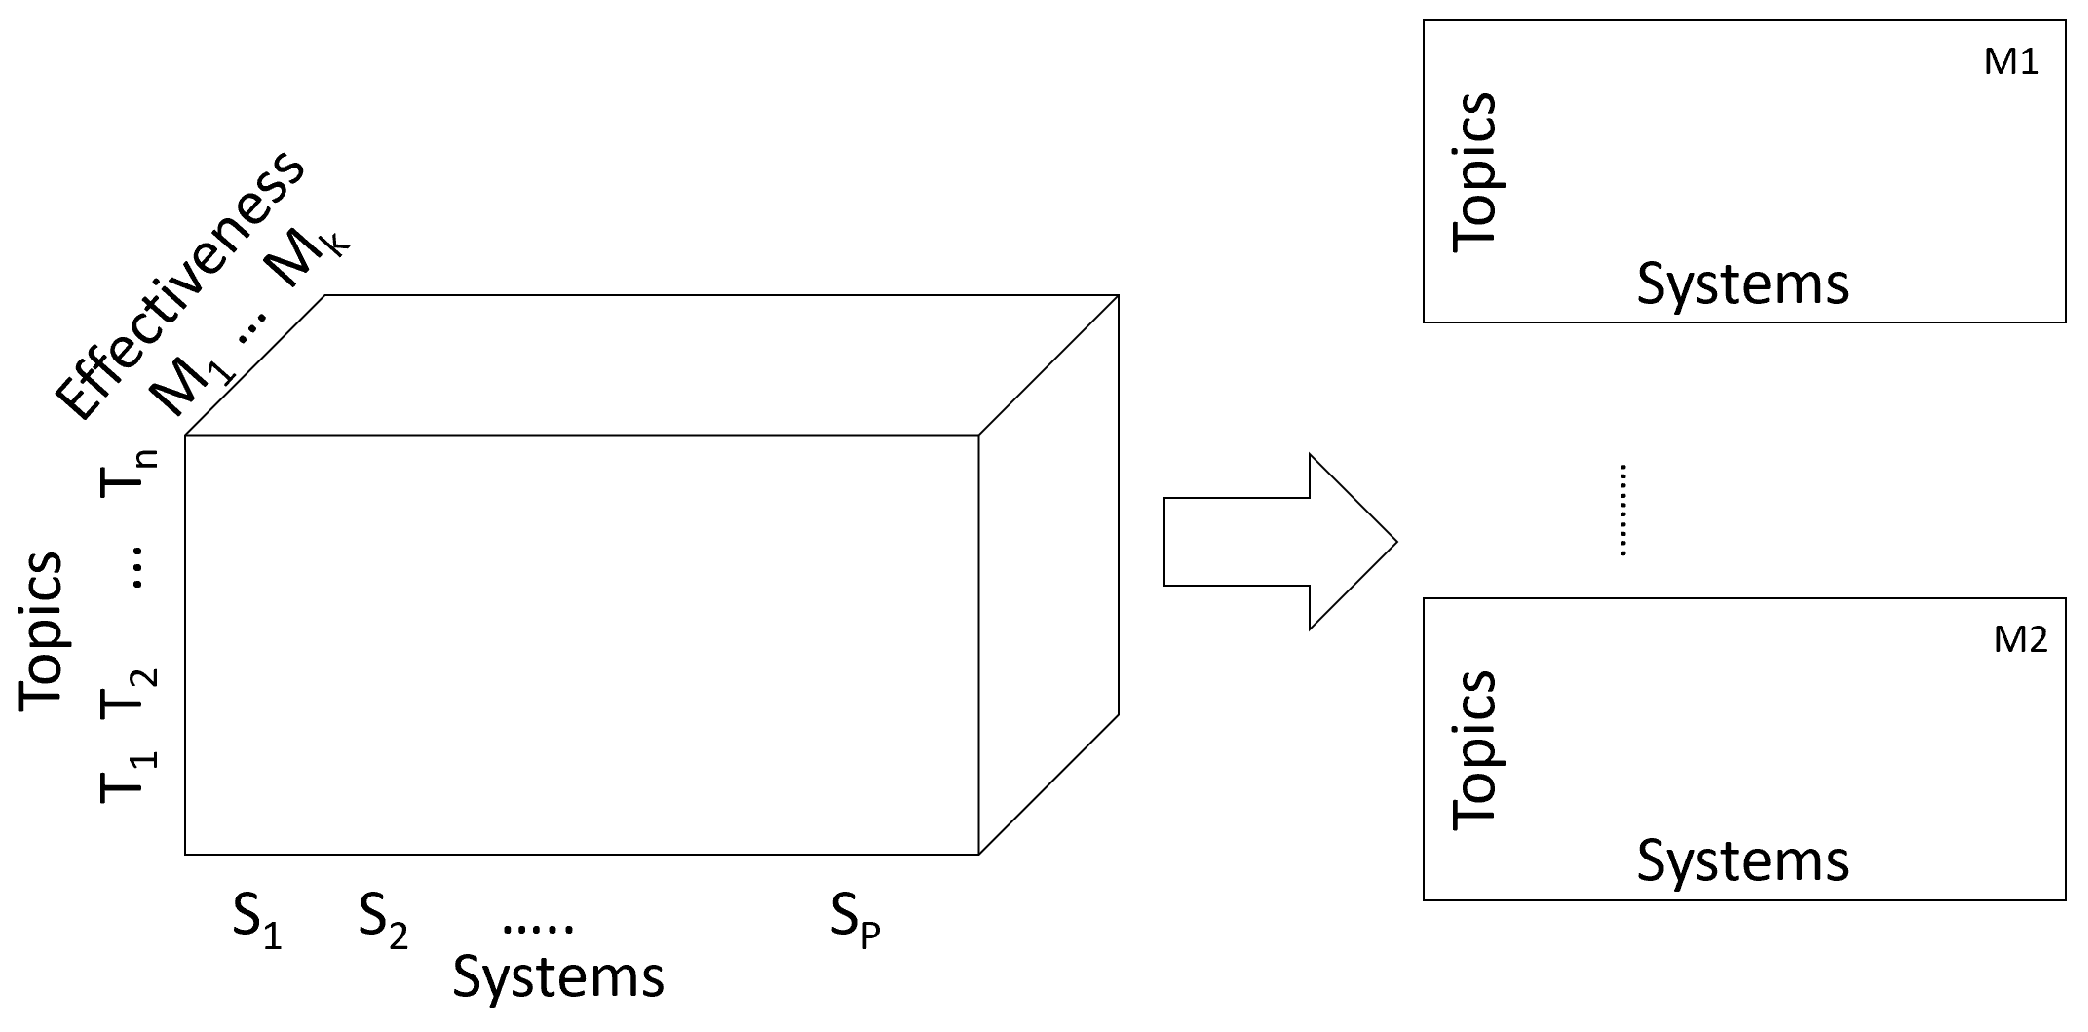
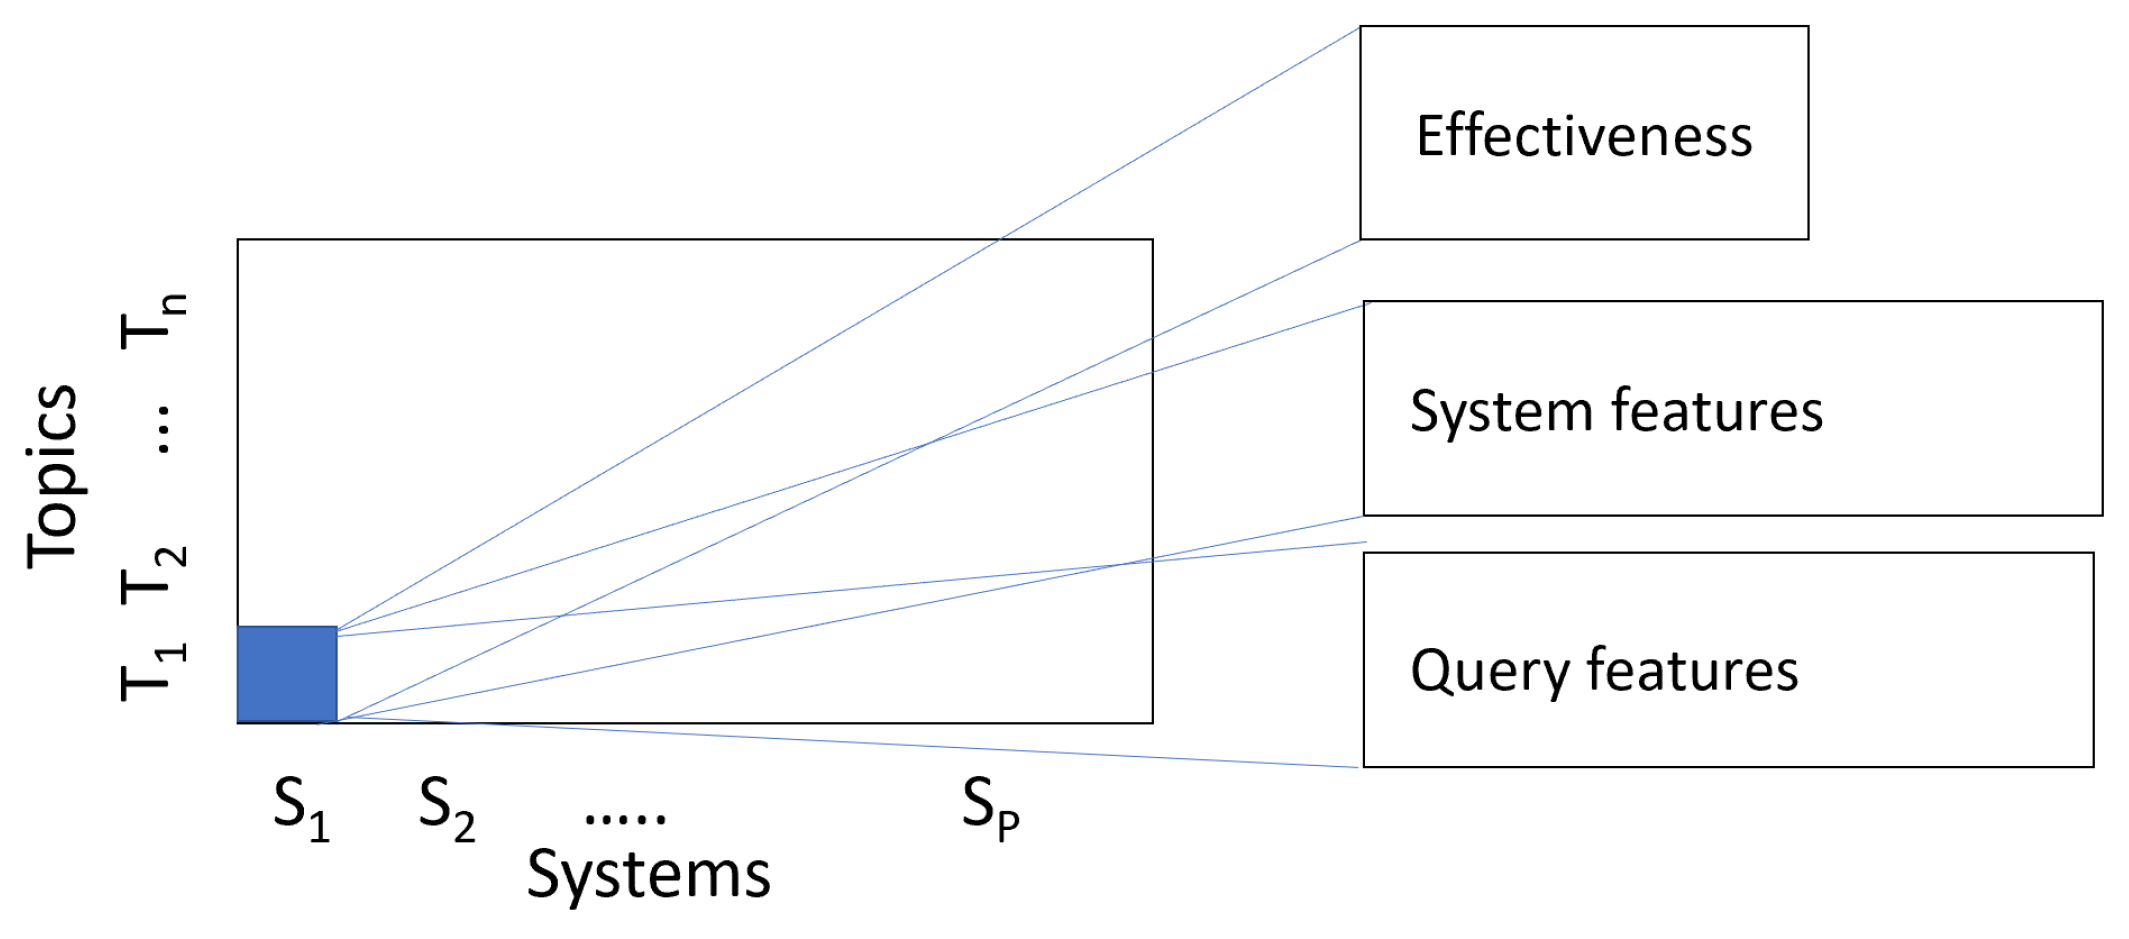
3.2. Data and Data Structures for System Effectiveness Analysis
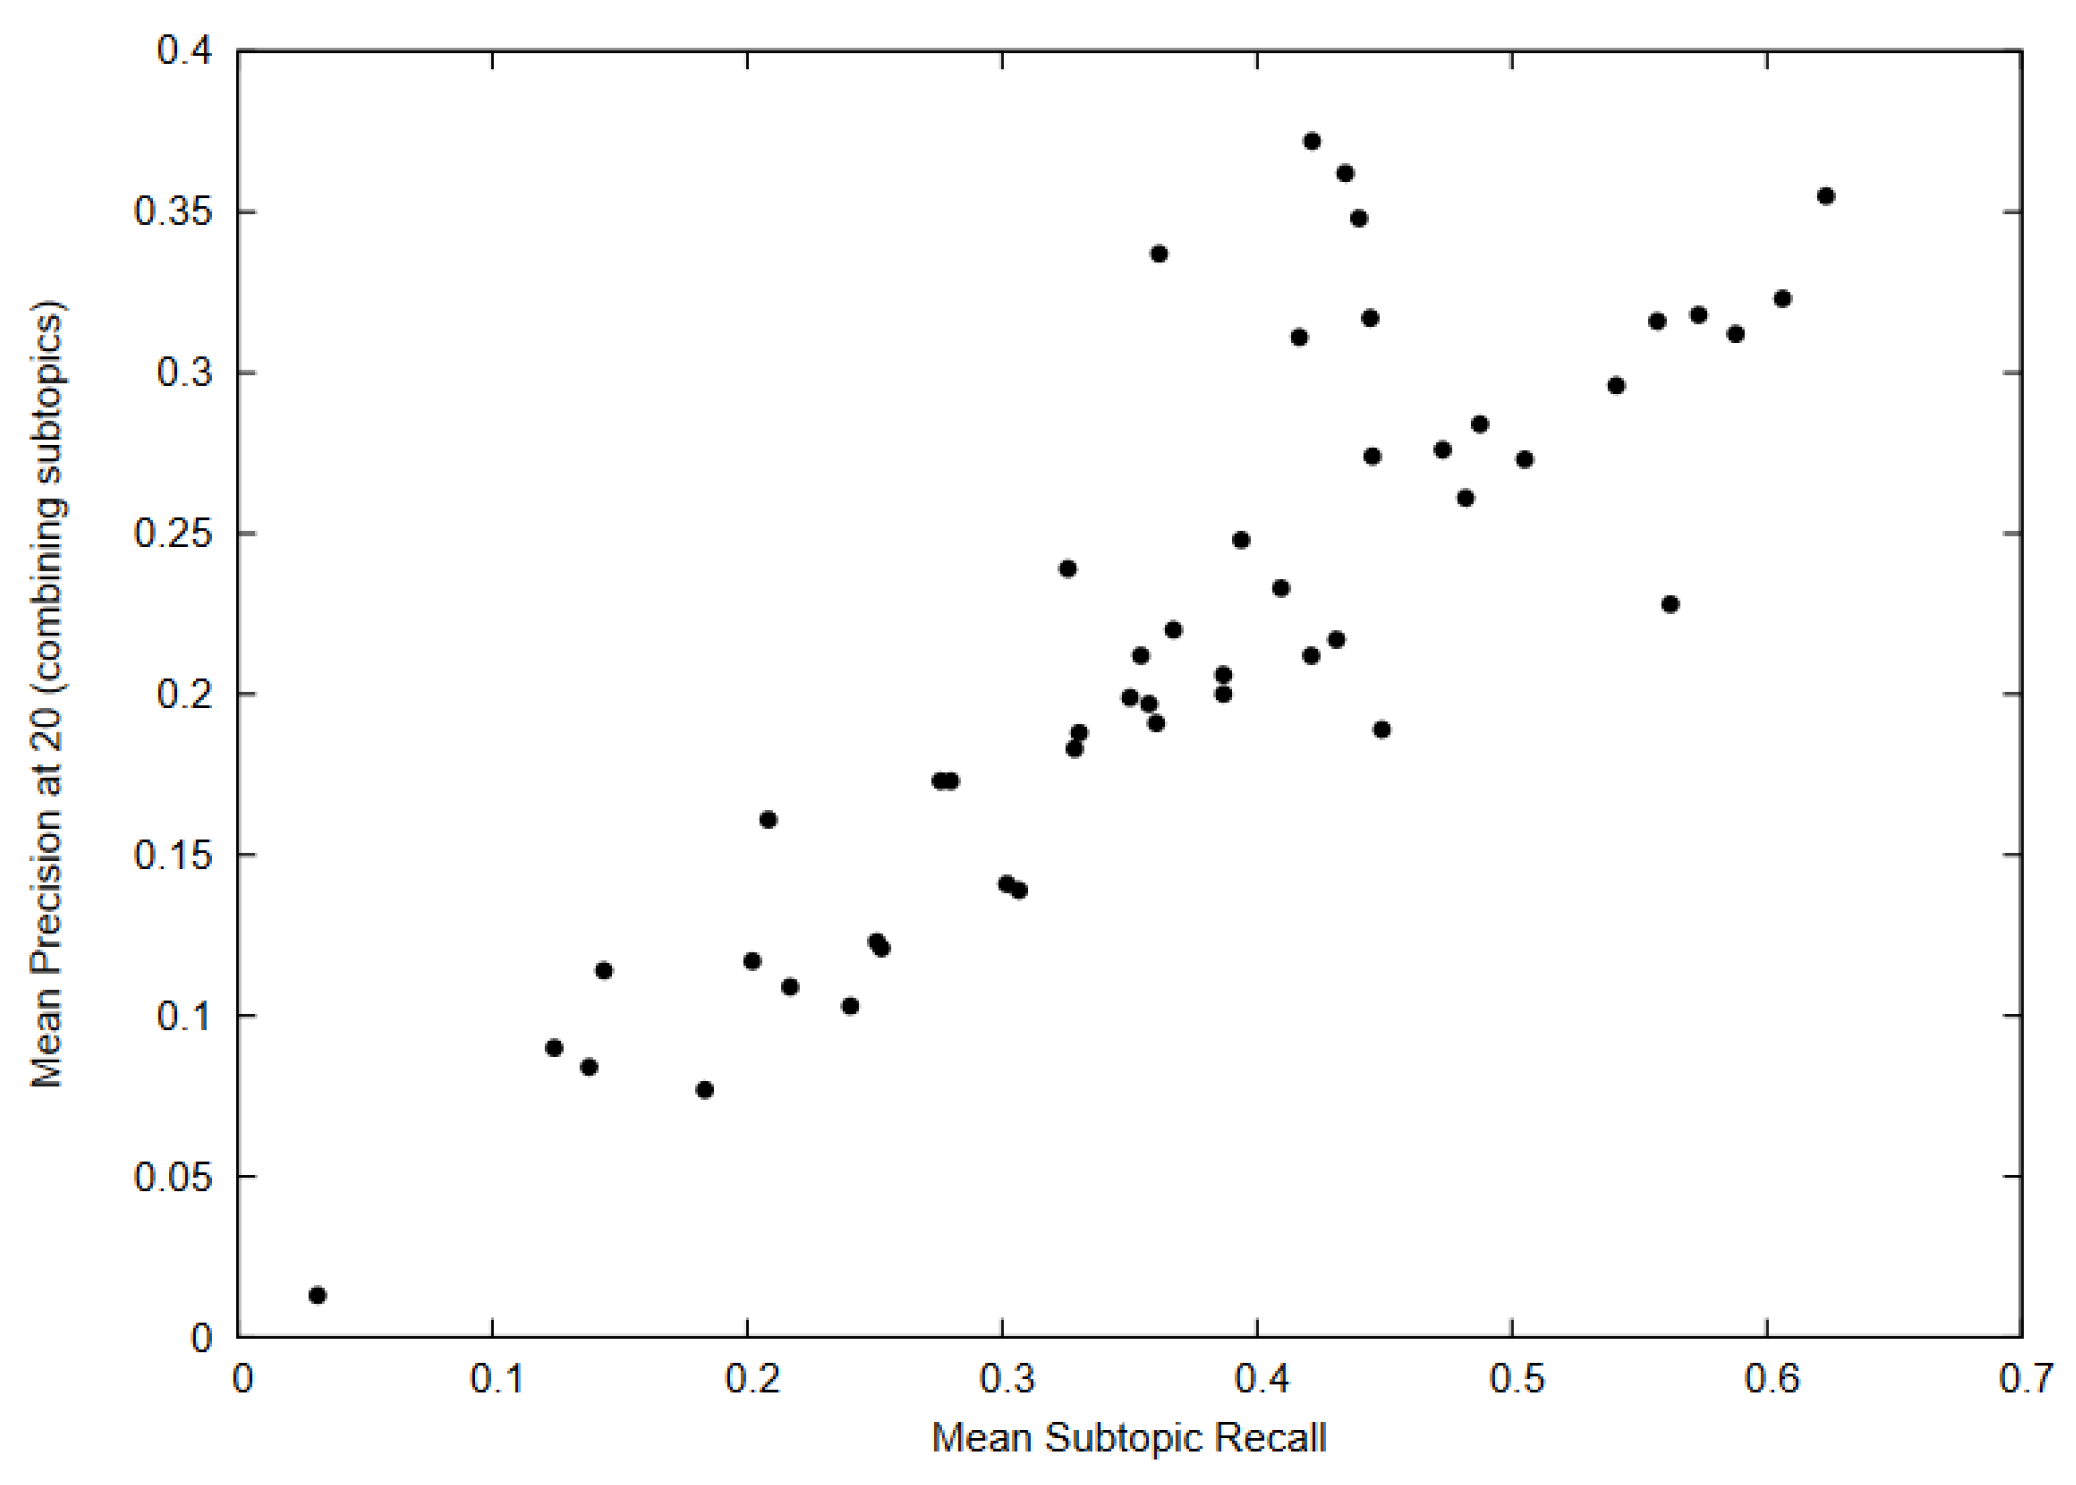
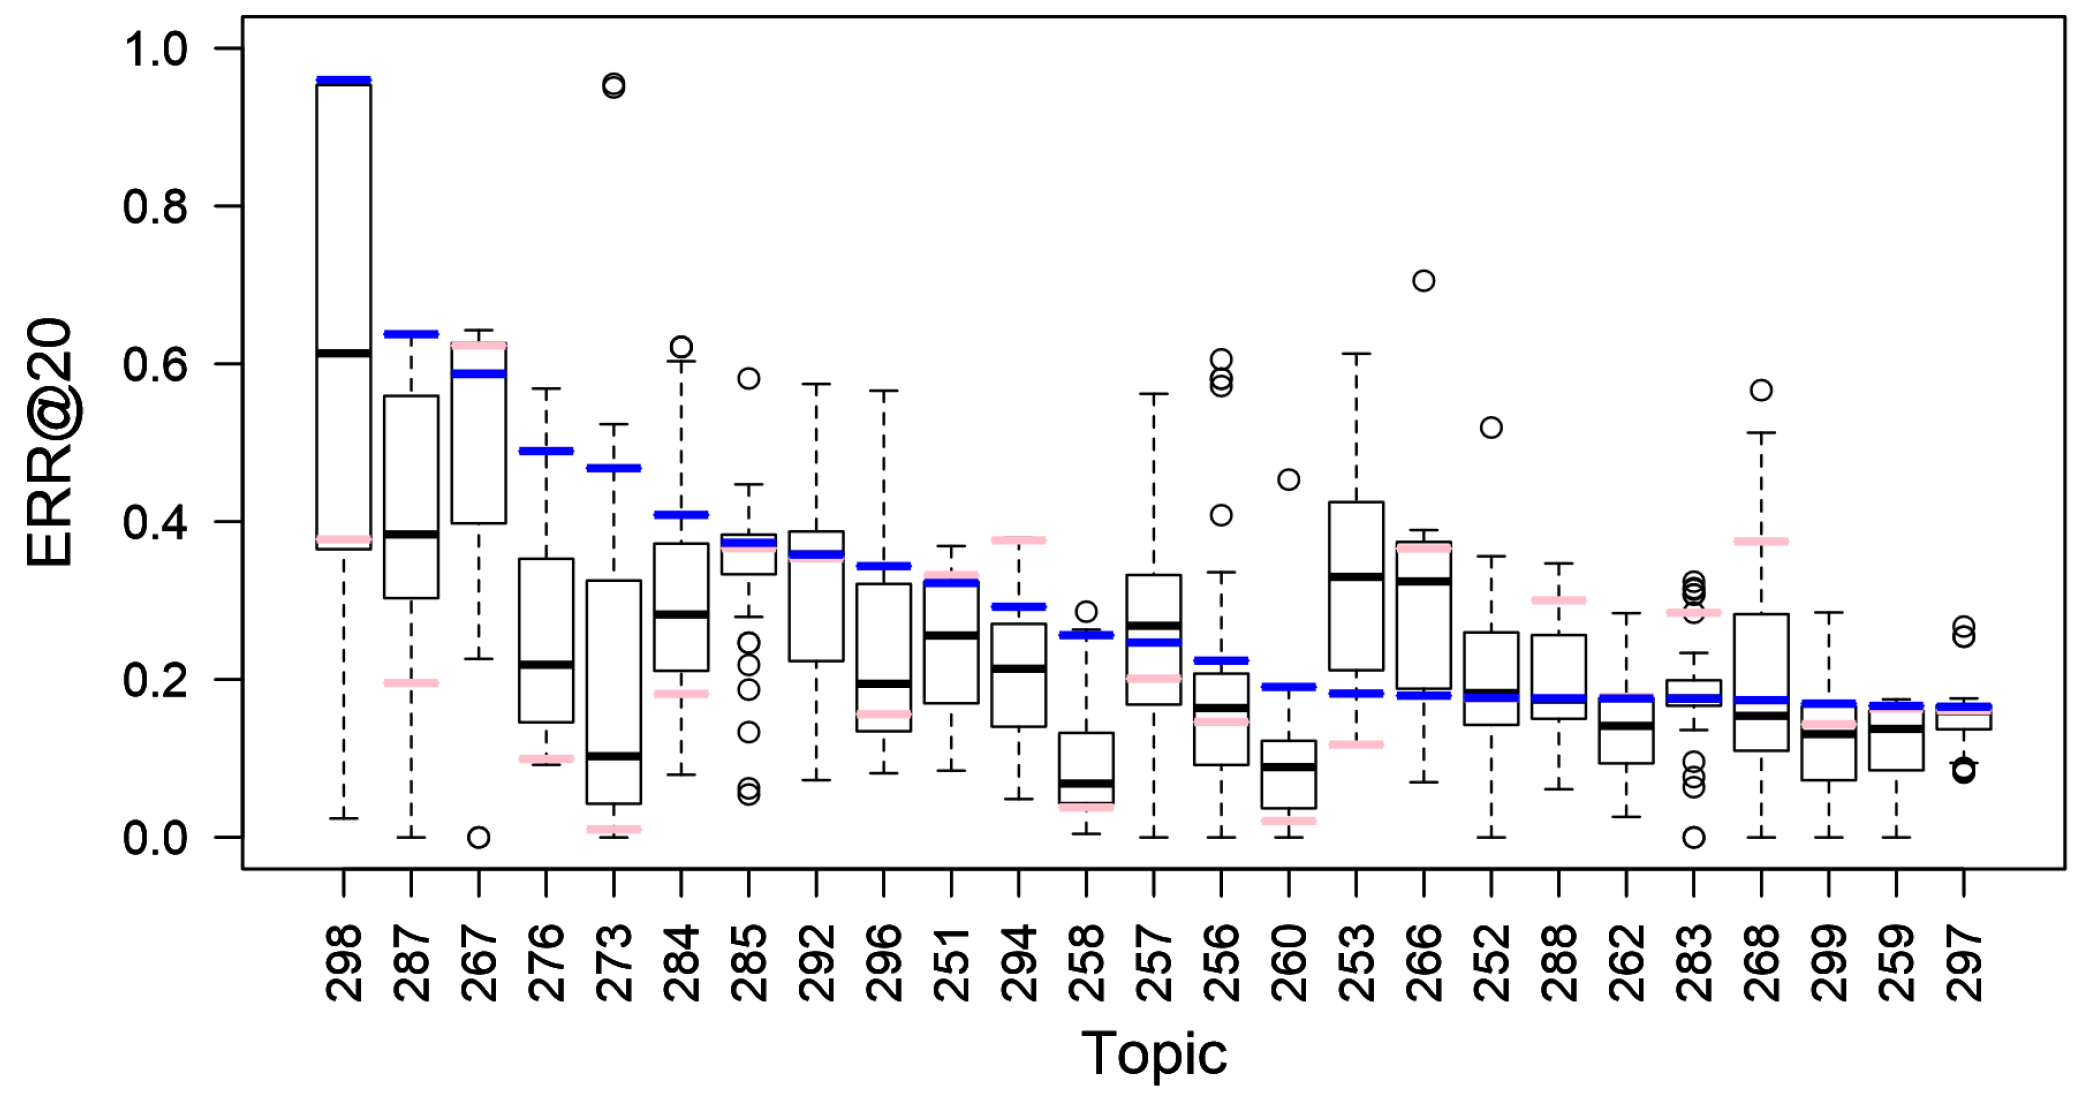
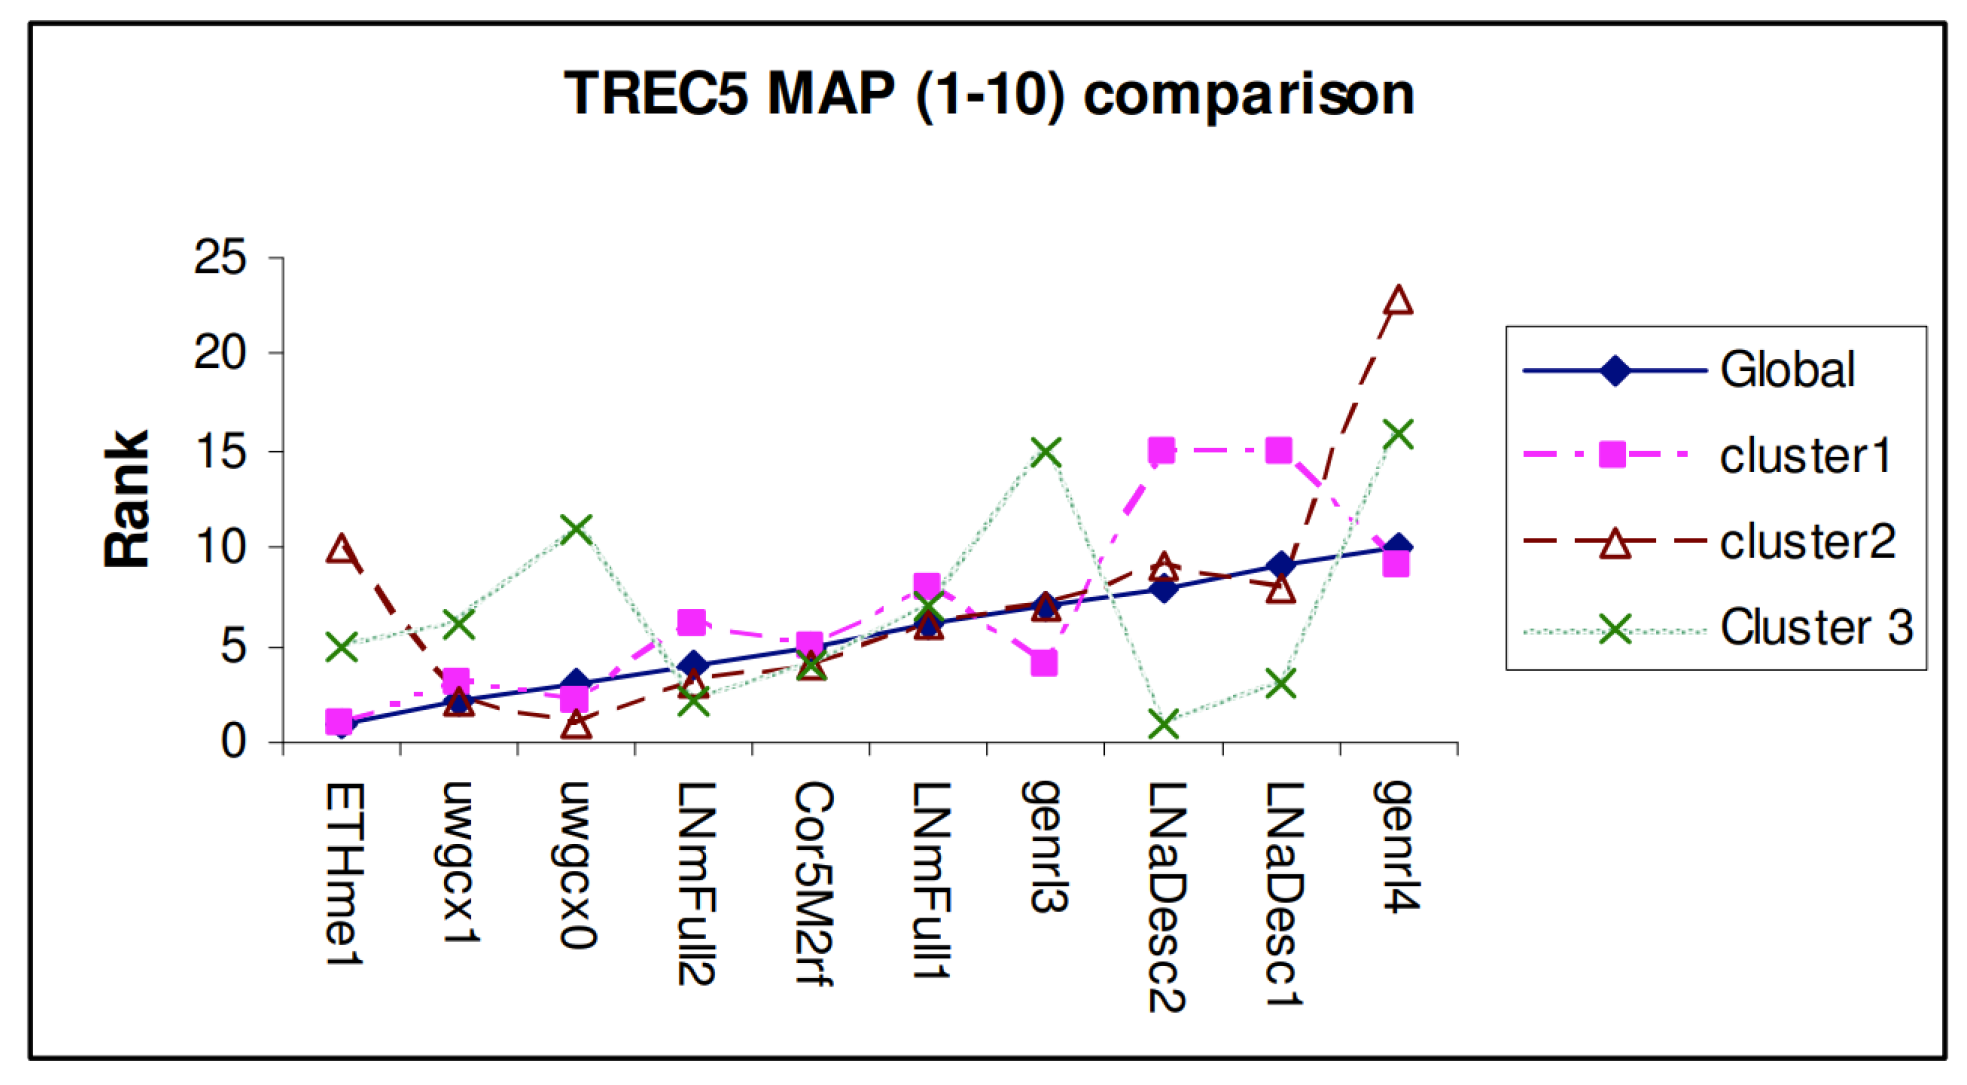
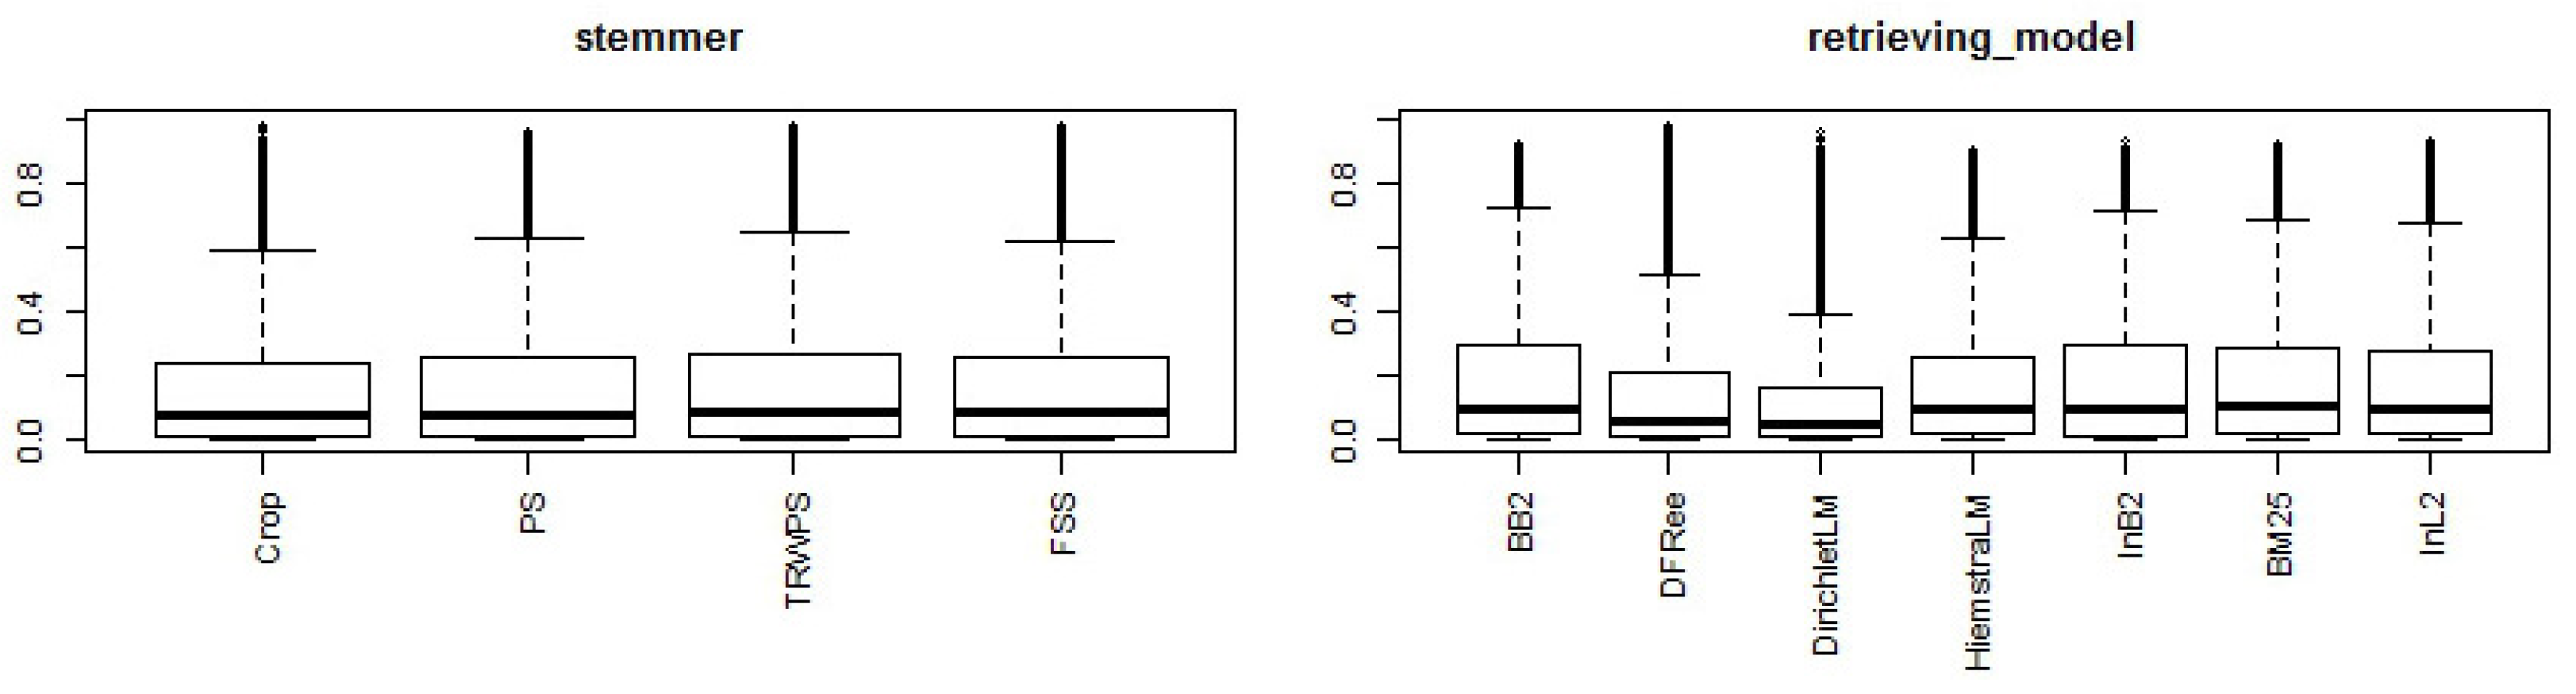
4. System Performance Analysis Based on Their Participation to Evaluation Challenges
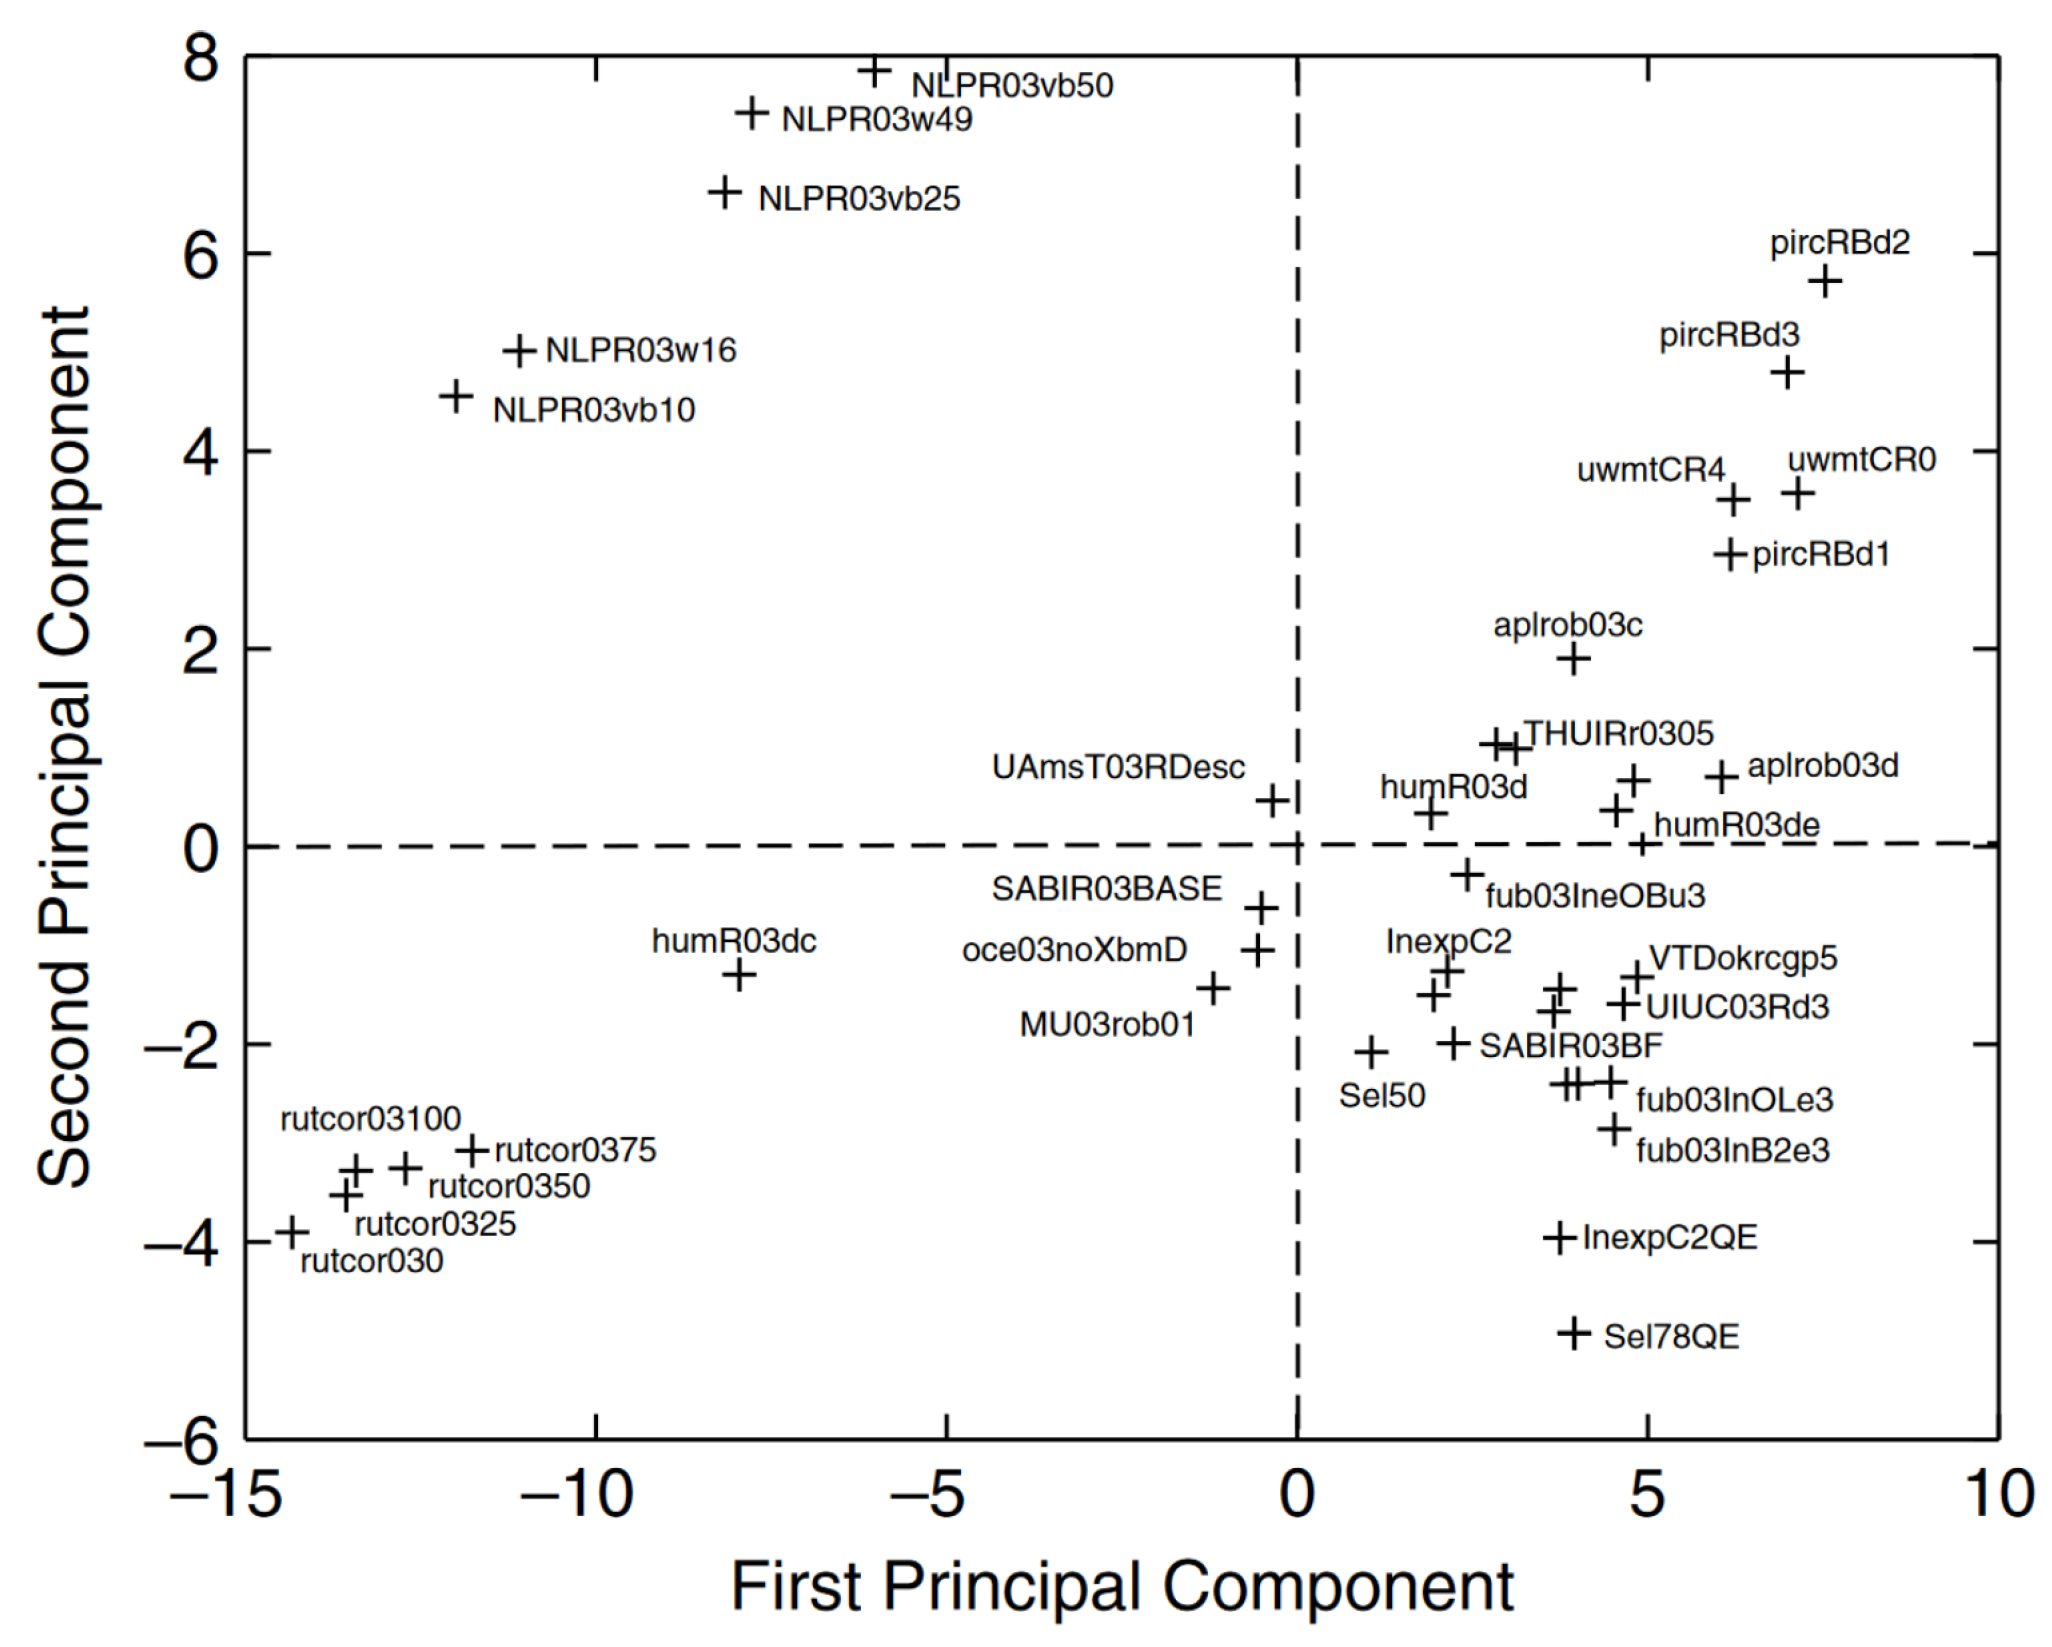
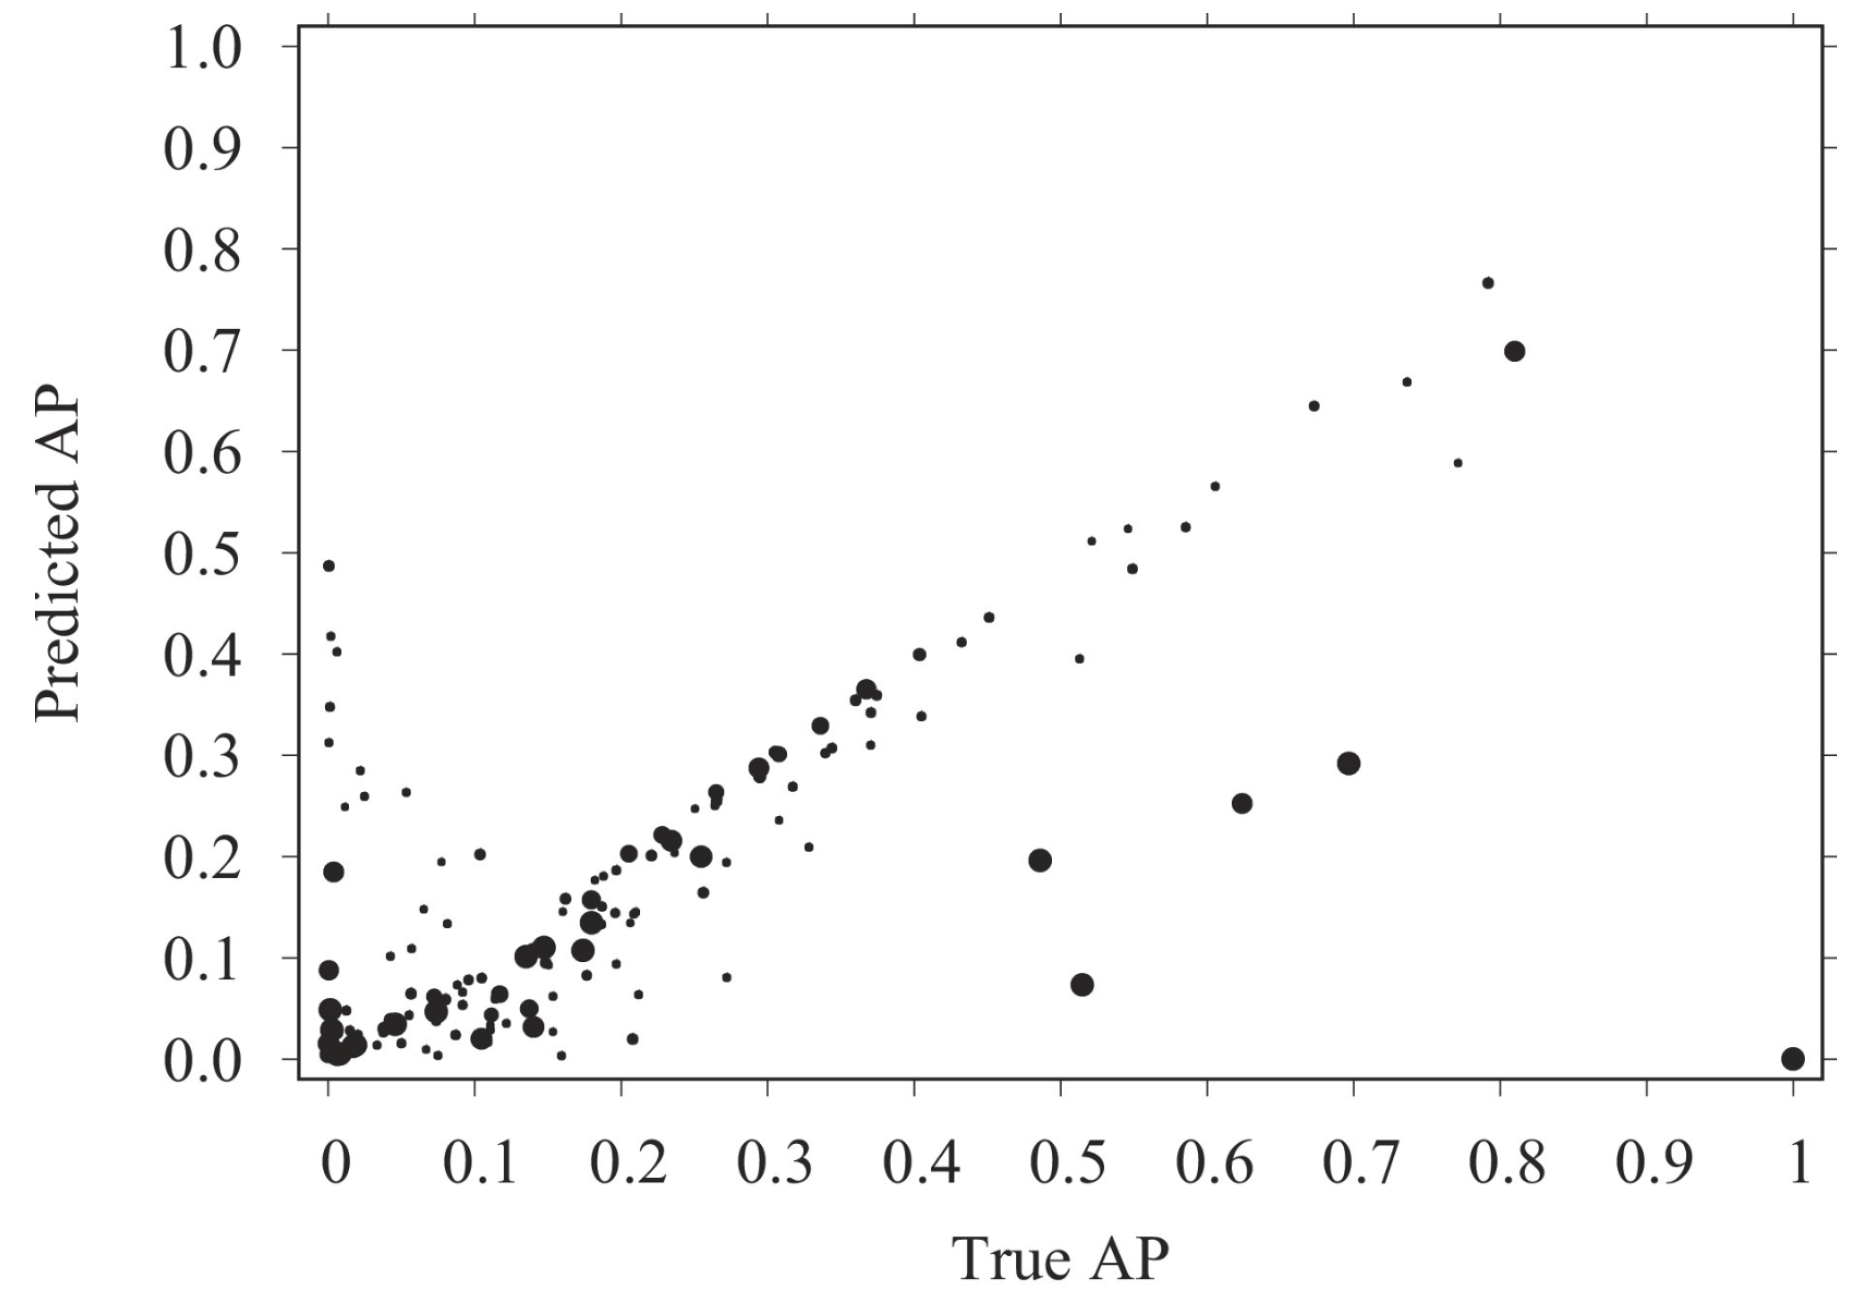
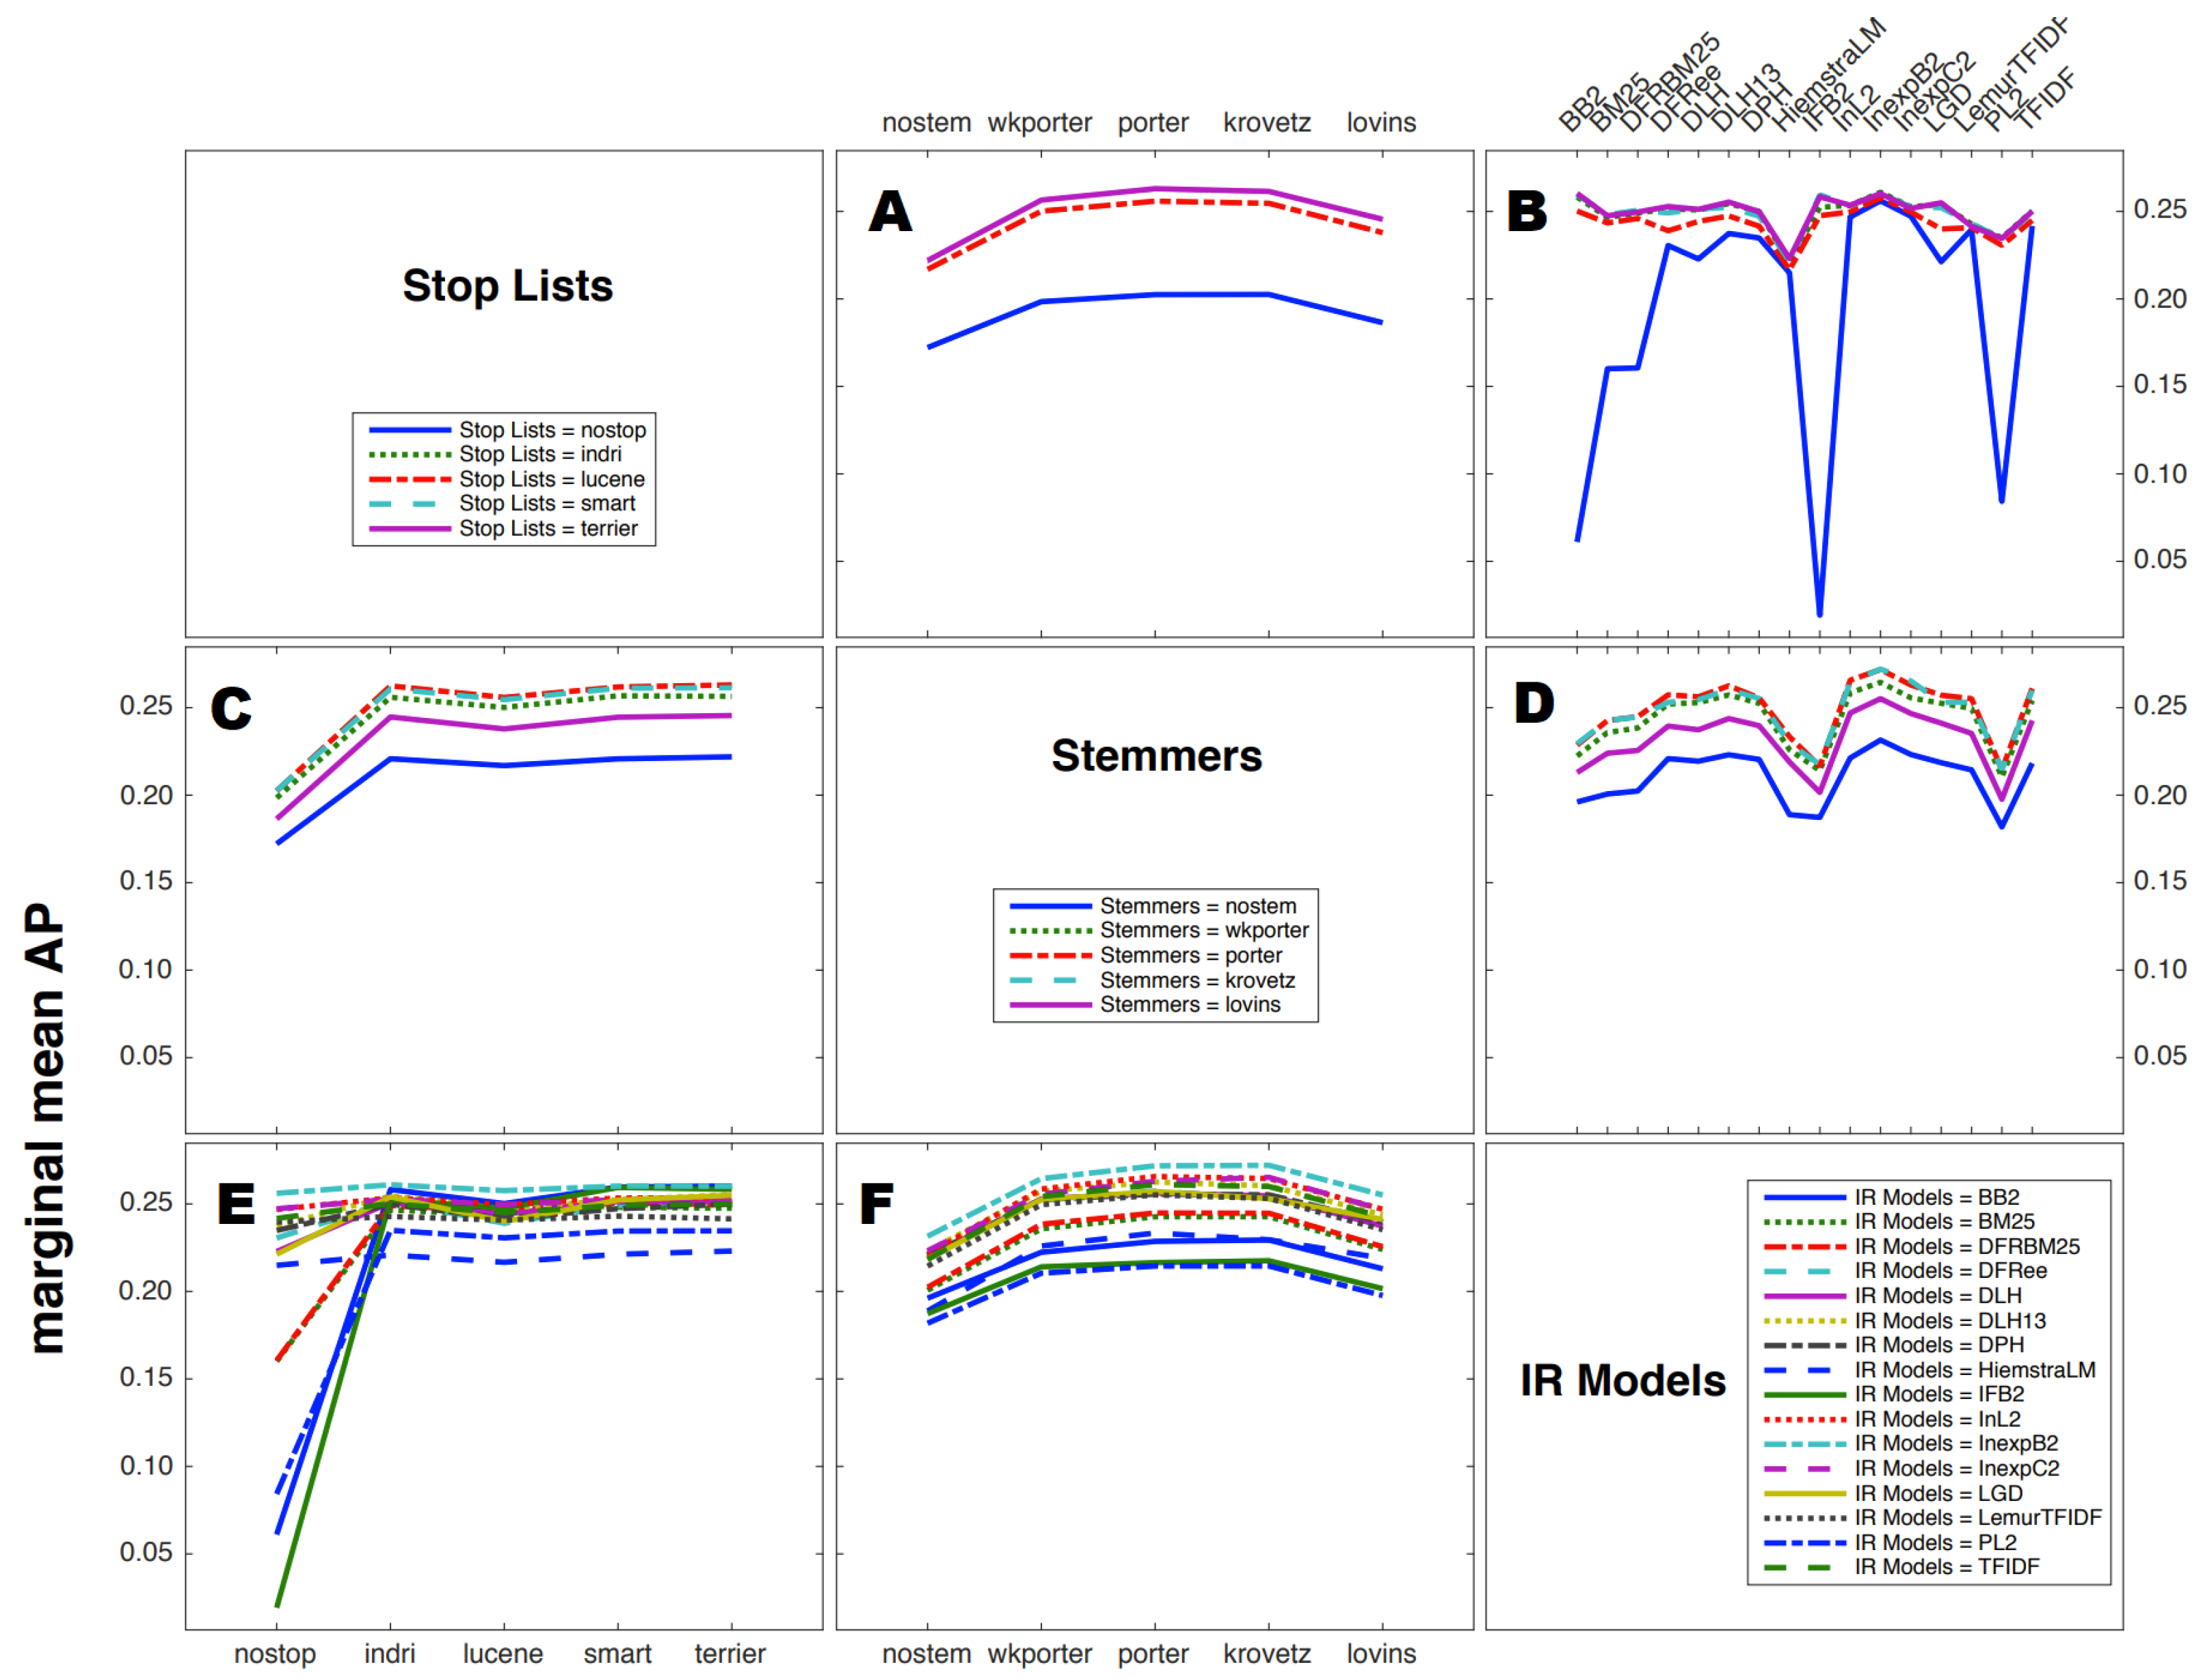
5. Analyses Based on Systems That Were Generated for the Study—The System Factor
6. The Query Factor
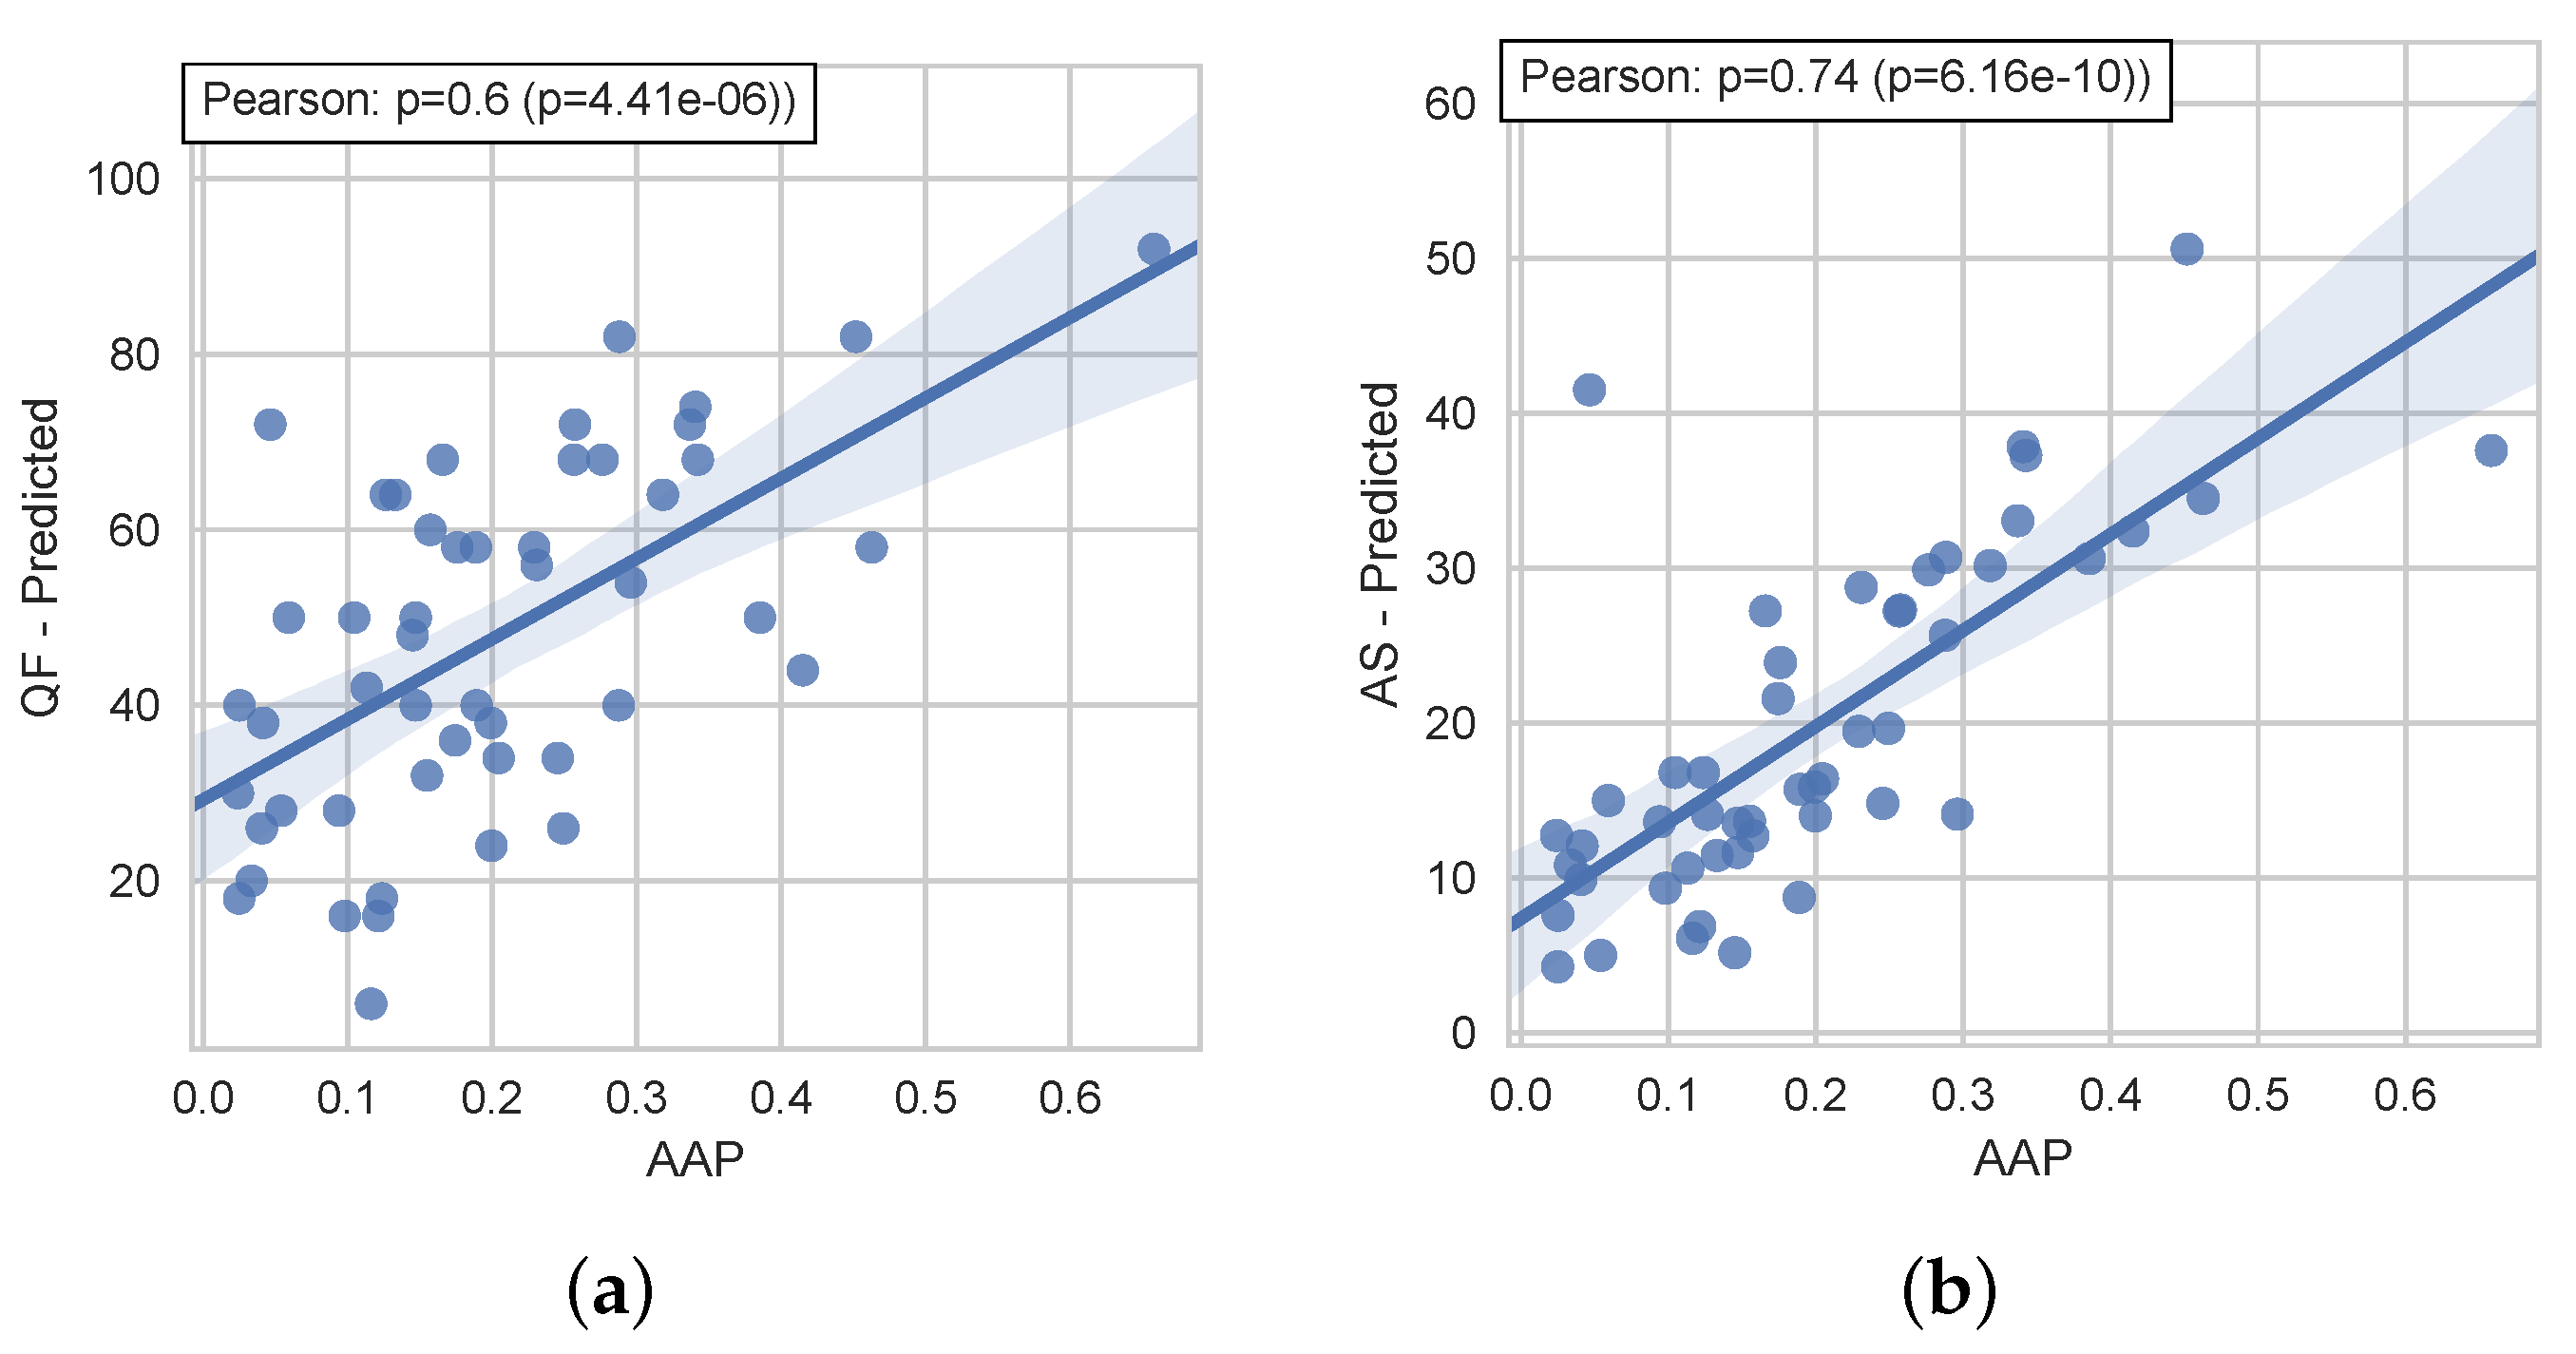
6.1. Considering the Queries and Their Pre- and Post-Retrieval Features
- Combination of query features might;
- It may explain that systems will fail in general.
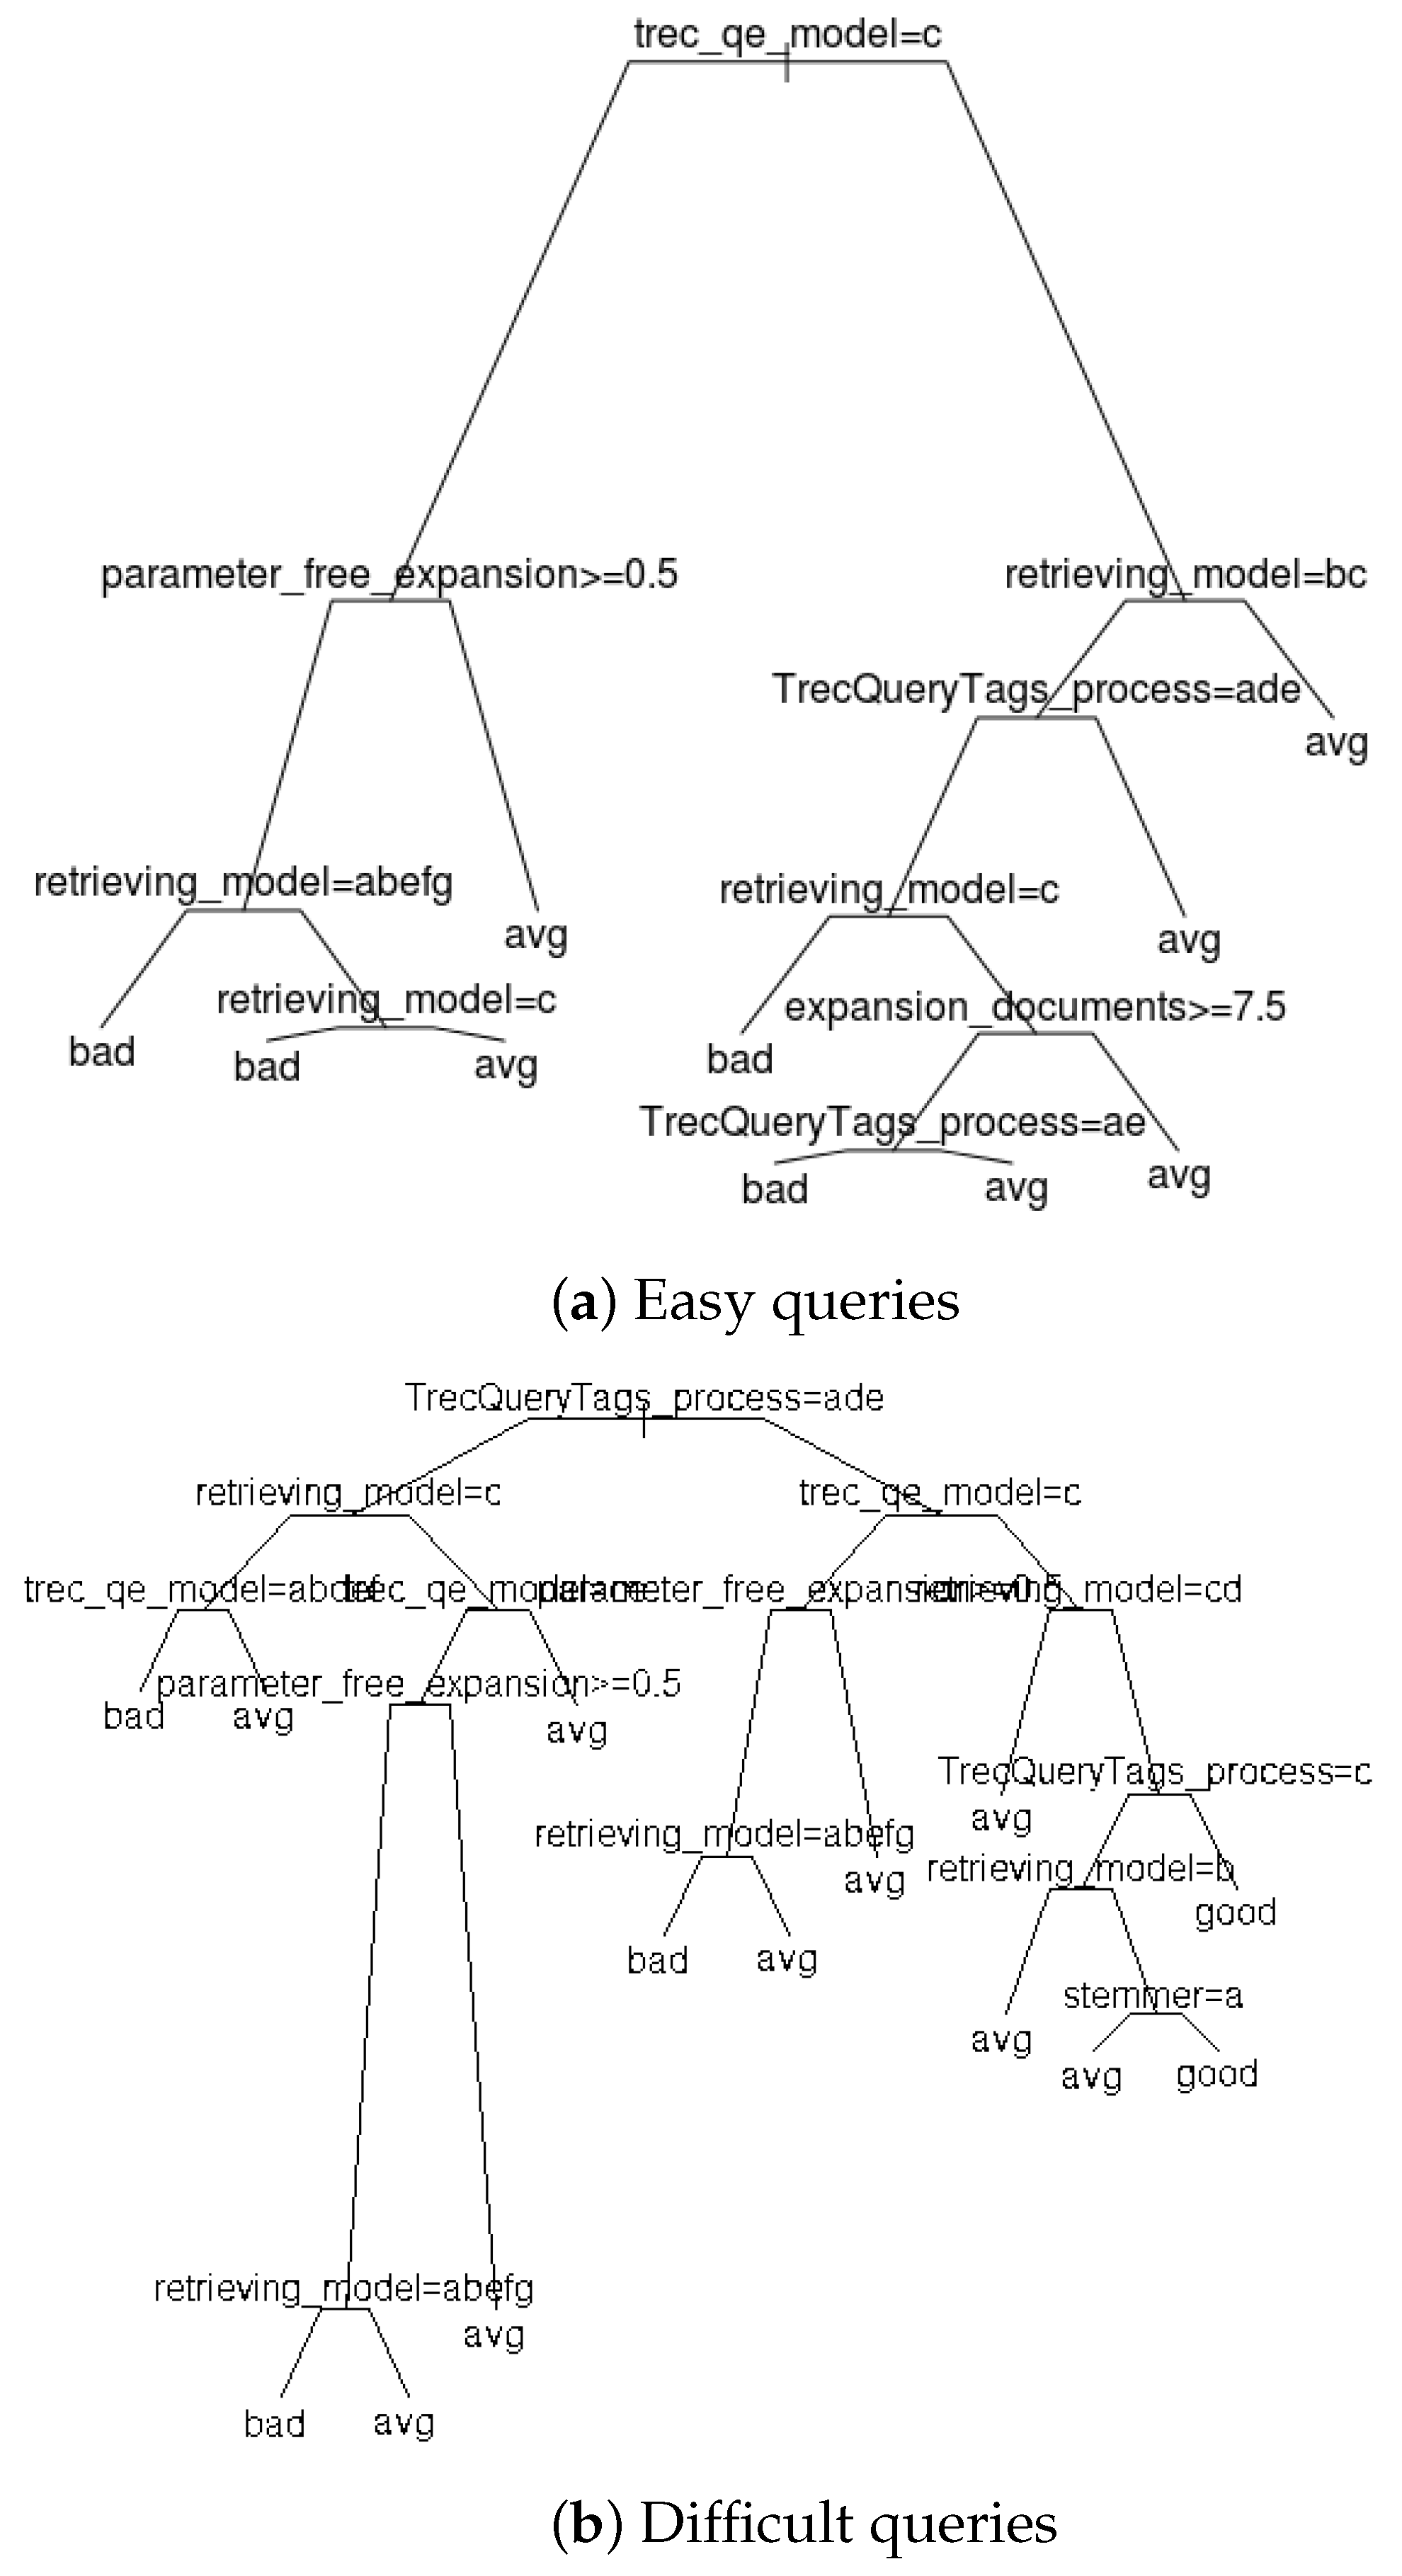
6.2. Relationship between the Query Factor and the System Factor
7. Discussion and Conclusions
- C1: it is possible to distinguish between effective and non-effective systems on average over a query set;
- C2: effectiveness of systems has increased over years thanks to the effort put in the domain;
- C4: some components and hyper-parameters are more influential than others and informed choices can be made;
- C5: the choice of the most appropriate components depends on the query level of difficulty.
- C6: a single query feature or a combination of features have not been proven to explain system effectiveness;
- C7: query features can explain somehow system effectiveness.
Funding
Conflicts of Interest
Abbreviations
| AP | Average Precision |
| CA | Correspondence Analysis |
| CIKM | Conference on Information and Knowledge Management |
| CLEF | Conference and Labs of the Evaluation Forum |
| IR | Information Retrieval |
| MAP | Mean Average Precision |
| PCA | Principal Component Analysis |
| QE | Query Expansion |
| QPP | Query Performance Prediction |
| SIGIR | Conference of the Association for Computing Machinery Special Interest Group in Information Retrieval |
| SQE | Selective Query Expansion |
| TREC | Text Retrieval Conference |
References
- Salton, G.; Wong, A.; Yang, C.S. A vector space model for automatic indexing. Commun. ACM 1975, 18, 613–620. [Google Scholar] [CrossRef]
- Robertson, S.E.; Jones, K.S. Relevance weighting of search terms. J. Am. Soc. Inf. Sci. 1976, 27, 129–146. [Google Scholar] [CrossRef]
- Robertson, S.; Zaragoza, H. The Probabilistic Relevance Framework: BM25 and Beyond; Now Publishers Inc.: Delft, The Netherlands, 2009; pp. 333–389. [Google Scholar]
- Ponte, J.M.; Croft, W.B. A Language Modeling Approach to Information Retrieval. In Proceedings of the 21st Annual International ACM SIGIR Conference on Research and Development in Information Retrieval, SIGIR ’98, Melbourne, Australia, 24–28 August 1998; ACM: New York, NY, USA, 1998; pp. 275–281. [Google Scholar] [CrossRef]
- Ounis, I.; Amati, G.; Plachouras, V.; He, B.; Macdonald, C.; Johnson, D. Terrier information retrieval platform. In European Conference on Information Retrieval; Springer: Berlin/Heidelberg, Germany, 2005; pp. 517–519. [Google Scholar]
- Taylor, M.; Zaragoza, H.; Craswell, N.; Robertson, S.; Burges, C. Optimisation methods for ranking functions with multiple parameters. In Proceedings of the 15th ACM International Conference on Information and Knowledge Management, Arlington, VA, USA, 6–11 November 2006; pp. 585–593. [Google Scholar]
- Ayter, J.; Chifu, A.; Déjean, S.; Desclaux, C.; Mothe, J. Statistical analysis to establish the importance of information retrieval parameters. J. Univers. Comput. Sci. 2015, 21, 1767–1789. [Google Scholar]
- Tague-Sutcliffe, J.; Blustein, J. A Statistical Analysis of the TREC-3 Data; NIST Special Publication SP: Washington, DC, USA, 1995; p. 385. [Google Scholar]
- Banks, D.; Over, P.; Zhang, N.F. Blind men and elephants: Six approaches to TREC data. Inf. Retr. 1999, 1, 7–34. [Google Scholar] [CrossRef]
- Dinçer, B.T. Statistical principal components analysis for retrieval experiments. J. Am. Soc. Inf. Sci. Technol. 2007, 58, 560–574. [Google Scholar] [CrossRef]
- Mothe, J.; Tanguy, L. Linguistic analysis of users’ queries: Towards an adaptive information retrieval system. In Proceedings of the 2007 Third International IEEE Conference on Signal-Image Technologies and Internet-Based System, Shanghai, China, 16–18 December 2007; pp. 77–84. [Google Scholar]
- Harman, D.; Buckley, C. The NRRC reliable information access (RIA) workshop. In Proceedings of the 27th Annual International ACM SIGIR Conference on Research and Development in Information Retrieval, Sheffield, UK, 25–29 July 2004; pp. 528–529. [Google Scholar]
- Mizzaro, S.; Robertson, S. Hits hits trec: Exploring ir evaluation results with network analysis. In Proceedings of the 30th Annual International ACM SIGIR Conference on Research and Development in Information Retrieval, Amsterdam, The Netherlands, 23–27 July 2007; pp. 479–486. [Google Scholar]
- Harman, D.; Buckley, C. Overview of the reliable information access workshop. Inf. Retr. 2009, 12, 615. [Google Scholar] [CrossRef]
- Bigot, A.; Chrisment, C.; Dkaki, T.; Hubert, G.; Mothe, J. Fusing different information retrieval systems according to query-topics: A study based on correlation in information retrieval systems and TREC topics. Inf. Retr. 2011, 14, 617. [Google Scholar] [CrossRef]
- Ferro, N.; Silvello, G. A general linear mixed models approach to study system component effects. In Proceedings of the 39th International ACM SIGIR conference on Research and Development in Information Retrieval, Pisa, Italy, 17–21 July 2016; pp. 25–34. [Google Scholar]
- Ferro, N.; Silvello, G. Toward an anatomy of IR system component performances. J. Assoc. Inf. Sci. Technol. 2018, 69, 187–200. [Google Scholar] [CrossRef]
- Louedec, J.; Mothe, J. A massive generation of ir runs: Demonstration paper. In Proceedings of the IEEE 7th International Conference on Research Challenges in Information Science (RCIS), Paris, France, 29–31 May 2013; pp. 1–2. [Google Scholar]
- Wilhelm, T.; Kürsten, J.; Eibl, M. A tool for comparative ir evaluation on component level. In Proceedings of the 34th International ACM SIGIR Conference on Research and Development in Information Retrieval, Beijing, China, 24–28 July 2011; pp. 1291–1292. [Google Scholar]
- Carmel, D.; Yom-Tov, E.; Darlow, A.; Pelleg, D. What makes a query difficult? In Proceedings of the 29th Annual International ACM SIGIR Conference on Research and Development in Information Retrieval, Seattle, WA, USA, 6–11 August 2006; pp. 390–397. [Google Scholar]
- Mothe, J.; Tanguy, L. Linguistic features to predict query difficulty. In ACM Conference on Research and Development in Information Retrieval, SIGIR, Predicting Query Difficulty-Methods and Applications Workshop; ACM: New York, NY, USA, 2005; pp. 7–10. [Google Scholar]
- Zamani, H.; Croft, W.B.; Culpepper, J.S. Neural query performance prediction using weak supervision from multiple signals. In Proceedings of the 41st International ACM SIGIR Conference on Research & Development in Information Retrieval, Ann Arbor, MI, USA, 8–12 July 2018; pp. 105–114. [Google Scholar]
- Carpineto, C.; Romano, G. A survey of automatic query expansion in information retrieval. ACM Comput. Surv. (CSUR) 2012, 44, 1–50. [Google Scholar] [CrossRef]
- Azad, H.K.; Deepak, A. Query expansion techniques for information retrieval: A survey. Inf. Process. Manag. 2019, 56, 1698–1735. [Google Scholar] [CrossRef]
- Moral, C.; de Antonio, A.; Imbert, R.; Ramírez, J. A survey of stemming algorithms in information retrieval. Inf. Res. Int. Electron. J. 2014, 19, n1. [Google Scholar]
- Kamphuis, C.; de Vries, A.P.; Boytsov, L.; Lin, J. Which BM25 Do You Mean? A Large-Scale Reproducibility Study of Scoring Variants. In Advances in Information Retrieval; Jose, J.M., Yilmaz, E., Magalhães, J., Castells, P., Ferro, N., Silva, M.J., Martins, F., Eds.; Springer International Publishing: Cham, Switzerland, 2020; pp. 28–34. [Google Scholar]
- Mizzaro, S. How many relevances in information retrieval? Interact. Comput. 1998, 10, 303–320. [Google Scholar] [CrossRef]
- Ruthven, I. Relevance behaviour in TREC. J. Doc. 2014, 70, 1098–1117. [Google Scholar] [CrossRef]
- Hofstätter, S.; Lin, S.C.; Yang, J.H.; Lin, J.; Hanbury, A. Efficiently teaching an effective dense retriever with balanced topic aware sampling. In Proceedings of the 44th International ACM SIGIR Conference on Research and Development in Information Retrieval, Virtual Event. 11–15 July 2021; pp. 113–122. [Google Scholar]
- Breslow, N.E.; Clayton, D.G. Approximate inference in generalized linear mixed models. J. Am. Stat. Assoc. 1993, 88, 9–25. [Google Scholar]
- McCullagh, P.; Nelder, J.A. Generalized Linear Models, 2nd ed.; Chapman and Hall: London, UK, 1989. [Google Scholar]
- Dumais, S.T. LSA and information retrieval: Getting back to basics. Handb. Latent Semant. Anal. 2007, 293, 322. [Google Scholar]
- Sarwar, B.; Karypis, G.; Konstan, J.; Riedl, J. Application of Dimensionality Reduction in Recommender System—A Case Study; Technical Report; Department of Computer Science and Engineering, University of Minnesota: Minneapolis, MN, USA, 2000. [Google Scholar]
- Benzécri, J.P. Statistical analysis as a tool to make patterns emerge from data. In Methodologies of Pattern Recognition; Elsevier: Amsterdam, The Netherlands, 1969; pp. 35–74. [Google Scholar]
- Ward, J.H., Jr. Hierarchical grouping to optimize an objective function. J. Am. Stat. Assoc. 1963, 58, 236–244. [Google Scholar] [CrossRef]
- Li, B.; Friedman, J.; Olshen, R.; Stone, C. Classification and regression trees (CART). Biometrics 1984, 40, 358–361. [Google Scholar]
- Ho, T.K. Random decision forests. In Proceedings of the 3rd International Conference on Document Analysis and Recognition, Montreal, QC, Canada, 14–16 August 1995; Volume 1, pp. 278–282. [Google Scholar]
- Gunning, D. Explainable Artificial Intelligence; Defense Advanced Research Projects Agency (DARPA): Arlington, VA, USA, 2017; p. 2. [Google Scholar]
- Zhang, Y.; Chen, X. Explainable recommendation: A survey and new perspectives. Found. Trends® Inf. Retr. 2020, 14, 1–101. [Google Scholar] [CrossRef]
- Harman, D. Overview of the First Text Retrieval Conference (trec-1); NIST Special Publication SP: Washington, DC, USA, 1992; pp. 1–532. [Google Scholar]
- Harman, D. Overview of the first TREC conference. In Proceedings of the 16th Annual International ACM SIGIR Conference on Research and Development in Information Retrieval, Pittsburgh, PA, USA, 27 June–1 July 1993; pp. 36–47. [Google Scholar]
- Buckley, C.; Mitra, M.; Walz, J.A.; Cardie, C. SMART high precision: TREC 7; NIST Special Publication SP: Washington, DC, USA, 1999; pp. 285–298. [Google Scholar]
- Clarke, C.L.; Craswell, N.; Soboroff, I. Overview of the Trec 2009 Web Track; Technical Report; University of Waterloo: Waterloo, ON, Canada, 2009. [Google Scholar]
- Collins-Thompson, K.; Macdonald, C.; Bennett, P.; Diaz, F.; Voorhees, E.M. TREC 2014 Web Track Overview; Technical Report; University of Michigan: Ann Arbor, MI, USA, 2015. [Google Scholar]
- Kompaore, D.; Mothe, J.; Baccini, A.; Dejean, S. Query clustering and IR system detection. Experiments on TREC data. In Proceedings of the ACM International Workshop for Ph. D. Students in Information and Knowledge Management (ACM PIKM 2007), Lisboa, Portugal, 5–10 November 2007. [Google Scholar]
- Hanbury, A.; Müller, H. Automated component–level evaluation: Present and future. In International Conference of the Cross-Language Evaluation Forum for European Languages; Springer: Berlin/Heidelberg, Germany, 2010; pp. 124–135. [Google Scholar]
- Arslan, A.; Dinçer, B.T. A selective approach to index term weighting for robust information retrieval based on the frequency distributions of query terms. Inf. Retr. J. 2019, 22, 543–569. [Google Scholar] [CrossRef]
- Di Buccio, E.; Dussin, M.; Ferro, N.; Masiero, I.; Santucci, G.; Tino, G. Interactive Analysis and Exploration of Experimental Evaluation Results. In European Workshop on Human-Computer Interaction and Information Retrieval EuroHCIR; Citeseer: Nijmegen, The Netherlands, 2011; pp. 11–14. [Google Scholar]
- Compaoré, J.; Déjean, S.; Gueye, A.M.; Mothe, J.; Randriamparany, J. Mining information retrieval results: Significant IR parameters. In Proceedings of the First International Conference on Advances in Information Mining and Management, Barcelona, Spain, 23–29 October 2011; Volume 74. [Google Scholar]
- Hopfgartner, F.; Hanbury, A.; Müller, H.; Eggel, I.; Balog, K.; Brodt, T.; Cormack, G.V.; Lin, J.; Kalpathy-Cramer, J.; Kando, N.; et al. Evaluation-as-a-service for the computational sciences: Overview and outlook. J. Data Inf. Qual. (JDIQ) 2018, 10, 1–32. [Google Scholar] [CrossRef]
- Kürsten, J.; Eibl, M. A large-scale system evaluation on component-level. In European Conference on Information Retrieval; Springer: Berlin/Heidelberg, Germany, 2011; pp. 679–682. [Google Scholar]
- Angelini, M.; Fazzini, V.; Ferro, N.; Santucci, G.; Silvello, G. CLAIRE: A combinatorial visual analytics system for information retrieval evaluation. Inf. Process. Manag. 2018, 54, 1077–1100. [Google Scholar] [CrossRef]
- Dejean, S.; Mothe, J.; Ullah, M.Z. Studying the variability of system setting effectiveness by data analytics and visualization. In International Conference of the Cross-Language Evaluation Forum for European Languages; Springer: Cham, Switzerland, 2019; pp. 62–74. [Google Scholar]
- De Loupy, C.; Bellot, P. Evaluation of document retrieval systems and query difficulty. In Proceedings of the Second International Conference on Language Resources and Evaluation (LREC 2000) Workshop, Athens, Greece, 31 May–2 June 2000; pp. 32–39. [Google Scholar]
- Banerjee, S.; Pedersen, T. Extended gloss overlaps as a measure of semantic relatedness. In Proceedings of the IJCAI 2003, Acapulco, Mexico, 9–15 August 2003; pp. 805–810. [Google Scholar]
- Patwardhan, S.; Pedersen, T. Using WordNet-based context vectors to estimate the semantic relatedness of concepts. In Proceedings of the Workshop on Making Sense of Sense: Bringing Psycholinguistics and Computational Linguistics Together, Trento, Italy, 4 April 2006. [Google Scholar]
- Cronen-Townsend, S.; Zhou, Y.; Croft, W.B. Predicting query performance. In Proceedings of the 25th Annual International ACM SIGIR Conference on Research and Development in Information Retrieval, Tampere, Finland, 11–15 August 2002; pp. 299–306. [Google Scholar]
- Scholer, F.; Williams, H.E.; Turpin, A. Query association surrogates for web search. J. Am. Soc. Inf. Sci. Technol. 2004, 55, 637–650. [Google Scholar] [CrossRef]
- He, B.; Ounis, I. Inferring query performance using pre-retrieval predictors. In International Symposium on String Processing and Information Retrieval; Springer: Berlin/Heidelberg, Germany, 2004; pp. 43–54. [Google Scholar]
- Hauff, C.; Hiemstra, D.; de Jong, F. A survey of pre-retrieval query performance predictors. In Proceedings of the 17th ACM Conference on Information and Knowledge Management, Napa Valley, CA, USA, 26–30 October 2008; pp. 1419–1420. [Google Scholar]
- Zhao, Y.; Scholer, F.; Tsegay, Y. Effective pre-retrieval query performance prediction using similarity and variability evidence. In European Conference on Information Retrieval; Springer: Berlin/Heidelberg, Germany, 2008; pp. 52–64. [Google Scholar]
- Sehgal, A.K.; Srinivasan, P. Predicting performance for gene queries. In Proceedings of the ACM SIGIR 2005 Workshop on Predicting Query Difficulty-Methods and Applications; Available online: http://www.haifa.il.ibm.com/sigir05-qp (accessed on 15 May 2022).
- Zhou, Y.; Croft, W.B. Ranking robustness: A novel framework to predict query performance. In Proceedings of the 15th ACM International Conference on Information and Knowledge Management, Arlington, VA, USA, 6–11 November 2006; pp. 567–574. [Google Scholar]
- Vinay, V.; Cox, I.J.; Milic-Frayling, N.; Wood, K. On ranking the effectiveness of searches. In Proceedings of the 29th Annual International ACM SIGIR Conference on Research and Development in Information Retrieval, Seattle, WA, USA, 6–11 August 2006; pp. 398–404. [Google Scholar]
- Aslam, J.A.; Pavlu, V. Query hardness estimation using Jensen-Shannon divergence among multiple scoring functions. In European Conference on Information Retrieval; Springer: Berlin/Heidelberg, Germany, 2007; pp. 198–209. [Google Scholar]
- Zhou, Y.; Croft, W.B. Query performance prediction in web search environments. In Proceedings of the 30th Annual International ACM SIGIR Conference on Research and Development in Information Retrieval, Amsterdam, The Netherlands, 23–27 July 2007; pp. 543–550. [Google Scholar]
- Shtok, A.; Kurland, O.; Carmel, D. Predicting query performance by query-drift estimation. In Conference on the Theory of Information Retrieval; Springer: Berlin/Heidelberg, Germany, 2009; pp. 305–312. [Google Scholar]
- Carmel, D.; Yom-Tov, E. Estimating the query difficulty for information retrieval. Synth. Lect. Inf. Concepts Retr. Serv. 2010, 2, 1–89. [Google Scholar]
- Cummins, R.; Jose, J.; O’Riordan, C. Improved query performance prediction using standard deviation. In Proceedings of the 34th International ACM SIGIR Conference on Research and Development in Information Retrieval, Beijing, China, 24–28 July 2011; pp. 1089–1090. [Google Scholar]
- Roitman, H.; Erera, S.; Weiner, B. Robust standard deviation estimation for query performance prediction. In Proceedings of the ACM SIGIR International Conference on Theory of Information Retrieval, Amsterdam, The Netherlands, 1–4 October 2017; pp. 245–248. [Google Scholar]
- Chifu, A.G.; Laporte, L.; Mothe, J.; Ullah, M.Z. Query performance prediction focused on summarized letor features. In Proceedings of the 41st International ACM SIGIR Conference on Research & Development in Information Retrieval, Ann Arbor, MI, USA, 8–12 July 2018; pp. 1177–1180. [Google Scholar]
- Zhang, Z.; Chen, J.; Wu, S. Query performance prediction and classification for information search systems. In Asia-Pacific Web (APWeb) and Web-Age Information Management (WAIM) Joint International Conference on Web and Big Data; Springer: Cham, Switzerland, 2018; pp. 277–285. [Google Scholar]
- Khodabakhsh, M.; Bagheri, E. Semantics-enabled query performance prediction for ad hoc table retrieval. Inf. Process. Manag. 2021, 58, 102399. [Google Scholar] [CrossRef]
- Molina, S.; Mothe, J.; Roques, D.; Tanguy, L.; Ullah, M.Z. IRIT-QFR: IRIT query feature resource. In International Conference of the Cross-Language Evaluation Forum for European Languages; Springer: Cham, Switzerland, 2017; pp. 69–81. [Google Scholar]
- Macdonald, C.; He, B.; Ounis, I. Predicting query performance in intranet search. In Proceedings of the SIGIR 2005 Query Prediction Workshop, Salvador, Brazil, 15–19 August 2005. [Google Scholar]
- Faggioli, G.; Zendel, O.; Culpepper, J.S.; Ferro, N.; Scholer, F. sMARE: A new paradigm to evaluate and understand query performance prediction methods. Inf. Retr. J. 2022, 25, 94–122. [Google Scholar] [CrossRef]
- Hashemi, H.; Zamani, H.; Croft, W.B. Performance Prediction for Non-Factoid Question Answering. In Proceedings of the 2019 ACM SIGIR International Conference on Theory of Information Retrieval, Paris, France, 21–25 July 2019; pp. 55–58. [Google Scholar]
- Roy, D.; Ganguly, D.; Mitra, M.; Jones, G.J. Estimating Gaussian mixture models in the local neighbourhood of embedded word vectors for query performance prediction. Inf. Process. Manag. 2019, 56, 1026–1045. [Google Scholar] [CrossRef]
- Anscombe, F. American Statistical Association, Taylor & Francis, Ltd. are collaborating with JSTOR to. Am. Stat. 1973, 27, 17–21. [Google Scholar]
- Grivolla, J.; Jourlin, P.; de Mori, R. Automatic Classification of Queries by Expected Retrieval Performance; SIGIR: Salvador, Brazil, 2005. [Google Scholar]
- Raiber, F.; Kurland, O. Query-performance prediction: Setting the expectations straight. In Proceedings of the 37th International ACM SIGIR Conference on Research & Development in Information Retrieval, Gold Coast, Australia, 6–11 July 2014; pp. 13–22. [Google Scholar]
- Mizzaro, S.; Mothe, J.; Roitero, K.; Ullah, M.Z. Query performance prediction and effectiveness evaluation without relevance judgments: Two sides of the same coin. In Proceedings of the 41st International ACM SIGIR Conference on Research & Development in Information Retrieval, Ann Arbor, MI, USA, 8–12 July 2018; pp. 1233–1236. [Google Scholar]
- Aslam, J.A.; Savell, R. On the Effectiveness of Evaluating Retrieval Systems in the Absence of Relevance Judgments. In Proceedings of the 26th ACM SIGIR, Toronto, ON, Canada, 28 July–1 August 2003; pp. 361–362. [Google Scholar]
- Baccini, A.; Déjean, S.; Lafage, L.; Mothe, J. How many performance measures to evaluate information retrieval systems? Knowl. Inf. Syst. 2012, 30, 693–713. [Google Scholar] [CrossRef]
- Amati, G.; Carpineto, C.; Romano, G. Query difficulty, robustness, and selective application of query expansion. In European Conference on Information Retrieval; Springer: Berlin/Heidelberg, Germany, 2004; pp. 127–137. [Google Scholar]
- Cronen-Townsend, S.; Zhou, Y.; Croft, W.B. A framework for selective query expansion. In Proceedings of the Thirteenth ACM International Conference on Information and Knowledge Management, Washington, DC, USA, 8–13 November 2004; pp. 236–237. [Google Scholar]
- Zhao, L.; Callan, J. Automatic term mismatch diagnosis for selective query expansion. In Proceedings of the 35th International ACM SIGIR Conference on Research and Development in Information Retrieval, Portland, OR, USA, 12–16 August 2012; pp. 515–524. [Google Scholar]
- Deveaud, R.; Mothe, J.; Ullah, M.Z.; Nie, J.Y. Learning to Adaptively Rank Document Retrieval System Configurations. ACM Trans. Inf. Syst. (TOIS) 2018, 37, 3. [Google Scholar] [CrossRef]
- Bigot, A.; Déjean, S.; Mothe, J. Learning to Choose the Best System Configuration in Information Retrieval: The Case of Repeated Queries. J. Univers. Comput. Sci. 2015, 21, 1726–1745. [Google Scholar]
- Deveaud, R.; Mothe, J.; Nia, J.Y. Learning to Rank System Configurations. In Proceedings of the 25th ACM International on Conference on Information and Knowledge Management, CIKM ’16, Indianapolis, IN, USA, 24–28 October 2016; ACM: New York, NY, USA, 2016; pp. 2001–2004. [Google Scholar]
- Mothe, J.; Ullah, M.Z. Defining an Optimal Configuration Set for Selective Search Strategy-A Risk-Sensitive Approach. In Proceedings of the 30th ACM International Conference on Information & Knowledge Management, Online. 1–5 November 2021; pp. 1335–1345. [Google Scholar]


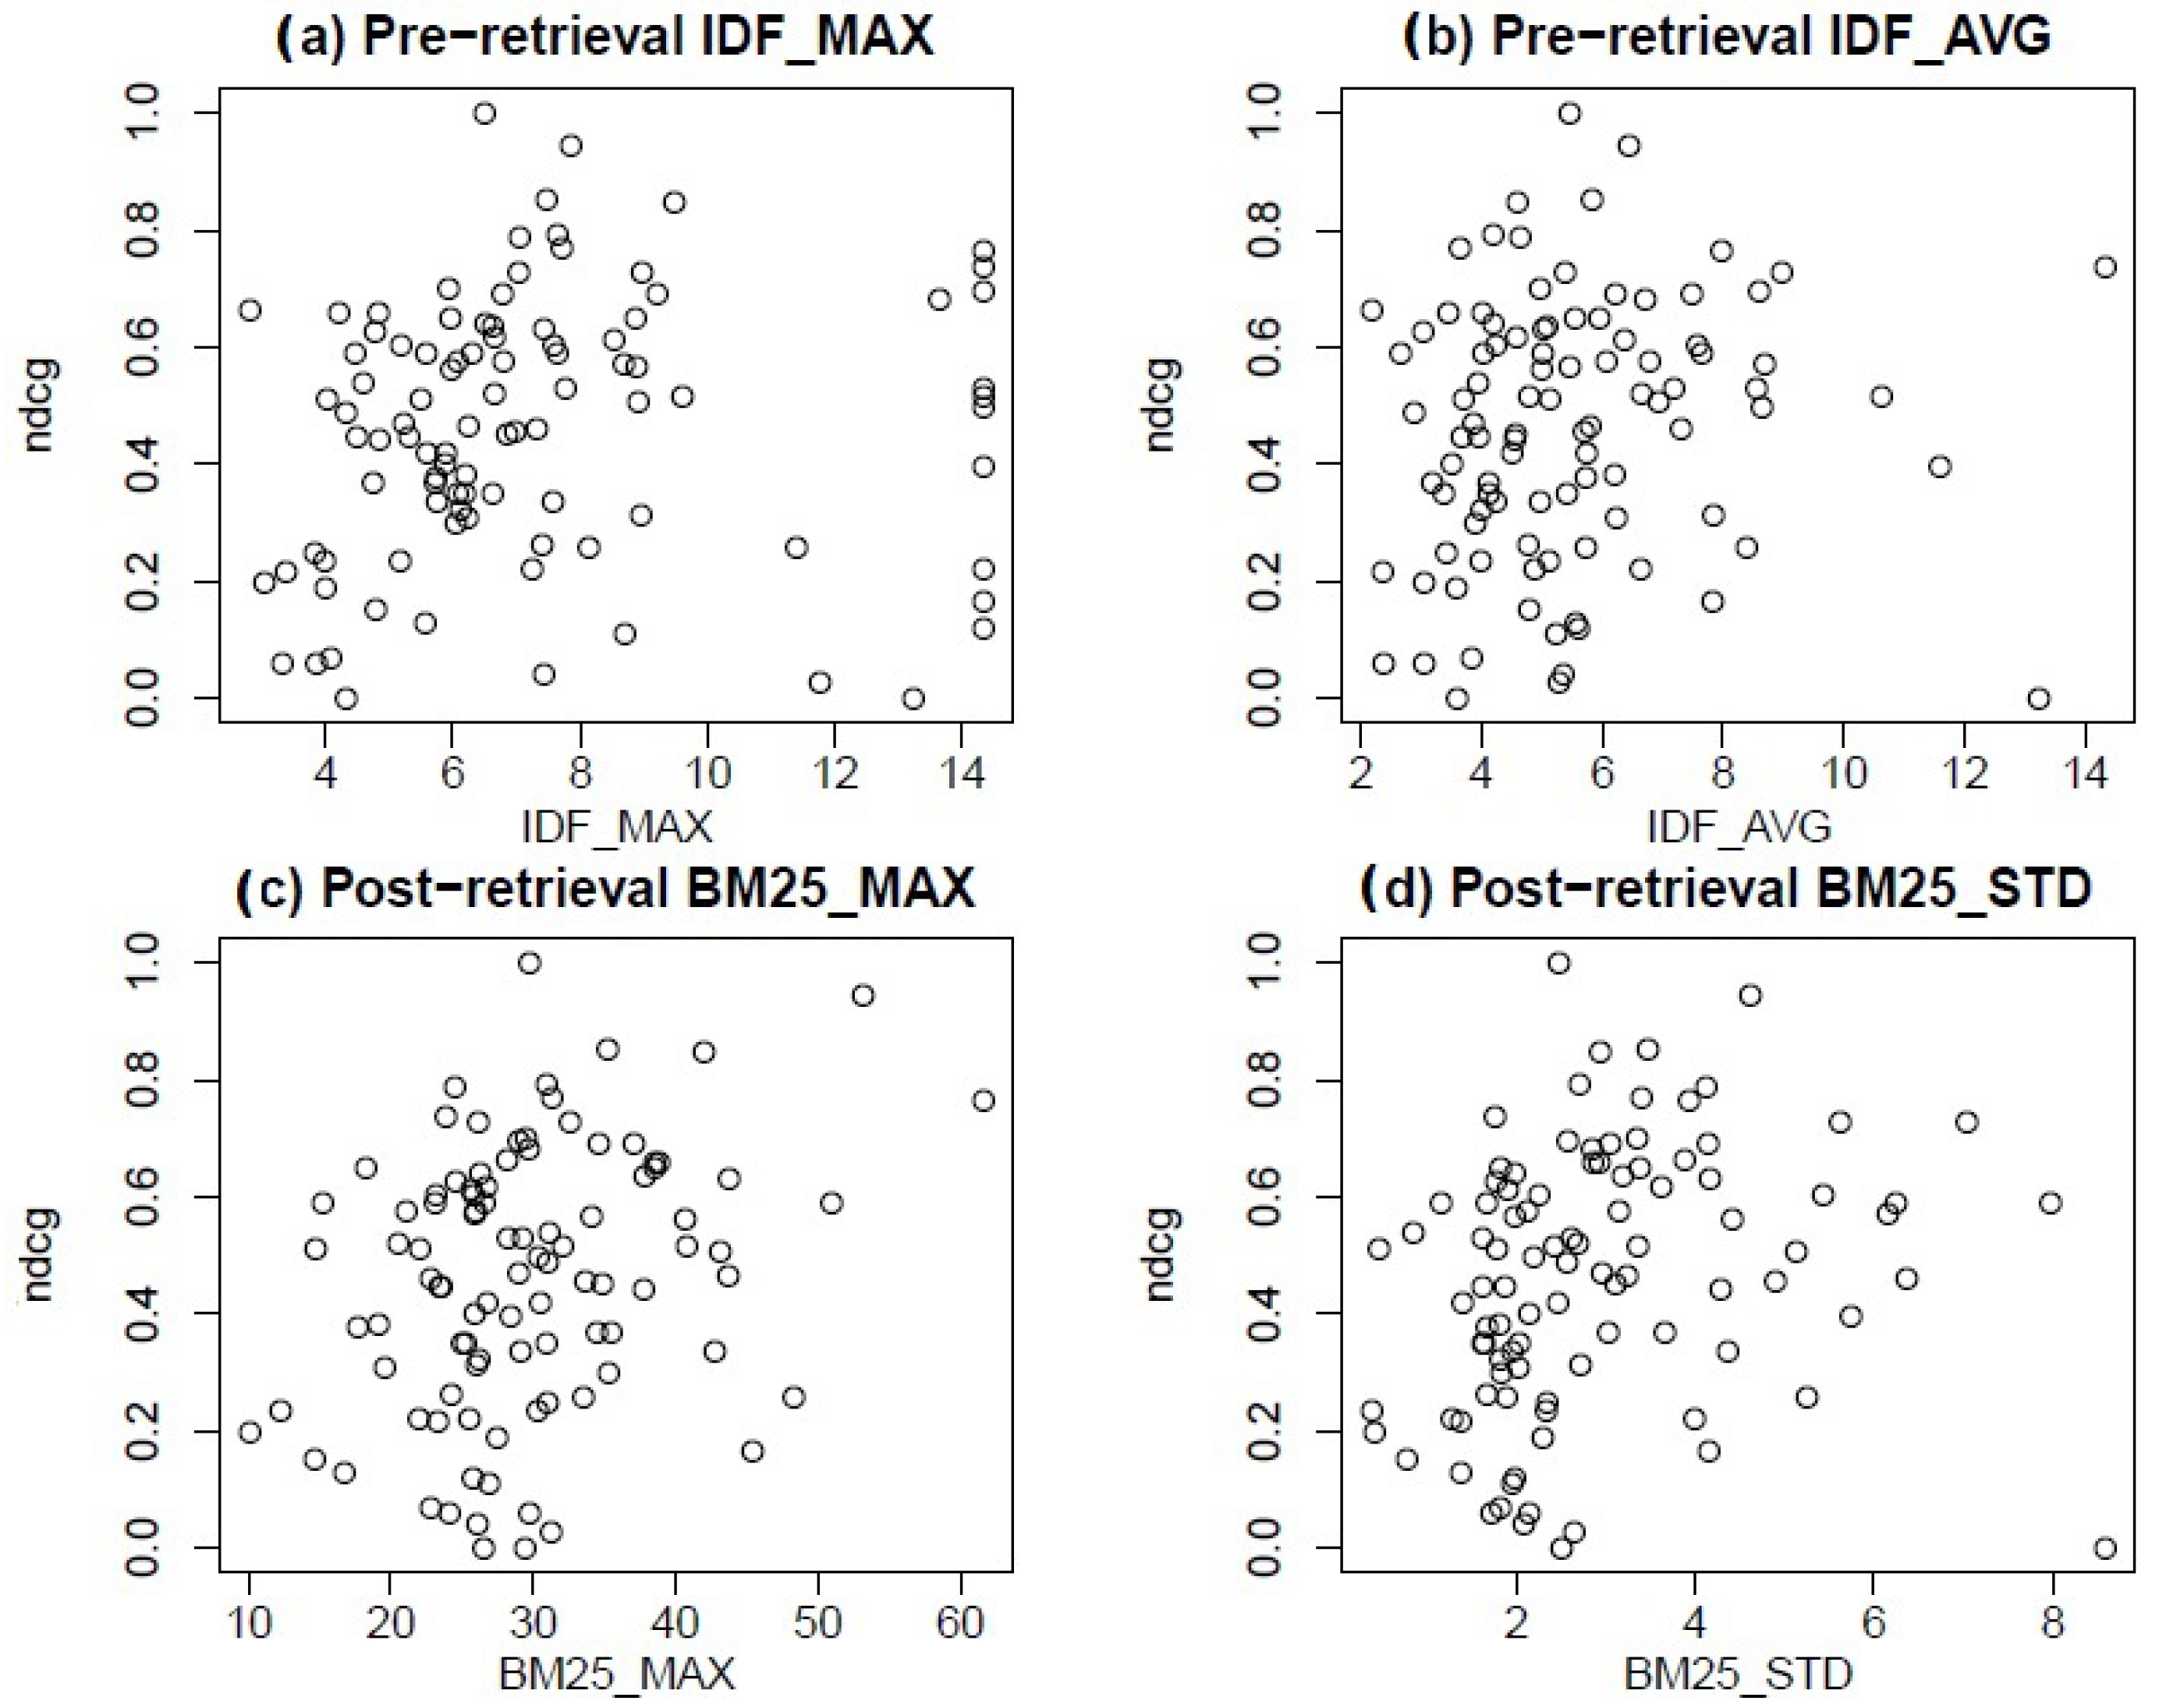
| Feature | ||||
|---|---|---|---|---|
| Measure | BM25_MAX | BM25_STD | IDF_MAX | IDF_AVG |
| Pearson | 0.294 * | 0.232 * | 0.095 | 0.127 |
| p-Value | 0.0034 | 0.0224 | 0.3531 | 0.2125 |
| Spearman r | 0.260 * | 0.348 * | 0.236 * | 0.196 |
| p-Value | 0.0100 | <0.001 | 0.0202 | 0.0544 |
| Kendall | 0.172 * | 0.230 * | 0.159 * | 0.136 * |
| p-Value | 0.0128 | <0.001 | 0.0215 | 0.0485 |
Publisher’s Note: MDPI stays neutral with regard to jurisdictional claims in published maps and institutional affiliations. |
© 2022 by the author. Licensee MDPI, Basel, Switzerland. This article is an open access article distributed under the terms and conditions of the Creative Commons Attribution (CC BY) license (https://creativecommons.org/licenses/by/4.0/).
Share and Cite
Mothe, J. Analytics Methods to Understand Information Retrieval Effectiveness—A Survey. Mathematics 2022, 10, 2135. https://doi.org/10.3390/math10122135
Mothe J. Analytics Methods to Understand Information Retrieval Effectiveness—A Survey. Mathematics. 2022; 10(12):2135. https://doi.org/10.3390/math10122135
Chicago/Turabian StyleMothe, Josiane. 2022. "Analytics Methods to Understand Information Retrieval Effectiveness—A Survey" Mathematics 10, no. 12: 2135. https://doi.org/10.3390/math10122135
APA StyleMothe, J. (2022). Analytics Methods to Understand Information Retrieval Effectiveness—A Survey. Mathematics, 10(12), 2135. https://doi.org/10.3390/math10122135