1. Introduction
The world’s urban population grew from 2.7 to 4.2 billion people in the past 20 years, surpassing the rural population for the first time in 2007 according to data from [
1]. The population is not only growing but also it is living longer. The world’s average life expectancy was 66.8 years in 1997 and 72.2 years in 2017, an increase of nearly six years [
2].
This fast demographic shift directly affects the capacities of cities to provide public services to their population. On top of the demographic changes, the pressure to cope with extraordinary situations, like the COVID-19 pandemic [
3], reinforces the need for more flexibility in health-care systems. Thus, the question posed by this study is as follows: how can the health-care systems worldwide provide quality health-care services to all in an efficient and effective way?
Such challenges faced by health-care systems are summarized by the Sustainable Development Goal 3 (SDG 3): Ensure healthy lives and promote well-being for all at all ages [
4]. Regarding services provided by the hospitals and other large urban health-care infrastructures, the SDG’s targets 3.8 and 3.C indicate the challenges that tend to get more complex with a new demographic scenario.
The two targets 3.8 and 3.C show the need to achieve universal health-care coverage and to increase health-care financing, respectively [
4]. The social-economical aspects of the health-care system are then the main drivers to change it. Since proper funding is required to reach universal coverage of quality health-care, leading to a reduction in mortality rate, the adequate use of these financial resources is essential.
Health spending has increased in recent years, an average of 6% per year in low and middle income countries and 4% in high income countries. Most of this growth was due to public spending constantly increasing since the year 2000, with the exception of the low income countries [
5].
The largest cost categories of a hospital are the operating rooms and the patients wards groups, averaging 33% and 31% of its total costs, respectively. Therefore, efforts to accomplish more efficient and effective health-care services should start decreasing the costs of the aforementioned hospital categories [
6]. Once the public health funds directed to the hospitals are applied more efficiently, more resources can be freed to other health-care services, including preventive care.
Considering the social-economical structure of health-care systems, solutions aiming to increase the efficiency of surgery related areas are of great value to the health-care organizations. The main objective of this paper is to develop an optimization model to better manage the scarce resources regarding hospital operating rooms and patient wards.
This work has been implemented as a case study at a hospital located in Turin, Italy. It is considered to be a medium-sized hospital, having about 440 ward beds and 12 operating rooms, 8 of which are the target of this study.
The paper is organized as follows.
Section 2 presents the literature review related to the main concepts of the studied problem and some previous solutions.
Section 3 introduces the proposed Integer Linear Programming (ILP) model. The case study data from the studied Italian hospital and the results obtained with the Static ILP model are presented in
Section 4. The results of the ILP Dynamic implementation are presented in
Section 5. A discussion to the obtained results is given
Section 6. Finally,
Section 7 provides the conclusions of this research with some suggestions for future studies.
3. Elective Surgery Scheduling Proposed Model
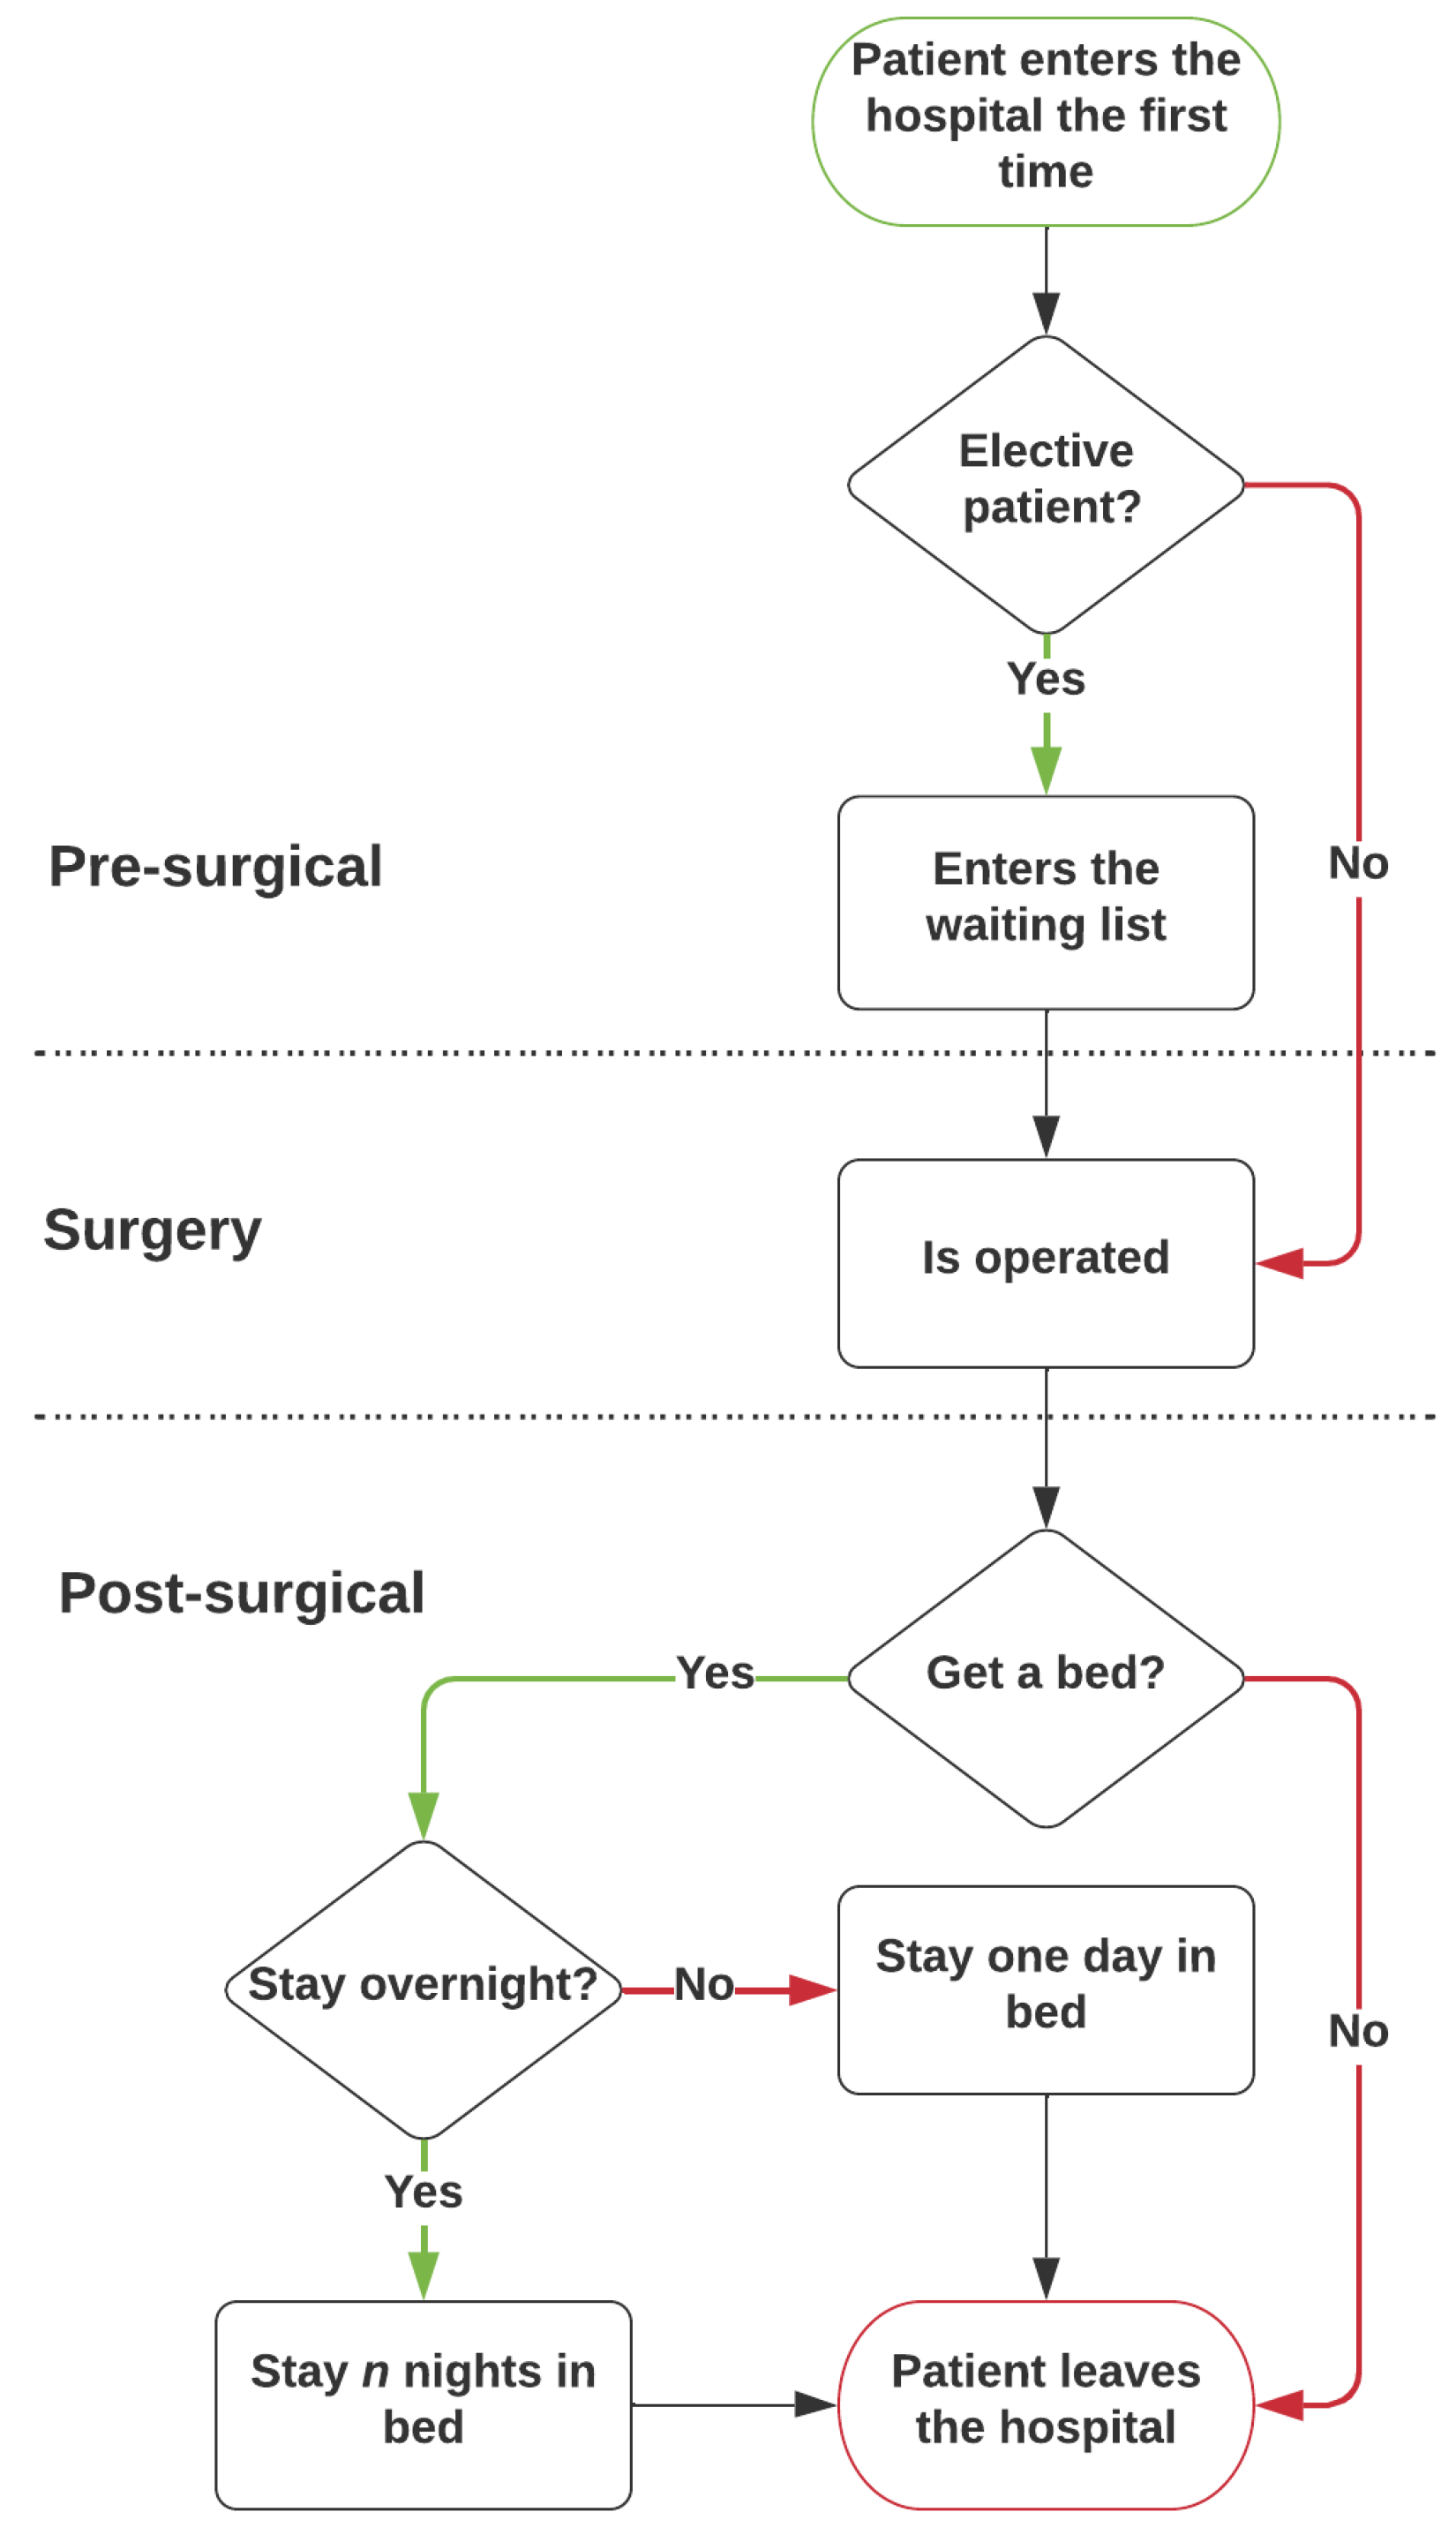
An evaluation of the patient treatment macro process is applied to identify the relevant variables and constraints in the proposed model. The flowchart for the elective patient treatment process is presented in
Figure 1, considering only the emergency cases at the post-surgical stage, since they occupy the same wards as the elective patients.
The process starts at the pre-surgical stage, with the patient going to the hospital to have a medical appointment. The doctor will then assign a pathology and a booking class to the patient, and add him/her to the surgical waiting list (WL). The cases where no surgery is required are not considered, since they do not use the surgical resources. After a waiting period, the surgery stage begins, with the patient returning to the hospital to be operated on. In order for the surgery to happen, a room needs to be assigned to a operation/surgical team on a specific day. Surgeries from the same specialty, even from the same type, will vary in their duration. Nevertheless, the mean time was used to obtain the average number of people operated by any surgical team in a specific day.
In the post-surgical stage, the patient operated on can require a bed in a ward, or not. It mainly depends on the type of the surgery and the patient’s health conditions. It was also observed that some patients needing a bed do not stay overnight, staying only a few hours to recover and going home afterwards. These types of patients are classified as outpatients.
The patients needing to stay many consecutive days in the hospitals are called inpatients. This inpatient mean length of stay (LOS) is used to estimate the bed occupancy at the wards. When the recovery period described is concluded, the patients leave the hospital, finishing the patient’s treatment process for the purposes of this work.
The hospital process and activities represent the intersection between major hospitals fields like the medical clinics, the operating rooms, and the wards. Since the medical clinical is the first stage of the process, the waiting list is defined at this stage impacting the work of the operating rooms and the wards. The WL for each specialty is considered an input for this work.
The decisions taken by the operating room department clearly affect the ward’s occupation. Therefore, the main goal of this study is to help the decision makers for the operating rooms and the wards to efficiently use these hospital areas.
The developed model aims to define the CMP and find the MSS maximizing the global benefits associated with each surgical specialty. The implemented model also aims to minimize the cost of misplacing patients in the wrong ward. It does so considering the different sets of constraints, using the input data, which describes the actual hospital’s situation at any given moment, like the waiting list, the mean operation time, and the mean LOS.
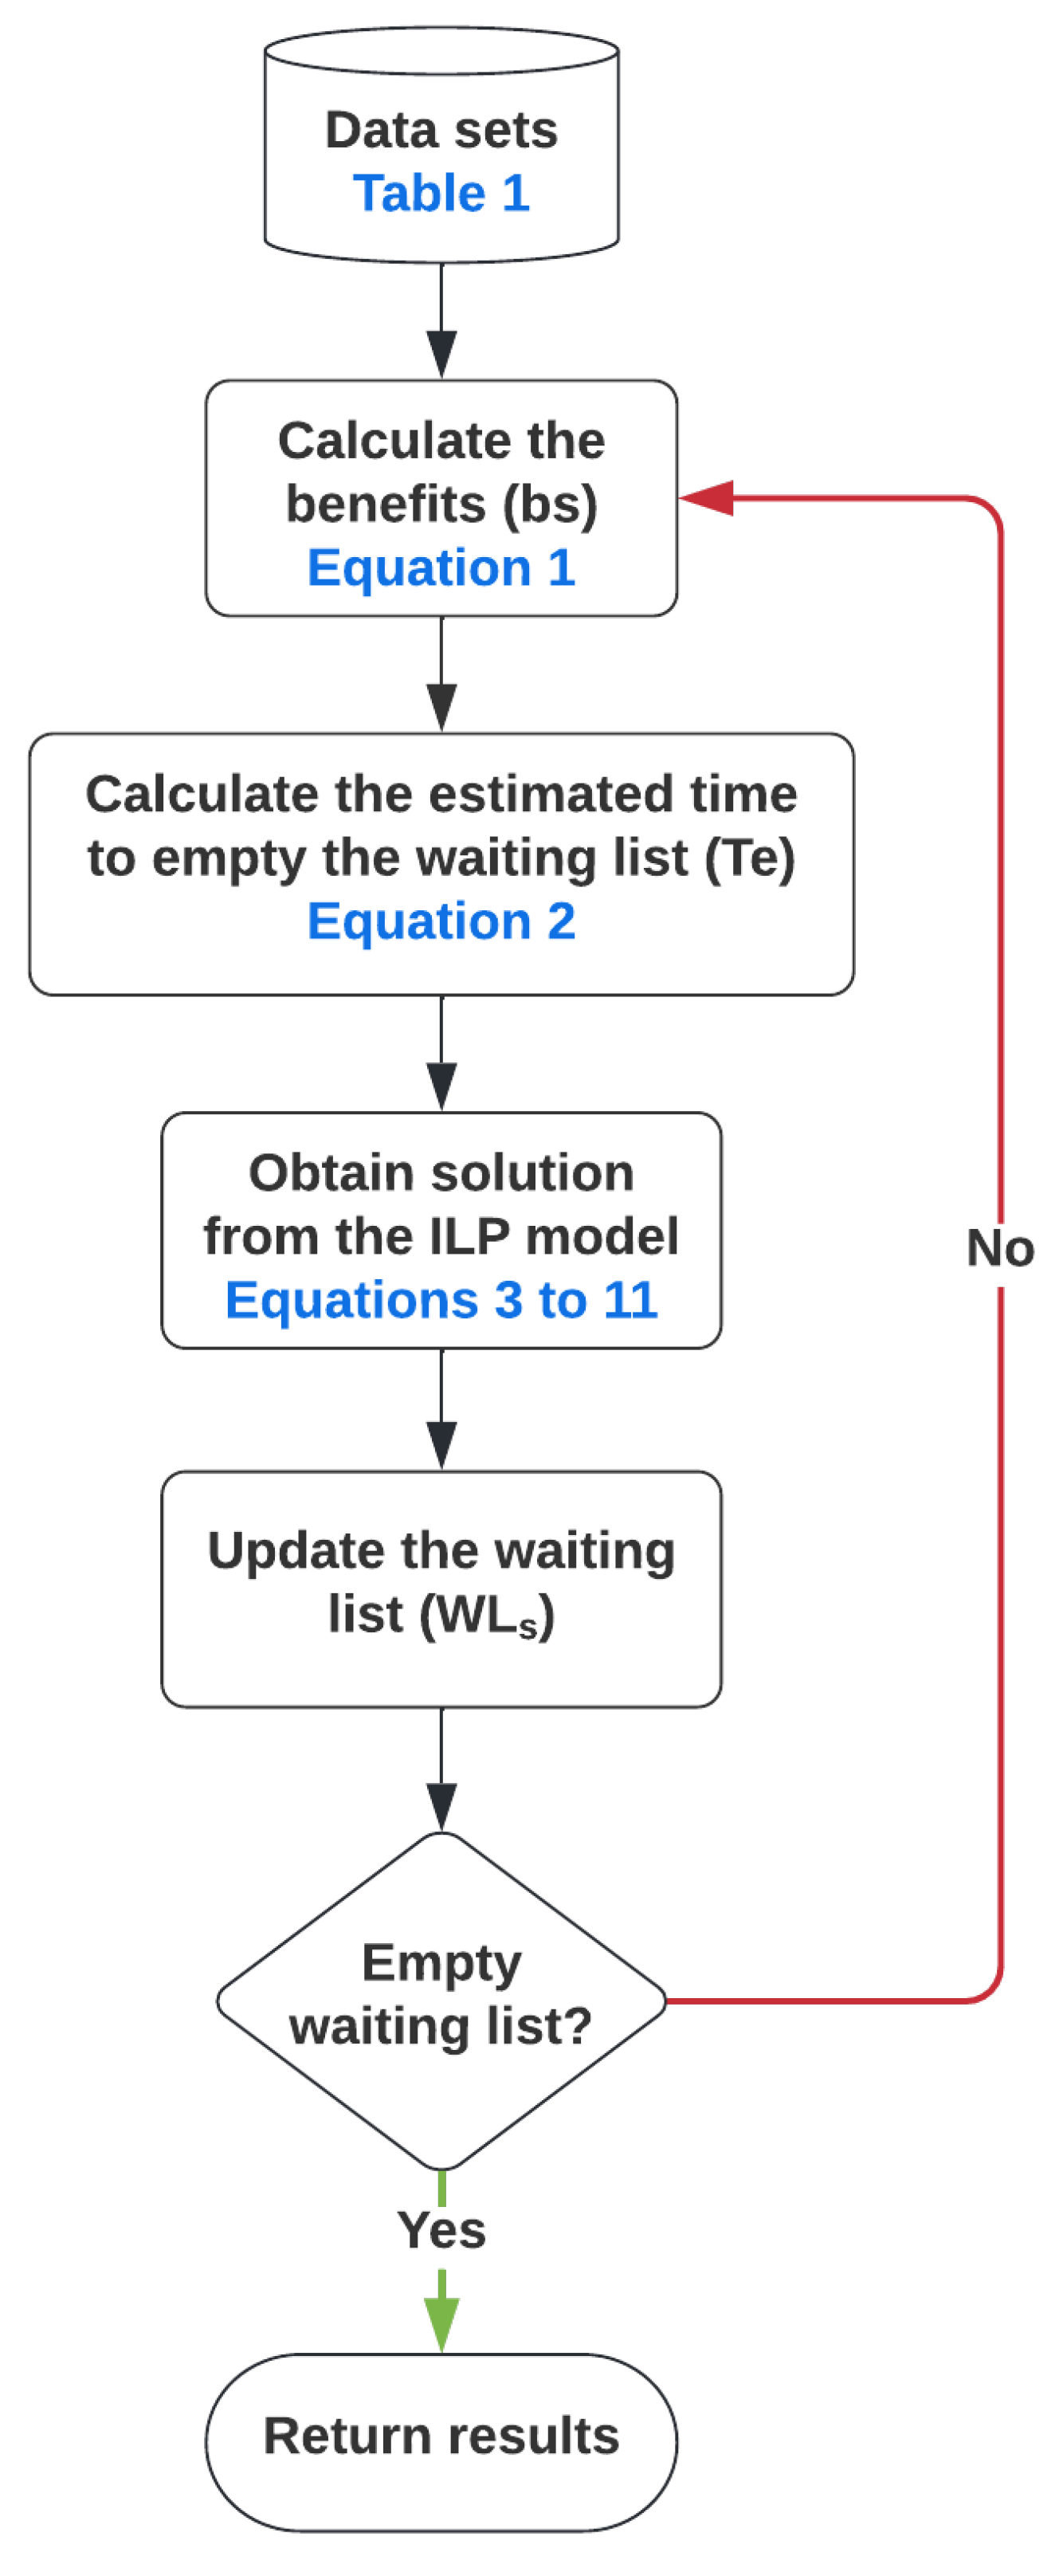
The optimal capacity allocation and scheduling are obtained as indicated in
Figure 2. Starting with the required data sets (example in
Table 1), the values of two variables must be calculated, as shown in Equations (
1) and (
2), respectively. These data are used as input to the ILP model resulting in optimal scheduling and its associated capacity allocation. The achieved result is used to update the elective surgery waiting list. In the static case this would be the end of the optimization process, whereas in the dynamic case, such an iteration is repeated until the waiting list is empty.
3.1. Elective Surgery Scheduling Model Variables
Let S be the set of medical/surgical specialties and let R be the set of operating rooms, normally part of an operating block. Let A be the set of active days, the ones when surgeries are made, and let W be the set of wards which contains the post-operative beds. For this model, the planning horizon of the master surgical scheduling is equal to the dimension of A.
Sets of indexes:
S: set of surgical specialties;
R: set of Operating Rooms;
A: set of active days;
W: set of wards (divisions of post-operative beds).
The sets of variables and data include monetary and non-monetary ones like each specialty average profit () or the surgical team numbers for each specialty ().
Sets of parameters:
= Binary relation matrix where 1 represents a misplacement of a patient from specialty s in the ward w, 0 otherwise;
q = Maximum number of operation sessions in a specific day;
= Total number of beds for each ward w;
= Expected number of emergency patients occupying a bed in the ward w;
= Number of patients from specialty s in the waiting list for surgery;
= Average profit made by each specialty s;
= Cost (penalty) associated with the misplacement of a patient from specialty s;
= Expected number of patients from specialty s to be operated in each operation session;
= Expected number of days for a patient from specialty s to occupy any ward bed;
= Number of patients already occupying beds in the ward w in the day a;
= Benefit of assigning an operation session to specialty s;
= Number of surgical teams of specialty s.
Sets of variables:
= Time, in weeks, to empty the waiting list;
= Number of patients from specialty s allocated to a bed in ward w in day a;
Most of the described variables represent data directly obtained from the observation of the hospital’s operation, like variables
q,
, and
. Other variables need some previous calculations, since they correspond to an aggregate value. The best example of an evaluated variable is
, the benefit of assigning an operation session to specialty
s, being obtained by the weighted sum of two other variables (Equation (
1)). Another example is the value of
, representing the number of patients occupying beds in the ward w on the day a. The values of
are then evaluated and given as input to the model, every day, since the patients can leave the wards (belonging to any specialty) and new patients can request a ward (if they were operated on). Therefore, the values of
and
are evaluated everyday, being given as input to the model.
The benefits
are calculated according to Equation (
1) where
and
are the weights given to the waiting list and the profit, respectively. If
, the hospital’s priority is to empty the waiting list but if
, the hospital gives more priority to increase its profit. The weights are defined so that
and
. Moreover,
and
. The time to empty the waiting list
is obtained by the ratio of the variables
and
(Equation (
2)). When evaluating
,
needs to be determined, representing the total number of operation sessions assigned to each specialty per week.
The variables represent the penalty to misplace a patient from each specialty s. Their values must be decided based on medical understanding regarding the consequences of misplacing a patient in the wrong ward, where he/she cannot receive the adequate care. Likewise , , so both have the same scale. In particular, a value of heavily penalizes any solution having a patient misplacement.
The decision variables describe how many operating rooms must be assigned for each specialty in a daily basis. Therefore, the binary decision variables represent the optimal decision set obtained from the implemented integer linear programming (ILP) model.
3.2. The ILP Model
The proposed integer linear programming (ILP) model consists of one objective function (
3) and eight sets of constraints, from (4) to (11). The implemented model has about 88 inequality constraints and five equality constraints, besides 180 integer and 360 binary constraints. The sets’ values of the previously described variables and data sets are
(surgical specialties),
, (active days),
(number of operating rooms), and
(number of wards). The implemented model is given next.
The main contribution of this work is the introduction of the second term in the objective function having a penalty due to the possible misplacement of a patient. Moreover, the way that the term is evaluated is another contribution of this work since depends not only on the waiting list but also on the surgery price for each specialty.
The objective function (Equation (
3)) maximizes the benefit
to assign an operating room
r to a specialty
s at any day
a, minus the cost
of misplacing patients
in the wrong ward
w. The benefit and the cost can be adjusted according to the hospital’s priorities resulting in the number of operating time blocks per specialty and their assigned day. The allocation of patients of each specialty
s to the appropriate ward
w is done by the relation in the misplacement matrix
.
The first constraint (Equation (4)) considers that the total number of room assignments must be less or equal to the total number of available operation sessions q for all days a. If , the number of time blocks assigned is the same as the total number of operating rooms, hence one time block per day. For any , there may be more than one time block assignment per room per day. The next constraint (Equation (5)) considers the total number of operating room assignments for all specialties s to be less or equal to the number of surgical teams of the specialty, for all days a.
The constraints given by Equations (6) and (7) are related to the the minimum and maximum number of patients to be operated during the planing horizon, respectively. The constraint (6) sets then the number of operated patients for each specialty to be at least . Therefore, this constraint allows the waiting list to be emptied in no more than weeks, besides assuring the assignment of at least one operating room to any specialty. The addition of constraint (6) is also a contribution of this work. The constraint (7) limits the number of patients to be operated by the number of the patients in the waiting list.
The constraint given by Equation (8) represents the identity of the patients being operated and allocated to recovery beds for all specialties s, in all days a. The product of and gives the total number of patients operated in all operating rooms r. Patients who will be allocated to recovery beds at different wards are represented by the variable . The constraint given by Equation (9) restricts the number of allocated beds by adding the number of already occupied beds, , and the expected number of emergency patients. These three variables are limited by the total number of beds, for all wards w on all days a. Finally, Equations (10) and (11) set, respectively, all as positive integers and all as binary in the interval .
3.3. Dynamic Model
The majority of the published work related to the master surgical scheduling (MSS) problem have planning horizons of two weeks to one month, and the case-mix planning (CMP) problem can go up to six months. The previously described ILP model is implemented to calculate the new solution weekly, obtaining multiple solutions, since there are different weeks. Therefore, each new solution is based on updated information from the previous solution due to the decreasing of the waiting list for each specialty. The described model is then applied in a dynamic approach.
The set of weeks in the planning horizon is considered to be D, and for each a new MSS is generated. The number of operated patients is then subtracted from the waiting list for each new iteration. These new values for are used to recalculate the benefits being applied in the constraints (6) and (7). The calculation continues D times or until . Moreover, the values for the bed occupancy, , are used to update the constrain (10). Therefore, the static model solves the problem just once, and it assumes that the obtained schedule for the operations for each specialty is replicated for all the following weeks. The dynamic model solves the problem in a way that for each iteration (week) there is an update in the WL for each specialty, resulting, in general, in different schedules for the operations for each specialty from one week to the next one. It can be concluded that the dynamic implementation is then a more realistic one for the studied problem. Nevertheless, the static approach is considered due not only to its simplicity but also to the comparisons to be made with the dynamic one.
The static and the dynamic implementations of the ILP developed model were implemented in the Julia programming language. The JuMP package [
25] was used as the modeling interface to COIN-OR Branch-and-Cut (CBC) ILP solver [
26].
4. Hospital Data and Static Results
In order to obtain real world results, data from an Italian hospital in the city of Turin, Italy was used. All data presented in this study refers to the year of 2018, with the exception of the waiting list
, which was collected in January 2019. It must be added that even though the
data set was collected in January 2019, and not in 2018, all the other values presented in
Table 1 are still valid. Therefore, the average profit per specialty, the number of surgical teams, the operating efficiency, and the length of stay were obtained in 2018 but they were still the same by January 2019. It is possible to separate the data on specialty related and non-specialty related.
4.1. Specialty Related Data
The surgical specialties are the core of the surgical process of a hospital. They are the ones assigned to use the operating rooms block times, and they are the main organizational structure of the studied Italian hospital. In
Table 1, five data sets are presented, related to each one of the nine specialties being part of the general surgical block at the studied hospital, namely: Plastic, General, Thyroid, Gynecological, Ophthalmology, Odontology, Otolaryngology, Orthopedics, and Urology.
The data source given in
Table 1 was obtained from the analyzed hospital by the time of this study. It is important to say that data sources related to revenues and efficiency ratios not only in the health sectors but also in other fields are very sensitive issues. Therefore, without loss of generality, the applied data source in this study must be taken to evaluate the robustness of the developed model. Future studies should then take into account variations in the used data set of this study.
The waiting list
and the profit
data are used to obtain the benefit variables
of the objective function (Equation (
3)). These data present a great variety of values. The smallest values of
and
belong to Odontology and Ophthalmology, respectively. Similarly, the largest values of
and
are the ones in the Ophthalmology and Urology specialties, respectively. These variations in
and
will definitely impact how the operating rooms will be assigned to each specialty.
The operating efficiency and the Length of Stay express characteristics of both surgeon’s work and patient’s overall health conditions. Therefore, these data characterize the work flow of each specialty, being related to the most critical constraints of the model representing the bottlenecks of the treatment process.
It is important to analyze the number of surgical teams , being one of the most critical constraints. A small surgical teams, like the case of Thyroid, can severally limit the number of operated patients reducing the capacity to effectively perform the operation block.
4.2. Non-Specialty Related Data
The data sets for each specialty are independent but they influence the general operating block. The number of postoperative beds () gives the total number of recovery beds per ward. Since there are four wards (), the number of beds for each ward is .
The misplacement matrix, shown in
Table 2, represents the specialty assignments to the wards. The matrix
shows then when a misplacement happens in the assignment process. According to
Table 2, a plastic surgery patient must be allocated to ward 1, and if a different allocation occurs to this patient, it results in a penalty in the objective function.
The number of operating room block times q is related to the number of operating rooms R, meaning the number of operation sessions to be assigned to any specific day. Since the total number of operating rooms in the studied hospital is , and the hospitals practices a one-time-block-per-day policy, than q is also equal to 8 ().
The data variable approximates the number of emergency patients occupying a recovery bed in ward w at any given day. This data is used to better assess the number of available beds in the wards. The values were set based on historical data.
4.3. Static Results
Implementing the developed model, one can obtain different operating room schedules. These different schedules can be achieved if different weights for
and
are used in Equation (
1), for instance. This schedule flexibility also allows the hospital’s administration to adapt to changes not only in the surgery demand but also in the shortage of any essential supply or even to extraordinary situations, like the COVID-19 pandemic.
4.3.1. First Results for the Static Approach
The results given by the ILP implemented model are then compared with the actual schedule at the
studied Hospital. This comparison used the average weekly schedule from the hospital, since they operated in a monthly schedule, and the proposed weekly schedule. The schedule already applied in the
studied Hospital is called the
Current schedule, and the obtained schedule when applied the developed model is called the
New schedule as shown in
Table 3 and
Table 4, respectively. It can be observed that the
Current schedule and the
New schedule fully used the 40 weekly available operating room blocks. Moreover, it must be then stated that the results shown in
Table 3 and
Table 4 give the schedules for each specialty on a specific day of the week.
The time to empty the waiting list
was calculated for both schedules. The total values in
Table 3 led to a
weeks, since the specialties taking the most of the time, General and Thyroid, were not assigned with enough operating room blocks. Moreover, the schedule presented in
Table 4, the
New schedule, used all the Thyroid resources and increased the operating room blocks assigned to General surgery in almost 73%, from 11 blocks to 19 blocks. The new time to empty the waiting list resulted in
weeks, a reduction of 96 weeks, showing an increase in the efficiency of the use of the available hospital considered resources.
This result demonstrates that the model is able to obtain new schedules reducing the time to empty the waiting list being one of its main goals. When maximizing the overall benefit, the ILP implemented model is capable to achieve the reductions. The next step is to compare the number of misplaced patients when the Current schedule and the New schedule are applied.
4.3.2. Impacts of Different Costs
The number of weekly misplaced patients when applying any model must be also taken into account once it shows a disequilibrium when comparing the operating room schedule and the wards resources. Even though the results presented in
Table 4 reduced the number of weeks to empty the waiting list, it also generated a total misplacement of 52 patients. Reducing this mismatch among surgeries and available beds is also one of the goals of the proposed model. It must also be said that the actual mismatch with the
Current schedule is about 17 patients.
The decrease in the number of misplacement patients can be achieved making the cost term
equal to one (
= 1) in the objective function. The first results in
Table 4 were obtained making the cost
equal to zero (
= 0) meaning that if there was a misplacement, it did not affect the value of the objective function. A new schedule is then obtained in
Table 5 when making
equal to one.
When the cost associated with the misplacement of a patient is equal to one ( = 1), the General surgery operating room blocks were more evenly spread during the week reducing to 12 the number of misplaced patients.This result is not only lower than the one where is equal to zero (no misplacement cost) but is better than the actual number of 17 weekly misplaced patients in the studied hospital.
When analyzing
Table 4 and
Table 5, making
equal to one results in better scheduling with regard to the use of the ward’s beds, without increasing the time to empty the waiting list. The number of weekly assignments for each specialty also shows a more balanced schedule than the one previously applied in the Italian hospital. It must be added that the weekly schedules for the static results shown in
Table 3,
Table 4 and
Table 5 will not change over the time period to empty the waiting list.
5. Dynamic Results of the ILP Model and Discussion
The previous results show the model’s capacity to generate better schedules regarding the time to empty the waiting list () and the balancing of the ward’s bed usage. Although these results already represent an increase in the hospital performance, the value of the time to empty the waiting list equal to 144 weeks () is not a desired one. A dynamic model is then implemented once there will be surgeries every week. The waiting list will then change on a weekly basis, varying the objective function penalty term, resulting in different surgery schedule each week. It must be said that changes in the waiting list due to new entries every week were not considered in the model, since such data was not available in the hospital by the time of this study.
In order to better explore the model performance in this dynamic scenario, three sets of analyses are implemented. Each one focused on the effects of different parameter changes in the final
value and the overall performance of the system. The obtained results when varying the benefit weights
and
are given in
Section 5.1. Afterwards, the results when increasing the surgical teams of the most needed surgical specialty, Thyroid, are shown in
Section 5.2. The outcome achieved when allowing double-shifts during some days of the week jointly with the parameter changes previously applied is shown in
Section 5.3. Finally, it must be remembered that for each dynamic case next evaluated, the model can provide different weekly schedules, such as the one shown in
Table 4, for instance, because the waiting list changes on a weekly basis, and the model takes into account this dynamic change in the waiting list.
5.1. Benefit Weights Influence in the ILP Model
The benefits
are one of the main parameters related to the objective function. When the value of
changes due to varying the weights
and
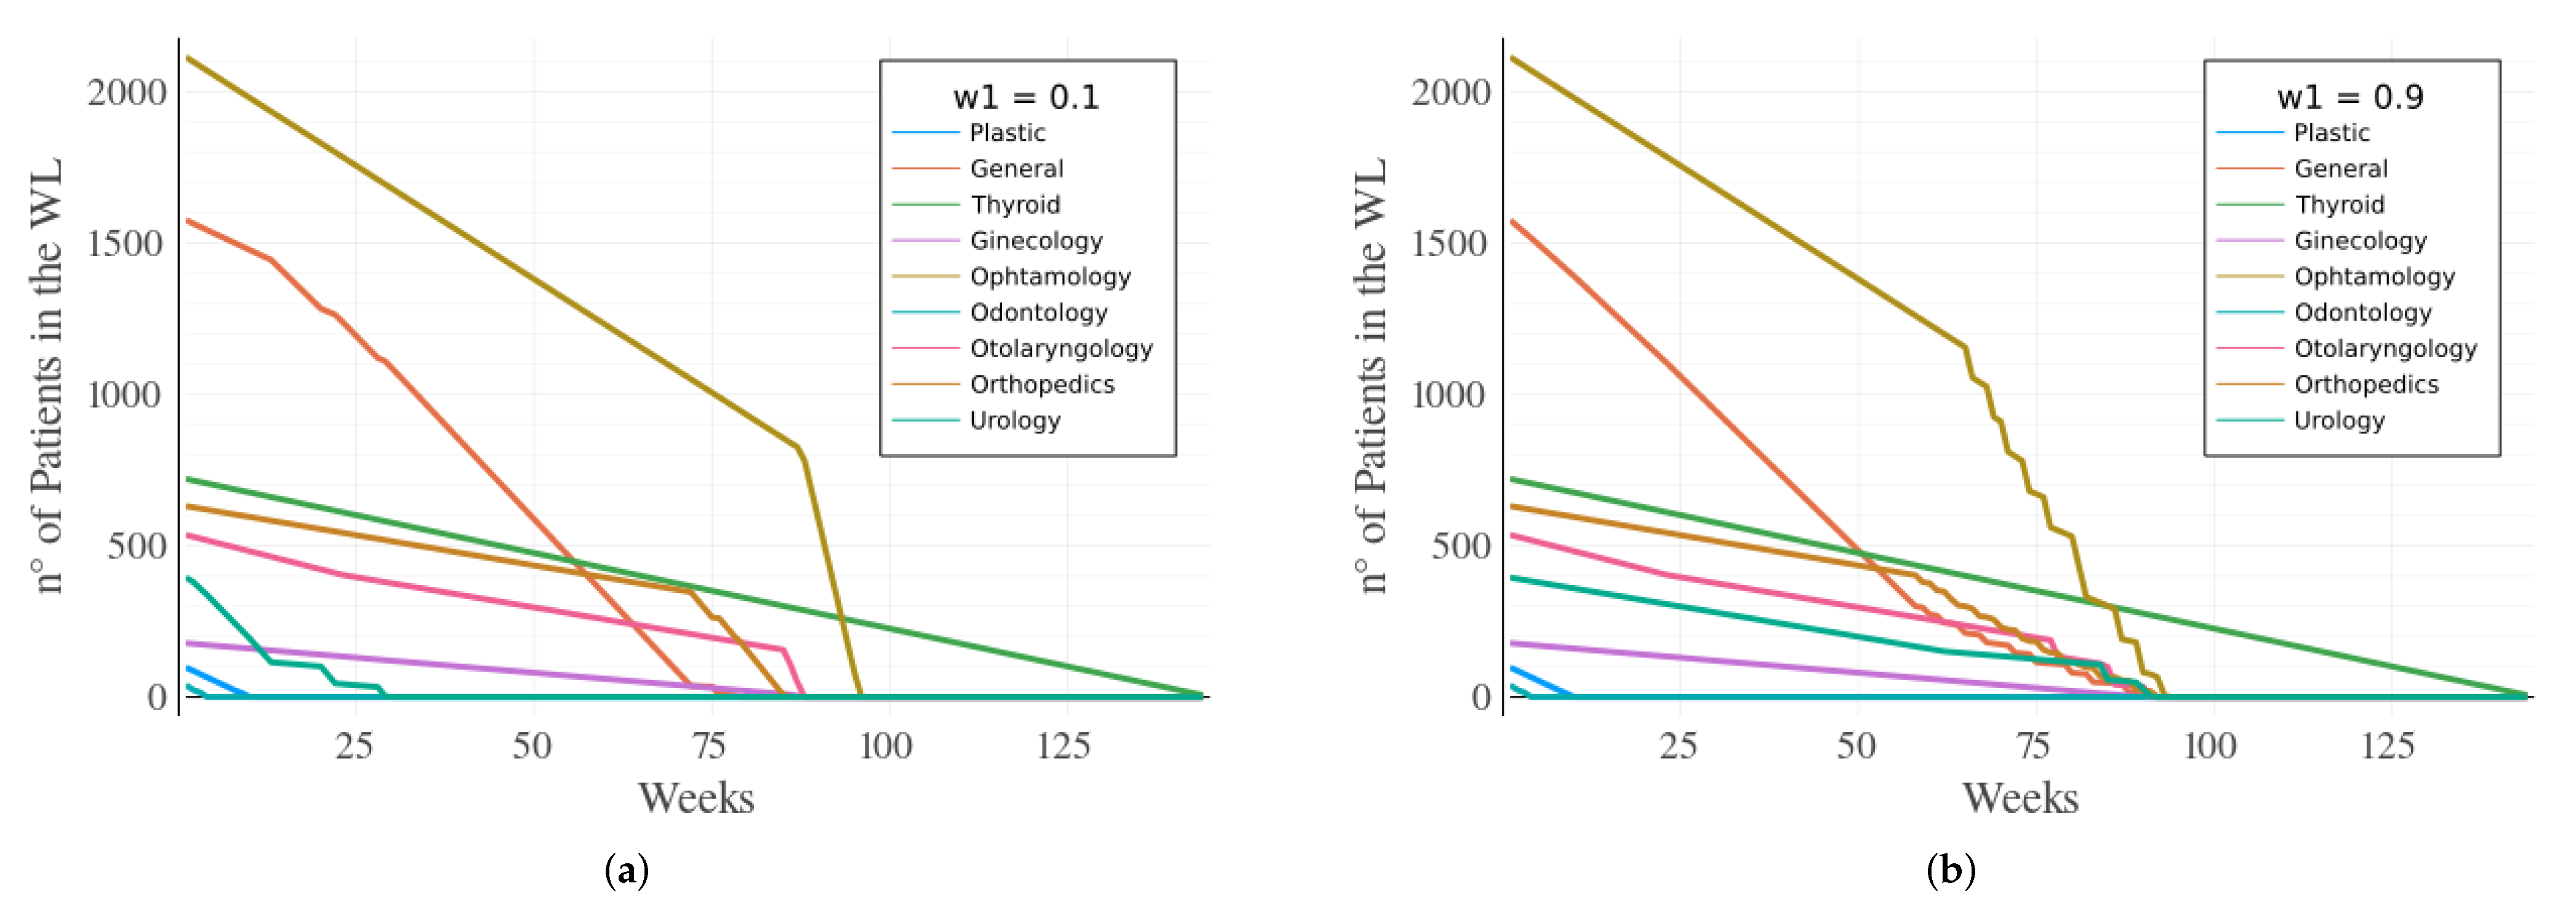
, one can prioritize the specialties being either able to rapidly empty their waiting list, or to generate more profit, respectively. Different values for each weight were tested and the limit cases are presented in
Figure 3a, with
and
, and in
Figure 3b, with
, and
.
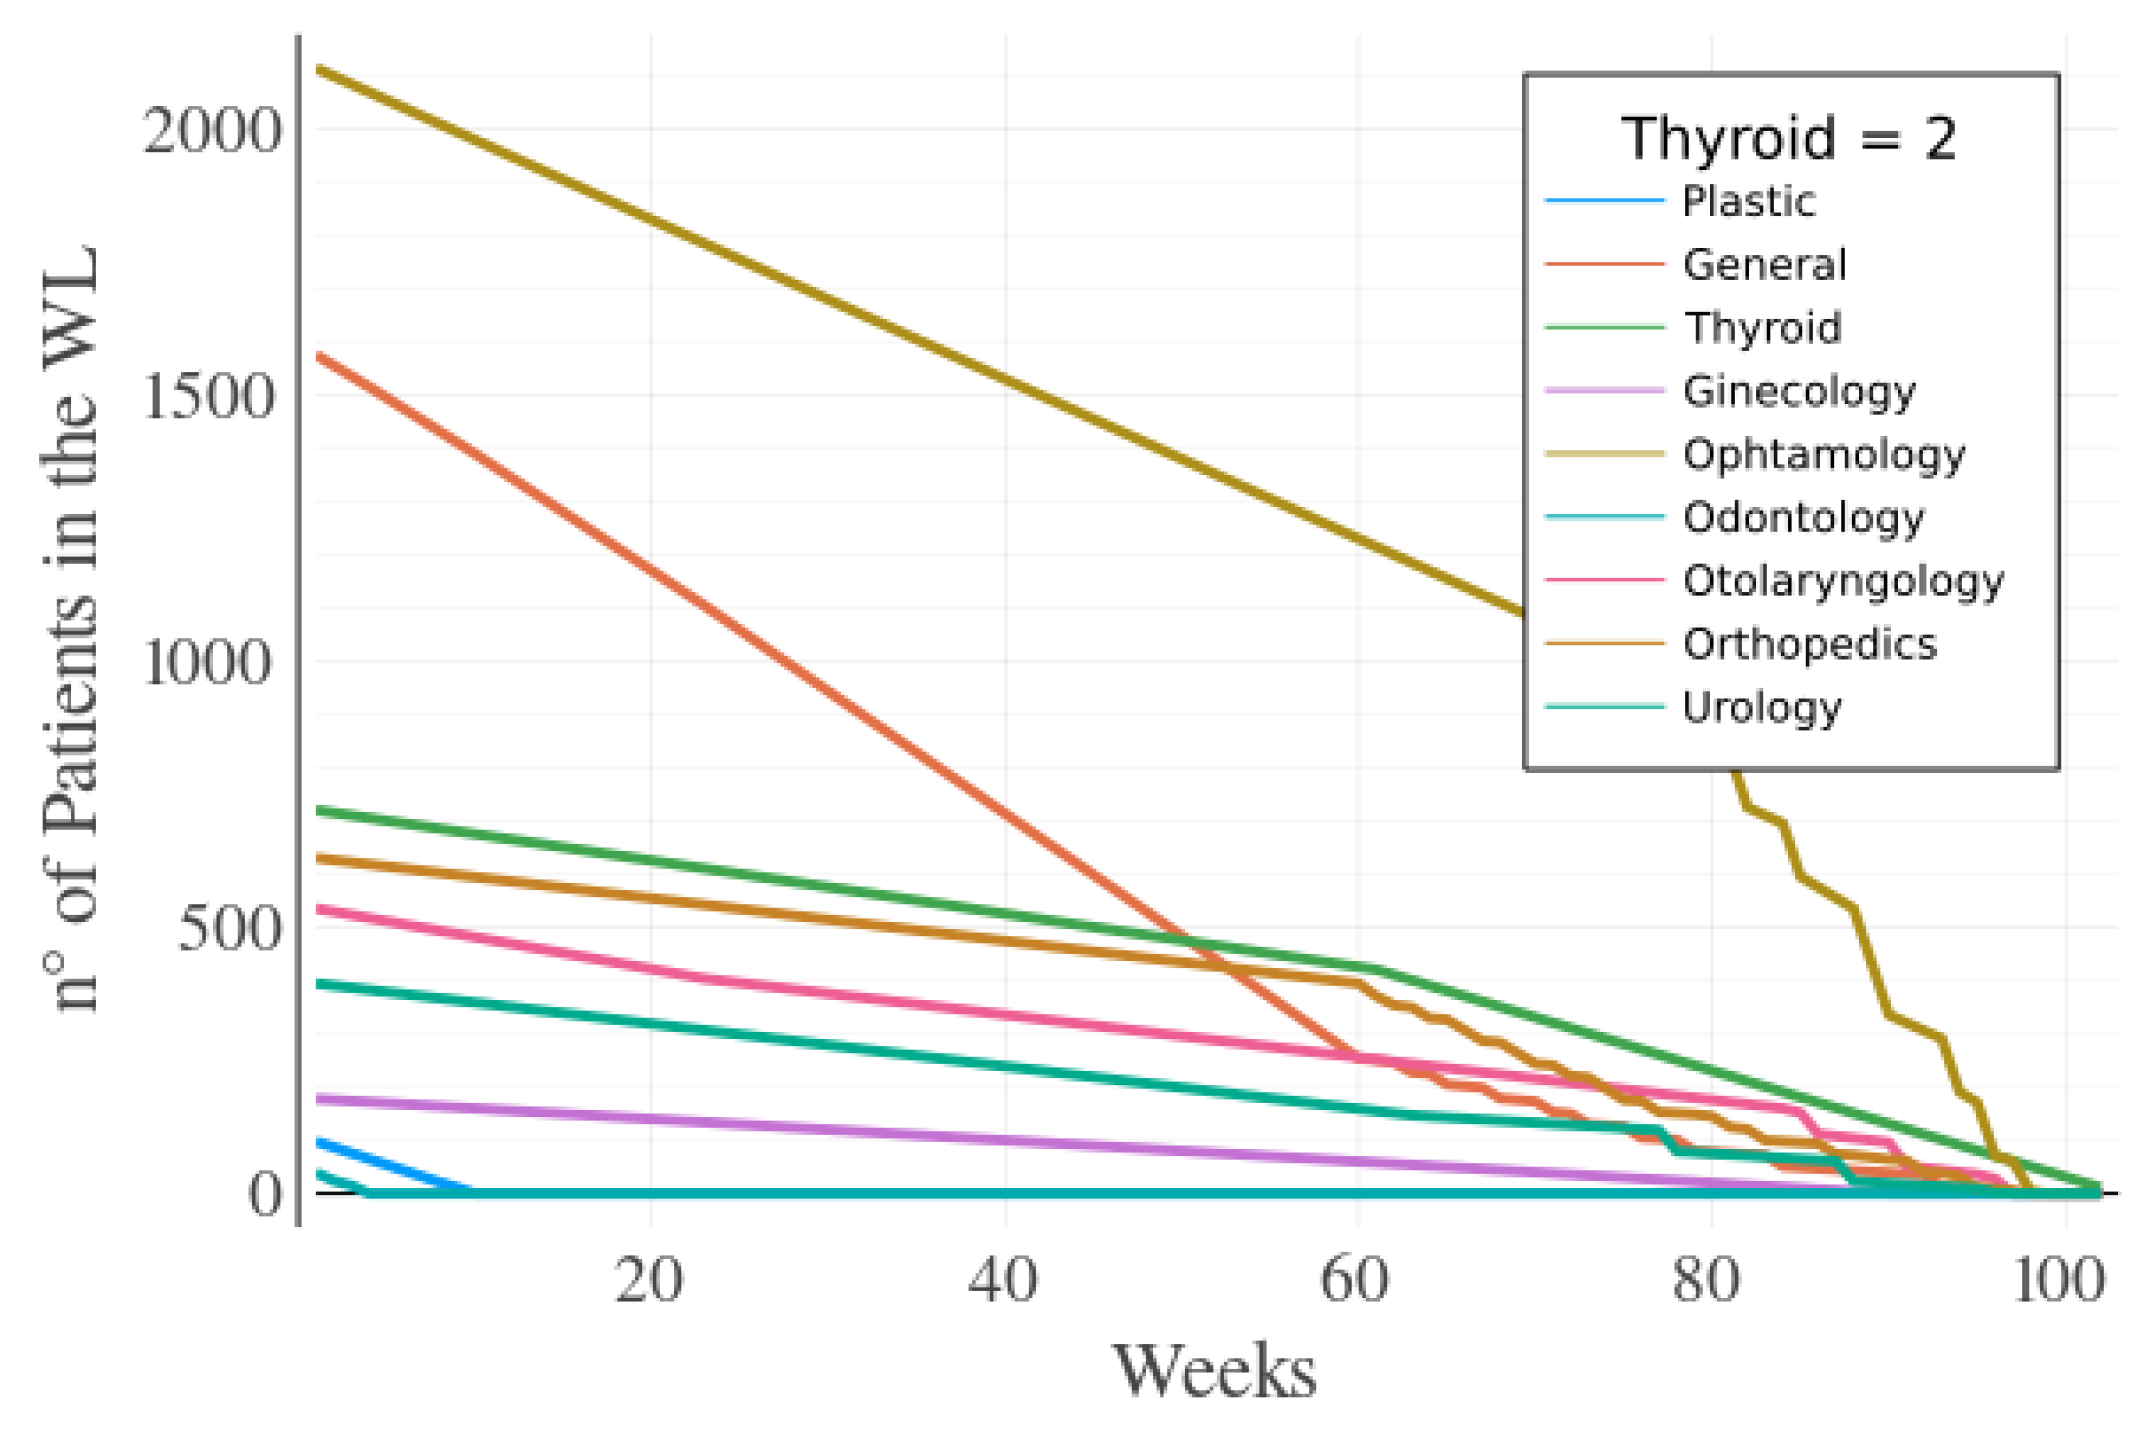
The mentioned cases show the sensitivity of the model to changes in the benefits,
. The final time to empty the waiting list in
Figure 3a is
, while the result in
Figure 3b gives also
. Nevertheless, even though the two cases give the same time to empty the waiting list, the hospital manager can give priority to profit in the short run when the hospital budget is particularly scarce [
27], choosing then the case where
. The next subsections show the results given the same weights for
and
(
). The cases to be considered include the increase in the surgical team specialty, and allowing double-shifts during some days of the week.
5.2. Surgical Teams Influence
The results given in
Figure 3a,b show that it takes a long time to empty the waiting list for the Thyroid specialty. Therefore, the number of the Thyroid’s surgical team is increased by one, having a new value of 2 surgical teams for this specialty.
When adding the new surgical team for the Thyroid specialty there was a reduction of 42 weeks to empty the waiting list. This difference for the final
is shown in
Figure 4 (from 144 weeks to 102 weeks). Thus, this huge decrease in the value of
shows the importance of increasing the number of surgical teams to decrease the WL for a specialty having, in this case, a decrease of almost 30% in the time to empty the waiting list.
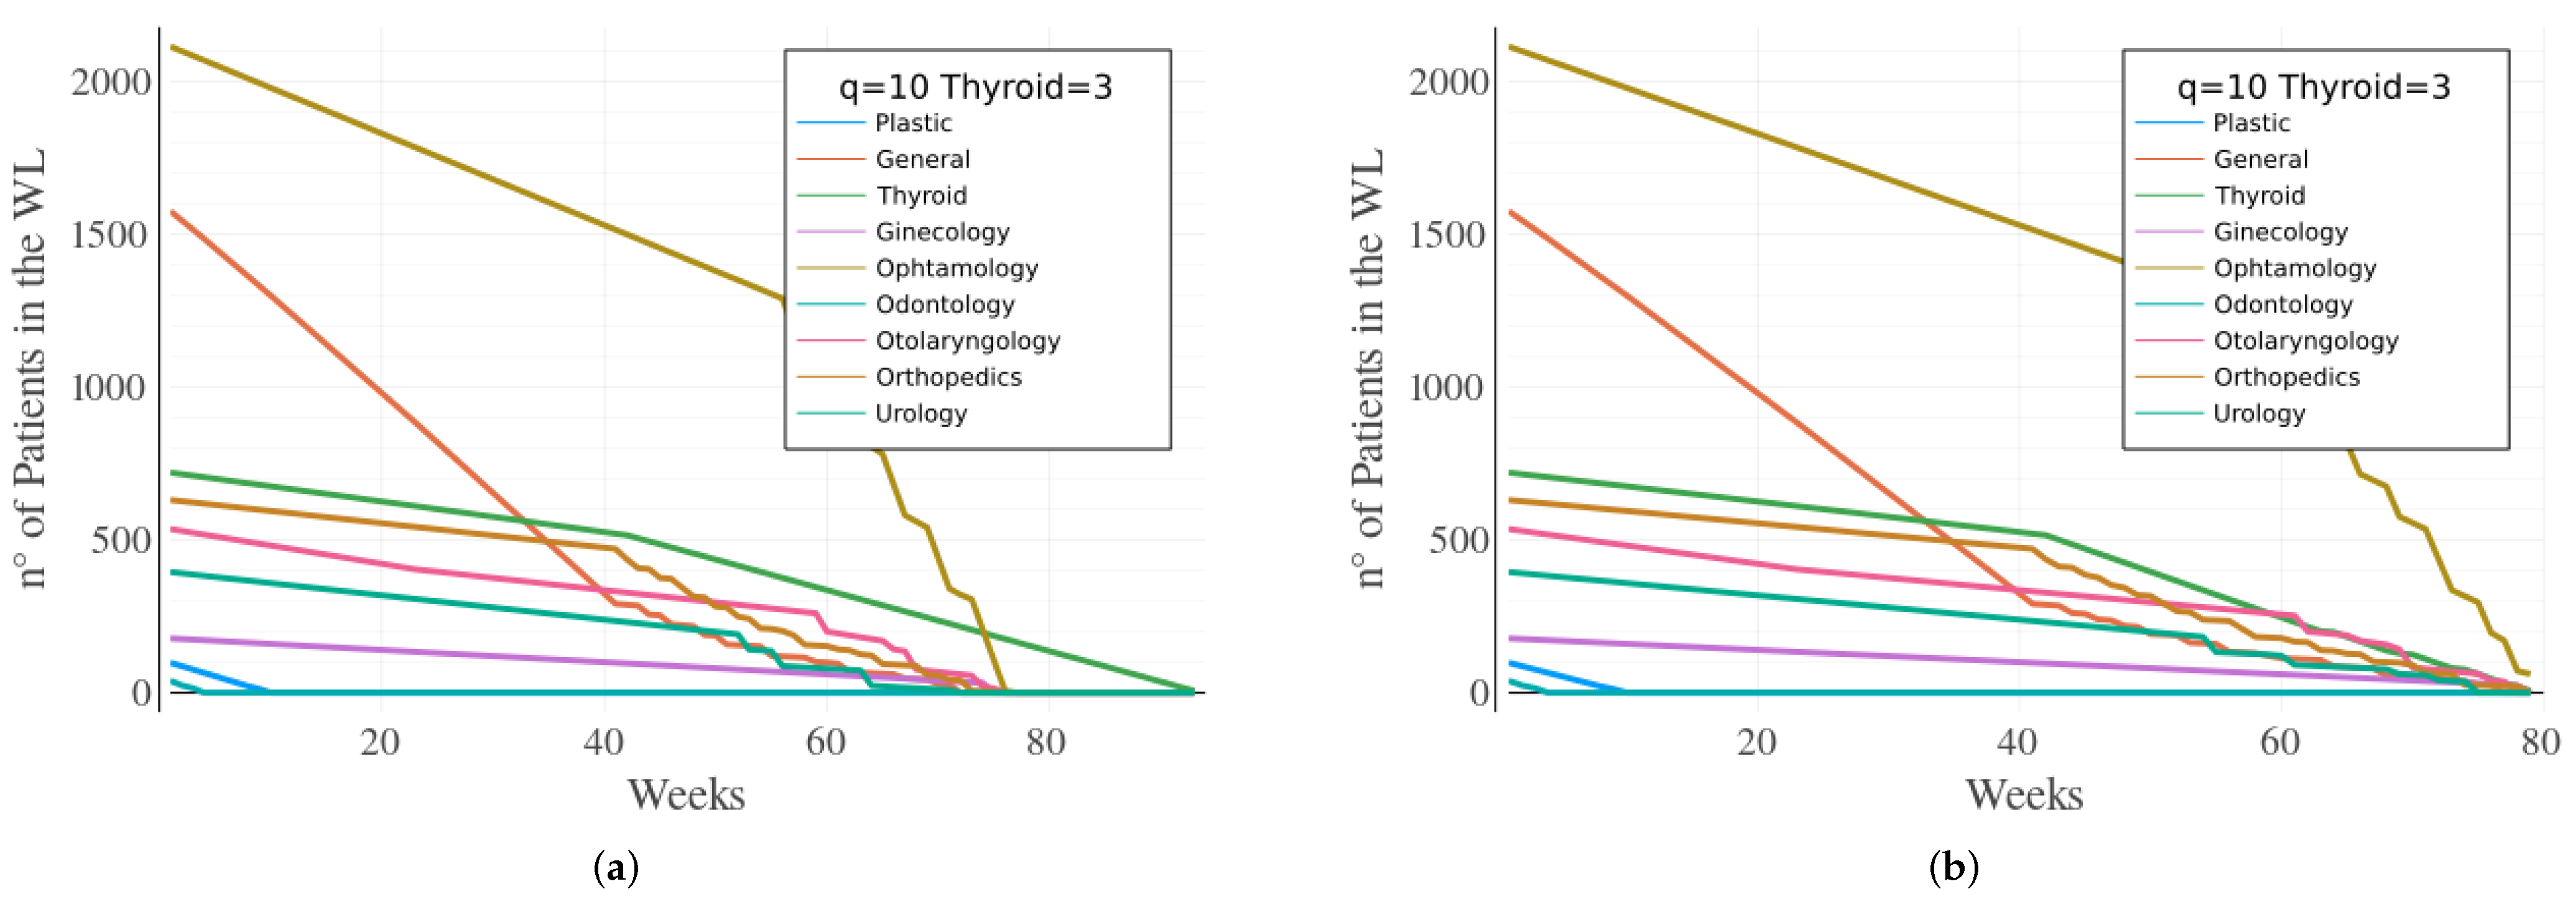
5.3. Maximum Operating Sessions Analysis
The operating room block times
q can be greater than the number of available operating rooms
, once some rooms can be used by more than one operating team daily. Such a work structure can increase the number of patients operated on for those specialties having many surgical teams, like the General and the Orthopedics specialties. Thus, analyses were made with different values of
q, and the most interesting results, for
, are shown in
Figure 5.
The value of
means that there is a double shift for two operating rooms. Therefore, when the model is implemented allowing this double shift, and the Thyroid surgical teams have a value of 2, the time to empty the waiting list decreased from 102 weeks to 93 weeks. This result is the first one suggesting it is possible to empty the waiting list in less than a 2 year period, or about 1 year and 11 months. When analyzing
Figure 5a, it can be still observed that the Thyroid specialty continues to be the one to take longer to empty its waiting list.
A third surgical team for the Thyroid specialty is then added to the model. Finally, the waiting list becomes empty in a period of 79 weeks ( = 79), or basically 1 year and 7 months. This final result can be considered quite good since the first results showed a required time of 3 years ( = 144 weeks) to empty the WL. The results show the robustness of the developed model to help the hospital decision managers to use their resources in a more efficient way.
All the presented results were obtained running the model on a PC with a Intel Core i5 processor 2.50 GHz × 4 having 8 GB of RAM. The Julia/JuMP script had an average running time of about 25 s. The Julia/JuMP script was the chosen one because it is an open source programming language being a quite powerful one. Just for comparison, when the model was implemented in the Julia and in the Matlab programming languages, it took about 25 s and 8 s to run the model, respectively. Nevertheless, the computer used to run the model was not a very powerful one, and certainly the result of 25 s obtained by the Julia open source language can be definitely applied in the real world.
6. Discussion
The results obtained give insights about how to improve not only the organizational structure and operations of the analyzed Italian hospital but also other similar hospitals. It was possible to accomplish further improvements to the system, increasing either the number of surgical teams or allowing double shifts to the operating rooms.
The developed model is able to improve the efficiency of the system spreading in a more evenly way the surgeries among the different specialties. Moreover, observing which specialty was taking longer to empty the waiting list, further improvements were obtained when the number of surgical teams was increased.
The expansion of surgical teams represents an organizational and financial challenge, usually being considered as a last resource type of policy to be applied in order to increase the efficiency of the system. However, when a hospital has great patient demand and short resource capacity, the decision to raise its personnel resource availability must be considered.
A promising measure is the double-shift approach allowing the use of “idle rooms” being a possible policy to be implemented to improve the number of operated patients. The double-shift policy, jointly with the rise of the surgical teams, enabled the time to decrease by 45% to empty the waiting list even when the optimization model had already been applied to the so-called static case.
7. Conclusions
The health-care sector faces many challenges when it comes to efficiently using its scarce resources in a period with a higher demand. This work proposes a new ILP model to empty the surgery waiting list of nine different specialties more quickly. The model considers the number of surgery teams and of ward beds, and the surgery prices, among other factors. The ILP developed model is implemented using the data set of an Italian hospital.
The applied model is based on case-mix planning and master surgical scheduling problems. The attained scheduling distributed the resources more evenly, improving the balancing of the workload. Moreover, the balancing of the ward’s beds is accrued introducing a penalty cost to the misplacement of a patient in a wrong ward.
The developed model has certainly some limitations. The main caveats of the applied model are the ones related to the weekly increase of the patient demand for each specialty besides the increase in the costs related to the hiring of new health personnel, including the expansion of the surgical teams.
Further studies must then take into account the increase in the weekly surgery requests. This extension was not implemented in the proposed model due mainly due to the lack of data related to this increase in the surgery demand. Certainly, when one considers this raise in the surgery needs, there will also be an increase to the time to empty the surgeries waiting list, and that will make the model a more realistic one.
Cost-benefit analysis could also be evaluated regarding the cost to hire new surgical teams, and the economics and social benefits accrued due to the rise in the number of weekly operated patients. The possibility of raising the number of ward beds and building new pavilions can also be considered in the future, due to a possible bottleneck in the number of ward beds.
Nevertheless, the results demonstrated that it is possible to reduce the time taken to empty the waiting list for the surgeries by about 45%, from 144 weeks to 79 weeks. These results are very promising in a time of very scarce financial and health resources.


