Article

A Novel Integrating Data Envelopment Analysis and Spherical Fuzzy MCDM Approach for Sustainable Supplier Selection in Steel Industry

1
Department of Industrial Engineering and Management, National Kaohsiung University of Science and Technology, Kaohsiung 80778, Taiwan
2
Research Center of Applied Sciences, Faculty of Business, FPT University, Hanoi 100000, Vietnam
3
Department of Business Management, National Taipei University of Technology, Taipei 10608, Taiwan
*
Author to whom correspondence should be addressed.
Mathematics 2022, 10(11), 1897; https://doi.org/10.3390/math10111897
Submission received: 24 April 2022 / Revised: 28 May 2022 / Accepted: 30 May 2022 / Published: 1 June 2022
(This article belongs to the Section Mathematics and Computer Science)

Abstract

:
Supply chain sustainability, which takes environmental, economic, and social factors into account, was recently recognized as a critical component of the supply chain (SC) management evaluation process and known as a multi-criteria decision-making problem (MCDM) that is heavily influenced by the decision-makers. While some criteria can be analyzed numerically, a large number of qualitative criteria require expert review in linguistic terms. This study proposes an integration of Data Envelopment Analysis (DEA), spherical fuzzy analytic hierarchy process (SF-AHP), and spherical fuzzy weighted aggregated sum product assessment (SF-WASPAS) to identify a sustainable supplier for the steel manufacturing industry in Vietnam. In this study, both quantitative and qualitative factors are considered through a comprehensive literature review and expert interviews. The first step employs DEA to validate high-efficiency suppliers based on a variety of quantifiable criteria. The second step evaluates these suppliers further on qualitative criteria, such as economic, environmental, and social factors. The SF-AHP was applied to obtain the criteria’s significance, whereas the SF-WASPAS was adopted to identify sustainable suppliers. The sensitivity analysis and comparative results demonstrate that the decision framework is feasible and robust. The findings of this study can assist steel industry executives in resolving the macrolevel supplier selection problem. Moreover, the proposed method can assist managers in selecting and evaluating suppliers more successfully in other industries.
MSC:
97M30; 91B02; 62P05; 91B84

1. Introduction

The steel industry is an important fundamental industry sector in the national economy, and it is regarded as a significant symbol of the nation’s overall power. As Vietnam’s economy improves and people’s living standards rise, the demand for steel in industries such as buildings, transportation, and household appliances increases. The rapid growth of steel demand has attracted various steel companies to invest in new steel production facilities in Vietnam. Therefore, finding the appropriate supplier is critical for organizations at this time [1]. There is a growing recognition of the need for businesses to collaborate closely with their supply chain partners to optimize their business processes. Supplier selection is one of the purchasing function’s most crucial components, as it is critical for improving the organization’s competitiveness and increasing customer satisfaction [2]. With increased government regulation and public awareness of environmental preservation, businesses cannot afford to disregard environmental concerns if they want to compete in the global market. Businesses must voluntarily develop plans to reduce their products’ environmental impact [3]. Supplier selection is a foundation for forecasting and evaluating the suppliers’ ability to form a collaborative partnership. As a result, businesses should employ a suitable supplier selection strategy to identify potential partners, thereby maintaining their competitive advantages during globalization [4]. Due to rising awareness and understanding of sustainability and government initiatives in this area, businesses cannot afford to ignore the issue of sustainability in their operations [5].
Sustainable development is defined as “development that meets the needs of the present without compromising the ability of future generations to meet their own needs”. This concept incorporated the critical intertemporal dimension of human impact on the natural ecosystem [6]. The triple bottom line (TBL) has been developed to evaluate industrial performance across social, economic, and environmental sustainability. TBL states that a firm’s long-term success can be attained by balancing economic objectives and social and environmental concerns [7]. Due to society’s goal for a sustainable future, sustainability has been emphasized in the manufacturing supply chain (SC). To create a sustainable supply chain, all stakeholders must be invested in sustainability, from suppliers to top management [8]. Moreover, large-scale industries such as the iron and steel enterprises have a greater impact on the TBL than medium- and small-scale industries. As a large-scale industry, this industry has a considerable influence on sustainability dimensions, having a three-fold impact on economic, environmental, and social dimensions: (i) colossal sums of money are invested, which affects the nation’s economic growth; (ii) industry operations include mineral extraction, greenhouse gas emissions, and waste disposal, all of which affect the environment; and (iii) the industry should ensure that its employees have workplace safety and receive proper health care. From a sustainability perspective, decision-makers must establish important criteria for identifying sustainable suppliers in the social, environmental, and economic domains. As a result, decision-makers must manage numerous sustainability criteria to evaluate supplier performance, and rigorous clustering is needed to classify criteria into each sustainability category. Hence, in light of the steel sector’s importance as an infrastructure industry for nations’ economies, the main objective of this research is to identify the most sustainable suppliers for the steel industry based on three levels (economic, environmental, and social) utilizing multi-criteria decision-making problem (MCDM) approaches.
Over time, the MCDM has attracted the research community’s attention. It has discovered unique approaches to assist decision-makers in weighing various options and selecting the optimal option while considering conflicting qualitative and quantitative criteria. Numerous MCDM strategies are applied in supplier selection with the following objectives: (a) finding the preference weights (relative importance) of the considered criteria through comparison, and (b) ranking possible suppliers based on the collected score for each criterion. In this manner, an infinite number of MCDM techniques are relevant, including the analytic hierarchy process (AHP), the technique of order preference similarity to the ideal solution (TOPSIS), VlseKriterijumska Optimizacija I Kompromisno Resenje (VIKOR), preference ranking organization method for enrichment evaluation (PROMETHEE), combinative distance-based assessment (CODAS), grey relational analysis (GRA), and weighted aggregated sum product assessment (WAPAS). For example, Shemshadi et al. [9] adapted the VIKOR approach to derive and apply objective weights based on the Shannon entropy idea to solve supplier selection issues. According to Mousavi-Nasab and Sotoudeh-Anvari [10], TOPSIS and COPRAS have been effective procedures in general practice when it comes to material selection problems. Garg and Kumar [11] created the TOPSIS technique, which combines innovative exponential distance measurements with the theory of set pairs to solve real-world problems involving interval-valued intuitionistic fuzzy sets. Among these techniques, weighted aggregated sum product assessment (WASPAS) is a comparatively new and simple MCDM technique widely employed in various useful applications [12].
Besides, Data Envelopment Analysis (DEA) is concerned with evaluating the performance of decision-making units (DMUs) that conduct transformations on many inputs and outputs [13], and the results of DEA provide a measure of efficiency for each DMU, allowing for separating efficient and inefficient DMUs and identifying each inefficient DMU’s efficient peers [14]. The effectiveness of DEA in performance evaluation, combined with the formal analogies between DEA and MCDM (which become obvious when DMU is replaced with alternatives, outputs are replaced with criteria to be maximized, inputs are replaced with criteria to be minimized, and so on) has prompted some authors to propose using DEA as a tool for MCDM [15]. A number of recent papers have begun to analyze the relationship between DEA and MCDM, and they show the potential usefulness of DEA for MCDM. For example, Mousavi-Nasab and Sotoudeh-Anvari [10] examined the use of DEA as a material selection problem MCDM tool. DEA can be used to solve this problem when a classical remark is considered; however, DEA cannot replace MCDM in this area in general. In order to calculate the final efficiency of transport businesses based on 10 input-output variables, Stević et al. [16] built a model that integrates DEA and other MCDM techniques. Additionally, spherical fuzzy sets (SFSs) may be used to implement criteria for dealing with ambiguity and vagueness in linguistic expressions, which provides a novel perspective for decision-making in a fuzzy environment. The decision maker’s level of uncertainty is provided independently of the items’ membership or non-membership in these sets. The membership function in SFSs is defined on a spherical fuzzy to infer additional fuzzy sets from which the membership function’s parameters can be extended over a larger domain [17].
The AHP model established by Thomas L. Saaty [18] is widely used for assessing, prioritizing, ranking, and evaluating decision options. Thus, the AHP technique also decomposes problems into hierarchies based on decision-makers’ judgments [19]. The number of layers in a hierarchy indicates the complexity of the problem. Since Zadeh described ordinary fuzzy sets [20], they have gained widespread popularity in practically all disciplines of study. Numerous studies have discovered extensions to ordinary fuzzy sets, including type-2 fuzzy sets (T2FS), intuitionistic fuzzy sets (IFS), hesitant fuzzy sets (HFS), Pythagorean fuzzy sets (PFS), and neutrosophic sets (NS). Spherical fuzzy sets are the three-dimensional fuzzy sets constructed by Pythagorean and neutrosophic fuzzy sets. There have had a few studies using the AHP based on SFSs. For example, Nguyen et al. [21] employed a hybrid model consisting of Spherical Fuzzy-AHP, PLS-SEM, and ANN to predict COVID-19 vaccination intentions. Kutlu Gündoğdu and Kahraman [22] developed and used spherical fuzzy AHP to address the problem of selecting industrial robots. Camci et al. [23] used the spherical AHP method to select contract types in construction projects.
WASPAS is a well-known and effective method for resolving multicriteria decision-making problems. The initial concepts for the WASPAS approach were published in 2012 [24]. It is created by combining two approaches, namely the weighted sum model (WSM) and the weighted product model (WPM). The WASPAS method combines the benefits of both approaches. The advantage of the WSM method is that it is simple to evaluate alternatives using the weighted sum. The advantage of the WMP approach is that it avoids obtaining solutions with low values. Numerous extensions of WASPAS using fuzzy sets have been examined in the literature, including single-valued neutrosophic sets, interval-valued intuitionistic fuzzy sets, and interval type-2 fuzzy sets. These extensions have in common the use of linguistic concepts, including imprecise and ambiguous judgments. Then, Kutlu Gundogdu and Kahraman [25] extended WASPAS with SFSs in 2019. Recently, the application of SF-WASPAS has been applied in various fields such as landfill site selection [26], robot selection problem [25], petrol station location selection [27], governmental interventions selection for dealing with the COVID-19 outbreak [28], and international payment methods [
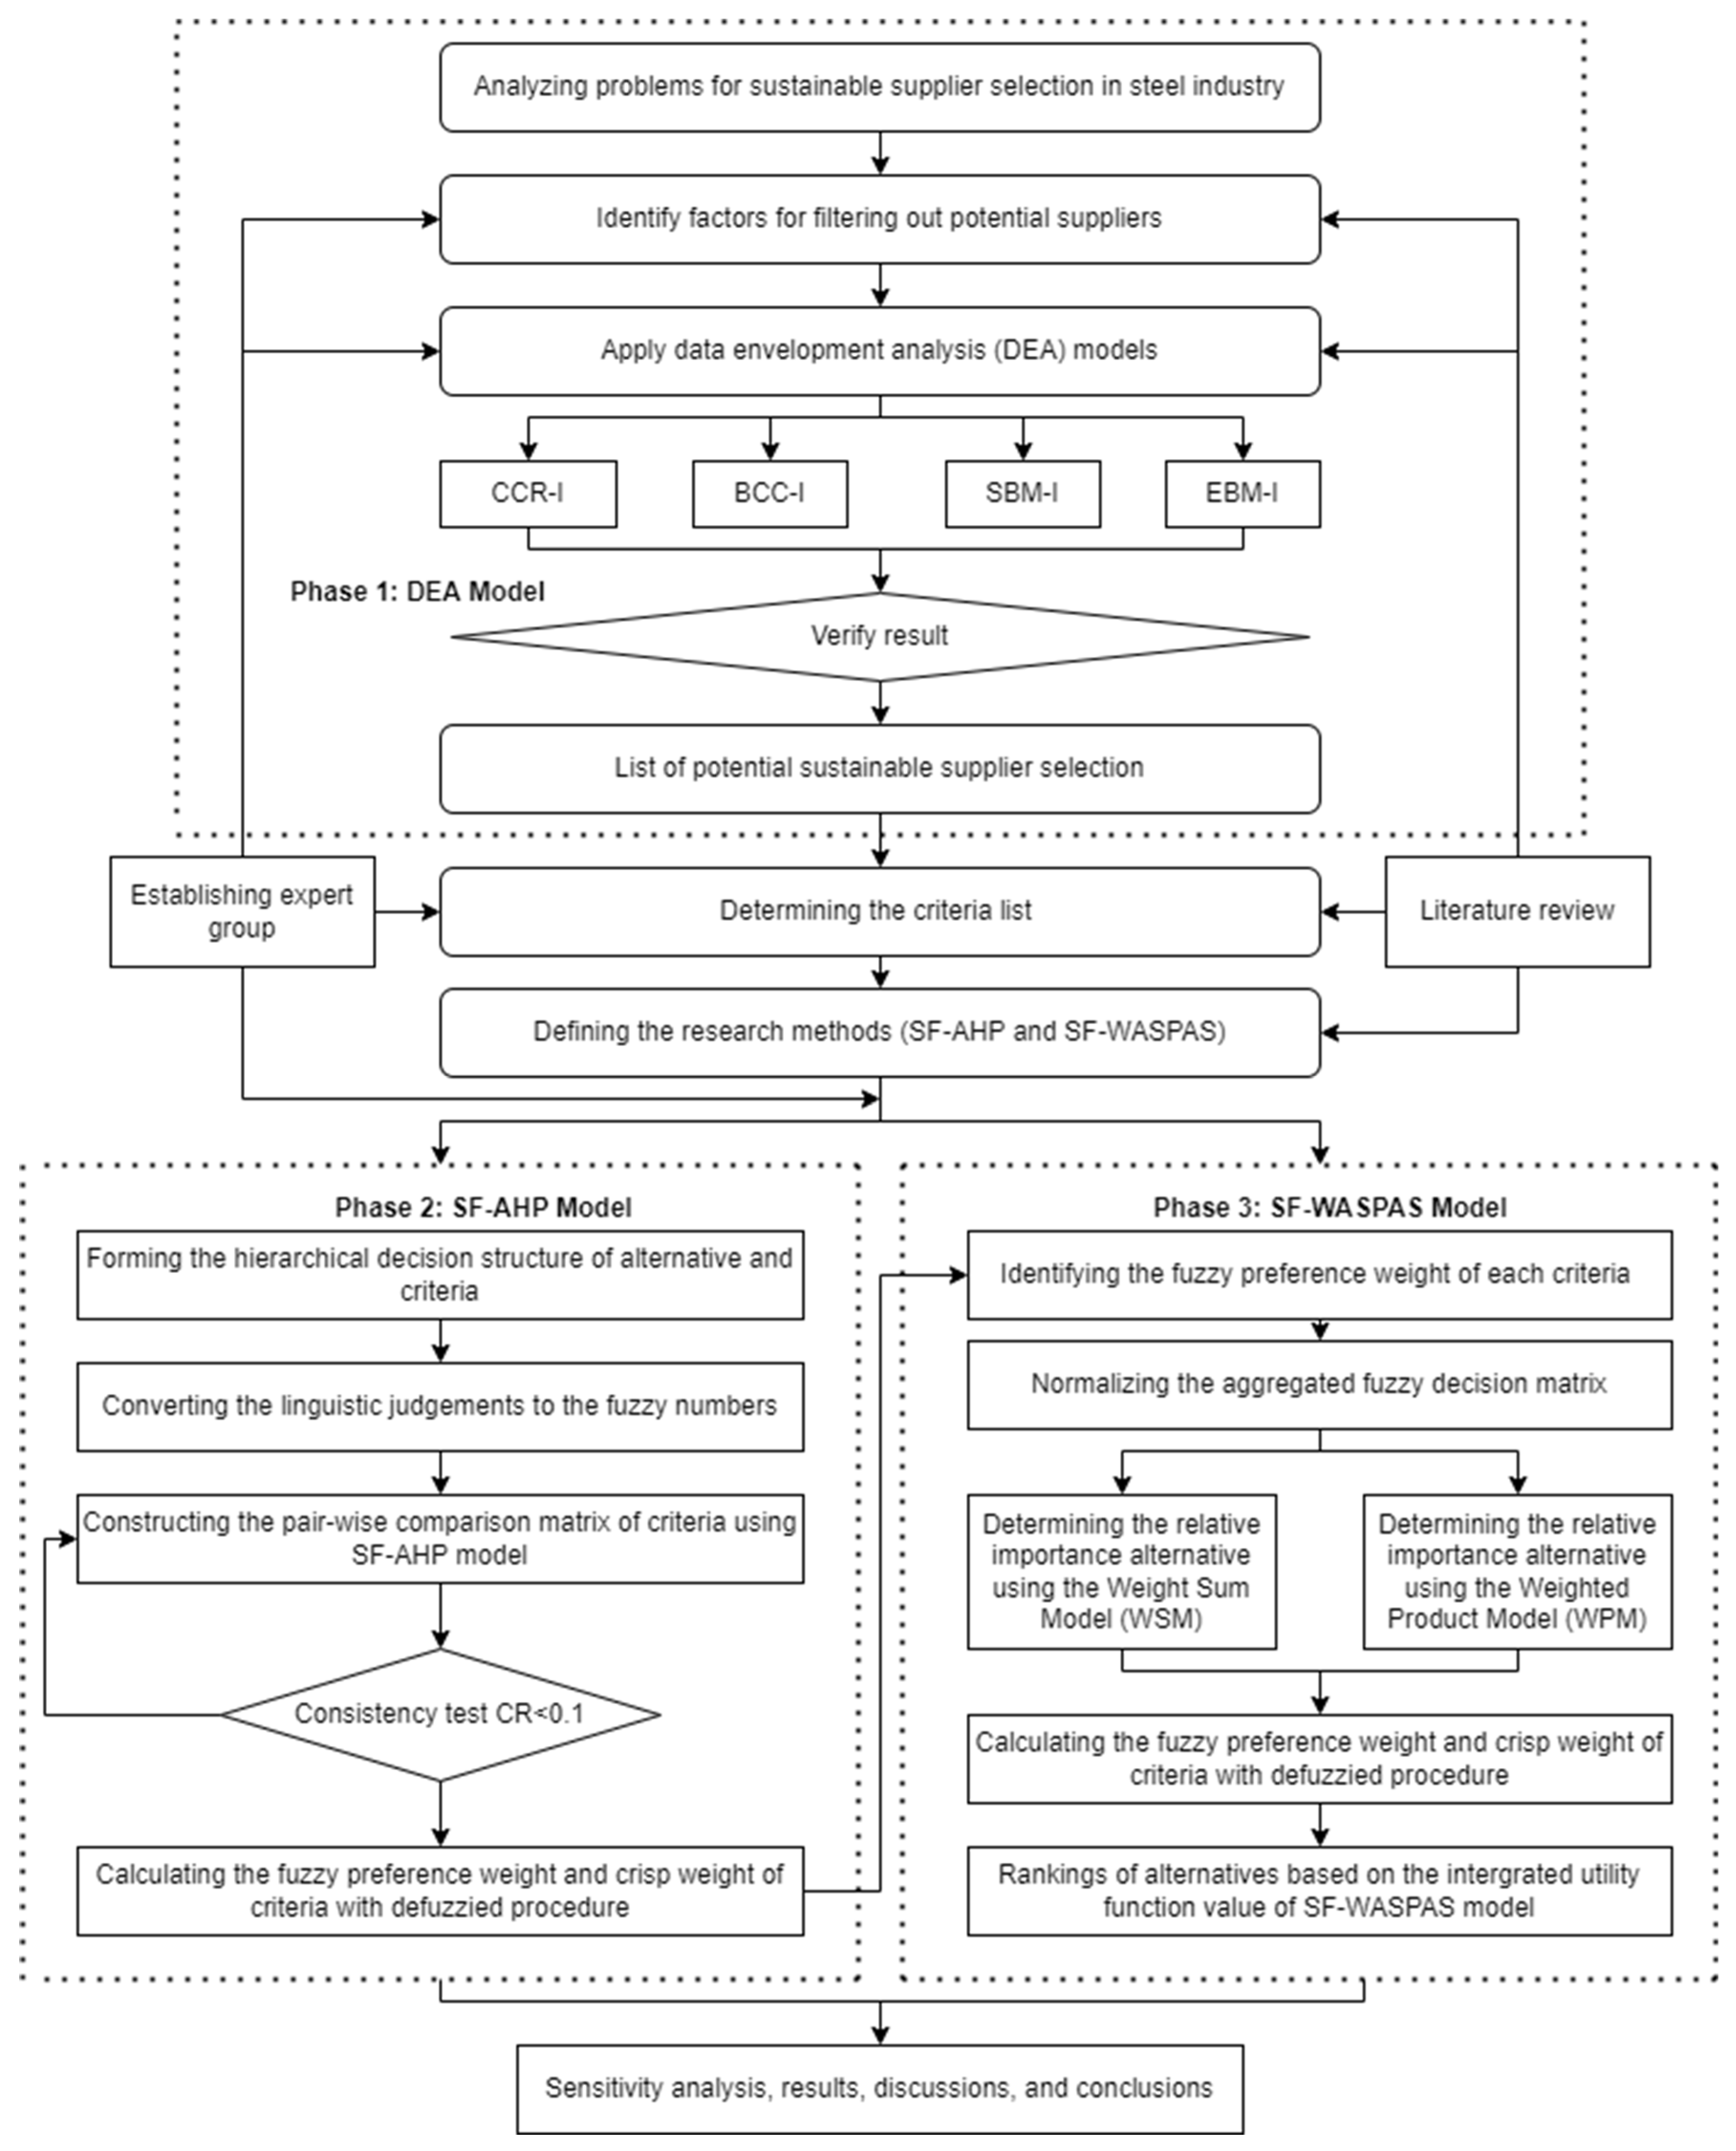
29]. Therefore, this study attempts to build a framework based on MCDM for identifying the best sustainable supplier for the Vietnamese steel sector. First, the DEA approach identifies the best-performing sustainable suppliers. Then, the SF-AHP is applied to calculate the priority weights of supplier criteria, followed by the SF-WASPAS to rank sustainable providers. A real case study in the Vietnam steel industry is conducted to validate the proposed models.
The main contributions in this study are summarized as follows:
(1)
This is the first study to analyze sustainable supplier selection in the steel sector, particularly in Vietnam, using a novel hybrid DEA, SF-AHP, and SF-WASPAS models;
(2)
This research proposes an effective evaluation approach for sustainable suppliers in the steel manufacturing industry. The model includes a comprehensive set of sustainability criteria to help raise awareness of sustainable development. Further, financial factors affecting the development of steel suppliers in Vietnam are also shown based on the DEA model;
(3)
The weighting of the criterion is calculated utilizing spherical fuzzy sets for a larger linguistic scale of expert assessments, which reflects the decision-making process in uncertain environments. SF-AHP calculates the relative weights, and SF-WASPAS has the capacity and accuracy to rank the options;
(4)
The organizational implications of this research can provide significant guidance in the supplier assessment and selection sector for steel operators and decision-makers and investors in other industries.
The remainder of this study is organized as follows. The next section is a comprehensive assessment of the literature on MCDM. Section 3 discusses the methods used to determine the weights and rankings of alternatives. In Section 4, a case study is presented. In Section 5, the results and discussions of the finding are analyzed. Section 6 discusses conclusions and implications.

2. Literature Review

In today’s highly competitive market, businesses prioritize strengthening their core competencies while outsourcing certain tasks to suppliers with various professional capabilities to gain a competitive edge using these external resources. On the other hand, the supply of raw materials across many industrialized countries is becoming scarce, forcing them to seek suppliers from other countries to maintain the firm’s operation stability. Thus, Nguyen et al. [30] addressed the impacts of domestic raw materials and international raw materials on firm performance, which would aid firms in diversifying products and generating products while meeting the stringent requirements of today’s market. In these contexts, the function of suppliers and challenges relating to them have played a significant part in supplier chain management. Evaluation or selection of suppliers is a typical issue in acquiring the required essential aspects to support the outputs of organizations. The challenge for enterprises is identifying and evaluating the optimal period or the most appropriate supplier for their various capabilities [31]. In the previous decade, there have been a tiny number of relevant research on steel selection, in which MCDM techniques have demonstrated impressive outcomes in various case evaluations globally. Some wide methodologies are used in the steel industry’s evaluation, including AHP, TOPSIS, decision making trial and evaluation laboratory (DEMATEL), Delphi, slacks-based measure (SBM), best-worst method (BWM), fuzzy Kano, measurement alternatives and ranking according to compromise solution (MARCOS), and interpretive structural modeling (ISM).
Amiran et al. [32] used a hybrid fuzzy AHP and TOPSIS approach to evaluate Iran’s steel industry’s performance based on a balanced scorecard. Jafarnejad et al. [33] proposed a combination of DEMATEL and fuzzy AHP models to tackle the problem of selecting an enterprise resource planning system for the steel sector. Mohaghar and Zarchi [34] deployed a hybrid of AHP and DEMATEL models to identify and rank steel industry-funded projects in Iran. Quader and Ahmed [35] suggested integrating Delphi, two-tuple decision-making trials and DEMATEL, and fuzzy AHP models to identify dimensions and key indicators for evaluating alternative iron-making innovations in the Malaysian and Indian steel industries. Azimifard et al. [36] applied the AHP and TOPSIS techniques to pick sustainable supplier countries for Iran’s steel sector. Choi et al. [37] employed a DEA- SBM approach to evaluate the steel industry’s environmental and traditional energy efficiency in Korea. Javad et al. [38] employed BWM and fuzzy TOPSIS models to determine the critical parameters affecting Khouzestan Steel Company’s selection of green suppliers. Jain and Singh [39] provided a fuzzy modified Kano model to classify sustainable suppliers in the Indian iron and steel industry. Chakraborty et al. [40] used D numbers and MARCOS models to resolve the ambiguity inherent in the decision-making process for supplier selection in India’s iron and steel sector. Ghamari et al. [41] proposed a framework for selecting sustainable suppliers in the Iranian steel industry based on three models: ISM, BWM, and TOPSIS. Table 1 summarizes studies on supplier selection in the steel sector. For the analysis of sustainable supplier-related issues, researchers and practitioners have adopted numerous decision-making strategies. However, the majority of researchers largely focused on supplier problems. Only a few academics have focused on sustainable supplier selection in the steel industry and assessment judgments. Furthermore, most researchers used traditional decision analysis techniques to solve their research problems. To our best knowledge, this is the first study to apply the integration of DEA and spherical fuzzy MCDM models to evaluate sustainable supplier selection, particularly in the Vietnamese steel industry.
Notably, many works have investigated economic-environmentally focused supplier decision-making in developed nations, but there is still a lack of research on supplier selection for sustainability in developing nations [42]. In a developing nation like Vietnam, understanding and awareness of the three pillars of economic-ecological-social dimensions are severely lacking. Furthermore, sustainability criteria may differ from the perspective of developing nations since consumers may not be ready to pay more for sustainable items. Additionally, other SSS-related gaps might be investigated. Existing literature, for instance, fails to indicate that the sustainability dimensions should correspond with supplier selection criteria within a hierarchical framework. In addition, the literature reveals a vast body of work on green-oriented supplier selection [43]. Nevertheless, academics have ignored the social aspects of supplier selection decisions [44]. Following this, Seuring and Müller [45] observed a clear deficiency in supply chain management and purchasing literature about incorporating all three elements of sustainable development in supply networks. Thus, the notion of supplier selection and evaluation with a focus on sustainability is gaining importance among commercial organizations.
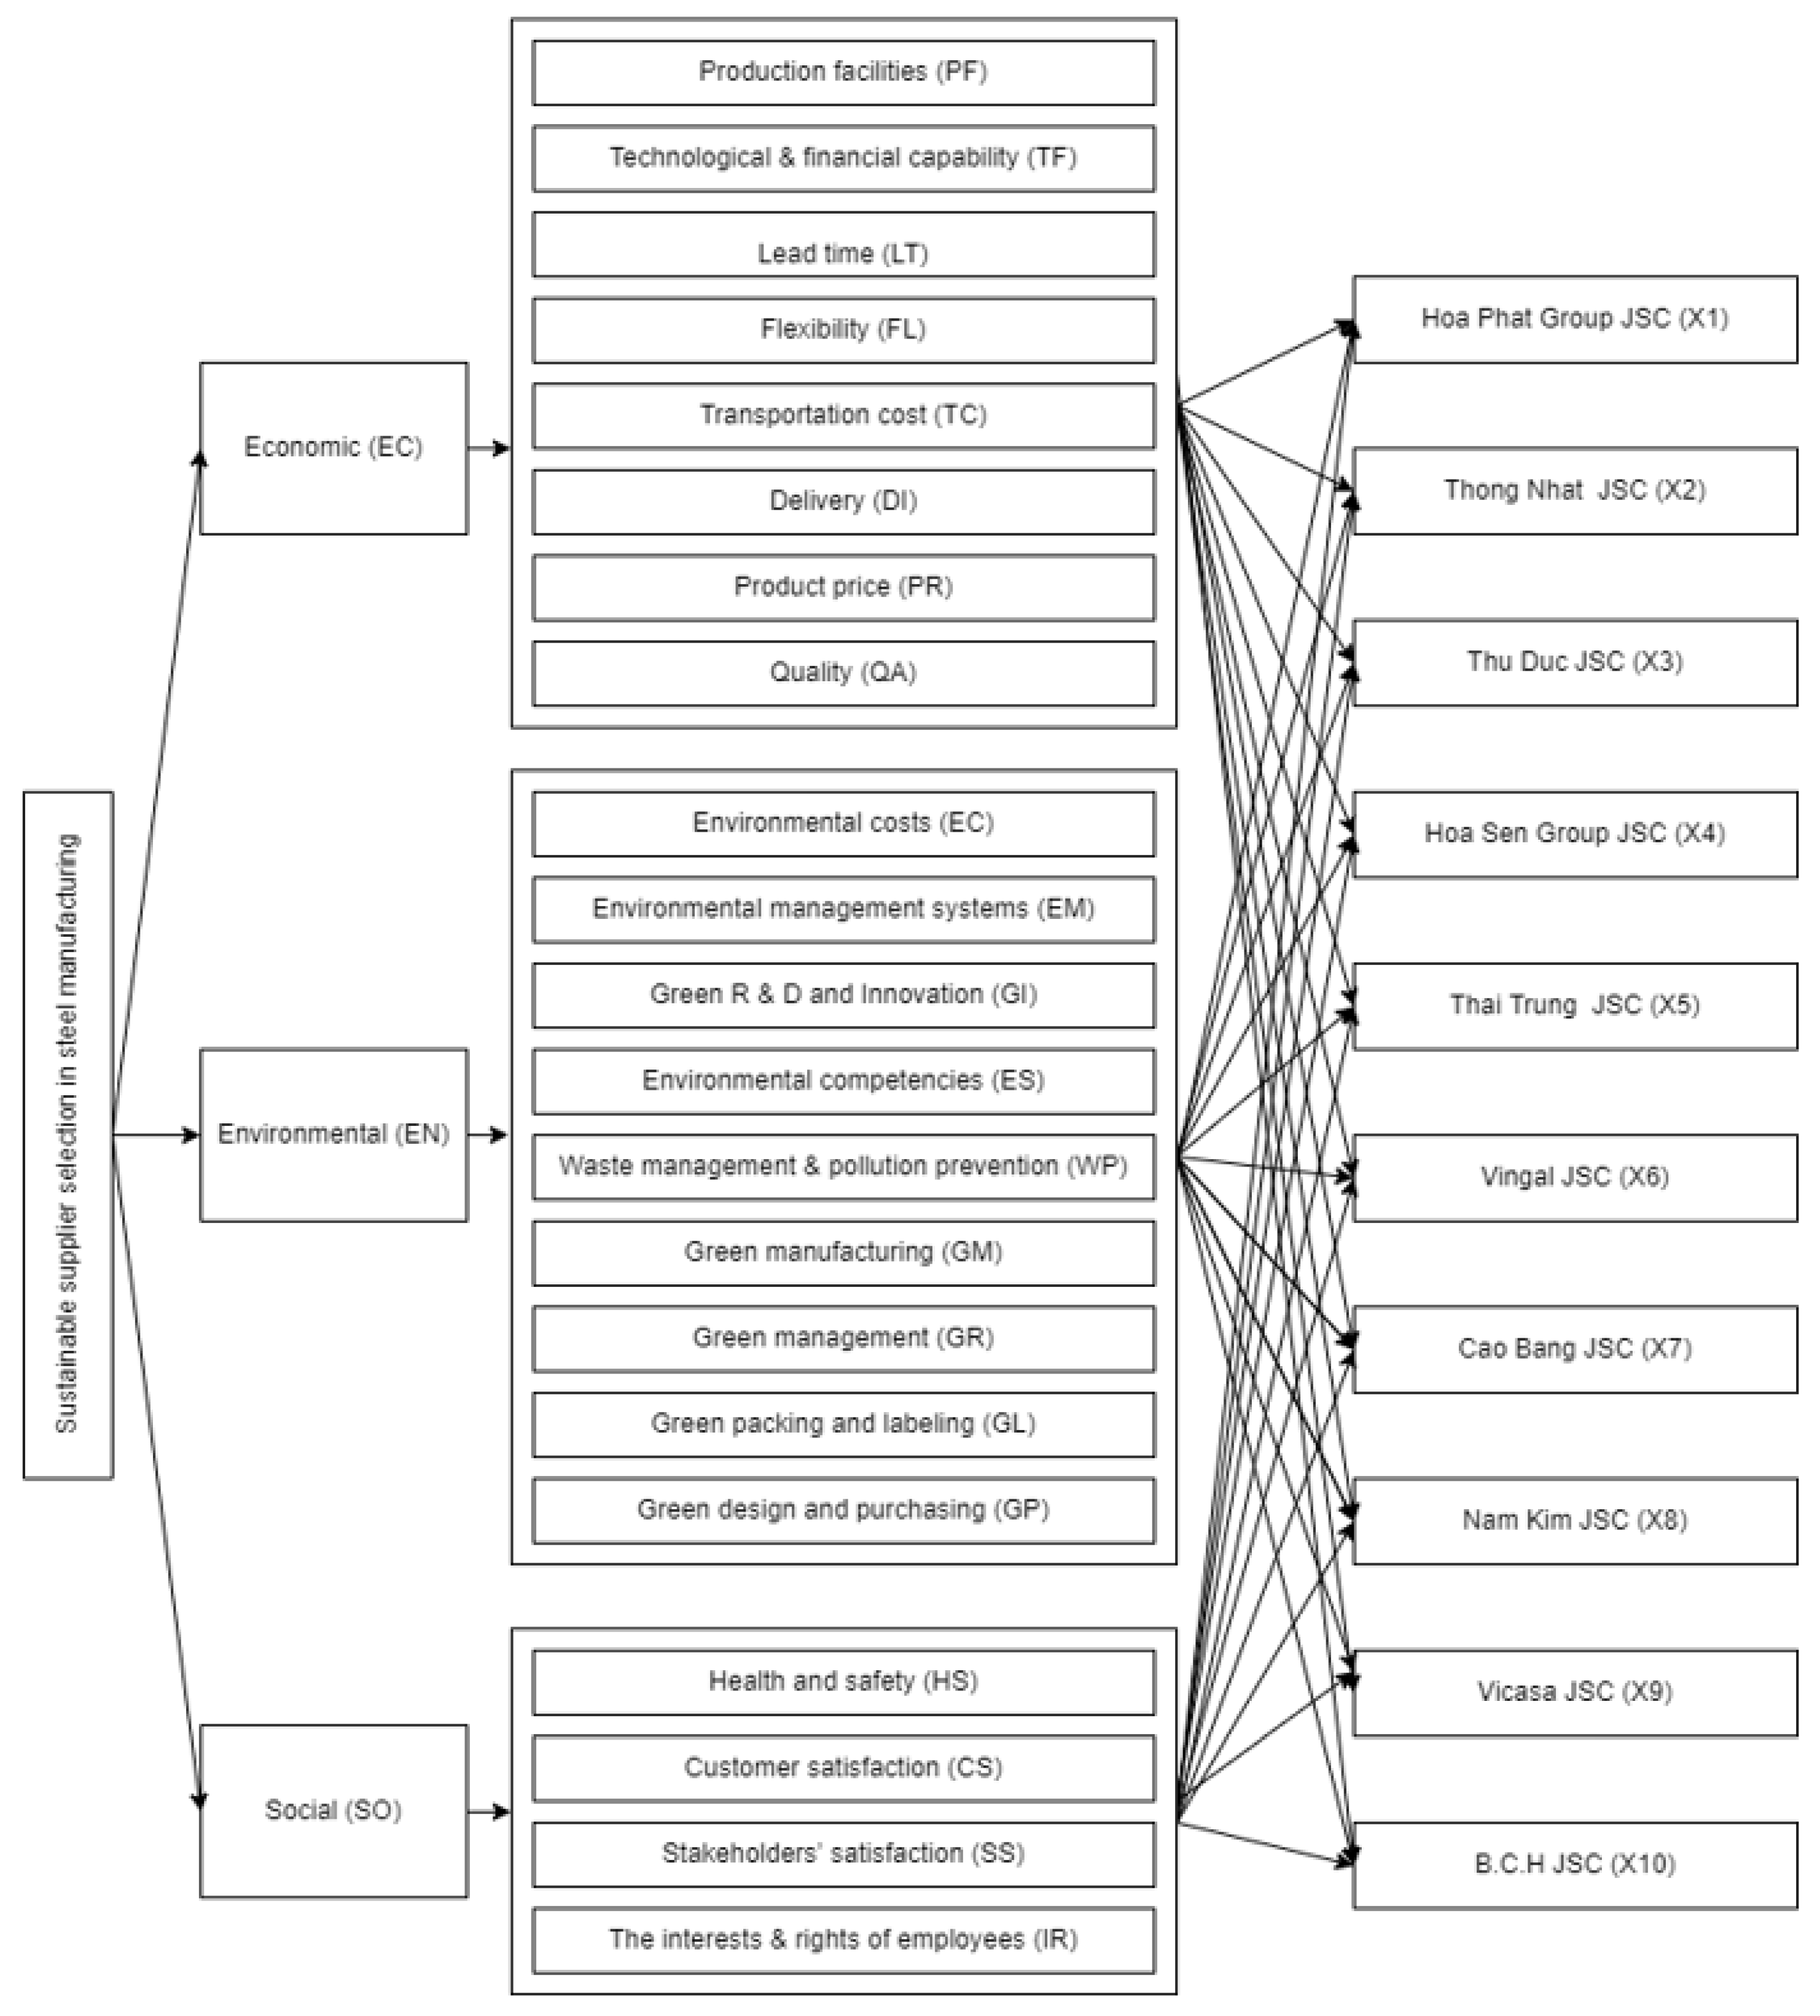
Table 2 shows a list of factors used in previous research to select sustainable suppliers. While some research analyzed only a few key characteristics, others used a more comprehensive list of criteria, resulting in more reliable results. A set of sustainable criteria was created and examined, including economic factors (production facilities, technological and financial capability, lead time, flexibility, transportation cost, delivery, product price, quality), environmental criteria (environmental costs, environmental management systems, green R and D and innovation, environmental competencies, waste management and pollution prevention, green manufacturing, green management, green packing and labeling, green design and purchasing), and social criteria (health and safety, customer satisfaction, stakeholders’ satisfaction, the interests and rights of employees). The list of criteria was developed following a thorough analysis of the previous studies and was further refined with the help of a panel of experts from the Vietnamese steel manufacturing industry. The experts recognized that the set was comprehensive, addressed numerous aspects of the evaluation process, and recommended it be utilized as the final set.
According to the literature reviewed above, there is a dearth of example research on sustainable supplier selection, particularly in the Vietnamese steel industry. Keeping this in mind, for the first time, attempts have been made in this study to find the best suitable sustainable supplier by employing the merits of DEA, AHP, and WASPAS based on spherical fuzzy sets. The suggested MCDM approach can process uncertain assessments through spherical fuzzy environments that do not ignore any information from human judgments and create a more robust and accurate ranking for the alternatives through the novel SF-WASPAS method. Furthermore, to the best of the authors’ knowledge, this is the first study to use DEA, SF-AHP, and SF-WASPAS analysis for sustainable supplier selection in the Vietnamese steel sector.

3. Methodology

3.1. DEA Models-Preliminaries

This section provides a concise mathematical model of DEA, including the Charnes–Cooper–Rhodes model (CCR), Banker–Charnes–Cooper model (BCC), Slacks-Based Measure model (SBM), and Epsilon-Based Measure model (EBM). The list of the symbols and annotations utilized in the model are described as follows:
  • n: number of decision-making units (DMUs)
  • DMUi: the i-th DMU, i = 1 , 2 , , n
  • DMU0: the DMU target
  • a 0 = ( a 01 , a 02 , , a 0 p ) : input vector of DMU0
  • b 0 = ( b 01 , b 02 , , b 0 q ) : output vector of DMU0
  • a i = ( a i 1 , a i 2 , , a i p ) : input vector of DMUi, i = 1 , 2 , , n
  • b i = ( b i 1 , b i 2 , , b i q ) : output vector of DMUi, i = 1 , 2 , , n
  • u R p × 1 : weight-input vector
  • v R q × 1 : weight-output vector

3.1.1. Charnes–Cooper–Rhodes Model (CCR)

The CCR model is the first DEA model proposed by Charnes et al. [46]. The multiplier model of the CCR input-oriented (CCR-I) is described in Equation (1):
M a x u , v ξ = v T b 0 u T a 0 Subject   to : v T b e u T a e , e = 1 , 2 , , n u 0 , v 0

3.1.2. Banker–Charnes–Cooper Model (BCC)

The BBC input-oriented (BBC-I) technique was introduced by Wen [47]. In a linear model (2), the model of BBC-I is described in Equation (2):
M a x u , v ξ = v T b 0 v 0 u T a 0 Subject   to : v T b e v 0 u T a e 1 , e = 1 , 2 , , n u 0 , v 0

3.1.3. Slacks-Based Measure Model (SBM)

The SBM model was introduced by Farrell [48]. Under the premise of continuous returns-to-scale, SBM is input-oriented (SBM-I-C). As can be seen in Equation (3), the linear model is displayed in Equation (3):
ω In = M i n α , s , s + 1 1 p i = 1 p s i a i 0 Subject   to : e = 1 n a i e α e = a i 0 s i , i = 1 , 2 , , p e = 1 n b re α e = b r 0 + s r + , r = 1 , 2 , , q α e 0 , e = 1 , 2 , , n s i 0 , i = 1 , 2 , , p s r + 0 , r = 1 , 2 , , q

3.1.4. Epsilon-Based Measure Model (EBM)

The EBM model was presented by Tone and Tsutsui [49] to remedy the shortcomings of CCR and SBM models. There are n DMUs ( j = 1 , 2 , , n ) in the EBM model, with m inputs ( i = 1 , 2 , , m ) and s outputs ( r = 1 , 2 , , s ). X = { x i j } R m × n and Y = { y r j } R s × n define input and output matrices, respectively, in which X and Y are non-negative matrices. As seen in model (4), the input-oriented model with a continuous return to scale (EBM-I-C) is displayed in Equation (4):
δ = M i n θ , λ , s θ ε x i = 1 m w i - s i - x i o Subject   to j = 1 n x i j λ j = θ x i o s i , i = 1 , . . , m j = 1 n y r j λ j y r o , r = 1 , . . , s λ j 0 , j = 1 , 2 , , n s i 0 , i = 1 , 2 , , m
where λ j is the DMU’s intense vector, the subscript “ o ” denotes that the DMU is being evaluated, s i and w i denote the amount of slack and weight in the i t h input, a parameter ε x denotes the dispersion of the inputs, and θ represents the radial properties.

3.2. Spherical Fuzzy Sets-Preliminaries

Intuitionistic and Pythagorean fuzzy membership functions consist of membership, non-membership, and hesitation parameters that can be determined using γ F ˜ S = 1 α F ˜ S β F ˜ S or γ F ˜ S = 1 1 α F ˜ S 2 β F ˜ S 2 , respectively. Neutrosophic membership functions are also defined by three parameters, truthiness, falsity, and indeterminacy, whose sum can be between 0 and 3, and the value of each is between 0 and 1 independently. In spherical fuzzy sets, while the squared sum of membership, non-membership, and hesitancy parameters can be between 0 and 1, each of them can be defined between 0 and 1 independently. The shape of the new fuzzy sets is the outcome of these two conditions. Spherical fuzzy sets [50] allow decision-makers to independently assign their hesitancies to decisions with a larger domain by using spherical fuzzy sets.
Definition 1.
Spherical fuzzy set F ˜ S of the universe X is denoted as follows.
F ˜ S = { x , ( α F ˜ S ( x ) , β F ˜ S ( x ) , γ F ˜ S ( x ) ) x X }
α F ˜ S ( x ) : X [ 0 , 1 ] , β F ˜ S ( x ) : X [ 0 , 1 ] , γ F ˜ S ( x ) : X [ 0 , 1 ]
and
0 α F ˜ S 2 ( x ) + β F ˜ S 2 ( x ) + γ F ˜ S 2 ( x ) 1
with x X , for each x , α F ˜ S ( x ) for membership, β F ˜ S ( x ) for non-membership, and γ F ˜ S ( x ) for hesitancy levels of x to F ˜ S .
Definition 2.
Six basic operations of SFS are presented as follows.
  • Union operation
F ˜ S E ˜ S = { max α F ˜ S , α E ˜ S , min β F ˜ S , β E ˜ S , min { ( 1 max α F ˜ S , α E ˜ S 2 + min β F ˜ S , β E ˜ S 2 0.5 , max γ F ˜ S , γ E ˜ S
2.
Intersection operation
F ˜ S E ˜ S = { min α F ˜ S , α E ˜ S , max β F ˜ S , β E ˜ S , max { ( 1 min α F ˜ S , α E ˜ S 2 + max β F ˜ S , β E ˜ S 2 0.5 , min γ F ˜ S , γ E ˜ S
3.
Addition operation
F ˜ S E ˜ S = { ( α F ˜ S 2 + α E ˜ S 2 α F ˜ S 2 α E ˜ S 2 ) , β F ˜ S β E ˜ S , ( 1 α E ˜ S 2 ) γ F ˜ S 2 + ( 1 α F ˜ S 2 ) γ E ˜ S 2 γ F ˜ S 2 γ E ˜ S 2 }
4.
Multiplication operation
F ˜ S E ˜ S = { α F ˜ S α E ˜ S , ( β F ˜ S 2 + β E ˜ S 2 β F ˜ S 2 β E ˜ S 2 ) , ( 1 β E ˜ S 2 ) γ F ˜ S 2 + ( 1 β F ˜ S 2 ) γ E ˜ S 2 γ F ˜ S 2 γ E ˜ S 2 }
5.
Multiplication by a scalar; σ > 0
σ . F ˜ S = { 1 ( 1 α F ˜ S 2 ) σ , β F ˜ S σ , ( 1 α F ˜ S 2 ) σ ( 1 α F ˜ S 2 γ F ˜ S 2 ) σ }
6.
Power of F S ; σ > 0
F ˜ S σ = α F ˜ S σ 1 1 β F ˜ S 2 σ , 1 β F ˜ S 2 σ 1 β F S 2 γ F ˜ S 2 σ
Definition 3.
For these SFSs F ˜ S = ( α F ˜ S , β F ˜ S , γ F ˜ S ) and E ˜ S = ( α E ˜ S , β E ˜ S , γ E ˜ S ) , the followings are valid under the condition σ , σ 1 , σ 2 > 0 .
F ˜ S E ˜ S = E ˜ S F ˜ S
σ ( F ˜ S E ˜ S ) = σ F ˜ S σ E ˜ S
σ 1 F ˜ S σ 2 F ˜ S = ( σ 1 + σ 2 ) F ˜ S
F ˜ S E ˜ S σ = F ˜ S σ E ˜ S σ
F ˜ S σ 1 F ˜ S σ 2 = F ˜ S σ 1 + σ 2
Definition 4.
Spherical weighted arithmetic mean (SWAM) concerning w = ( w 1 , w 2 , , w n ) ; w i [ 0 , 1 ] ; i = 1 n w i = 1 , SWAM is defined in Equation (19):
SWAM w F ˜ S 1 , , F ˜ S n = w 1 F ˜ S 1 + w 2 F ˜ S 2 + + w n F ˜ S n = 1 i = 1 n 1 α F ˜ S i 2 w i i = 1 n β F ˜ S i w i i = 1 n 1 α F ˜ S i 2 w i i = 1 n 1 α F ˜ S i 2 γ F ˜ S i 2 w i
Definition 5.
Spherical weighted geometric mean (SWGM) concerning w = ( w 1 , w 2 , , w n ) ; w i [ 0 , 1 ] ; i = 1 n w i = 1 , SWGM is defined in Equation (20):
S W G M w F ˜ S 1 , , F ¨ S n = F ˜ S 1 w 1 + F ˜ S 2 w 2 + + F ˜ S n w n = i = 1 n α F ˜ S i w i 1 i = 1 n 1 β F ˜ S i 2 w i , i = 1 n 1 β F ˜ S i 2 w i i = 1 n 1 β F ˜ S i 2 γ F ˜ S i 2 w i

3.3. Proposed Approach

This study provides an efficient integrated evaluation technique for evaluating and selecting the best suppliers in the steel industry. The proposed research framework is divided into three phases, as seen in Figure 1.
Phase 1: Screening potential suppliers with DEA models.
DEA models, including CCR, BCC, SBM, and EBM, which are presented in Section 3.1, are applied to identify some potential suppliers from the list of top 20 steel manufacturers in Vietnam based on financial indicators. Based on the expert interviews and literature reviews, four inputs (total asset, liability, inventory, operating expenses) and two outputs (revenue, profit) are considered in this study. The input and output factors definitions are described as follows:
  • (I1) Total Assets: The total assets owned by steel suppliers;
  • (I2) Total Liability: The total amount of debt and financial commitments owned by steel suppliers;
  • (I3) Inventory: The aggregate indicator reflects the entire existing value of all types of inventories reserved for the production and business process of the enterprise;
  • (I3) Operating expenses (I4): A cost incurred by steel suppliers through their ordinary business operations;
  • (O1) Revenue: The aggregate revenue received by steel suppliers’ owners from the sale of goods or services;
  • (O2) Profit: Profit earned by suppliers after subtracting expenditures relating to the manufacture and sale of its products.
Phase 2: Identifying criteria weights of proposed factors via SF-AHP models.
The sustainability of selected steel providers is then examined from economic, environmental, and social perspectives via the SF-AHP model, which can address uncertainties and ambiguity by expert judgment. To assure the model’s validation, the consistency of the pairwise comparison matrices is tested. The SF-AHP procedure is described below:
Step 1: A hierarchical framework is organized with the research goal in level 1 and the proposed criteria C = { C 1 , C 2 , C n } with n 2 in level 2.
Step 2: Pairwise comparison matrices are conducted in terms of linguistic scales, as shown in Table 3. Score indices (SI) are calculated by Equations (21) and (22):
S I = 100 α F ˜ S γ F ˜ S 2 β F ˜ S γ F ˜ S 2
for AMI, VHI, HI, SMI, and EI.
1 S I = 1 100 α F ˜ S γ F ˜ S 2 β F ˜ S γ F ˜ S 2
for EI, SLI, LI, VLI, and ALI.
Step 3: Consistency checks are required for all pairwise comparison matrices to ensure that the consistent ratio (CR) is less than 10% with random index (RI) in Table 4.
Step 4: Determine the weight of each factor/criterion using the SWAM operator using Equation (19).
Step 5: Crisp weights of final criteria rankings are obtained by Equation (23). Normalize the criteria weights using Equation (24) and apply the spherical fuzzy multiplication given in Equation (25).
S ( w ˜ j s ) = | 100 [ ( 3 α F ˜ S γ F ˜ S 2 ) 2 ( β F ˜ S 2 γ F ˜ S ) 2 ] |
w - j s = S ( w ˜ j s ) j = 1 n S ( w ˜ j s )
F ˜ S i j = w - j s . F ˜ S i = { ( 1 ( 1 α F ˜ S 2 ) | | w j s ) , β F ˜ S w - j s , ( 1 α F ˜ S 2 ) w j s ( 1 α F ˜ S 2 γ F ˜ S 2 ) w j s } i
Phase 3: Ranking the sustainable steel providers via the SF-WASPAS model.
The WASPAS is a well-known and effective strategy for resolving multicriteria decision-making problems. The initial concepts for the WASPAS approach [42] were only released in 2012 and are a shorthand term for a method that combines simple additive weighting (SAW) and weighted product model (WPM). In this study, the spherical fuzzy extension of WASPAS (SF-WASPAS) is adopted in the following steps:
Step 1: SAW method is operated to find the S A ˜ W i scores of each alternative based on the addition operation using Equations (26)–(29). If required, the alternatives can also be ranked in descending order of S A W i def values after a defuzzification operation.
S A ˜ W i = j = 1 m w j α i j , β i j , γ i j = α i S A W , β i S A W , γ i S A W S A ˜ W i = j = 1 m w j α i j , β i j , γ i j = α i S A W , β i S A W , γ i S A W
w j α i j , β i j , γ i j = { ( 1 ( 1 α i j 2 ) w j ) , v i j w j , ( ( 1 α i j 2 ) w j ( 1 α i j 2 γ i j 2 ) w j ) }
α i 1 , β i 1 , γ i 1 α i 2 , β i 2 , γ i 2 = { ( α i 1 2 + α i 2 2 α i 1 2 α i 2 2 ) , β i 1 β i 2 , ( ( 1 α i 2 2 ) γ i 1 2 + ( 1 α i 1 2 ) γ i 2 2 γ i 1 2 γ i 2 2 ) }
S A W i def = ( α i S A W γ i S A W ) 2 ( β i S A W γ i S A W ) 2
Step 2: WPM is performed to obtain the W P ˜ M i of each alternative given in Equations (30)–(32). If required, the alternatives can also be ranked in descending order of W P W i def values after a defuzzification operation.
W P ˜ M i = j = 1 m α i j , β i j , γ i j w j = α i W P M , β i W P M , γ i W P M
α i j , β i j , γ i j w j = { α i w j , ( 1 ( 1 β i 2 ) w j ) , ( ( 1 β i 2 ) w j ( 1 β i 2 γ i 2 ) w j ) }
α i 1 , β i 1 , γ i 1 α i 2 , β i 2 , γ i 2 = { α i 1 α i 2 , ( β i 1 2 + β i 2 2 β i 1 2 β i 2 2 ) , ( ( 1 β i 2 2 ) γ i 1 2 + ( 1 β i 1 2 ) γ i 2 2 γ i 1 2 γ i 2 2 ) }
Step 3: The spherical fuzzy values of SAW and WPM are combined using a λ threshold value denoting their relevance. Using Equations (33)–(35) to find the aggregated value of each alternative:
Q ˜ i = λ S A ˜ W i + ( 1 λ ) W P ˜ M i = α i , β i , γ i  
λ S A ˜ W i = { ( 1 ( 1 ( α i S A W ) 2 ) λ ) , ( β i S A W ) λ , ( ( 1 ( α i S A W ) 2 ) λ ( 1 ( α i S A W ) 2 ( γ i S A W ) 2 ) λ ) }  
Q ˜ i = λ S A ˜ W i + ( 1 λ ) W P ˜ M i = α i , β i , γ i  
( 1 λ ) W P ˜ M i = { ( 1 ( 1 ( α i W P M ) 2 ) ( 1 λ ) ) , ( β i W P M ) ( 1 λ ) , ( ( 1 ( α i W P M ) 2 ) ( 1 λ ) ( 1 ( α i W P M ) 2 ( γ i W P M ) 2 ) ( 1 λ ) ) }  
Step 4: SF values Q ˜ i are defuzzified and Q i crisp values are found by performing Equation (36). Then, they are ranked in descending order. If any alternatives have the same Q i values, their accuracy function values might be considered to break this tie. Accuracy function is A c c i = α i 2 + β i 2 + γ i 2 .
Q i = ( α i γ i ) 2 ( β i γ i ) 2

4. Case Study

A Case Study in Vietnam

According to Vietnam’s general statistics office, Vietnam’s gross domestic product (GDP) increased by 5.03% in the first three months of 2022 [51]. As Vietnam’s economy grows and residents’ living conditions improve, demand for steel in industries such as buildings, vehicles, and home appliances increases. The increasing steel demand growth has prompted numerous steel companies to invest in additional steel production in Vietnam. Due to the steel industry’s rapid expansion of production capacity in recent years, the supply of some types of steel in Vietnam has exceeded demand, including solid iron or steel for construction, cold-rolled steel coil products, etc. The Vietnamese government actively recruits international firms to establish businesses to compensate for considerable imports of hot-rolled steel coils and electromagnetic steel sheets.
Moreover, as Vietnam’s manufacturing and construction industries continue to expand at a rapid clip, steel demand will continue to rise [52]. Vietnam’s steel industry expanded significantly in 2021, with exports of iron and steel of all types reaching a record export result of USD 11.748 billion, up 123.4%, and imports hitting USD 11.5 billion, up 42.6% compared to 2020. Thus, Vietnam’s steel industry has a USD 248 million trade surplus. The steel industry’s outlook is favorable in 2022, when the government intends to implement new policies to assist steel companies [53]. However, steel companies in Vietnam have a small, unsustainable manufacturing scale and limited production technology. In this regard, selecting the right supplier is one of the most critical decisions that significantly impact the product’s quality. To solve the problem in its totality, three phases of MCDM models were combined to consider decision-making on sustainable supplier selection in the steel manufacturing industry.
Rather than utilizing the traditional approach for assessing productivity efficiency, assume that the inputs are factors whose values are expected to improve as their values decrease, and the outputs are those whose values improve as their values grow [54]. As a result, the dataset of 20 suppliers’ input and output variables is collected on Vietstock.vn [55], unit (VND 1 million), as shown in Table 5.
In total, 3 major criteria and 21 sub-criteria are defined in Table 6, as follows: Economic criteria (production facilities, technological and financial capability, lead time, flexibility, transportation cost, delivery, product price, quality), environmental criteria (environmental costs, environmental management systems, green research and development (R and D) and innovation, environmental competencies, waste management and pollution prevention, green manufacturing, green management, green packing and labeling, green design and purchasing), and social criteria (health and safety, customer satisfaction, stakeholders’ satisfaction, the interests and rights of employees).

5. Results and Discussions

5.1. Results

A supplier’s selection and management must be consistent with the organization’s strategy. It is critical to make an analytical judgment based on both tangible and intangible aspects when selecting the ideal provider. Thus, the manufacturer’s vision and strategy are critical in determining how the supply function will be managed and how supply decisions will be made and implemented. Selecting sustainable suppliers across the supply chain process is necessary to achieve an organization’s sustainability requirements. Suppliers contribute significantly to sustainability by adhering to green criteria consistent with social and economic expectations. Economic, environmental, and social factors were evaluated on sustainable supplier selection in the literature. The proposed methodology was implemented in this study in a steel production company in Vietnam to shorten the time required to select the appropriate supplier for the company.

5.1.1. DEA Models’ Results

The collected data will be utilized to test the CCR-I, BCC-I, SBM-I-C, and EBM-I models. This stage is used to find the potential suppliers (DMUs) with the maximum average score based on the most important financial indicators shown in Table 5. The efficiency scores obtained by DMUs operating in DEA modes are listed in Table 7.
Table 6 summarizes the efficiency scores obtained by the DMUs based on DEA analysis. As a result, a total of top 10 DMUs acquire perfect average efficiency scores in DEA analysis, which are Hoa Phat Group JSC, Hoa Sen Group JSC, Nam Kim JSC, VICASA JSC, B.C.H JSC, Cao Bang JSC, Thu Duc Steel JSC, Thong Nhat JSC, Thai Trung JSC, and Vingal JSC. These 10 DMUs are considered the most potential suppliers for the Vietnamese steel industry; hence, they are chosen for evaluation in the next phase with SF-MCDM models.

5.1.2. SF-AHP Model’s Results

After a preliminary examination, a panel of experts with extensive expertise in the Vietnamese steel industry is interviewed to assign a performance score to each alternative based on the criteria in Figure 2. Questionnaires were sent to 12 specialists with extensive experience in manufacturing, trade, and e-commerce in the steel industry. The study’s objective, the significance of the criteria, and the questionnaire structure are all thoroughly discussed. The pairwise comparison matrices’ consistency ratios (CR) are determined using the SF-AHP approach.
Based on the questionnaire results, initial pairwise comparisons were conducted in Table 8.
Next, the Crisp matrix and Normalized matrix for CR are presented in Table 9 and Table 10.
With three main criteria, the λmax and CI values are calculated as follows:
λ max = 3.132 + 3.051 + 3.014 3 = 3.066
CI = λ max n n 1 = 3.066 3 3 1 = 0.033
with RI = 1.32 and n = 7, the CR value is calculated as:
CR = CI RI = 0.033 0.58 = 0.0507
As the consistency ratio is CR = 0.057 ≤ 0.1, the result is satisfactory.
Then, the integrated spherical fuzzy comparison matrix and weights of the main criteria are presented in Table 11 and Table 12.
Global weights are derived by multiplying local weights by criteria and sub-criteria expressed in terms of spherical fuzzy numbers (SFNs) and then using score functions to derive the final global weights for each criterion in this case study of the Vietnamese steel industry. The final rankings and weights results are shown in Table 13.
In this study, three key criteria (EC, EN, and SO) were defined to determine the relative weights for selecting the optimal steel supplier in terms of sustainability. Table 13 lists the major criteria, sub-criteria, and final weighted rankings. The SF-AHP technique was used to establish the weights assigned to these criteria. The evaluation findings reveal that the most essential criterion is EC (0.446). It is reassuring that EN (0.328) is extremely close to EC and is immediately followed by SO (0.226). After solving the model, the eight EC sub-criterion are ranked as follows: QA > PR> DI > FL> TC > LT> PF > TF. According to Table 13, QA is the critical sub-criterion of EC. It has the greatest impact on the economic features of selecting a sustainable steel supplier.
Regarding the EN dimension, we elicited the weights of the environmental sub-criteria as EC > ES > EM > GI > WP > GR > GM > GL > GP. As can be seen clearly, EC assigned a weight value of 0.121, which is the top criterion among nine critical criteria, followed by ES (0.118) and EM (0.115). Meanwhile, GP has the lowest rank at 0.099, which is irrational and means that criterion GP has no significant effect in selecting a sustainable steel provider in the context of an environmental perspective.
According to results of SO dimension, the prioritized of sub-criteria in the third level are calculated as HS (0.316) > SS (0.278) > CS (0.222) > IR (0.175). The findings imply that decision -makers in Vietnam should concentrate on HS enhancing the decision-making process of sustainable supplier selection in the steel industry.
Finally, the results of final global weights indicate the importance of one criterion relative to other criteria. The global weight of the criteria is shown in Table 13. It is also surprising that QA is the most important (the rank is 1/21) among all criteria. Moreover, its local weight also has the highest importance among all sub-criteria in the context of the economical dimension, as indicated in the earlier results. Similarly, PR obtained the second rank with both local and global results. Following that, HS belonging to social aspects reached the third rank. In other words, decision-makers and policymakers also pay more attention to the social dimension while considering the sustainable supplier. Conversely, the least influential sub-criterion is GP compared to all criteria, which belongs to environmental aspects. This finding implies that GP has almost no effect in selecting steel suppliers in this case study.

5.1.3. SF-WASPAS Model’s Results

First, 12 decision -makers’ judgments of the criteria are gathered using the spherical fuzzy linguistic scales indicated in Table 3 regarding each alternative. Once the weights for the criteria are defined, the SWAM operator is used to aggregate the judgments of alternatives based on the determined criteria. Thus, after aggregating using the SWAM and multiplication operators, the outcomes of SAW and WPM and defuzzified values are shown in Table 14.
SF-WASPAS score of each alternative is calculated by aggregating S A ˜ W i and W P ˜ M i . A threshold number of λ representing the importance of these two scores is employed. A sensitivity analysis of SF-WASPAS results in terms of spherical fuzzy sets is performed with the λ threshold varying from 0 to 1. When we set λ = 0, the results will be equal to the results of WPM and when λ = 1 is set. Q ˜ i values are calculated as given in Table 15.
Additionally, Table 16 depicts the defuzzified values ( Q i ) , and rankings of SF-WASPAS in 10 scenarios.
To conduct sensitivity analysis on the proposed method’s criteria, 10 distinct scenarios were developed, and the results were compared. As seen in Table 16 and Figure 3, the rankings of alternatives for varying λ are not much changed in each of the 10 scenarios: X1 > X4 > X9 > X8 > X7 > X3 > X5 > X6 > X2 > X10. We, therefore, conclude that the first sustainable steel supplier possibilities should be chosen. Sensitivity analysis revealed that SF-WASPAS produced extremely robust judgments. Although the appraisal ratings varied, the alternative rankings stayed constant.

5.2. Discussions

In the first stage, potential suppliers for the steel sector can be screened out using DEA models based on quantifiable criteria, input factors (total assets, liabilities, inventory, and operation expenditures), and output factors (revenue, profit). The higher the output and the smaller the input, the more efficient a DMU in the DEA concept. These quantitative factors directly affect the operating efficiency of the business. Therefore, these factors were used to determine which suppliers were highly effective, and then these suppliers were further assessed by SF-MCDM models.
From the results of SF-AHP, the main dimensions of sustainable supplier selection (SSS) evaluation criteria are ranked as follows: EC/EN/SO. Furthermore, the ranking of the SS evaluation criteria in terms of their major levels is computed, as can be seen in Table 13. The global ranking of the criteria is also determined based on their respective global weights. The global weights of the criteria are determined by multiplying their relative weights by the importance weights of their respective aspects. According to Table 13, “quality” ranks first with the highest weight value (0.080), while “green design and purchasing” ranks last with the lowest weight value (0.039) throughout all evaluation criteria. The top three criteria for SSS in the supply chain are quality, product price, and health and safety.
Economic (EC) aspects take the first rank in priority over all others. Economic effects are fundamental for any company, as no supply chain can operate indefinitely without achieving economic benefits. This dimension is comprised of eight criteria. The criterion for quality (QA) has high significance. Historically, supplier selection in supply chain management was based on a provider’s capacity to meet delivery times, offer lower pricing, superior services, and meet quality criteria [56]. However, in current management, environmental and social aspects must be addressed alongside conventional economic criteria when determining supplier’s sustainability within the automotive supply chain. Following that, the product price (PR) criterion is included in the list. An organization wishes to select suppliers who offer lower product pricing for their sustainability initiatives that provide competitive benefits [57]. The next criterion is delivery (DI), demonstrating the importance of delivery and after-sales service in SS. Flexibility (FL) is critical; it is ranked fourth after DI. Transportation cost (TC) is the fifth rated factor, as clearly transportation costs play a significant impact in SSS. Lead time (LT) follows TC and indicates that the case company must manage suppliers to ensure they receive high-quality, low-cost products with short lead times [58]. Following that is production facilities (PF). Finally, the ranking process is completed by the technological and financial capability (TF) criterion.
Environmental (En) aspects take the second rank, and it is obvious that environmental aspects are critical in today’s economic climate. This dimension is concerned with environmental protection against the dangers brought about by industrialization and other technological innovations. This grouping contains nine criteria. Environmental costs (EC) take the top spot among them. It implies that sustainable supplier selection determines the greatest number of possible suppliers capable of matching the needs of the case firm at an acceptable cost [59]. Environmental competency (ES) is the second most important requirement after EC. This criterion demonstrates that the case company recognizes a critical requirement to manage their suppliers’ environmental skills to improve sustainable production. According to Büyüközkan and Çifçi [59], environmental competence criteria are distinct from those used in traditional supplier assessment systems. According to the ranking order, the environmental management system (EM) comes next. Adopting EM may aid in lowering the environmental effect of the steel industry’s supply chain. Following that comes green R and D and innovation (GI).
Green R and D and innovation (GI) will assist the case company in developing novel or customized methodologies, practices, processes, systems, and products that will help reduce environmental pollution [60]. According to their rank order, waste management and pollution prevention (WP) follows GI, which assists case company managers in initiating waste management and pollution prevention operations (recycling, reusing, and redesigning manufacturing processes) throughout manufacture. Then, according to the ranking list, comes green management (GR). Green management will assist the case organization in improving the supply chain’s environmental and economic performance [61]. The green manufacturing (GM) criterion is listed next, followed by green packing and labeling (GL). GM will assist the case company in maximizing its financial benefits through efficient material usage, waste reduction, and pollution reduction, among other things [62]. Similarly, green packaging and labeling will assist a company in developing eco-friendly marketing strategies and enhancing its competitiveness [63]. Finally, the list includes green design and purchasing (GP) criteria.
The social (SO) aspect is ranked the third position. Human beings are depleting resources and negatively impacting the environment to meet their demands. This aspect contains four criteria. The rank first criterion is health and safety (HS). The following section discusses stakeholders’ satisfaction (SS). Compensation for employment, health and safety committees at work, and involvement in the local community and non-governmental organizations are some of the social elements considered in SSS [64]. The next criterion, customer satisfaction (CS), shows how well a company’s products and services meet or exceed customer expectations. Customers play a critical role and are critical to the continued relevance of a product or service; therefore, it is in the business’s best interest to assure customer satisfaction and loyalty to encourage sustainable development throughout the supply chain. The interests and rights of employees (IR) criterion comes in the final position. The case company must prioritize employee needs to ensure long-term success.
It is not easy to establish which SSS evaluation criteria are more significant but analyzing them using the provided framework simplifies the supplier selection process. SF-AHP ranks the criteria, and SF-WASPAS provides the most suitable sustainable supplier. According to the SF-WASPAS method, the three suppliers identified as the most efficient sustainable suppliers in Vietnam’s steel sector industry are Hoa Phat Group Joint Stock Company (HPG), Hoa Sen Group (HSG), and Vicasa JSC (VCA). Hoa Phat Group, Vietnam’s largest steelmaker, generated its highest-ever after-tax profit of USD 1.5 billion in 2021, more than 1.5 times in 2020 and exceeding 92% of the year’s target [65]. Moreover, the company was issued an environmental license pursuant to ISO 140001:2015. The company employs a closed-cycle, environmentally friendly steel manufacturing process that produces no waste [66]. Moreover, HSG has opened nearly 90 Hoa Sen Home supermarkets throughout the country, implemented numerous attractive sales activities, and gradually improved the brand’s image, product, and service quality to become the No. 1 group in manufacturing and trading corrugated iron and steel in Vietnam, bringing the highest quality products to consumers at reasonable prices [67]. Vicasa is always constantly learning, researching, and improving production processes and technologies to create quality products to meet the diverse needs of every project. Vicasa is a highly effective steel producing company and sustainable development [68]. That proves that these companies have been trying to achieve sustainable development. By utilizing this proposed integrated framework, the steel supply chain decision-makers can assess supplier selection decisions to achieve business sustainability.

6. Conclusions, Limitations, and Future Work

6.1. Conclusions

This study illustrates a novel integrating DEA and spherical fuzzy MCDM approach, which has been proved to be successful in handling imprecision in the decision-making process in the context of sustainable steel supplier selection. The newly developed three-dimensional extension of fuzzy sets, as known spherical fuzzy, are incorporated with AHP and WASPAS techniques. In this study, there are 3 levels, economics, environmental, and social, and 21 sub-criteria are considered to determine which sustainable suppliers are best suited for the Vietnam steel industry. The results found that ranks obtained from our proposed framework are consistent with some previous researchers. Steelmakers who take proactive measures to improve their operations’ sustainability can stay ahead of evolving carbon laws and utilize environmental, social, and governance measurements to achieve a competitive edge [69]. Additionally, the vagueness and uncertainty of decision-makers are taken into consideration, and the methodology also describes the procedure to be followed in the case of multiple experts, which previous researchers did not cover. Finally, a sensitivity analysis was performed to check the robustness of the proposed method, and it was found that the best alternative remains the same for variations in the set of weights.

6.2. Limitations

While the proposed approach is believed to add operational value to the sustainable supplier section, this study has significant limitations. The psychological behaviors of the decision-maker, which are critical factors, were not taken into account in the proposed approach. The evaluation process for this study is mostly reliant on experts’ opinions. Hence, the findings are based on individual opinions, knowledge, and judgment. Second, the authors ignored potential interactions and relationships between the criteria. It is recommended that future study should consider these elements to develop a more successful sustainable supplier selection process. Furthermore, additional levels of the steel industry SC can be investigated for future research. Another notable limitation is that this study checked the robustness of the proposed model based on sensitive analysis by changing the threshold number of λ, representing the importance of S A ˜ W i and W P ˜ M i and there is no comparison between previous methods; therefore, future research should conduct a comparative analysis with the established methods from the literature to have more robustness.

6.3. Future Work

The proposed methodology can be adapted to various SCs and industries in future research. Other MCDM approaches based on spherical fuzzy such as Decision-Making Trial and Evaluation Laboratory (SF-DEMATEL), Analytic Network Process (SF-ANP), and Multi-Objective Optimization on the basis of a Ratio Analysis plus the full Multiplicative form (SF-MULTIMOORA) can be used for supplier selection, and the new results can be compared with those from this study. Furthermore, other groups of sustainability criteria from the economic, environmental, and social perspectives, such as cost, quality, value-added, etc., can be evaluated for the supplier selection issues. Finally, because this research examines the steel industry at a macro level, a specific steel business can be used as a case study at the manufacturing level for future research.

Author Contributions

Conceptualization, T.-L.N. and P.-H.N.; Data curation, H.-A.P., T.-H.T. and H.-C.L.; Formal analysis, T.-L.N. and H.-A.P.; Funding acquisition, P.-H.N.; Investigation, T.-G.N., D.-T.N. and H.-T.P.; Methodology, T.-L.N. and P.-H.N.; Project administration, P.-H.N. All authors have read and agreed to the published version of the manuscript.

Funding

This study was funded by FPT University, Vietnam, under Decision No. 304/QD-DH FPT, issued on 12 April 2022.

Institutional Review Board Statement

Not applicable.

Informed Consent Statement

Not applicable.

Data Availability Statement

The datasets presented in this study are available on request from the corresponding author.

Acknowledgments

The authors would like to express their heartfelt appreciation and gratitude to Vietnamese experts and policymakers for their contributions to this study. This study presents a portion of Thi-Ly Nguyen’s PhD thesis, which was completed under the supervision of Chia-Nan Wang at the National Kaoshiung University of Science and Technology in Taiwan and in line with the guidance of Phi-Hung Nguyen, FPT University, Vietnam.

Conflicts of Interest

The authors declare no conflict of interest.

References

  1. Research Report on the Vietnam Steel Industry. Available online: https://www.businesswire.com/news/home/20180606005579/en/Research-Report-on-the-Vietnam-Steel-Industry-2018-2022---CAGR-of-the-Production-Volume-of-Crude-Steel-is-Projected-to-Exceed-20---ResearchAndMarkets.com (accessed on 30 December 2021).
  2. Wu, C.; Barnes, D. A Literature Review of Decision-Making Models and Approaches for Partner Selection in Agile Supply Chains. J. Purch. Supply Manag. 2011, 17, 256–274. [Google Scholar] [CrossRef]
  3. Verghese, K.; Lewis, H. Environmental Innovation in Industrial Packaging: A Supply Chain Approach. Int. J. Prod. Res. 2007, 45, 4381–4401. [Google Scholar] [CrossRef]
  4. Hsu, C.W.; Kuo, T.C.; Chen, S.H.; Hu, A.H. Using DEMATEL to Develop a Carbon Management Model of Supplier Selection in Green Supply Chain Management. J. Clean. Prod. 2013, 56, 164–172. [Google Scholar] [CrossRef]
  5. Gaziulusoy, A.I. A Critical Review of Approaches Available for Design and Innovation Teams through the Perspective of Sustainability Science and System Innovation Theories. J. Clean. Prod. 2015, 107, 366–377. [Google Scholar] [CrossRef]
  6. Guest, R. The Economics of Sustainability in the Context of Climate Change: An Overview. J. World Bus. 2010, 45, 326–335. [Google Scholar] [CrossRef]
  7. Dao, V.; Langella, I.; Carbo, J. From Green to Sustainability: Information Technology and an Integrated Sustainability Framework. J. Strateg. Inf. Syst. 2011, 20, 63–79. [Google Scholar] [CrossRef]
  8. Amindoust, A.; Ahmed, S.; Saghafinia, A.; Bahreininejad, A. Sustainable Supplier Selection: A Ranking Model Based on Fuzzy Inference System. Appl. Soft Comput. 2012, 12, 1668–1677. [Google Scholar] [CrossRef]
  9. Shemshadi, A.; Shirazi, H.; Toreihi, M.; Tarokh, M.J. A Fuzzy VIKOR Method for Supplier Selection Based on Entropy Measure for Objective Weighting. Expert Syst. Appl. 2011, 38, 12160–12167. [Google Scholar] [CrossRef]
  10. Mousavi-Nasab, S.H.; Sotoudeh-Anvari, A. A Comprehensive MCDM-Based Approach Using TOPSIS, COPRAS and DEA as an Auxiliary Tool for Material Selection Problems. Mater. Des. 2017, 121, 237–253. [Google Scholar] [CrossRef]
  11. Garg, H.; Kumar, K. A Novel Exponential Distance and Its Based TOPSIS Method for Interval-Valued Intuitionistic Fuzzy Sets Using Connection Number of SPA Theory. Artif. Intell. Rev. 2020, 53, 595–624. [Google Scholar] [CrossRef]
  12. Ghorabaee, M.K.; Zavadskas, E.K.; Amiri, M.; Esmaeili, A. Multi-Criteria Evaluation of Green Suppliers Using an Extended WASPAS Method with Interval Type-2 Fuzzy Sets. J. Clean. Prod. 2016, 137, 213–229. [Google Scholar] [CrossRef]
  13. Nguyen, P.H.; Nguyen, T.L.; Nguyen, T.G.; Nguyen, D.T.; Tran, T.H. A Cross-Country European Efficiency Measurement of Maritime Transport: A Data Envelopment Analysis Approach. Axioms 2022, 11, 206. [Google Scholar] [CrossRef]
  14. Wang, C.N.; Nguyen, P.H.; Nguyen, T.L.; Nguyen, T.G.; Nguyen, D.T.; Tran, T.H.; Le, H.C.; Phung, H.T. A Two-Stage DEA Approach to Measure Operational Efficiency in Vietnam’s Port Industry. Mathematics 2022, 10, 1385. [Google Scholar] [CrossRef]
  15. Doyle, J.; Green, R. Data Envelopment Analysis and Multiple Criteria Decision Making. Omega 1993, 21, 713–715. [Google Scholar] [CrossRef]
  16. Stević, Ž.; Miškić, S.; Vojinović, D.; Huskanović, E.; Stanković, M.; Pamučar, D. Development of a Model for Evaluating the Efficiency of Transport Companies: PCA-DEA-MCDM Model. Axioms 2022, 11, 140. [Google Scholar] [CrossRef]
  17. Gündoğdu, F.K.; Kahraman, C. Spherical Fuzzy Sets and Decision Making Applications. In Proceedings of the International Conference on Intelligent and Fuzzy Systems, Istanbul, Turkey, 23–25 July 2019; Springer: Berlin/Heidelberg, Germany, 2019; pp. 979–987. [Google Scholar]
  18. Saaty, T. The Analytic Hierarchy Process (AHP) for Decision Making. In Proceedings of the Kobe, Kobe, Japan, 21–22 November 1980; pp. 1–69. [Google Scholar]
  19. Nguyen, P.-H. Two-Stage PLS-SEM and Fuzzy AHP Approach to Investigate Vietnamese SMEs’ Export Competitiveness. Comput. Mater. Contin. 2022, 72, 4107–4123. [Google Scholar] [CrossRef]
  20. Zadeh, L.A. Fuzzy sets. Inf. Control 1965, 8, 338–353. [Google Scholar] [CrossRef] [Green Version]
  21. Nguyen, P.-H.; Tsai, J.-F.; Lin, M.-H.; Hu, Y.-C. A Hybrid Model with Spherical Fuzzy-AHP, PLS-SEM and ANN to Predict Vaccination Intention against COVID-19. Mathematics 2021, 9, 3075. [Google Scholar] [CrossRef]
  22. Gündoğdu, F.K.; Kahraman, C. Spherical Fuzzy Analytic Hierarchy Process (AHP) and Its Application to Industrial Robot Selection. In Proceedings of the International Conference on Intelligent and Fuzzy Systems, Istanbul, Turkey, 23–25 July 2019; Springer: Berlin/Heidelberg, Germany, 2019; pp. 988–996. [Google Scholar]
  23. Camci, A.; Çimen, Ö.; Gül, S. Selection of Contract Type in Construction Projects Using Spherical AHP Method. In Proceedings of the International Online Conference on Intelligent Decision Science, Istanbul, Turkey, 7–8 August 2020; Springer: Berlin/Heidelberg, Germany, 2020; pp. 531–547. [Google Scholar]
  24. Zavadskas, E.K.; Turskis, Z.; Antucheviciene, J.; Zakarevicius, A. Optimization of Weighted Aggregated Sum Product Assessment. Elektron. Ir Elektrotechnika 2012, 122, 3–6. [Google Scholar] [CrossRef]
  25. Gundogdu, F.K.; Kahraman, C. Extension of WASPAS with Spherical Fuzzy Sets. Informatica 2019, 30, 269–292. [Google Scholar] [CrossRef] [Green Version]
  26. Ghoushchi, S.J.; Bonab, S.R.; Ghiaci, A.M.; Haseli, G.; Tomaskova, H.; Hajiaghaei-Keshteli, M. Landfill Site Selection for Medical Waste Using an Integrated SWARA-WASPAS Framework Based on Spherical Fuzzy Set. Sustainability 2021, 13, 13950. [Google Scholar] [CrossRef]
  27. Ayyildiz, E.; Gumus, A.T. A Novel Spherical Fuzzy AHP-Integrated Spherical WASPAS Methodology for Petrol Station Location Selection Problem: A Real Case Study for İstanbul. Environ. Sci. Pollut. Res. 2020, 27, 36109–36120. [Google Scholar] [CrossRef]
  28. Nguyen, P.H.; Tsai, J.F.; Dang, T.T.; Lin, M.H.; Pham, H.A.; Nguyen, K.A. A Hybrid Spherical Fuzzy MCDM Approach to Prioritize Governmental Intervention Strategies against the COVID-19 Pandemic: A Case Study from Vietnam. Mathematics 2021, 9, 2626. [Google Scholar] [CrossRef]
  29. Nguyen, P.-H.; Dang, T.-T.; Nguyen, K.-A.; Pham, H.-A. Spherical Fuzzy WASPAS-Based Entropy Objective Weighting for International Payment Method Selection. Comput. Mater. Contin. 2022, 72, 2055–2075. [Google Scholar] [CrossRef]
  30. Nguyen, P.-H.; Lin, H.-H.; Pham, H.-A.; Thi, H.L.; Do, Q.M.; Nguyen, D.H. Material Sourcing Characteristics and Firm Performance: An Empirical Study in Vietnam. Mathematics 2022, 10, 1691. [Google Scholar] [CrossRef]
  31. Kumar, M. An Innovative Supplier and Imitative Buyer in the Case of Product Life Cycle. Adv. Ind. Eng. Manag. 2013, 2, 16–34. [Google Scholar]
  32. Amiran, H.; Radfar, I.; Zolfani, S.H. A Fuzzy MCDM Approach for Evaluating Steel Industry Performance Based on Balanced Scorecard: A Case in Iran. In Proceedings of the 2011 2nd IEEE International Conference on Emergency Management and Management Sciences, Beijing, China, 8–10 August 2011; pp. 574–577. [Google Scholar]
  33. Jafarnejad, A.; Ansari, M.; Youshanlouei, H.R.; Mood, M. A Hybrid MCDM Approach for Solving the ERP System Selection Problem with Application to Steel Industry. Int. J. Enterp. Inf. Syst. 2012, 8, 54–73. [Google Scholar] [CrossRef]
  34. Mohaghar, A.; Zarchi, E.S. Identification and Ranking of Projects Funded by the Steel Industry by Using of Multi Criteria Decision Making (MCDM). Glob. J. Manag. Stud. Res. 2015, 2, 38–47. [Google Scholar]
  35. Quader, M.A.; Ahmed, S. A Hybrid Fuzzy MCDM Approach to Identify Critical Factors and CO2 Capture Technology for Sustainable Iron and Steel Manufacturing. Arab. J. Sci. Eng. 2016, 41, 4411–4430. [Google Scholar] [CrossRef]
  36. Azimifard, A.; Moosavirad, S.H.; Ariafar, S. Selecting Sustainable Supplier Countries for Iran’s Steel Industry at Three Levels by Using AHP and TOPSIS Methods. Resour. Policy 2018, 57, 30–44. [Google Scholar] [CrossRef]
  37. Choi, Y.; Yu, Y.; Lee, H.S. A Study on the Sustainable Performance of the Steel Industry in Korea Based on SBM-DEA. Sustainability 2018, 10, 173. [Google Scholar] [CrossRef] [Green Version]
  38. Javad, M.O.M.; Darvishi, M.; Javad, A.O.M. Green Supplier Selection for the Steel Industry Using BWM and Fuzzy TOPSIS: A Case Study of Khouzestan Steel Company. Sustain. Futur. 2020, 2, 100012. [Google Scholar] [CrossRef]
  39. Jain, N.; Singh, A.R. Sustainable Supplier Selection Criteria Classification for Indian Iron and Steel Industry: A Fuzzy Modified Kano Model Approach. Int. J. Sustain. Eng. 2020, 13, 17–32. [Google Scholar] [CrossRef]
  40. Chakraborty, S.; Chattopadhyay, R.; Chakraborty, S. An Integrated D-MARCOS Method for Supplier Selection in an Iron and Steel Industry. Decis. Mak. Appl. Manag. Eng. 2020, 3, 49–69. [Google Scholar]
  41. Ghamari, R.; Mahdavi-Mazdeh, M.; Ghannadpour, S.F. Resilient and Sustainable Supplier Selection via a New Framework: A Case Study from the Steel Industry. Environ. Dev. Sustain. 2021, 1–39. [Google Scholar] [CrossRef]
  42. Gandhi, S.; Mangla, S.K.; Kumar, P.; Kumar, D. A Combined Approach Using AHP and DEMATEL for Evaluating Success Factors in Implementation of Green Supply Chain Management in Indian Manufacturing Industries. Int. J. Logist. Res. Appl. 2016, 19, 537–561. [Google Scholar] [CrossRef]
  43. Akman, G. Evaluating Suppliers to Include Green Supplier Development Programs via Fuzzy C-Means and VIKOR Methods. Comput. Ind. Eng. 2015, 86, 69–82. [Google Scholar] [CrossRef]
  44. Mahdiloo, M.; Saen, R.F.; Lee, K.-H. Technical, Environmental and Eco-Efficiency Measurement for Supplier Selection: An Extension and Application of Data Envelopment Analysis. Int. J. Prod. Econ. 2015, 168, 279–289. [Google Scholar] [CrossRef]
  45. Seuring, S.; Müller, M. From a Literature Review to a Conceptual Framework for Sustainable Supply Chain Management. J. Clean. Prod. 2008, 16, 1699–1710. [Google Scholar] [CrossRef]
  46. Charnes, A.; Cooper, W.W.; Rhodes, E. Measuring the Efficiency of Decision Making Units. Eur. J. Oper. Res. 1978, 2, 429–444. [Google Scholar] [CrossRef]
  47. Wen, M. Uncertain Data Envelopment Analysis; Springer: Berlin/Heidelberg, Germany, 2015. [Google Scholar]
  48. Farrell, M.J. The Measurement of Productive Efficiency. J. R. Stat. Soc. Ser. A 1957, 120, 253–281. [Google Scholar] [CrossRef]
  49. Tone, K.; Tsutsui, M. An Epsilon-Based Measure of Efficiency in DEA—A Third Pole of Technical Efficiency. Eur. J. Oper. Res. 2010, 207, 1554–1563. [Google Scholar] [CrossRef]
  50. Gündoğdu, F.K.; Kahraman, C. A Novel Spherical Fuzzy Analytic Hierarchy Process and Its Renewable Energy Application. Soft Comput. 2020, 24, 4607–4621. [Google Scholar] [CrossRef]
  51. Vietnam GDP Grows 5.03% in First Three Months of 2022. Available online: https://asia.nikkei.com/Economy/Vietnam-GDP-grows-5.03-in-first-three-months-of-2022 (accessed on 18 April 2022).
  52. Vietnam Steel Industry Report 2020–2024. Available online: https://www.researchandmarkets.com/reports/4911561/vietnam-steel-industry-report-2020-2024 (accessed on 18 April 2022).
  53. Vietnam’s Steel Industry Outlook 2022. Available online: https://vietnamcredit.com.vn/news/vietnams-steel-industry-outlook-2022_14639 (accessed on 19 April 2022).
  54. Sarkis, J. A Methodological Framework for Evaluating Environmentally Conscious Manufacturing Programs. Comput. Ind. Eng. 1999, 36, 793–810. [Google Scholar] [CrossRef]
  55. Vietstock.Vn. Available online: https://vietstock.vn/ (accessed on 18 April 2022).
  56. Hsu, C.-W.; Hu, A.H. Applying Hazardous Substance Management to Supplier Selection Using Analytic Network Process. J. Clean. Prod. 2009, 17, 255–264. [Google Scholar] [CrossRef]
  57. Kannan, D.; de Sousa Jabbour, A.B.L.; Jabbour, C.J.C. Selecting Green Suppliers Based on GSCM Practices: Using Fuzzy TOPSIS Applied to a Brazilian Electronics Company. Eur. J. Oper. Res. 2014, 233, 432–447. [Google Scholar] [CrossRef]
  58. Falatoonitoosi, E.; Ahmed, S.; Sorooshian, S. A Multicriteria Framework to Evaluate Supplier’s Greenness. In Proceedings of the Abstract and Applied Analysis; Hindawi: London, UK, 2014; Volume 2014. [Google Scholar]
  59. Büyüközkan, G.; Çifçi, G. A Novel Fuzzy Multi-Criteria Decision Framework for Sustainable Supplier Selection with Incomplete Information. Comput. Ind. 2011, 62, 164–174. [Google Scholar] [CrossRef]
  60. De Marchi, V. Environmental Innovation and R&D Cooperation: Empirical Evidence from Spanish Manufacturing Firms. Res. Policy 2012, 41, 614–623. [Google Scholar]
  61. Zhu, Q.; Sarkis, J.; Lai, K. Examining the Effects of Green Supply Chain Management Practices and Their Mediations on Performance Improvements. Int. J. Prod. Res. 2012, 50, 1377–1394. [Google Scholar] [CrossRef]
  62. Govindan, K.; Diabat, A.; Shankar, K.M. Analyzing the Drivers of Green Manufacturing with Fuzzy Approach. J. Clean. Prod. 2015, 96, 182–193. [Google Scholar] [CrossRef]
  63. Mangla, S.; Madaan, J.; Chan, F.T.S. Analysis of Flexible Decision Strategies for Sustainability-Focused Green Product Recovery System. Int. J. Prod. Res. 2013, 51, 3428–3442. [Google Scholar] [CrossRef]
  64. Govindan, K.; Khodaverdi, R.; Jafarian, A. A Fuzzy Multi Criteria Approach for Measuring Sustainability Performance of a Supplier Based on Triple Bottom Line Approach. J. Clean. Prod. 2013, 47, 345–354. [Google Scholar] [CrossRef]
  65. Hoa Phat Posts Record High Profit in 2021. Available online: https://en.vietnamplus.vn/hoa-phat-posts-record-high-profit-in-2021/221385.vnp (accessed on 20 February 2022).
  66. Hoa Phat Group Ensures Environmental Protection. Available online: https://www.hoaphat.com.vn/news/hoa-phat-group-ensures-environmental-protection.html (accessed on 21 February 2022).
  67. HSG: Sustainable Growth in the Fiscal Year 2020–2021. Available online: https://blogtuan.info/2022/03/21/hsg-sustainable-growth-in-the-fiscal-year-2020-2021/ (accessed on 21 February 2022).
  68. Vnsteel-Vicasa. Available online: https://vicasasteel.com/gioi-thieu/tam-nhin-su-menh (accessed on 21 February 2022).
  69. Steel is one of the World’s Most Sustainable Materials, but Decarbonizing Remains a Challenge. Available online: https://www.ey.com/en_id/mining-metals/five-actions-to-improve-the-sustainability-of-steel (accessed on 20 February 2022).
Figure 1. Proposed research framework.
Mathematics 10 01897 g001
Figure 2. Proposed hierarchical framework.
Mathematics 10 01897 g002
Figure 3. Sensitivity analysis of SF-WASPAS.
Mathematics 10 01897 g003
Table 1. A summary of related works.
No.Authors (Year)MethodsSample/Region
1Amiran et al. (2011)Fuzzy AHP, Fuzzy TOPSISSteel industry in Iran
2Jafarnejad et al. (2012)DEMATEL, Fuzzy AHPSteel industry in Iran
3Mohaghar and Zarchi (2015)AHP, DEMATELSteel industry in Iran
4Quader and Ahmed (2016)Delphi, DEMATEL, Fuzzy AHPIron and steel Industry in Malaysia and India
5Azimifard et al. (2018)AHP, TOPSISSteel industry in Iran
6Choi et al. (2018)SBM-DEASteel industry in Korea
7Javad et al. (2020)BWM, FTOPSISSteel industry in Iran
8Jain and Singh (2020)Fuzzy KanoIron and steel industry in India
9Chakraborty et al. (2020)D numbers, MARCOSIron and steel industry in India
10Ghamari et al. (2021)ISM, BWM, TOPSISSteel industry in Iran
Table 2. A list of factors used in previous research.
Studies [References]Product PriceQualityFlexibilityTechnological & Financial CapabilityProduction FacilitiesDeliveryLead Time Transportation CostEnvironmental Management SystemsGreen Design and Purchasing Green ManufacturingGreen ManagementGreen Packing and Labeling Waste Management & Pollution PreventionEnvironmental CostsEnvironmental CompetenciesGreen R & D and InnovationHealth and SafetyCustomer SatisfactionStakeholders’ SatisfactionThe Interests & Rights of Employees
1Mafakheri et al. (2011)γ γ γ γ γγ
2Punniyamoorthy et al. (2011)γγ γγγ γ
3Govindan et al. (2013)γγ γ γγγγγ γ γ γ
4Abdollahi et al. (2015)γγ γ γ
5Memon et al. (2015) γ γ γ
6Hashemi et al. (2015)γγγγ γ γγ γ γ
7Lee and Min (2015) γ γ
8Dweiri et al. (2016) γ γγγ
9Mavi et al. (2017)γγγγ γγγ γ γγ
10Awasthi et al. (2018)γ γγ γ γ
11Pishchulov et al. (2019) γ γγ γγγ
12Taherdoost and Brard (2019) γ γ γ
13Rashidi and Cullinane (2019)γ γγ γγ γ
14Ecer and Pamucar (2020)γγ γ γ γ γγγ γγγγ
15Khan and Ali (2021)γ γ γ γ γγγ
Noted: γ: denotes studies that use the above factors.
Table 3. SF-AHP linguistic terms.
Scales ( α , β , γ ) Score Index (SI)
Absolutely More Importance (AMI)(0.9, 0.1, 0.0)9
Very High Importance (VHI)(0.8, 0.2, 0.1)7
High Importance (HI)(0.7, 0.3, 0.2)5
Slightly More Importance (SMI)(0.6, 0.4, 0.3)3
Equally Importance (EI)(0.5, 0.4, 0.4)1
Slightly Low Importance (SLI)(0.4, 0.6, 0.3)1/3
Low Importance (LI)(0.3, 0.7, 0.2)1/5
Very Low Importance (VLI)(0.2, 0.8, 0.1)1/7
Absolutely Low Importance (ALI)(0.1, 0.9, 0.0)1/9
Table 4. RI values.
Table 4. RI values.
n123456789101112131415
RI000.580.91.121.241.321.411.451.491.511.481.561.571.59
Where, n is the number of criteria, RI signifies the random index.
Table 5. The dataset of 20 suppliers for the Vietnamese steel industry.
DMUsTotal Assets (I1)Total Liabilities
(I2)
Inventory
(I3)
Operating
Expenses (I4)
Revenue
(O1)
Profit
(O2)
Hoa Phat Group JSC178,235,97487,455,79742,134,4941,324,262150,865,36041,108,410
Dai Thien Loc Corp1,880,973820,0231,009,84920,1591,380,710162,057
Hoa Sen Group26,618,03015,786,23612,349,096425,81648,987,3348,873,398
Thanh Thai Group JSC267,673194,21052,1265561349,64317,283
Nam Kim JSC15,382,6439,659,4398,281,324122,72128,206,1504,269,857
VICASA JSC578,976338,496353,55430,1512,623,09697,373
Vietnam Germany JSC2,080,3481,247,316621,51932,7156,694,121263,130
Viet Nam Steel Corp27,489,14516,528,5836,918,5701,145,34340,888,9432,183,773
Pomina Steel Corp12,684,9008,967,8543,868,854143,69014,071,279836,139
B.C.H JSC599,797387,431164,17334092,057,46512,917
Cao Bang JSC1,832,5121,395,071444,68034,8592,892,447451,375
Phuong Anh JSC695,360334,634299,04057081,123,697104,258
Thu Duc Steel JSC567,506270,070423,31436,1822,336,352103,035
Thai Nguyen JSC10,328,1068,278,9231,434,071445,86712,860,228788,198
Thong Nhat JSC379,491340,55171,81599651,552,73748,037
Thai Trung JSC1,354,3111,065,23875,79613,7326,066,99975,186
Tung Kuang JSC1,294,628747,301499,03240,759892,684174,076
VN-Italy Steel JSC2,998,2322,602,0531,302,76954,1305,860,37634,156
Binh Tay JSC37,103867814,964458695,6198127
Vingal JSC147,65725,00374,73122,172341,32251,472
Table 6. Descriptions of criteria and sub-criteria.
CriteriaSub-CriteriaDefinition
Economic (EC)Production facilities (PF) It is concerned with a product’s manufacturing facilities and capacity requirements.
Technological & financial capability (TF)It is concerned with the technological and financial elements of the supplier domain.
Lead time (LT)The capability of providing items with a short lead time.
Flexibility (FL)Suppliers should be adaptable enough to market fluctuations.
Transportation cost (TC)The propensity for shipping products at the lowest possible transportation cost (shipping point or destination point).
Delivery (DI)It ensures that the product is delivered and serviced correctly.
Product price (PR)Capacity to provide goods at a reasonable price.
Quality (QA)Installation of ISO quality system, quality award, product performance, warranty and claim policy, and rate of repair and return.
Environmental (EN)Environmental costs (EC)The raw material and finished product should incur the minimum possible costs and cause the least amount of environmental damage.
Environmental management systems (EM)The structure, strategy, and implementation of suppliers’ environmental protection policies.
Green R and D and Innovation (GI)Suppliers’ capacity to invest in research and development activities that result in the creation of new, cleaner technologies, processes, practices, and techniques.
Environmental competencies (ES)The capacity of the supplier to use environmentally friendly materials, deploy clean technologies, and mitigate the impacts of pollution.
Waste management and pollution prevention (WP)The raw material is chosen in such a way that waste and pollution are minimized during the manufacturing process.
Green manufacturing (GM)While manufacturing the goods, raw materials, and energy consumption should be kept to a minimum.
Green management (GR)The product’s capacity to optimize environmental performance and management.
Green packing and labeling (GL)The capacity of suppliers to consider environmental factors in packaging and labeling.
Green design and purchasing (GP)Integrating environmentally friendly practices in the design and purchase stages.
Social (SO)Health and safety (HS)It is concerned with the safety, health, and wellbeing of those who work at the supplier’s workplace.
Customer satisfaction (CS)A measurement that indicates how satisfied customers are with a business’s products, services, and capabilities.
Stakeholders’ satisfaction (SS)An assessment of stakeholder perceptions of a supplier’s program, project, or initiative.
The interests and rights of employees (IR)It is concerned with employee-related elements and requirements for long-term sustainable effectiveness.
Table 7. Efficiency scores of suppliers in the DEA models.
DMUBCCCCRSBMEBMAverage
Hoa Phat Group JSC11111
Dai Thien Loc Corp0.480310.445860.352290.4109190.422345
Hoa Sen Group JSC11111
Thanh Thai Group JSC0.843860.398180.356250.3869850.496319
Nam Kim JSC11111
VICASA JSC11111
Vietnam Germany JSC10.997910.890480.9572340.961406
Viet Nam Steel Corp10.43910.381230.4386460.564744
Pomina Steel Corp0.616590.355240.342910.35210.41671
B.C.H JSC11111
Cao Bang JSC11111
Phuong Anh JSC10.868360.729170.81590.853358
Thu Duc JSC11111
Thai Nguyen JSC10.543150.388860.488320.605083
Thong Nhat JSC1110.963650.990913
Thai Trung JSC11111
Tung Kuang JSC0.451410.446860.377040.4265880.425475
VN-Italy Steel JSC0.436190.435390.283250.3782310.383265
Binh Tay JSC10110.75
Vingal JSC11111
Table 8. Initial Comparison Matrices’ main criteria.
Left Criteria Are Important Right Criteria Are Important Experts
975311/31/51/71/9
CriteriaAMIVHIHISMIEISLILIVLIALICriteria
EC 2541 EN12
EC4431 SO12
EN 2361 SO12
Table 9. Crisp matrix for CR.
CriteriaECENSO
EC1.0003.9016.521
EN0.2561.0003.582
SO0.1530.2791.000
Table 10. Normalized matrix for CR.
CriteriaECENSOMEANWSVCV
EC0.7090.7530.5870.6832.1403.132
EN0.1820.1930.3230.2330.7103.051
SO0.1090.0540.0900.0840.2543.014
Table 11. Integrated spherical fuzzy matrix.
CriteriaECENSO
EC0.5000.4000.4000.6610.3350.2550.7860.2310.150
EN0.3160.6810.2360.5000.4000.4000.6440.3520.271
SO0.1860.8170.1180.3320.6660.2520.5000.4000.400
Table 12. Weights of main criteria.
Spherical Fuzzy Weights
( W ˜ s )
Score
S ( W ˜ s )
Crisp Weights
( W ˜ s )
Rank
EC0.6750.3140.26816.8330.4461
EN0.5160.4580.31512.8740.3282
SO0.3690.6010.2999.2280.2263
Consistency Ratio (CR) = 0.057 < 0.1
Table 13. Final rankings and weights results.
CriteriaSF-WcM-wRankSub-CriteriaSF-WsS-wRankSF-WgG-wRank
EC(0.675, 0.314, 0.268)0.4461PF(0.406, 0.577, 0.295)0.0977(0.274, 0.631, 0.347)0.04810
TF(0.395, 0.583, 0.306)0.0948(0.266, 0.636, 0.354)0.04711
LT(0.422, 0.555, 0.301)0.1016(0.285, 0.614, 0.353)0.0509
TC (0.439, 0.536, 0.315)0.1055(0.296, 0.598, 0.365)0.0528
FL (0.514, 0.471, 0.304)0.1264(0.347, 0.546, 0.364)0.0616
DI (0.555, 0.438, 0.284)0.1383(0.375, 0.521, 0.354)0.0665
PR (0.649, 0.349, 0.250)0.1652(0.438, 0.456, 0.339)0.0772
QA(0.676, 0.320, 0.245)0.1731(0.456, 0.437, 0.338)0.0801
EN(0.516, 0.458, 0.315)0.3282EC (0.516, 0.457, 0.324)0.1211(0.266, 0.612, 0.389)0.04612
EM(0.493, 0.484, 0.320)0.1153(0.254, 0.628, 0.383)0.04515
GI (0.489, 0.485, 0.322)0.1144(0.253, 0.629, 0.384)0.04416
ES (0.502, 0.472, 0.320)0.1182(0.259, 0.621, 0.385)0.04514
WP(0.492, 0.472, 0.336)0.1145(0.254, 0.621, 0.394)0.04417
GM(0.454, 0.514, 0.330)0.1057(0.235, 0.647, 0.385)0.04119
GR(0.474, 0.494, 0.328)0.1106(0.245, 0.634, 0.387)0.04318
GL(0.452, 0.511, 0.335)0.1048(0.233, 0.645, 0.389)0.04120
GP(0.432, 0.529, 0.333)0.0999(0.223, 0.656, 0.385)0.03921
SO(0.369, 0.601, 0.299)0.2263HS(0.626, 0.350, 0.298)0.3161(0.231, 0.663, 0.357)0.0413
CS(0.458, 0.510, 0.322)0.2223(0.169, 0.726, 0.351)0.0307
SS(0.576, 0.400, 0.307)0.2872(0.212, 0.681, 0.356)0.0374
IR(0.367, 0.605, 0.292)0.1754(0.136, 0.772, 0.322)0.02313
Table 14. Results of SAW and WPM.
AlternativesSAWSAWdefWPMWPMdef
α β γ α β γ
X10.9220.0330.2080.4790.2880.5710.378−0.029
X20.8910.0520.2650.3470.2260.6670.397−0.043
X30.9120.0370.2450.4010.2750.5880.399−0.020
X40.9200.0330.2230.4480.3000.5700.382−0.029
X50.8990.0460.2500.3800.2570.6080.392−0.028
X60.9000.0450.2520.3780.2640.6100.394−0.030
X70.9020.0440.2390.4010.2560.6210.378−0.044
X80.9060.0430.2360.4130.2690.6130.376−0.044
X90.9200.0330.2290.4380.2920.5750.405−0.016
X100.8950.0470.2680.3440.2310.6440.421−0.014
Table 15. Results of SF- WASPAS in terms of SFNs.
λX1X2X3X4X5X6X7X8X9X10
0(0.288, 0.571, 0.378)(0.226, 0.667, 0.397)(0.275, 0.588, 0.399)(0.300, 0.570, 0.382)(0.257, 0.608, 0.392)(0.264, 0.610, 0.394)(0.256, 0.621, 0.378)(0.269, 0.613, 0.376)(0.292, 0.575, 0.405)(0.231, 0.644, 0.421)
0.1(0.485, 0.430, 0.361)(0.431, 0.516, 0.389)(0.469, 0.446, 0.388)(0.488, 0.429, 0.369)(0.45, 0.469, 0.381)(0.455, 0.470, 0.383)(0.453, 0.476, 0.368)(0.462, 0.470, 0.366)(0.484, 0.433, 0.388)(0.436, 0.496, 0.409)
0.2(0.601, 0.324, 0.343)(0.549, 0.400, 0.378)(0.585, 0.338, 0.374)(0.601, 0.323, 0.354)(0.565, 0.362, 0.368)(0.569, 0.362, 0.371)(0.569, 0.365, 0.355)(0.577, 0.361, 0.353)(0.599, 0.325, 0.371)(0.554, 0.382, 0.395)
0.3(0.684, 0.244, 0.325)(0.633, 0.309, 0.366)(0.667, 0.257, 0.359)(0.682, 0.243, 0.337)(0.647, 0.280, 0.354)(0.65, 0.279, 0.357)(0.652, 0.280, 0.342)(0.659, 0.276, 0.34)(0.681, 0.244, 0.352)(0.638, 0.294, 0.38)
0.4(0.746, 0.183, 0.307)(0.697, 0.24, 0.352)(0.729, 0.195, 0.343)(0.743, 0.183, 0.321)(0.710, 0.216, 0.34)(0.713, 0.215, 0.342)(0.715, 0.215, 0.327)(0.721, 0.212, 0.325)(0.742, 0.184, 0.334)(0.702, 0.226, 0.364)
0.5(0.793, 0.138, 0.289)(0.747, 0.185, 0.338)(0.778, 0.148, 0.326)(0.791, 0.138, 0.304)(0.759, 0.167, 0.325)(0.762, 0.166, 0.327)(0.764, 0.165, 0.313)(0.770, 0.163, 0.31)(0.790, 0.138, 0.315)(0.752, 0.174, 0.348)
0.6(0.831, 0.104, 0.272)(0.788, 0.144, 0.324)(0.816, 0.112, 0.309)(0.828, 0.103, 0.287)(0.799, 0.129, 0.309)(0.801, 0.128, 0.312)(0.804, 0.126, 0.298)(0.809, 0.125, 0.295)(0.828, 0.104, 0.297)(0.793, 0.134, 0.332)
0.7(0.861, 0.078, 0.255)(0.821, 0.111, 0.309)(0.848, 0.085, 0.293)(0.858, 0.078, 0.270)(0.831, 0.099, 0.294)(0.834, 0.098, 0.296)(0.836, 0.097, 0.283)(0.841, 0.096, 0.280)(0.858, 0.078, 0.279)(0.826, 0.103, 0.316)
0.8(0.886, 0.059, 0.239)(0.849, 0.086, 0.294)(0.873, 0.065, 0.276)(0.883, 0.059, 0.254)(0.858, 0.077, 0.279)(0.86, 0.076, 0.281)(0.862, 0.074, 0.268)(0.867, 0.073, 0.265)(0.883, 0.059, 0.262)(0.853, 0.080, 0.299)
0.9(0.906, 0.044, 0.223)(0.872, 0.067, 0.279)(0.894, 0.049, 0.26)(0.903, 0.044, 0.239)(0.88, 0.059, 0.264)(0.882, 0.058, 0.266)(0.884, 0.057, 0.253)(0.889, 0.056, 0.25)(0.903, 0.044, 0.245)(0.876, 0.061, 0.284)
1(0.922, 0.033, 0.208)(0.891, 0.052, 0.265)(0.912, 0.037, 0.245)(0.92, 0.033, 0.223)(0.899, 0.046, 0.25)(0.9, 0.045, 0.252)(0.902, 0.044, 0.239)(0.906, 0.043, 0.236)(0.92, 0.033, 0.229)(0.895, 0.047, 0.268)
Table 16. Results of SF- WASPAS in term of Scores and Rankings.
Qx1−0.0290.0110.0660.1220.1770.2310.2850.3360.3860.4340.479
x2−0.043−0.0140.0290.0680.1060.1440.1830.2240.2650.3060.347
x3−0.020.0030.0430.0840.1270.1720.2180.2650.3110.3570.401
x4−0.0290.010.060.110.1590.2090.2590.3090.3570.4040.448
x5−0.028−0.0030.0390.080.1220.1640.2070.2510.2950.3380.38
x6−0.03−0.0020.0390.080.1210.1630.2060.2490.2930.3360.378
x7−0.044−0.0050.0460.0920.1370.1820.2260.2710.3160.3590.401
x8−0.044−0.0020.050.0980.1440.190.2360.2810.3260.370.413
x9−0.0160.0070.050.0960.1440.1940.2450.2950.3450.3920.438
x10−0.014−0.0070.0250.0590.0950.1330.1730.2150.2580.3010.344
Rankx161111111111
x2810999999999
x334666666665
x452222222222
x547877777777
x676788888888
x798555555556
x8105434444444
x923343333333
x1019101010101010101010
λ = 0 λ = 0.1λ = 0.2λ = 0.3λ = 0.4λ = 0.5λ = 0.6λ = 0.7λ = 0.8λ = 0.9λ = 1
Publisher’s Note: MDPI stays neutral with regard to jurisdictional claims in published maps and institutional affiliations.

