Article

Effective Identification and Localization of Single and Multiple Breathing Cracks in Beams under Gaussian Excitation Using Time-Domain Analysis

1
Department of Engineering Mechanics, Hohai University, Nanjing 210098, China
2
Anhui Provincial International Joint Research Center of Data Diagnosis and Smart Maintenance on Bridge Structures, Chuzhou University, Chuzhou 239000, China
3
College of Civil and Transportation Engineering, Hohai University, Nanjing 210098, China
4
Jiangsu Zhongji Engineering Technology Research Co., Ltd., Nantong 226001, China
5
College of Civil and Architecture Engineering, Chuzhou University, Chuzhou 239000, China
6
College of Civil Engineering, Southeast University, Nanjing 210000, China
*
Author to whom correspondence should be addressed.
These authors contributed equally to this work.
Mathematics 2022, 10(11), 1853; https://doi.org/10.3390/math10111853
Submission received: 12 March 2022 / Revised: 22 May 2022 / Accepted: 25 May 2022 / Published: 28 May 2022
(This article belongs to the Section Computational and Applied Mathematics)

Abstract

:
The output response of any intact oscillatory system subjected to a Gaussian excitation is also Gaussian in nature. On the contrary, when the system contains any type of underlying nonlinearity, the output signal is definitely non-Gaussian. In beam structures, the presence of fatigue-breathing cracks significantly influences the dynamic response characteristics under Gaussian excitation. The presence of such cracks alters the response to be nonlinear, and the non-Gaussianity of the system will arise. In order to examine the non-Gaussianity features and ability for the detection and localization of fatigue cracks, several breathing crack identification scenarios in beam-like structures are presented in this paper. The effects of single and multiple breathing cracks corresponding to different boundary conditions on the responses of beams are studied. The results are analyzed based on the higher-order time-domain transformations. Higher-order transformations, namely the skewness and kurtosis coefficients in addition to the Shannon entropy, are exploited to provide dynamic details about the response, which the conventional second-order statistics cannot show. The results exhibit that the proposed methods are robust and immune to noise and can detect and localize breathing cracks with different sensitivities.

1. Introduction

Fatigue-breathing cracks are the most common types of structural damages in several engineering structures, such as mechanical, civil, aerospace, turbo-machines, etc. [1]. The existence of such cracks may impair structural performance, leading to severe effects and causing catastrophic failure [2]. The open cracks can be easily detected and often lead to the loss of physical stiffness, resulting in a primarily linear structure with decreased vibration frequencies and load-bearing capacity [3,4]. On the other hand, fatigue cracks are dangerous because they are usually negligible compared to the cracked structure, as they cause insignificant structural changes in the dynamic features [5]. The fatigue-breathing cracks’ opening and closing phenomenon depend on excitation frequencies, leading to higher harmonics sensitivity to specific excitation frequencies and less sensitivity to others [6]. Therefore, identifying fatigue cracks is complex, and there is a need for nonlinear models other than open crack models because open crack models are useless and inaccurate in identifying fatigue cracks.
There are many methods for detecting, locating, and quantifying breathing cracks in the literature, such as time-domain methods, frequency-domain methods, time-frequency methods, and others [7]. Within this section, attempts are conducted to survey the most important techniques used in the time-domain to identify breathing cracks in beams.
Several models in the literature based on different techniques have been used to detect fatigue cracks, differing in terms of assumptions and complexities [8,9,10]. It is well-known that nonlinearity could be exploited for detecting damage, which can be realized from several studies reported in the literature [11,12,13]. Jyrki et al. [14] introduced a time-domain approach using the generalized likelihood ratio test to investigate the fatigue cracks of a simply supported beam. Their work aimed to detect the smallest crack size in the beam, which was slightly more than 10% of the total beam height. Cheng et al. [15] proposed a new method based on the Volterra kernel-function-based analysis to identify a fatigue-breathing crack in a nonlinear structural system. Villani et al. [16] proposed an identification method based on a stochastic version of the Volterra series to study the breathing crack of a beam that vibrates nonlinearly. The results show the linear model’s failure in the case where the damage has low severity, whereas the nonlinear model performed satisfactorily even in the presence of uncertainties. Prawin and Rao [17] performed a numerical investigation to examine the adaptive filter algorithm by solving a bilinear oscillator of a beam containing a breathing crack. The opening and closing conditions of the structure can be extracted through the application of this method. The results clearly show that the proposed model is able to recognize the opening and closing conditions of cracked structures. Peng et al. [18] proposed a new nonlinear identification method based on only the output responses by quantifying the structure’s nonlinear contribution utilizing the Volterra series model. Based on the Volterra series expansion for the separation of the linear and high-order nonlinear components, a nonlinearity contribution index is presented to quantify the nonlinearity degree corresponding to structural responses. The performance of the proposed method was studied numerically on a simply supported beam containing a breathing crack subjected to white noise excitations and confirmed experimentally on a precast segmental concrete column using ground motion excitations.
Kullaa and Miettinen [19] numerically studied the damage detection of a cantilever pipe containing a fatigue crack subjected to a random excitation utilizing 3D finite element modeling. The study was conducted using accelerometers and strain gauges, and it was found that the accelerometers were more sensitive to fatigue crack damage than strain gauges. Smith et al. [20] presented a damage detection method using the Bayesian approach and a nonlinear model. The proposed approach aimed to localize and quantify the breathing crack and describe its condition using nonlinear structural responses. The results demonstrated that this approach could detect and localize a single breathing crack even in noisy conditions. Wang and Wu [21] designed a damage identification module to study opened and closed cracks in welded joints. The proposed method is based on using a new sensor and entropy measurements, and it has a high sensitivity to crack existence and severity. Numerical and experimental investigations were performed on different beam structures to verify the feasibility of the proposed damage detection technique. The results show that the method is able to detect cracks that propagate during the operation of the system. Lu et al. [22] proposed a novel identification approach based on the time-domain sensitivity analysis of a breathing crack. The breathing crack identification process was based on solving the inverse problem for different structures, such as beams, shear frames, etc. Three numerical examples were introduced. The results show that the proposed method is accurate and robust to noise with less computational effort.
Asnaashari and Sinha [23] proposed a new concept called residual operational deflection shape (R-ODS) for breathing crack detection and localization in beam-like structures. The R-ODS was used at an excitation frequency and its higher harmonics to localize breathing cracks. The proposed method was accurate and straightforward in locating cracks. Jiang et al. [24] proposed a bicoherence-based nonlinearity measurement technique to localize breathing cracks in blades. A damage index called a total nonlinearity index was utilized as a blade damage indicator, where the crack was determined by locating the maximum components. Prawin [25] proposed a new dynamic principal component analysis (DPCA)-based baseline-free damage diagnostic approach for breathing crack detection, characterization, and localization utilizing ambient vibration data in the time-domain. He proposed three new indices of damage localization based on the analysis of the fractal dimensions of the residual response, the directional angle, and the first residual principal component vector. The validity of the DPCA method was confirmed numerically and experimentally. Prawin et al. [26] introduced a new baseline-free method utilizing singular spectrum analysis to detect, localize, and characterize breathing cracks in beam-like structures. They proposed a new damage indicator based on the singular spectrum analysis that takes advantage of the response’s nonlinear harmonics and intermodulations. The proposed approach was confirmed numerically and experimentally.
Over the last few decades, many scholars have used entropy in different real-life fields for monitoring the nonlinearity of the systems, such as medical sciences, electrical machines, automobiles, etc. [27,28,29]. Entropy is a powerful measure of data randomness encountered in a non-stationary and nonlinear time signal [30]. It can be a suitable mean for damage identification and localization in various civil and mechanical engineering applications, where the recorded signals can vary according to the severity of the damage and the location [31,32,33,34]. Sandoval et al. [35] proposed an entropy-based method to classify the vibration signals of low-speed bearings. The findings confirm that entropy indicators can contribute to a more reliable diagnosis. Hosseini et al. [36] investigated the crack initiation in ductile cast iron using the acoustic emission information entropy. The results show that the Shannon entropy curves slope steadily reduced as the crack grew. Alamdari et al. [37] presented a new scheme of detecting and localizing damages in civil engineering structures utilizing entropy-based time-series analysis. The results demonstrated that the proposed method could successfully identify and localize damages in civil engineering structures. Amezquita-Sanchez [38] presented a new methodology based on using six different entropy types for assessing the health state of high-rise buildings under dynamic excitations. The results confirm that entropy methods are promising and can be considered a suitable choice for developing methodologies with the capability to monitor the health status of civilian structures.
The nonlinear effects of responses for beams containing fatigue cracks are difficult to be predicted compared to those with open cracks [39]. However, the presence of nonlinear effects of the response illustrates the difference between the damaged and healthy conditions [40]. Then, choosing the appropriate, sensitive indicator to the presence of nonlinear effects makes it easy to identify fatigue cracks [41,42].
Some researchers have found that the response resulting from random excitation, such as Gaussian excitation, can be sensitive to the effects of the nonlinear response of the beam and thus be an indicator of the presence of fatigue cracks [43,44,45]. It is well-known that when an intact beam is subjected to a random excitation, such as a Gaussian excitation, the system’s response is also Gaussian [46]. Conversely, the response will not be Gaussian anymore when the system contains a kind of nonlinearity, such as fatigue cracks [47,48]. Thus, the change in the Gaussian response can be employed to identify fatigue cracks by estimating the higher-order statistics [49].
Several statistical approaches can be used to estimate the non-Gaussianity of the system, such as kurtosis and skewness [50,51,52]. When the size of the crack is more than half the width of the beam, it is easy to use one of the above two measures. However, when the size of the crack is small, it is challenging to recognize the existence of the crack due to the slight nonlinearity of the system, whose behavior is very similar to the linear one (intact structure). Therefore, in this scenario, the measurement used to determine non-Gaussianity is crucial in providing accurate information about the structural condition [53]. Benfratello et al. [54] experimentally and numerically studied damage detection and localization of a fatigued one-dimensional beam subjected to Gaussian excitation. The beam was discretized into ten finite elements in which a breathing crack model with a fully closed or fully open crack is utilized to characterize the damaged element. The skewness and kurtosis coefficients were used as damage indicators due to their sensitivity to nonlinearity produced by the breathing crack based on the analysis of displacements and rotations. They found that the skewness coefficients of the rotation are more suitable parameters than kurtosis coefficients for breathing crack detection and localization.
This paper investigates efficient methods for the detection and localization of single and multiple breathing cracks in beam structures under various boundary conditions. Time-domain transformations such as skewness, kurtosis, and the Shannon entropy are used for analyzing the displacement responses of different beam models subjected to Gaussian excitation. The non-Gaussianity features of different analyzed signals are exploited to detect and localize fatigue cracks. The breathing cracks are modeled using surface-to-surface contact using ABAQUS FE software.
The rest of the paper is organized as follows. The theoretical background of the time-domain transformations used for the detection and localization of breathing cracks are described in Section 2. Section 3 numerically investigates the nonlinear behavior generated by the breathing cracks utilizing ABAQUS FE software. In Section 4, numerical results and discussions of different beam models containing single and multiple breathing cracks are presented. Finally, the main conclusions of this work are drawn together and presented in Section 5.

2. Time-Domain Methods

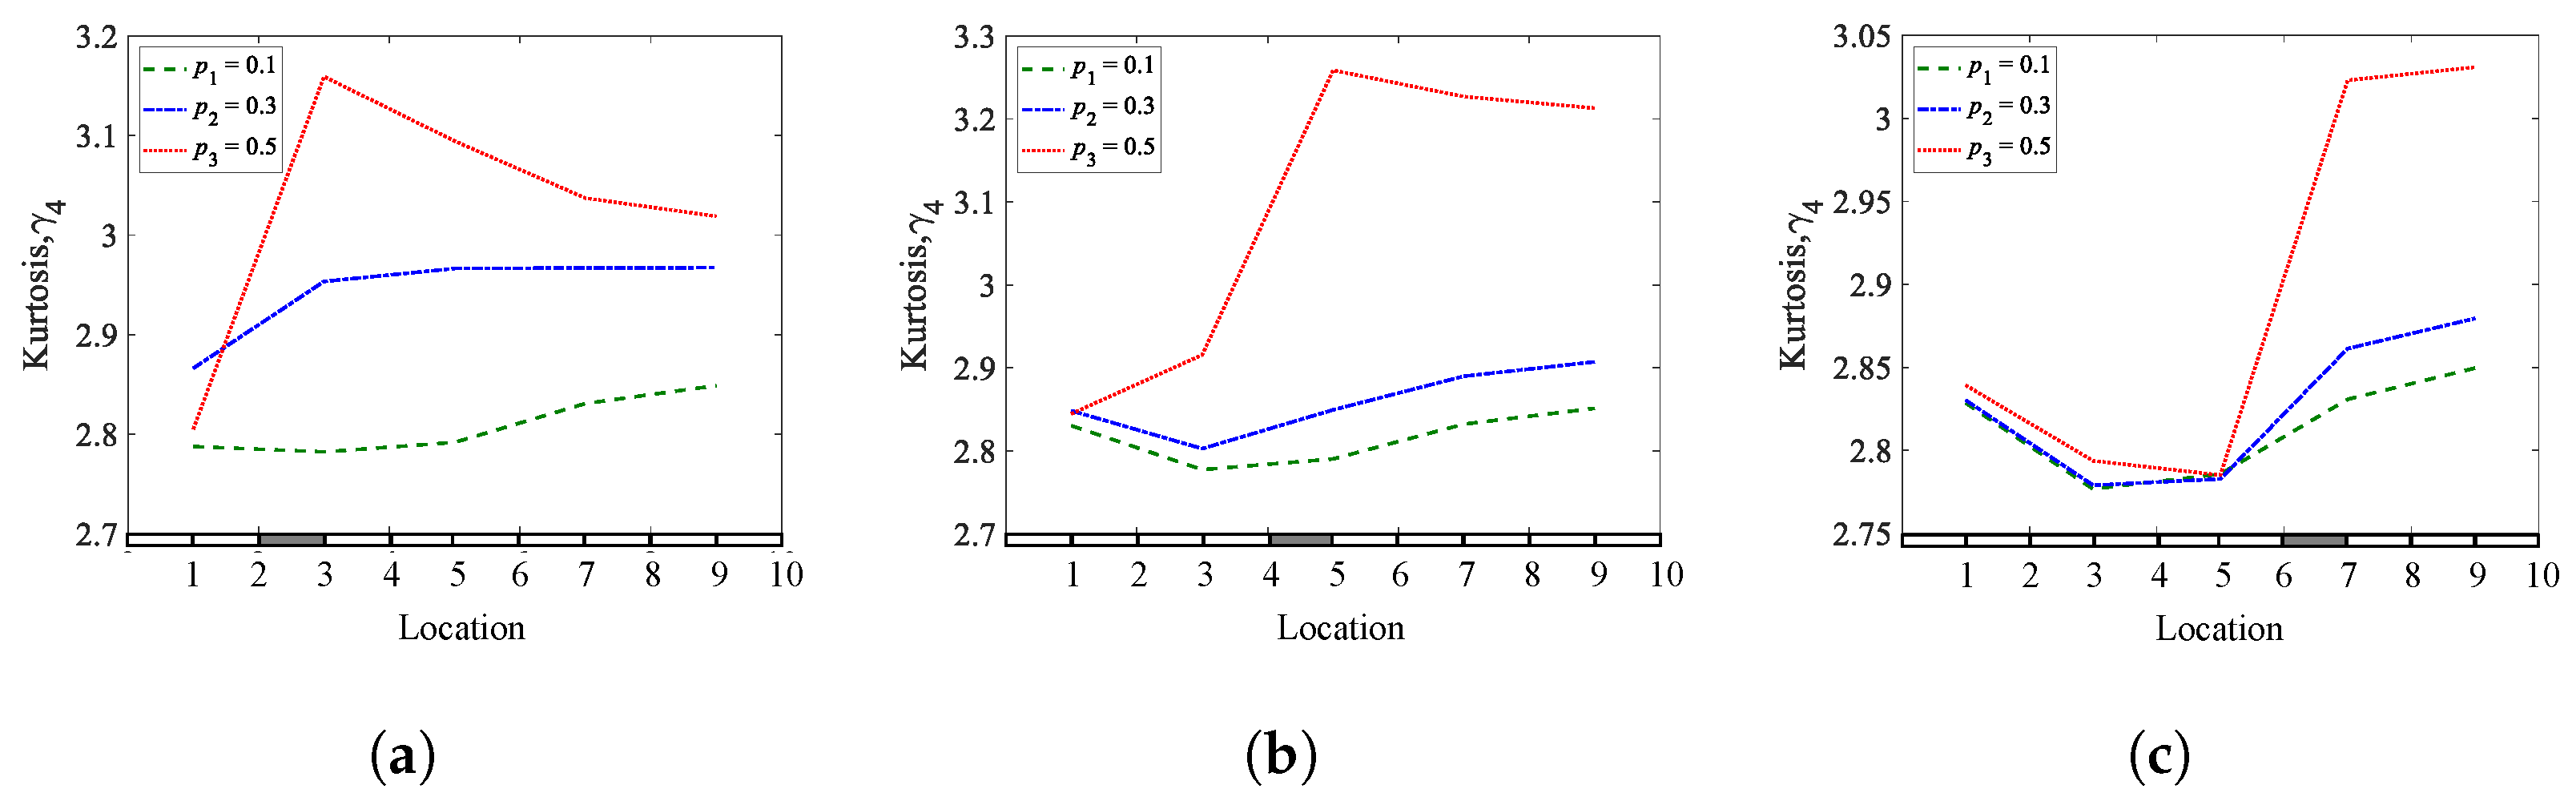
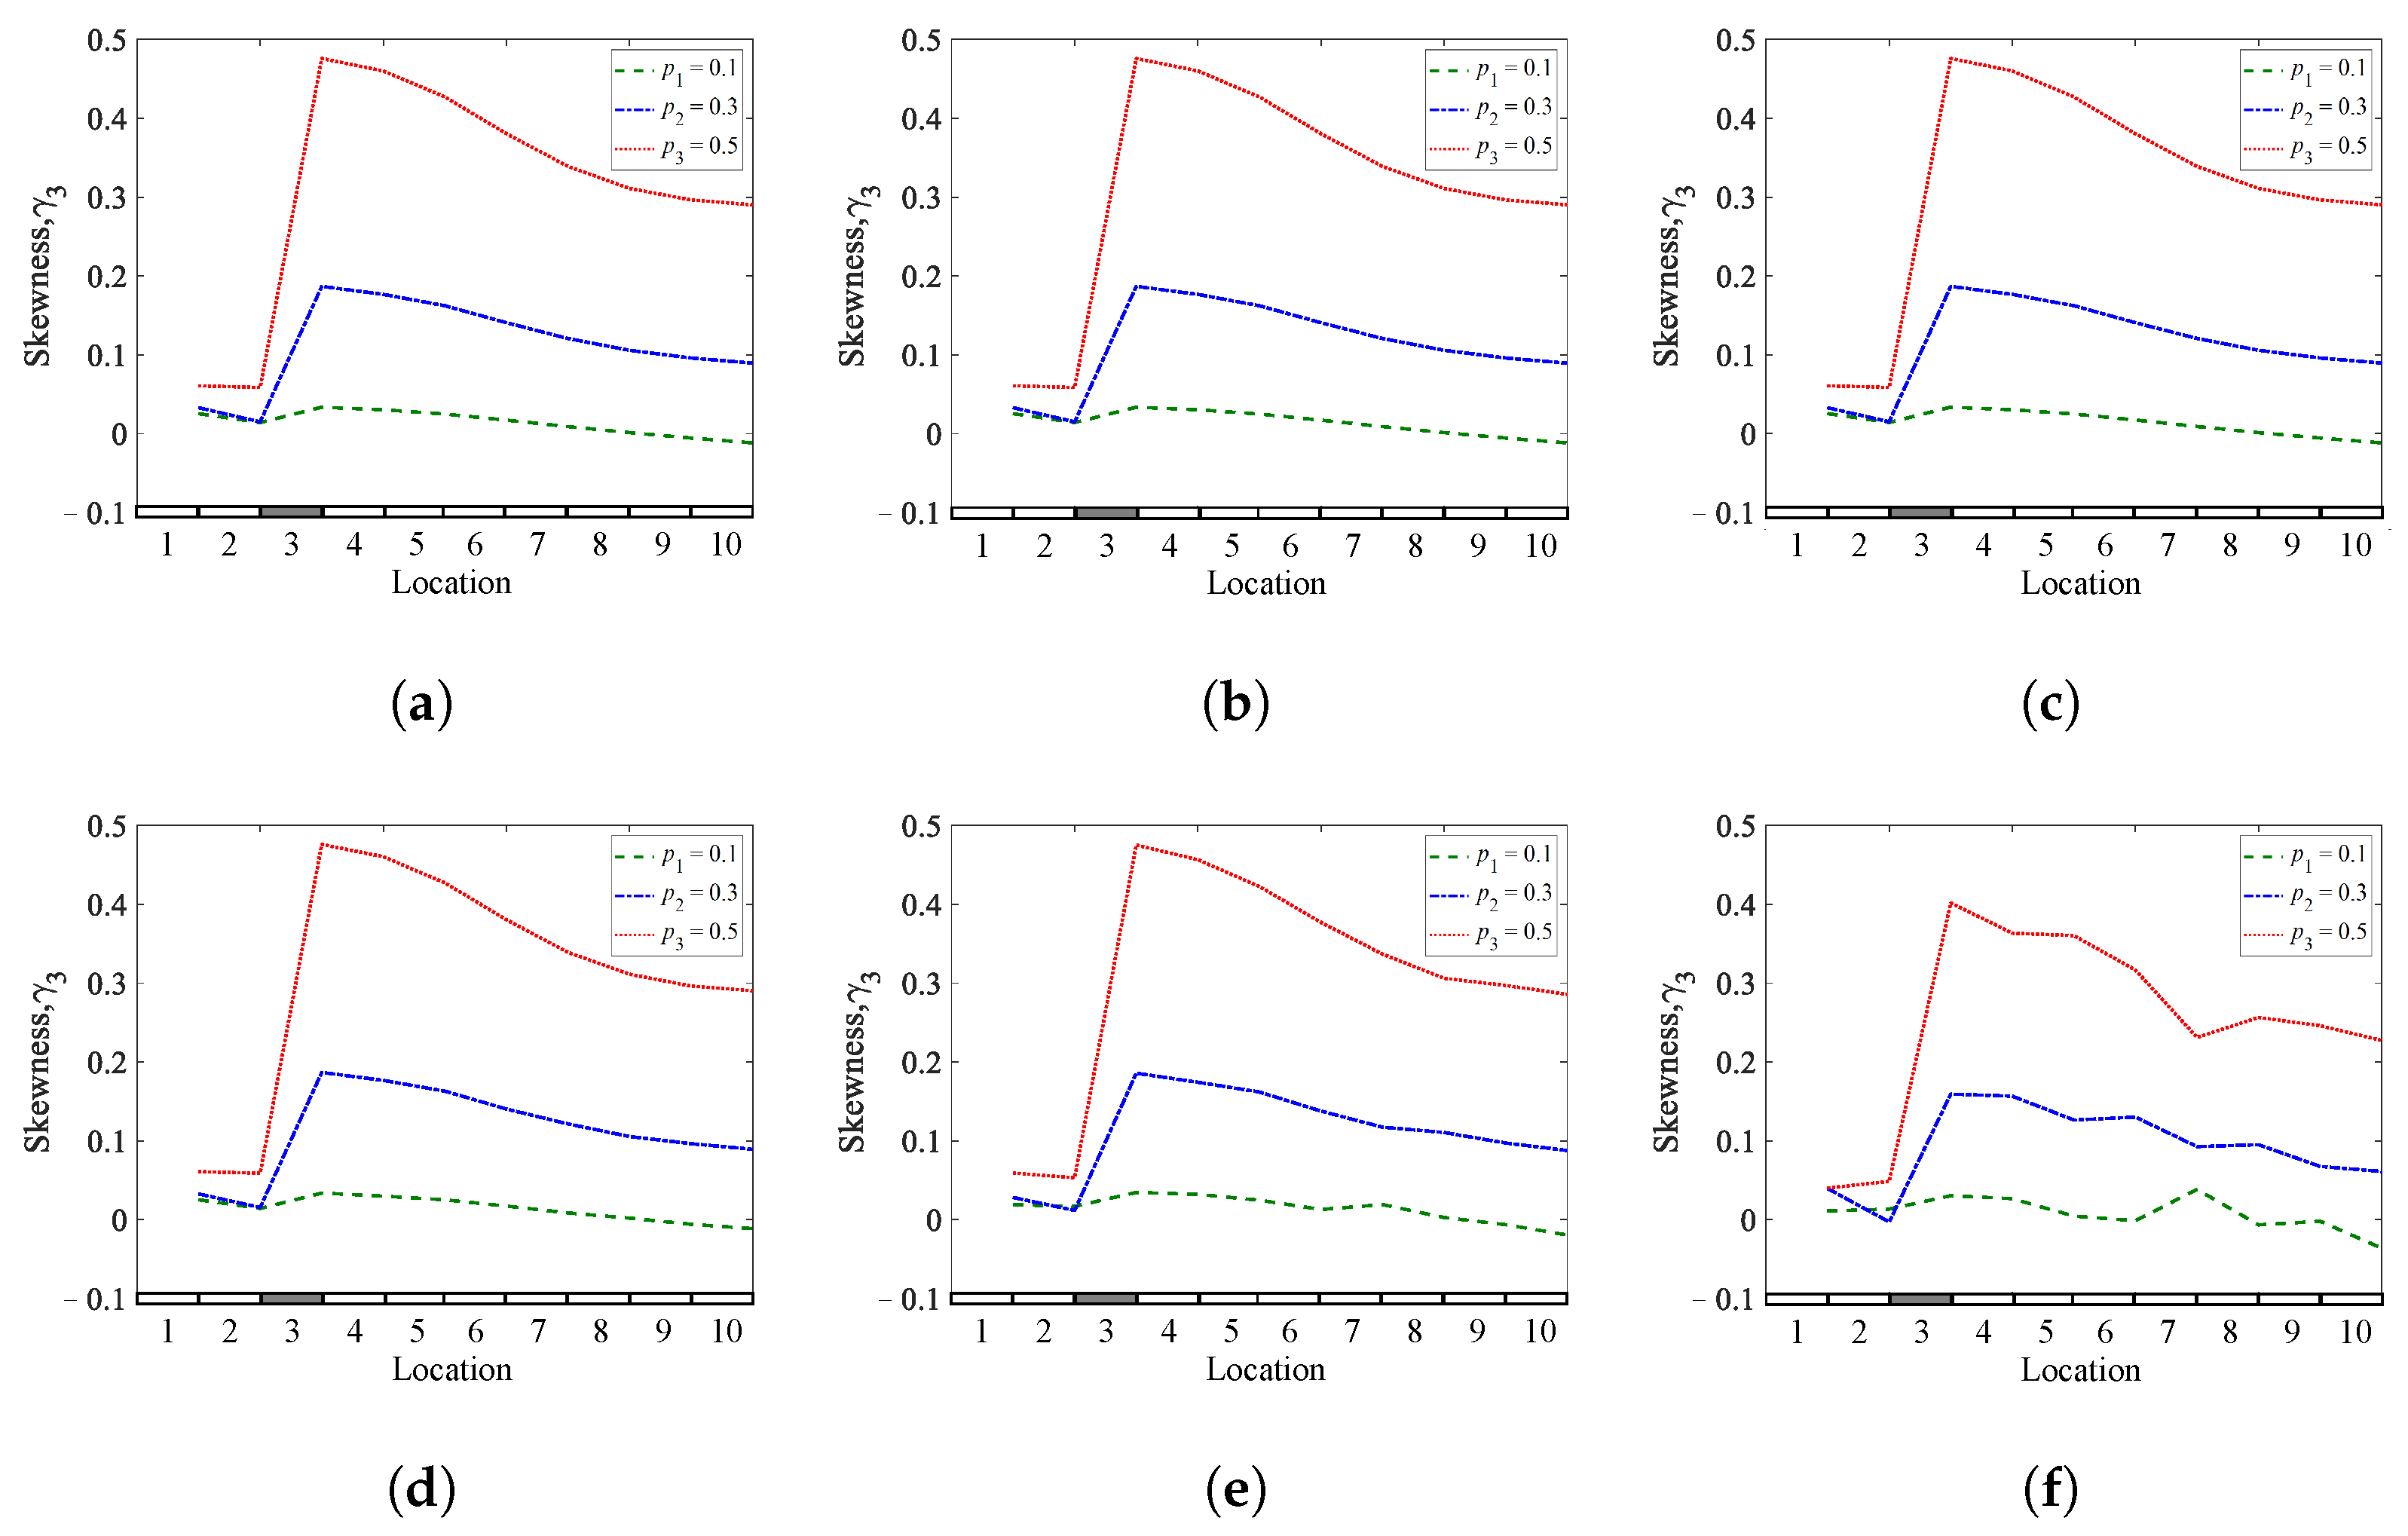
2.1. Skewness and Kurtosis Algorithms

It is well-known that any linear system subjected to random Gaussian excitation also produces a random Gaussian response. However, once the system has some kind of nonlinearity, the random response of the system is no longer Gaussian [55,56]. In this paper, the higher-order measurements, such as skewness (third-order) and kurtosis (fourth-order), are used to provide more information about the random response of the nonlinear system [57]. Therefore, the appropriate choice of parameters helps to correctly characterize the nonlinear behavior of the system. In this study, beams with breathing cracks that open and close due to exposure to Gaussian excitation, resulting in non-Gaussian responses, are studied. The amount of non-Gaussianity of the system is proportional to the amount of damage. Therefore, it can be said that the non-Gaussianity amount of the system is an indicator of the damage severity. The sensitivity of the skewness and kurtosis coefficients varies in detecting damage. Therefore, the appropriate selection of these coefficients must be considered to detect and localize damages.
Skewness is a measure of the asymmetry of the data around the sample mean. There are three conditions of the skewness coefficients: (i) if skewness is positive, the data spread out more to the right; (ii) if skewness is negative, the data spread out more to the left of the mean than to the right; and (iii) if the data are normally distributed, the skewness is zero. Conversely, kurtosis is a measure of how outlier-prone a distribution is. Distributions with peaks higher than the peak of the normal distribution have kurtosis greater than 3, while distributions with peaks smaller than the normal distributions have kurtosis less than 3, and distributions with peaks the same as that of the normal distribution have kurtosis equal to 3. The skewness and kurtosis of distribution are defined as [58,59]
γ 3 = E ( x μ ) 3 σ 3 ,
γ 4 = E ( x μ ) 4 σ 4 ,
μ = i = 1 n x i n = x 1 + x 2 + + x n n ,
σ = i = 1 n x i μ 2 n 1 ,
where γ 3 and γ 4 are the skewness and kurtosis coefficients, respectively. The time-history of the displacement response in the y-axis is represented by x, μ is the mean of x, σ is the standard deviation of x, and E ( t ) represents the expected value of the quantity t. The skewness and kurtosis function computes a sample version of this population value. When the structure is intact and subjected to Gaussian excitation, the skewness and kurtosis coefficients vanish because the system is linear. On the contrary, these coefficients appear when the system is damaged, i.e., the system is nonlinear, and the response is non-Gaussian.

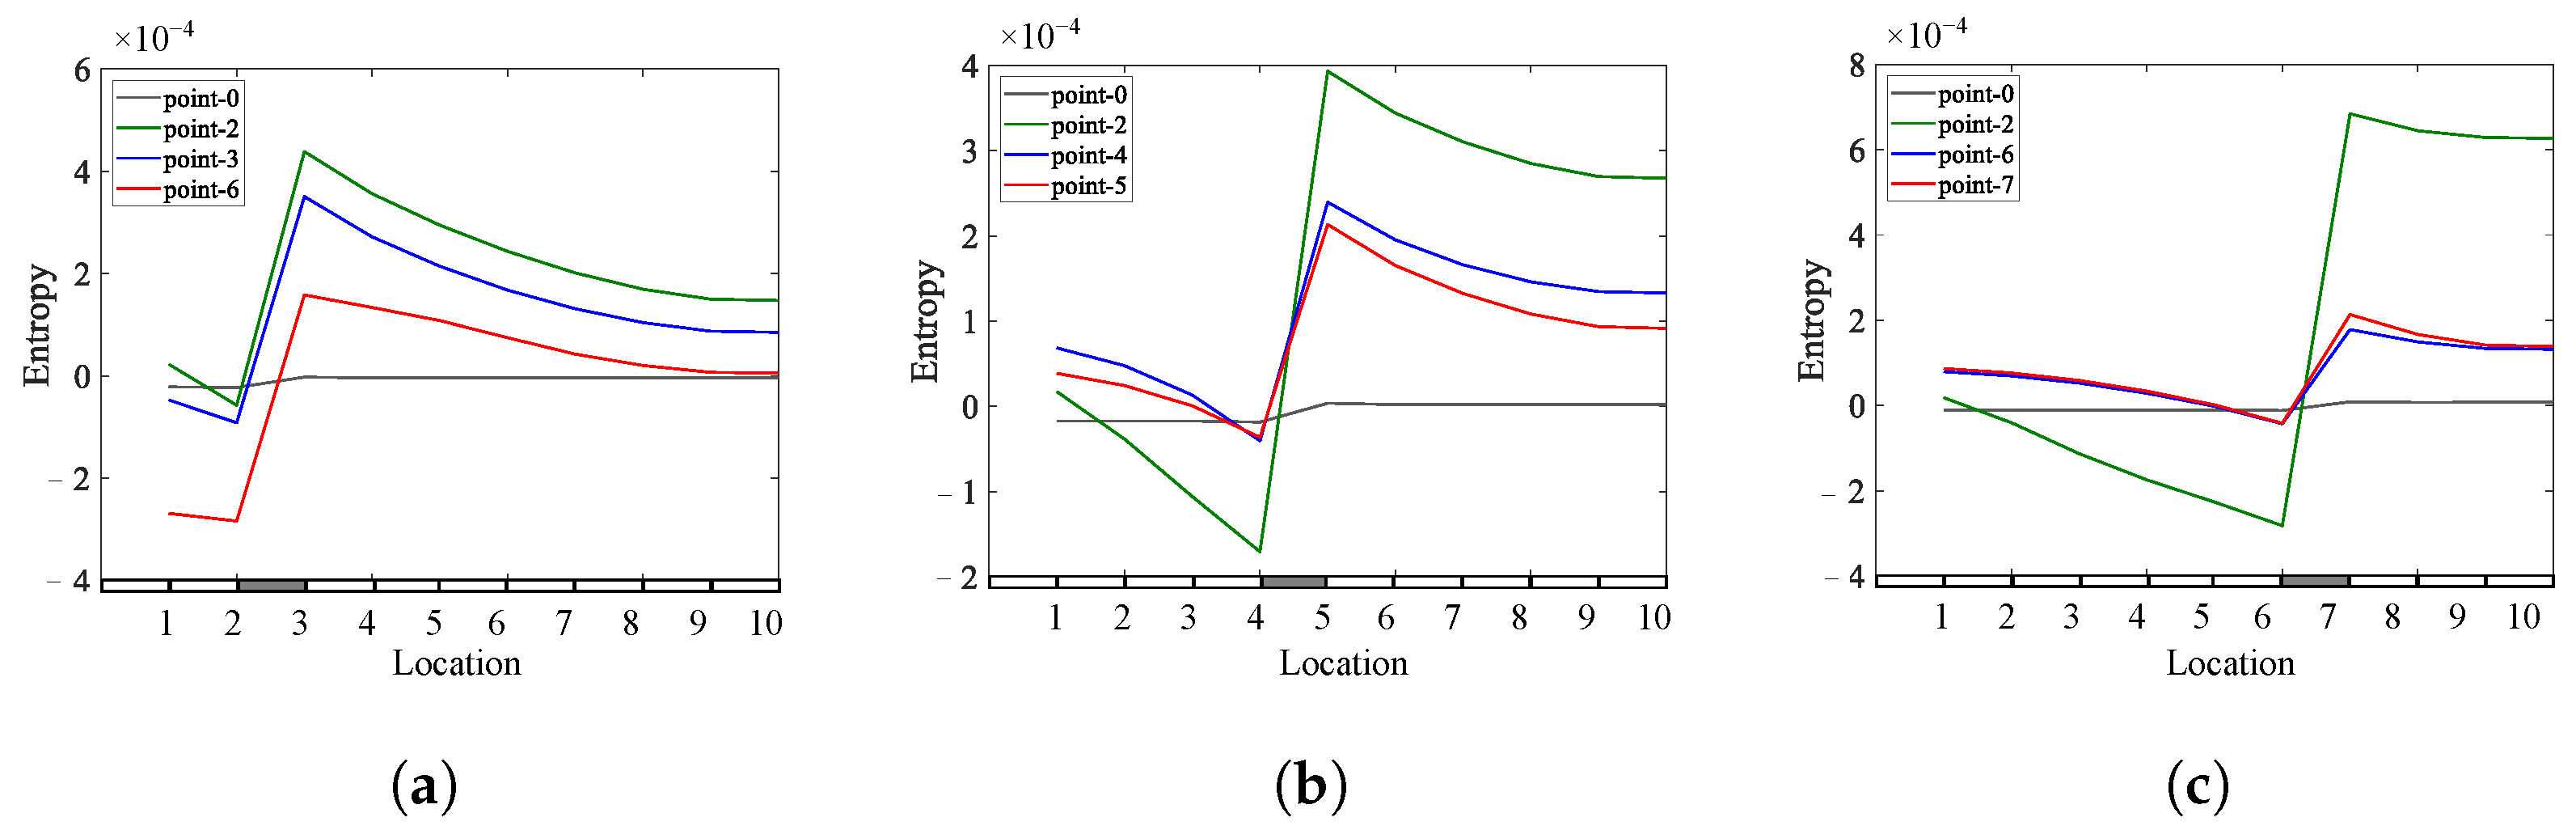
2.2. Shannon Entropy

Entropy is a statistical measure of randomness that can be used to describe the randomness faced in the time signals. It can be used for characterizing nonlinear time signals of many applications. Entropy can be a convenient indicator to characterize dynamic properties and thus determine the damage state of a nonlinear system subjected to random Gaussian excitation.
Over the past few years, different entropy approaches have been introduced to evaluate the randomness encountered in nonlinear systems [60,61]. This paper exploits the Shannon entropy method to identify and localize breathing cracks in beam structures. The Shannon entropy is defined as:
H ( X ) = i = 1 N p x i log 2 p x i ,
where x 0 , x 1 , x 2 , , x N 1 represent the possible outcomes that can be taken by a signal X with a probability p ( x i ) of the event i in the time record of all events.
Figure 1 shows the flowchart of the proposed methodology by illustrating the different steps involved. The following sections include the numerical simulations and analysis of the beams under the Gaussian excitation of different beam models with single and multiple breathing cracks. The skewness and kurtosis coefficients and the Shannon entropy will be evaluated to detect and localize breathing cracks.

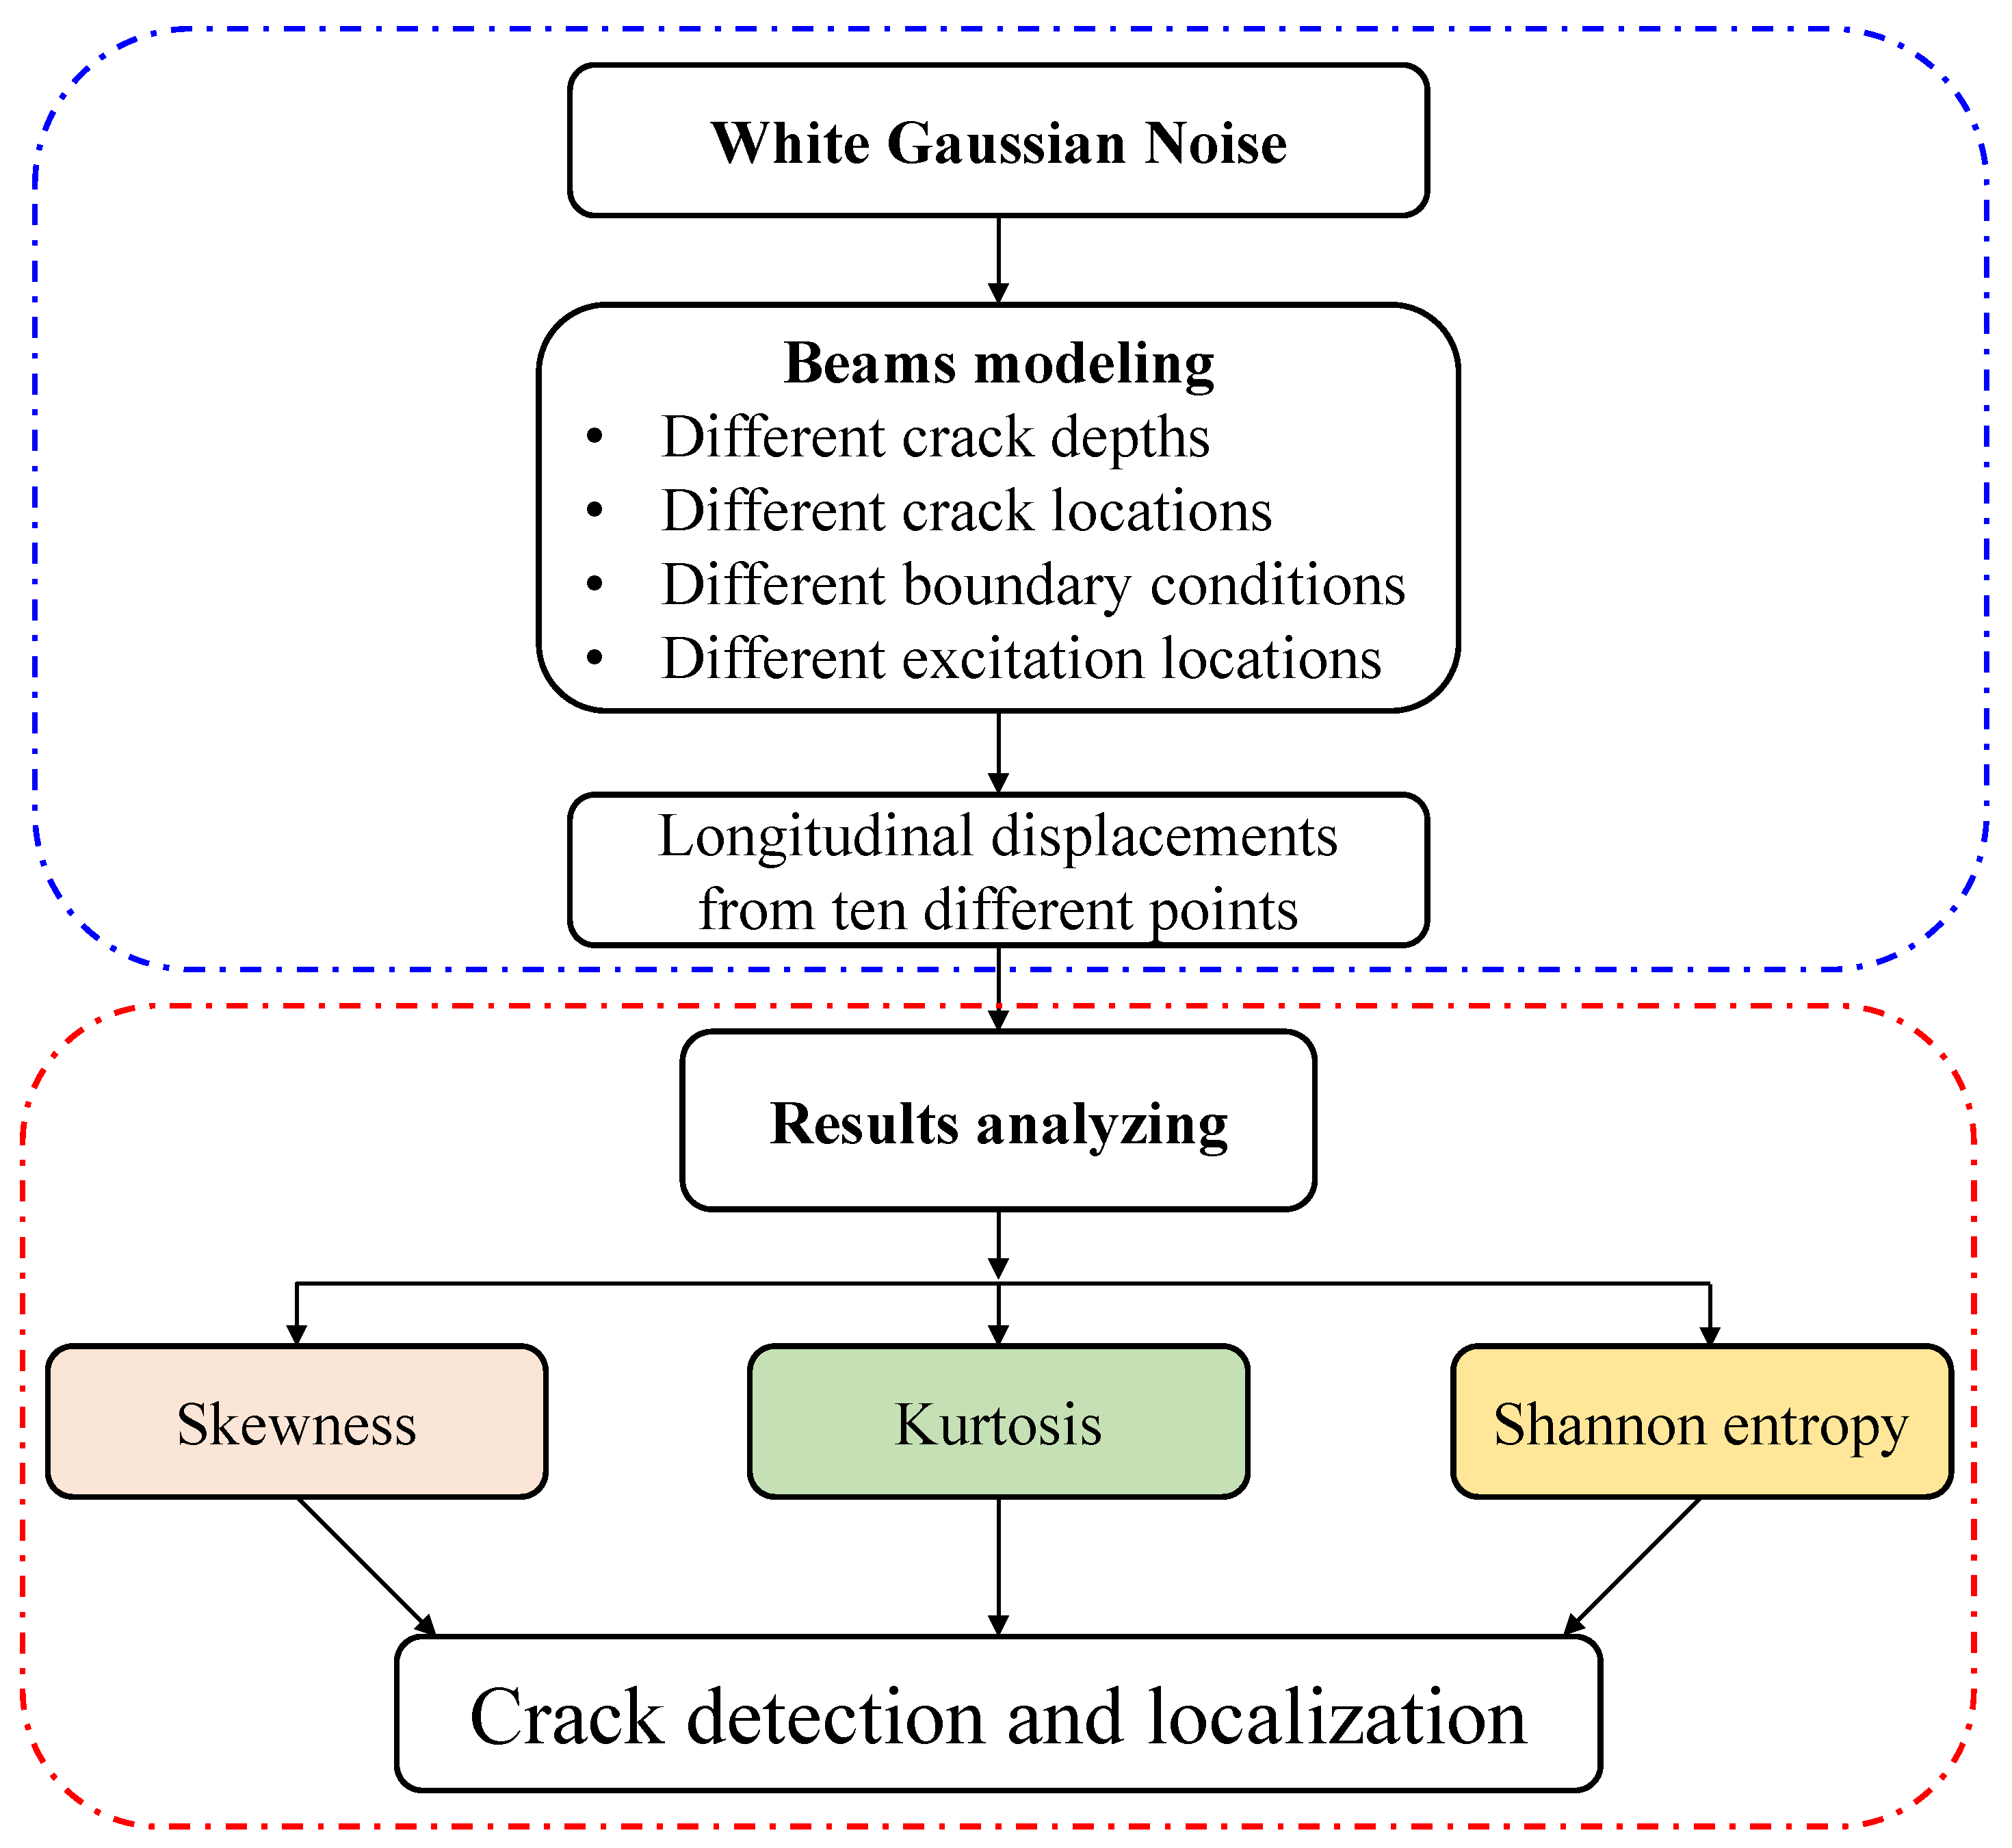
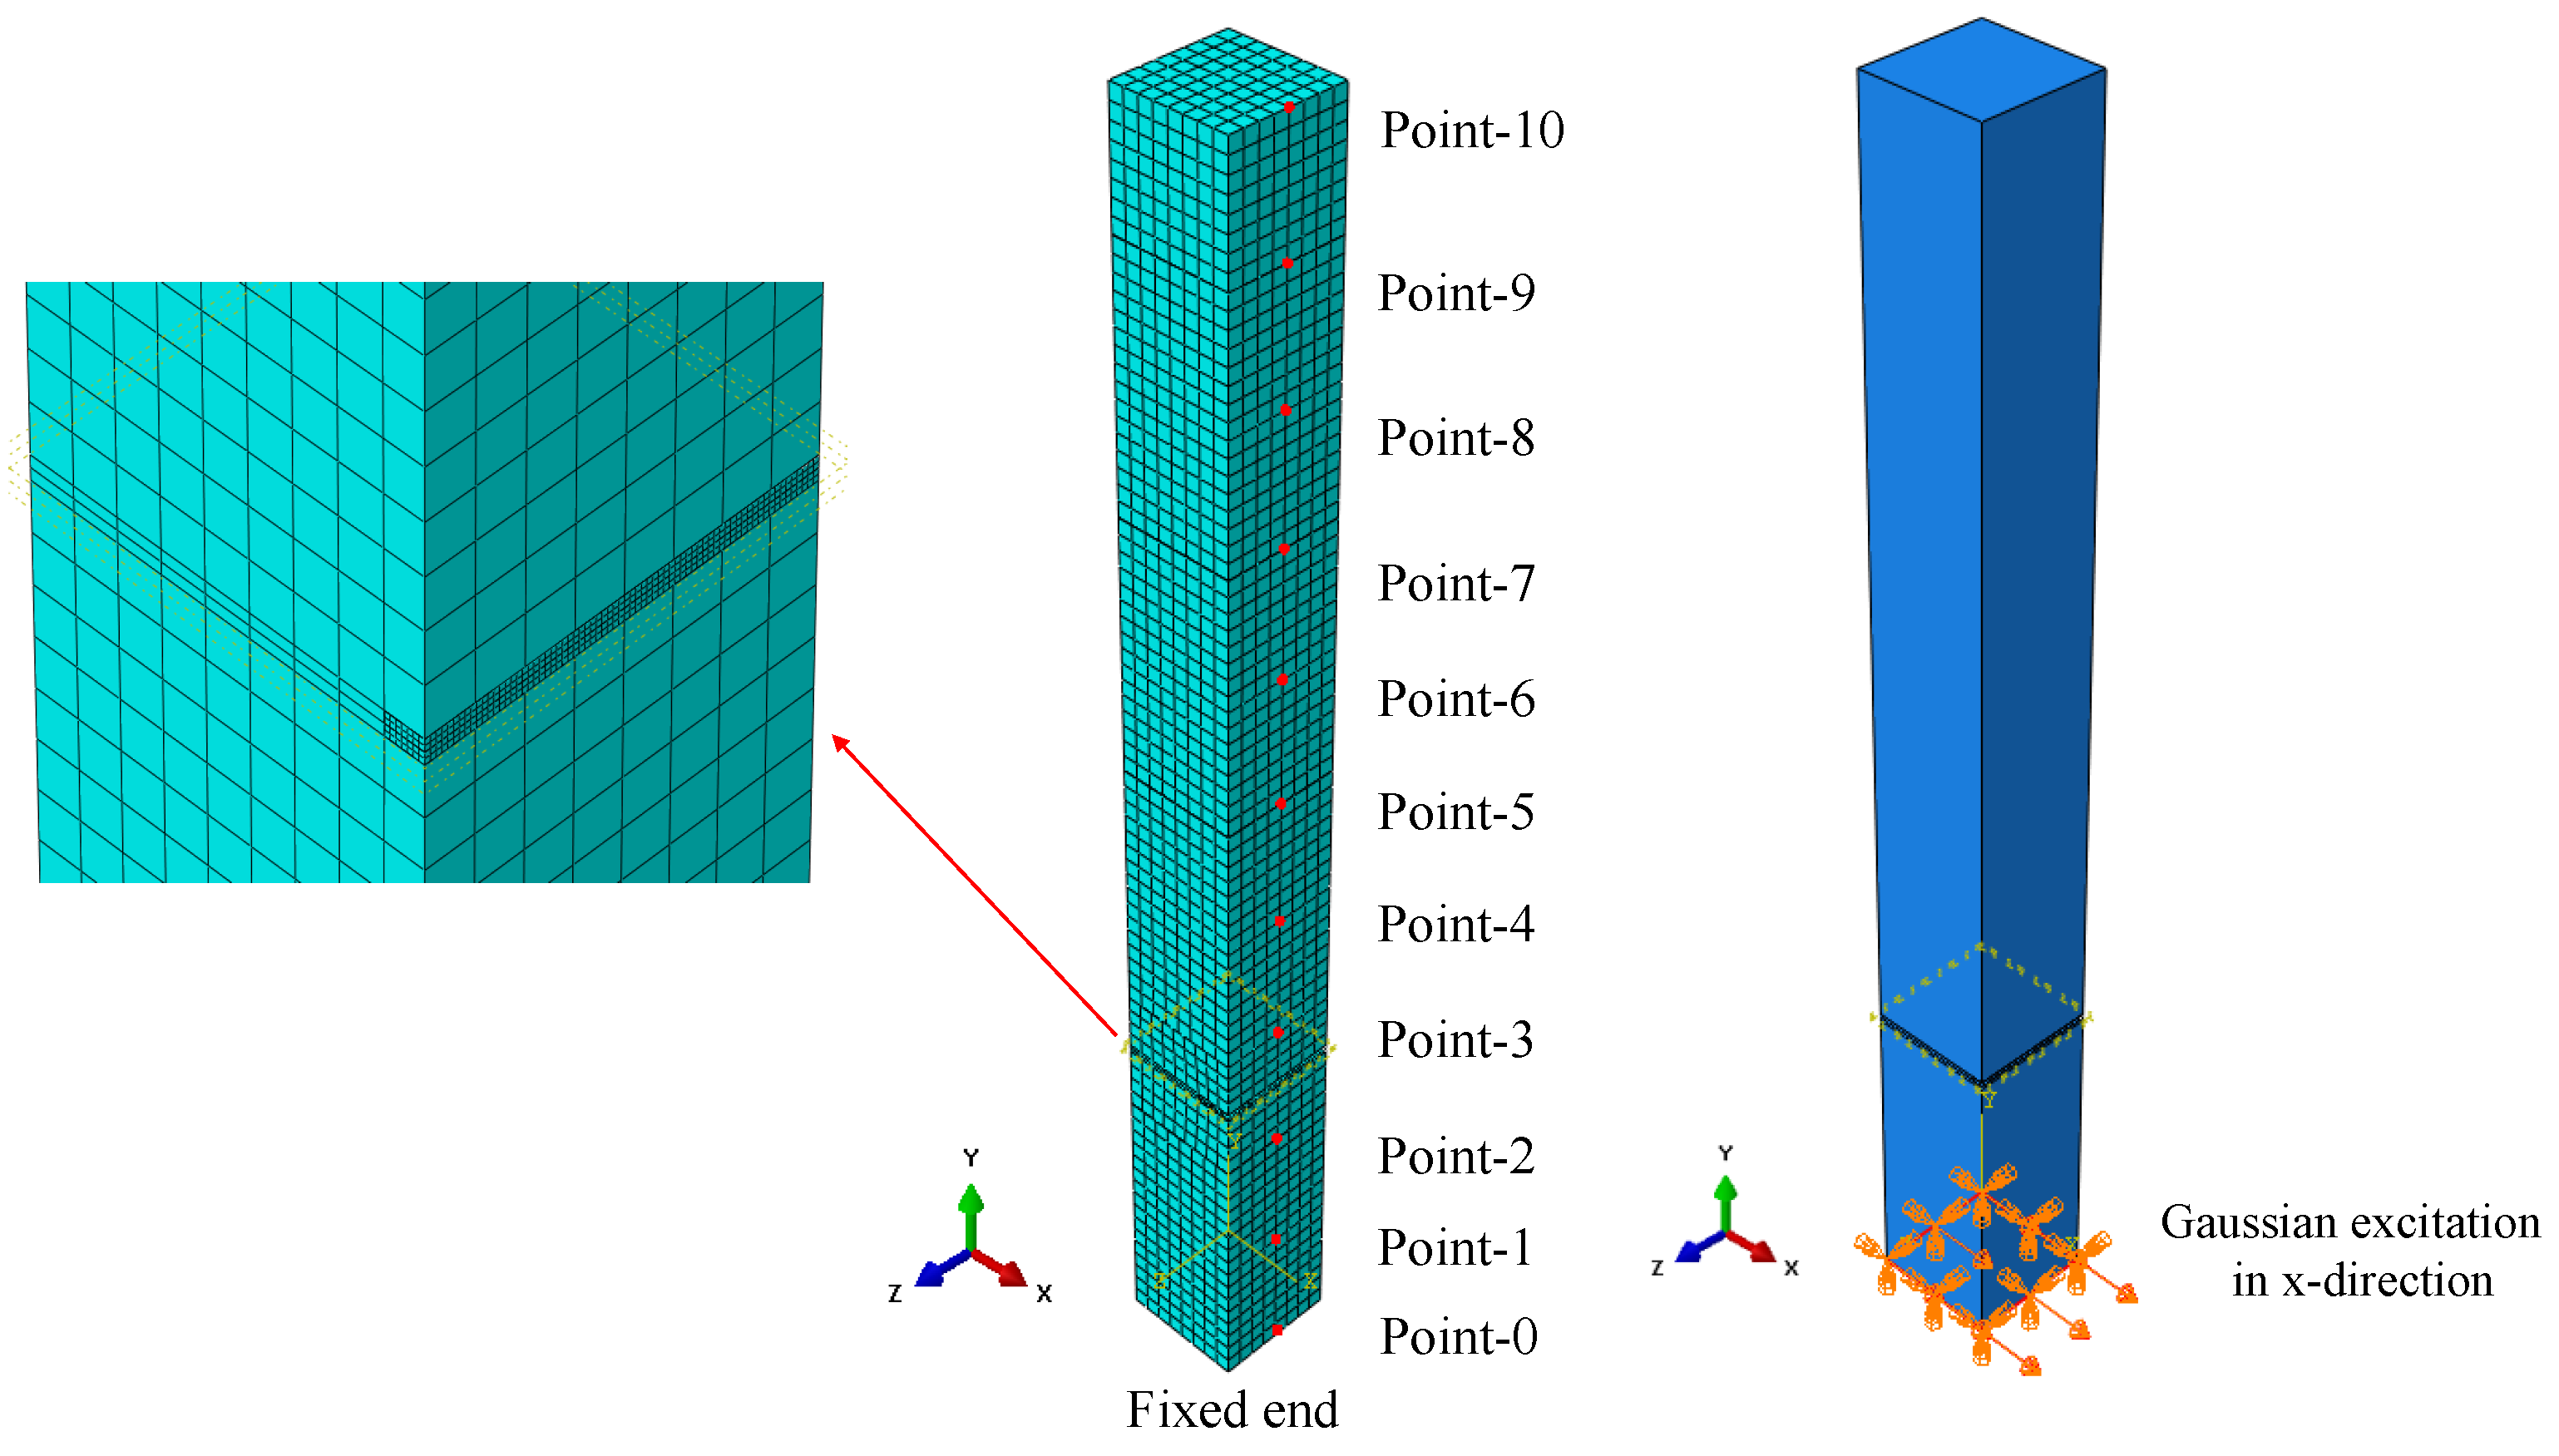
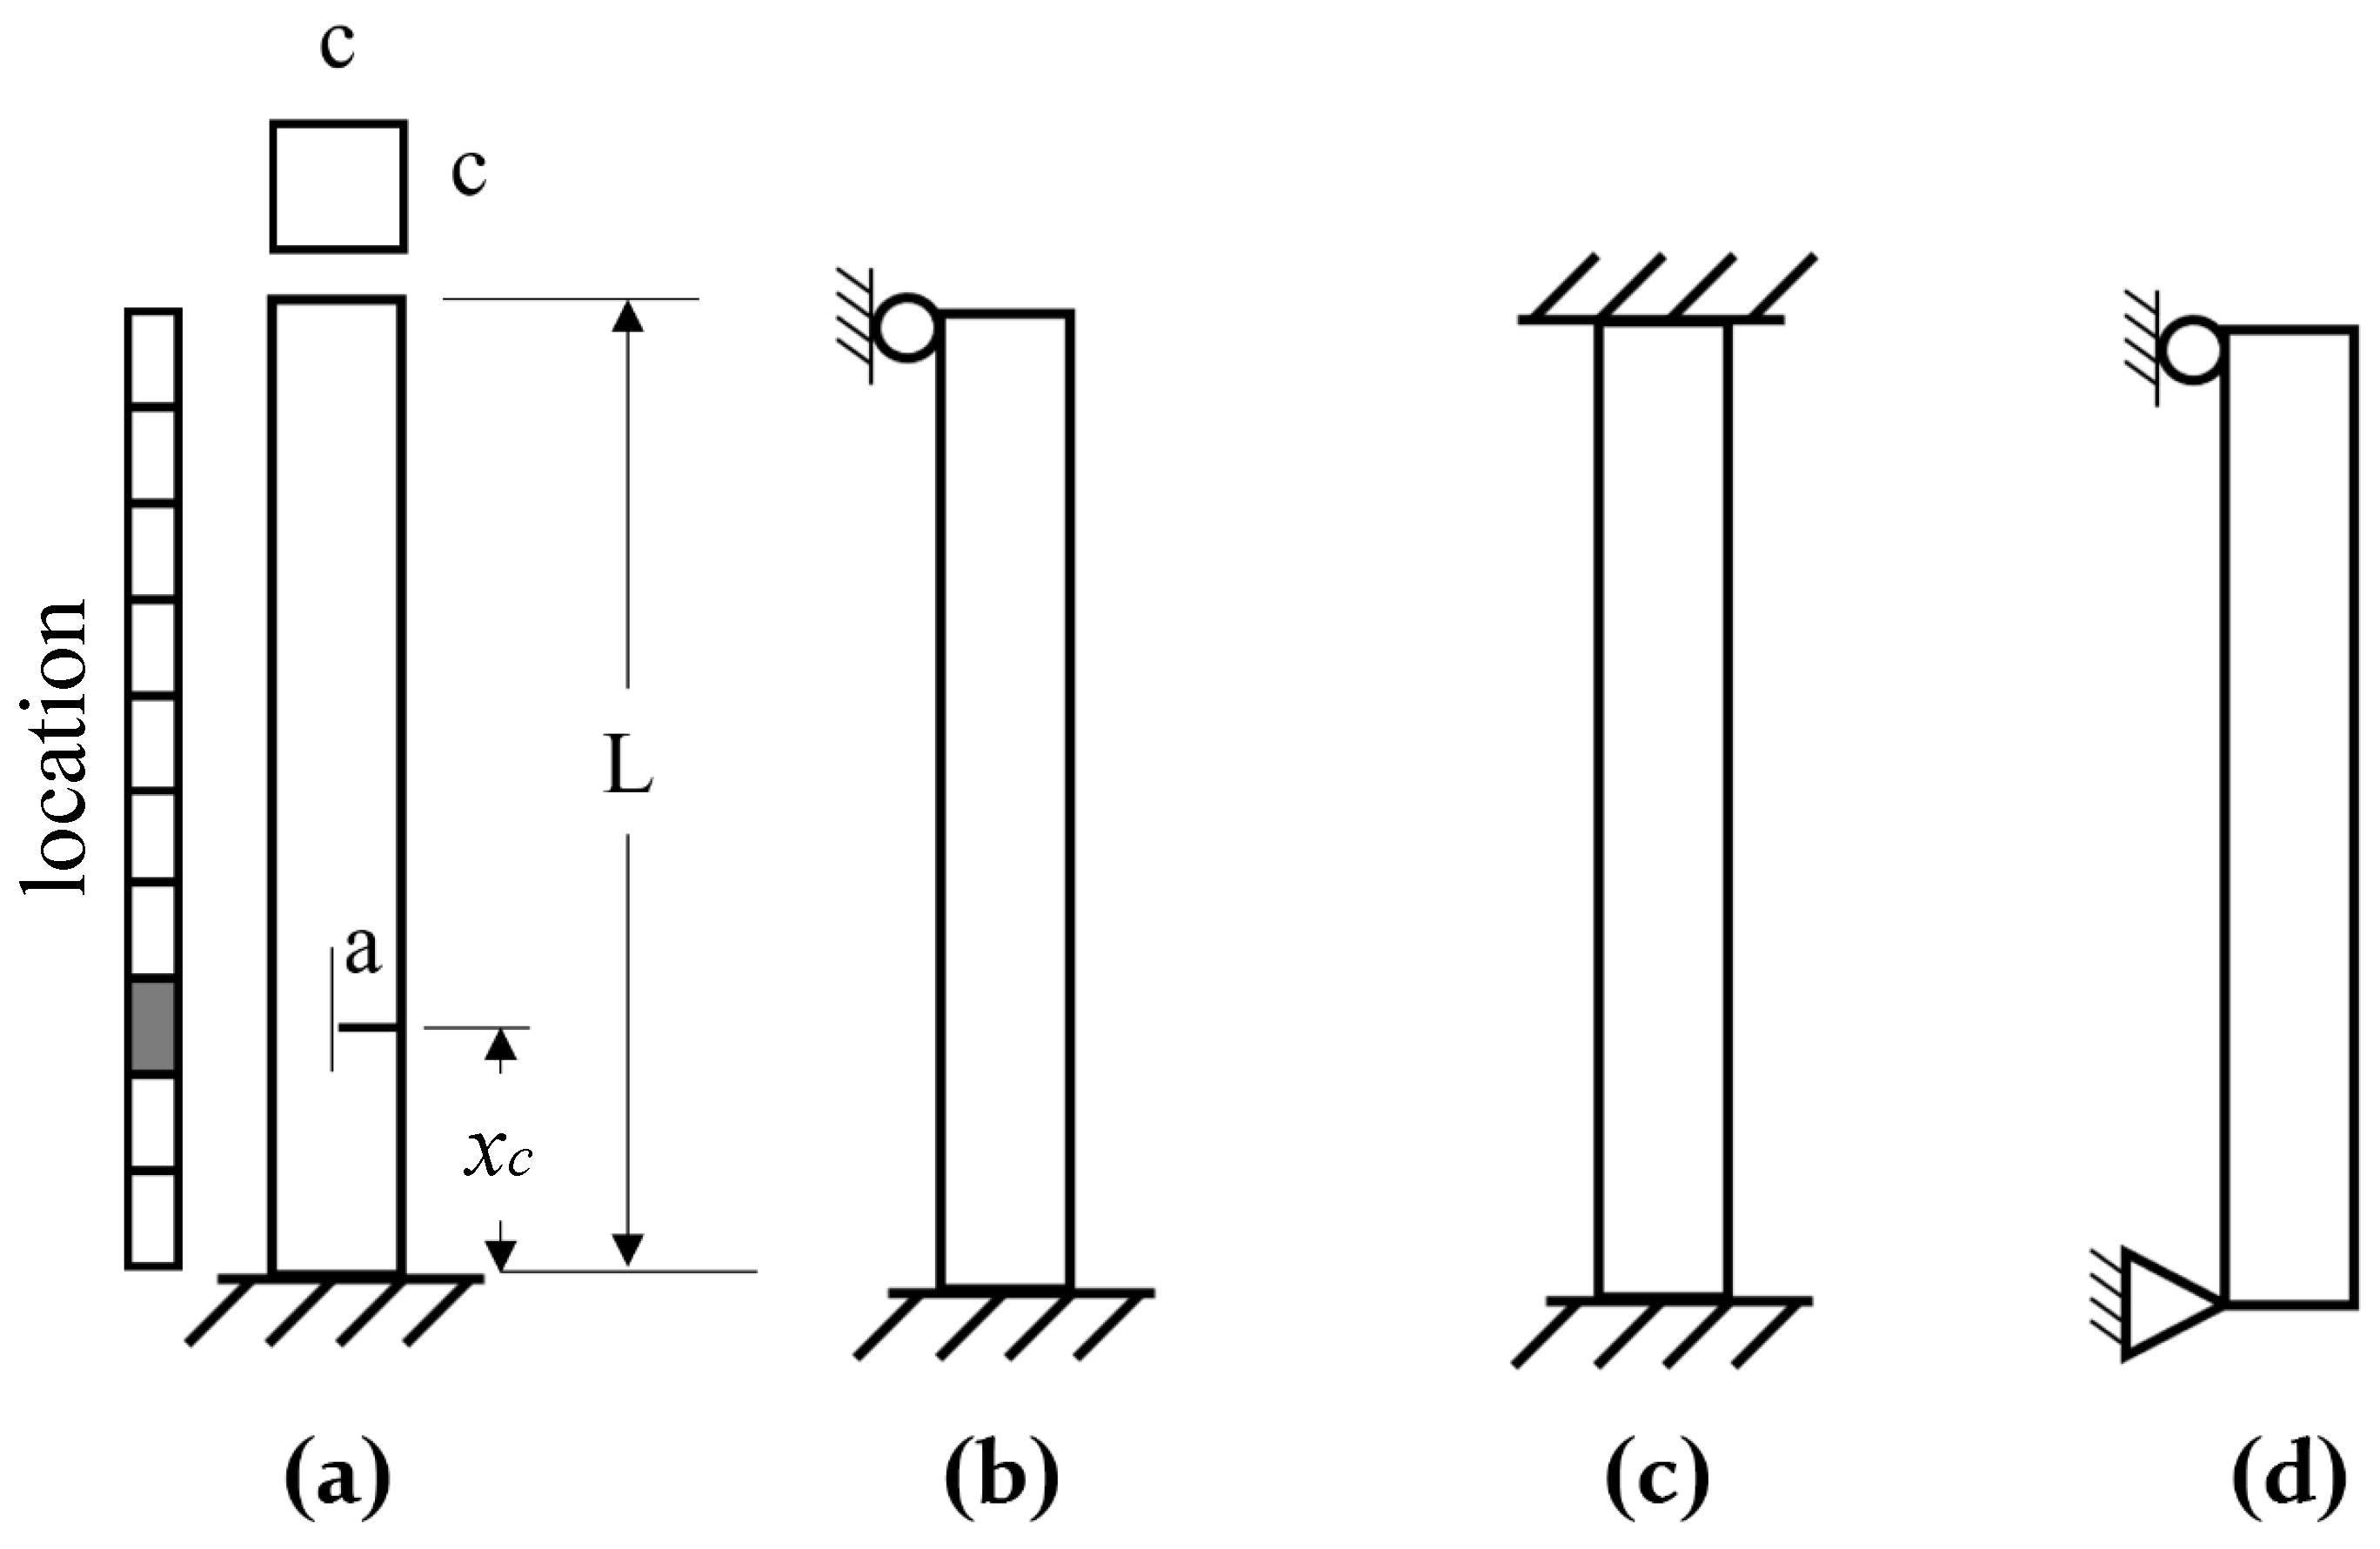
3. Numerical Simulation

This section presents some of the most likely damage scenarios and models with different depths and locations that may occur in beam structures. The nonlinear dynamic features of beam structures, including single-crack and multiple-crack scenarios, are collected using FEM and analyzed in MATLAB using time-domain methods.

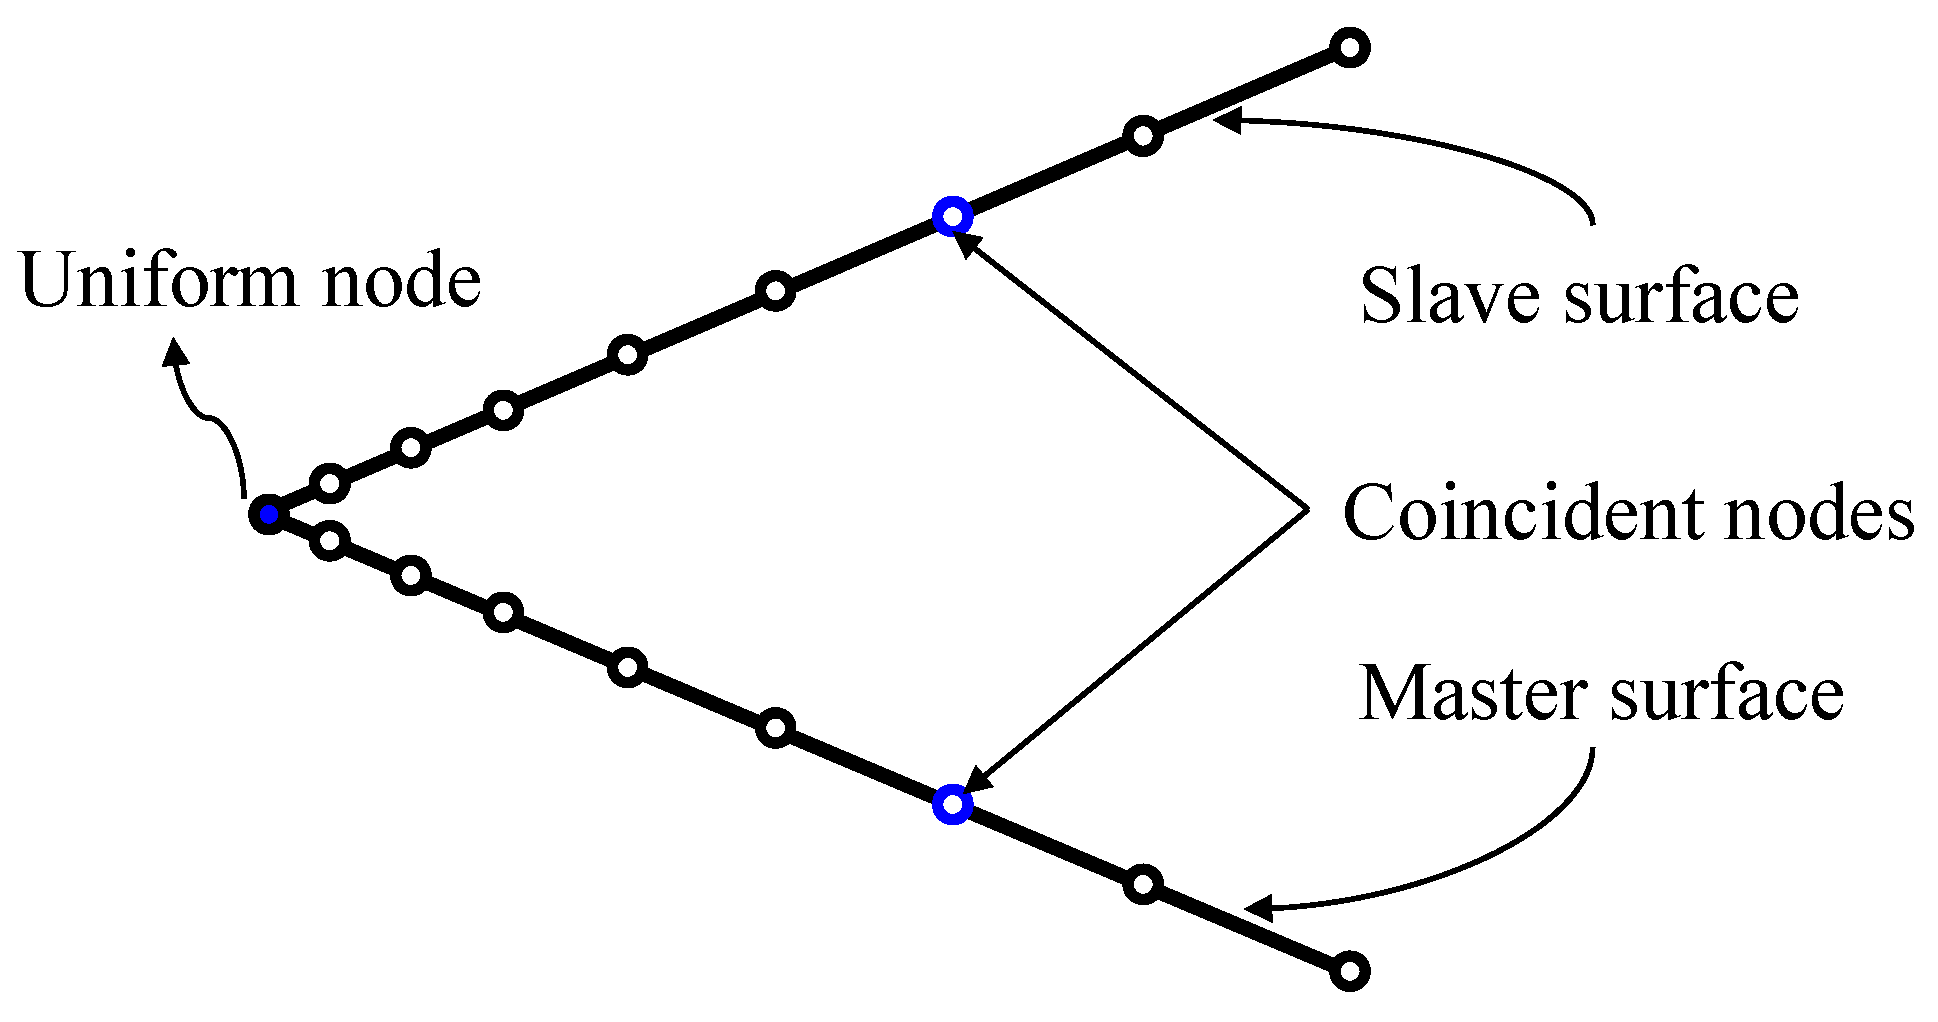
Modeling of Breathing Cracks

In this paper, the beam provided by Benfratello et al. [54] was adopted, but a 3D model is used here instead of a 1D model. Figure 2 shows a 3D FE model square section cantilever beam modeled using the ABAQUS FEM software with linear hexahedral elements of type C3D8R. The density of elements near the breathing cracks is increased to precisely capture the dynamic responses of the cracks. The geometrical parameters of the models are identical and chosen as a length L = 333.34 mm and square cross-section with the edge dimension c = 35 mm. The material properties of the beam used in the numerical simulation are selected as Young’s modulus E = 63.85 GPa, mass density ρ = 2860 kg / m 3 , and Poisson’s ratio = 0.3. The cantilever beam is excited using a white Gaussian noise excitation at the fixed end of the beam, while the measuring points are equally located at ten different locations along the beam surface to record the longitudinal displacements (i.e., the y-axis), as illustrated in Figure 2. The Rayleigh damping is used with a damping ratio of 0.015. In addition to the study of a cantilever beam, there are three other beams with different boundary conditions: the cantilever, simply supported beam, fixed-fixed beam, and the simply supported beam, as illustrated in Figure 3. The location and depth of breathing cracks are specified using the dimensionless parameters q = x c / L and p = a / c , respectively. The distance between the bottom of the beam and the crack location is x c , and a is the crack depth. Three different crack depths—3.5 mm ( p 1 = 0.1), 10.5 mm ( p 2 = 0.3), and 17.5 mm ( p 3 = 0.5)—are considered.
In this study, characterizing the opening and closing of the breathing cracks are treated as local contact problems. The contact pairs and the surface-to-surface contact are used [5,62]. The interactions between the breathing crack surfaces are modeled by considering one of the crack surfaces as a master surface and the second as a slave surface, as illustrated in Figure 4. During the vibration of beams, three contact states arise in the breathing crack: (i) the crack is fully opened, which means there is no contact between the slave and master surfaces; (ii) the crack is fully closed, and all nodes on the slave and master crack surfaces are in contact; (iii) the slave and master crack surfaces are in partial contact. In this paper, since the excitation is a random excitation represented by the Gaussian excitation, the opening and closing process of the breathing cracks is also random, and at any time instant, the state of the crack can be one of the three mentioned states of the crack.

4. Numerical Results and Discussions

This paper considers that the beams are vibrating under a ground acceleration modeled using white Gaussian noise. A time step Δ t = 0.0002 s and a sample size of 15,000 samples are adopted. Several damage models of different depths, locations, and boundary conditions are simulated using ABAQUS software. The time-history of the displacement responses is recorded from ten equally distributed points along the beam. Time-domain methods (i.e., skewness, kurtosis, and Shannon entropy) are applied to the displacements in the time-domain to determine the skewness and kurtosis coefficients and Shannon entropy to detect fatigue cracks. The first two natural frequencies of the intact beams of different boundary conditions are listed in Table 1. The white Gaussian noise excitation is illustrated in Figure 5. Figure 6, Figure 7, Figure 8 and Figure 9 present the Sampling intervals vs. displacement responses of beams with different boundary conditions. The corresponding crack depths and locations are ( p 1 = 0.1, p 2 = 0.3, and p 3 = 0.5) and ( q 1 = 0.25, q 2 = 0.45, and q 3 = 0.65), respectively.

4.1. Single Breathing Crack

This section discusses the effectiveness and sensitivity of the three methods (i.e., skewness, kurtosis, and Shannon entropy) to detect and localize a single breathing crack in beams at three different depths. Here, four boundary conditions have been studied and analyzed.

4.1.1. Case Study 1

This section presents the results of the numerical investigations of a cantilever beam containing a single breathing crack with three different locations. The beams are excited at the bottom (point-0) by white Gaussian noise excitation in the x-direction. The beam contains a single breathing crack with three different cases, located at 83.35 mm ( q 1 = 0.25), 150.03 mm ( q 2 = 0.45), and 216.71 mm ( q 3 = 0.65) from the bottom to top, respectively. Three different crack depths, which are 3.5 mm ( p 1 = 0.10), 10.5 mm ( p 2 = 0.30), and 17.5 mm ( p 3 = 0.50) of the total beam heights, are modeled. The results of longitudinal displacements recorded from ten points uniformly distributed along the cantilever beam are analyzed using three methods, skewness, kurtosis, and the Shannon entropy. The three methods are compared to determine their sensitivity to detect and locate breathing cracks.
Figure 10, Figure 11 and Figure 12 present the results of the analyzed cantilever beam for the skewness, kurtosis, and Shannon entropy as a function of the crack locations, respectively. The shaded places on the horizontal axis of plots indicate the crack locations in beams. The results show that the three methods are sensitive to the presence of breathing cracks in all studied locations, where the most sensitive method is the Shannon entropy method, which was almost sensitive to all depths. The sensitivity of the methods to the crack locations is evident from the jump between the two sides of the crack, which indicates the location of the crack. The jump is more apparent when the crack depth is significant and gradually decreases as the crack depth decreases. The results demonstrated that the three methods work well with a cantilever beam and provide valuable information about the crack presence and location.

4.1.2. Case Study 2

This section displays the results of the numerical investigations of a cantilever, simply supported beam containing a single breathing crack with three different locations. The cracks’ depths, locations, and excitations are similar to those used in case study 1. The three methods are compared to assess their sensitivity to boundary conditions and their capability to detect and localize breathing cracks.
Figure 13, Figure 14 and Figure 15 show the analyzed results of the cantilever, simply supported beam for the skewness, kurtosis, and Shannon entropy methods as a function of the crack locations, respectively. The results show that all methods are sensitive when p 2 = 0.3 and p 3 = 0.5 and less sensitive for p 1 = 0.1, where the jump between the crack sides indicates the location of the crack.
The results demonstrated that the Shannon entropy method is the best, followed by the skewness coefficient method. The jump is more noticeable when the crack depth is significant and gradually decreases as the crack depth decreases, as observed from the curves of the second and third depths. It can be concluded that the three methods are capable of detecting single breathing cracks with different sensitivities, providing helpful information about the crack presence. However, the Shannon entropy method is accurate and can detect and localize single breathing cracks at different depths and locations.

4.1.3. Case Study 3

This section is concerned with analyzing the results of numerical investigations of a fixed-fixed beam containing a single breathing crack at three different depths and locations. The crack depths, locations, and excitations are similar to those used in cases 1 and 2. Additionally, here, the sensitivity of the three methods is tested to determine their ability to detect and localize single breathing cracks. Figure 16, Figure 17 and Figure 18 present the numerical results of the fixed-fixed beam applying the skewness, kurtosis, and Shannon entropy methods as a function of the crack locations, respectively. The results confirm that all methods are eligible to detect the presence of fatigue cracks. However, the Shannon entropy method is superior in detecting and localizing breathing cracks in all studied depths and locations, where the jump between the crack sides indicates the location of the crack. It can be concluded that the Shannon entropy method is the most reliable for detecting and localizing breathing cracks in a fixed-fixed beam. However, the three methods can produce valuable information concerning the crack presence.

4.1.4. Case Study 4

This section aims to analyze the results of numerical investigations of a simply supported beam with a single breathing crack at three different depths and locations. The crack depths, locations, and excitations are similar to those used in cases 1, 2, and 3. Similar to the previous cases, the three time-domain methods are also examined for their ability to detect and localize single breathing cracks in a simply supported beam.
Figure 19, Figure 20 and Figure 21 show the numerical outcomes of a simply supported beam employing the skewness, kurtosis, and Shannon entropy methods as a function of the crack locations, respectively. The results prove that the three methods are suitable for detecting fatigue cracks. However, the skewness and Shannon entropy methods provide excellent results for detecting and localizing breathing cracks for each location. The jump between the two sides of the crack is noticeable, indicating the location of the crack. However, the kurtosis method can also provide important information about the presence and location of the crack but are less sensitive than the skewness and Shannon entropy methods.
It can be concluded from the previous results that the proposed techniques differ in their ability to detect the smallest crack depth in this research depending on the location of the crack and the type of boundary conditions. The results show that the Shannon entropy method is superior to the skewness coefficient method, followed by the kurtosis coefficient method for a single breathing crack localization, as shown in Table 2. Table 2 shows a clear superiority of the Shannon entropy method, indicating its effectiveness in locating the smallest depth in this research at a crack depth of ( p = 0.1) in almost all scenarios, followed by the skewness coefficient method and then the kurtosis coefficient method. Moreover, in order to know the ability of the three methods to identify smaller depths, they are tested in identifying a very small depth of about p = 5% at q = 0.25 of a cantilever beam. The results support the previous conclusion in the superiority of the Shannon entropy method for locating the crack, followed by the skewness coefficient method, while the kurtosis method can in almost cases detect the presence of a crack. Based on the previous results, it can be said that the Shannon entropy method is a promising method for detecting and locating breathing cracks, even at a very small depth of the crack, as illustrated in Figure 22.

4.2. Effect of the Number of Measuring Points in Locating Breathing Cracks

There is no doubt that reducing the number of measurement points is desirable in identifying structural damage in terms of ease and economy in practical applications. However, in some cases, the appropriate number of measuring points should be used in order to identify the exact location of the damage.
Figure 23, Figure 24 and Figure 25 show the effect of reducing the number of measurement points (sensors) on locating the crack in a cantilever beam using skewness, kurtosis, and Shannon entropy methods, respectively. In this analysis, the odd points (i.e., 1, 3, 5, 7, and 9) are selected as measurement points (see Figure 2). When reducing the number of measurement points, the distance between them increases, so the jumps on the plots that indicate the location of the crack will have a larger horizontal length, so the area within which the damage is located becomes larger, which may require further detection within this field in order to determine the exact location of the crack. It is also noted that the Shannon entropy method is powerful and can detect and localize a single breathing crack even at a depth of p = 5%. However, the possibility of increasing the number of measurement points in practice is expensive and complex, so the optimum selection of the number of measuring points is vital in order to determine the crack and gather between simplicity and accuracy.

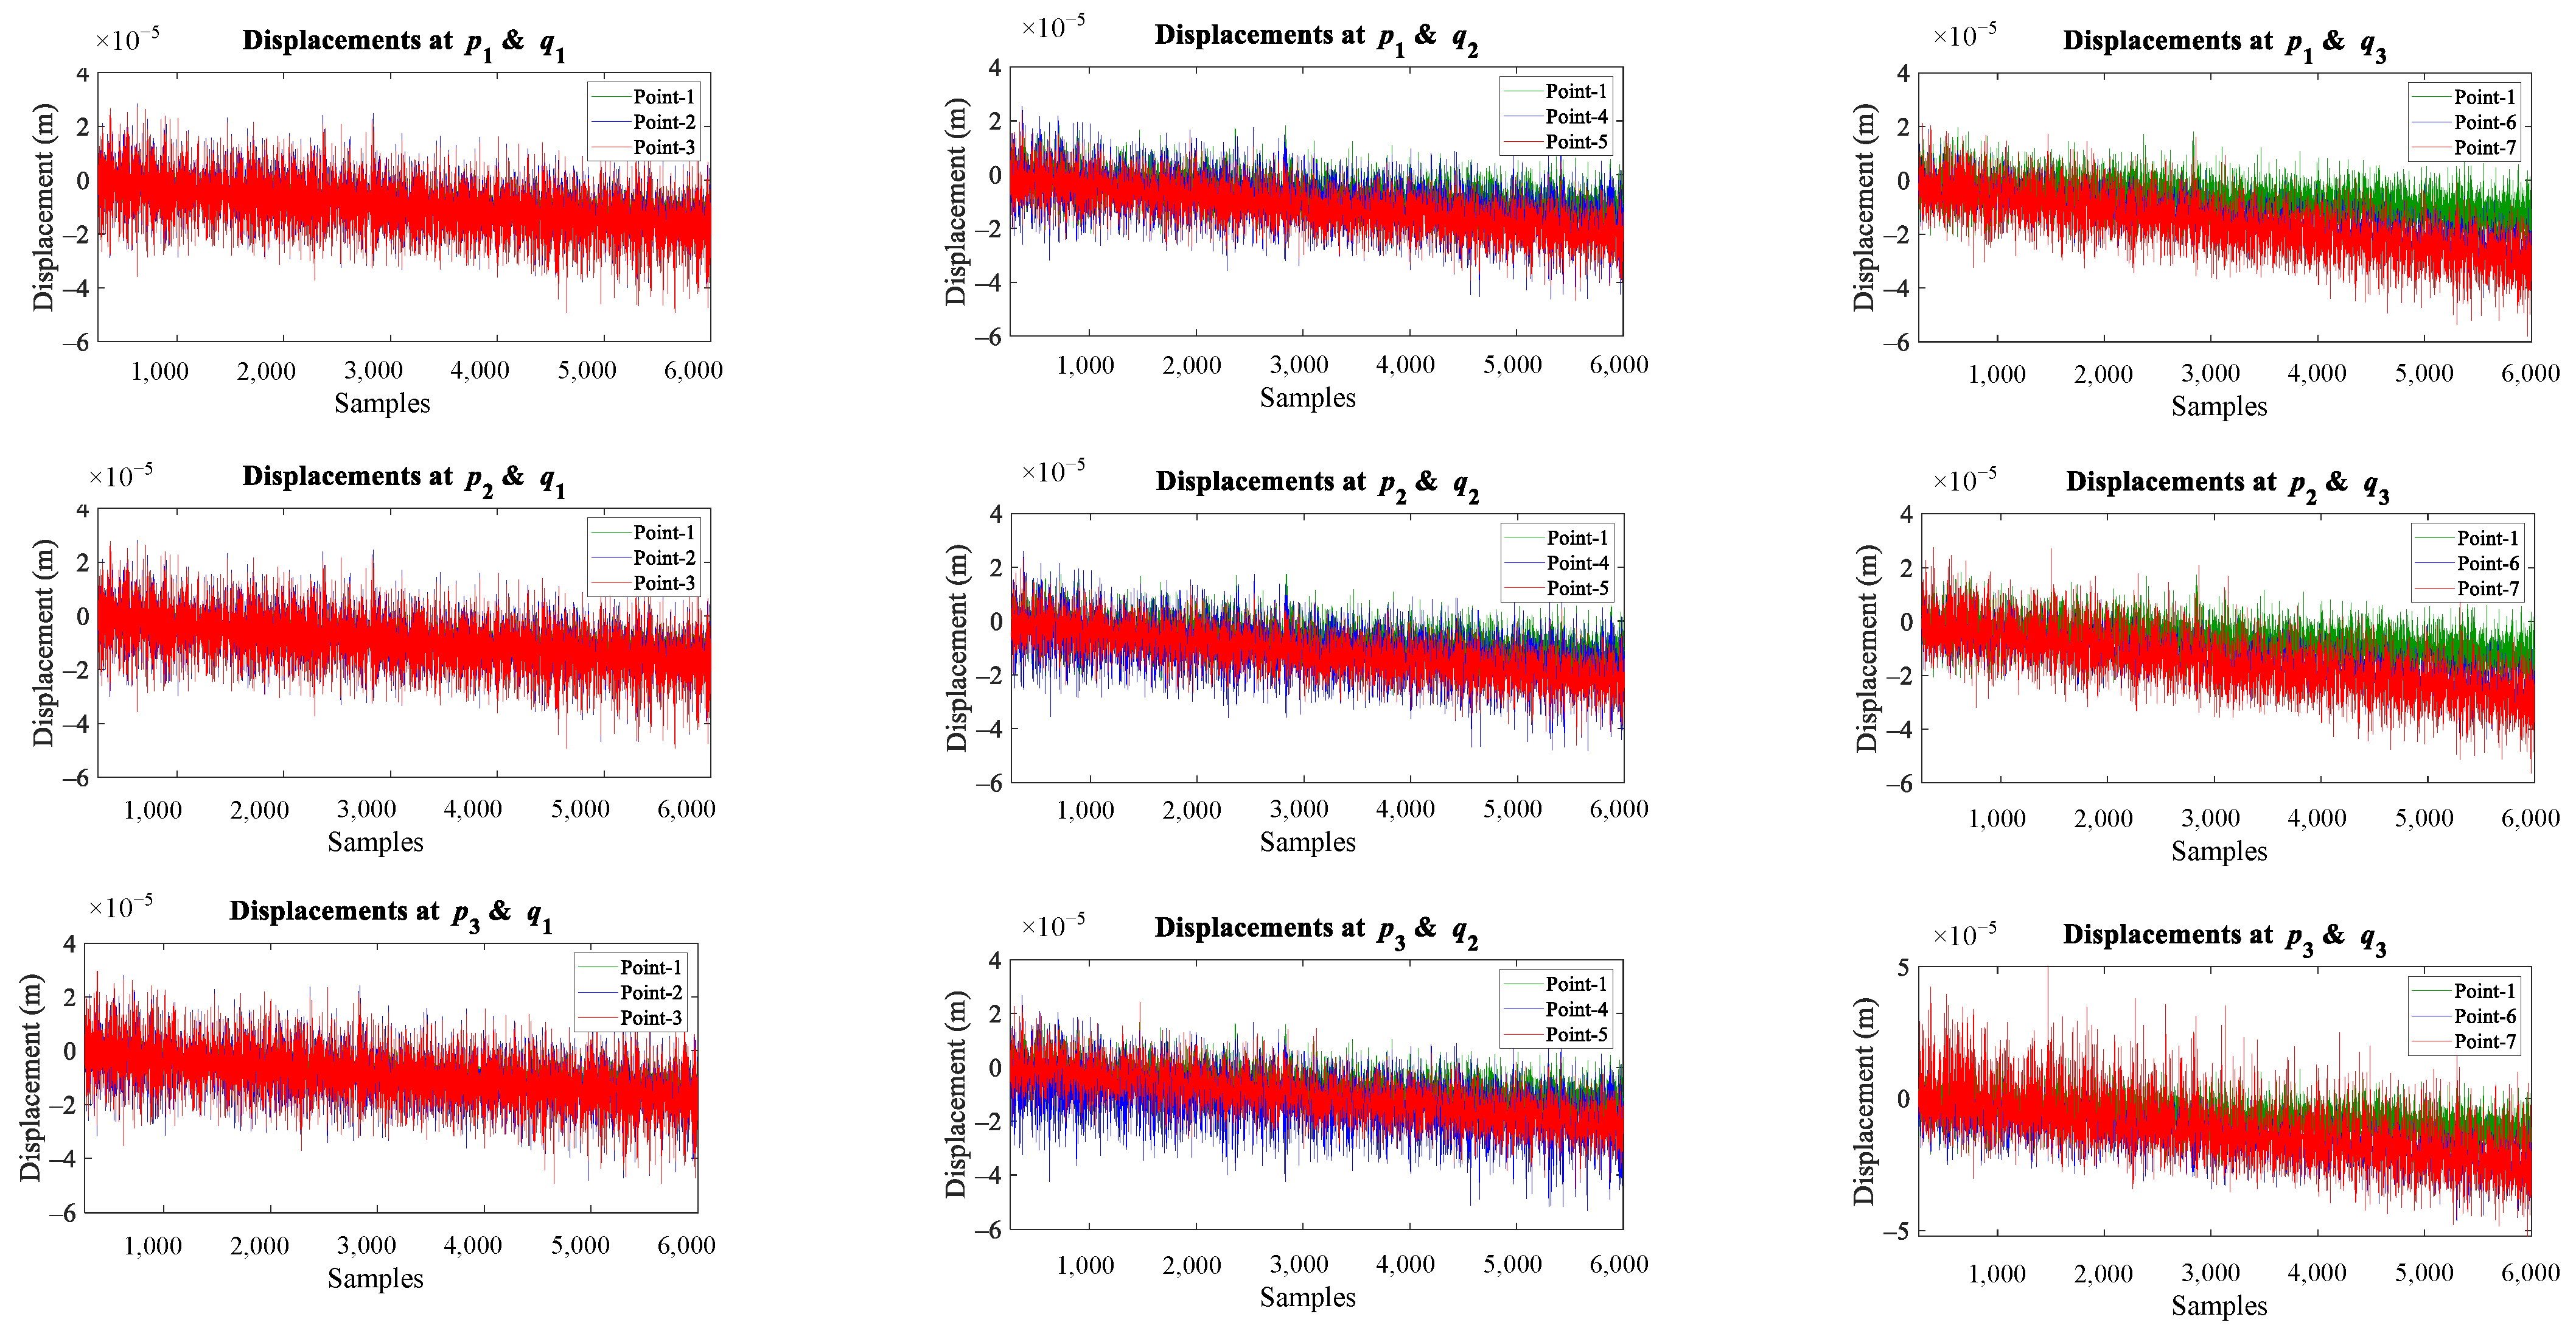
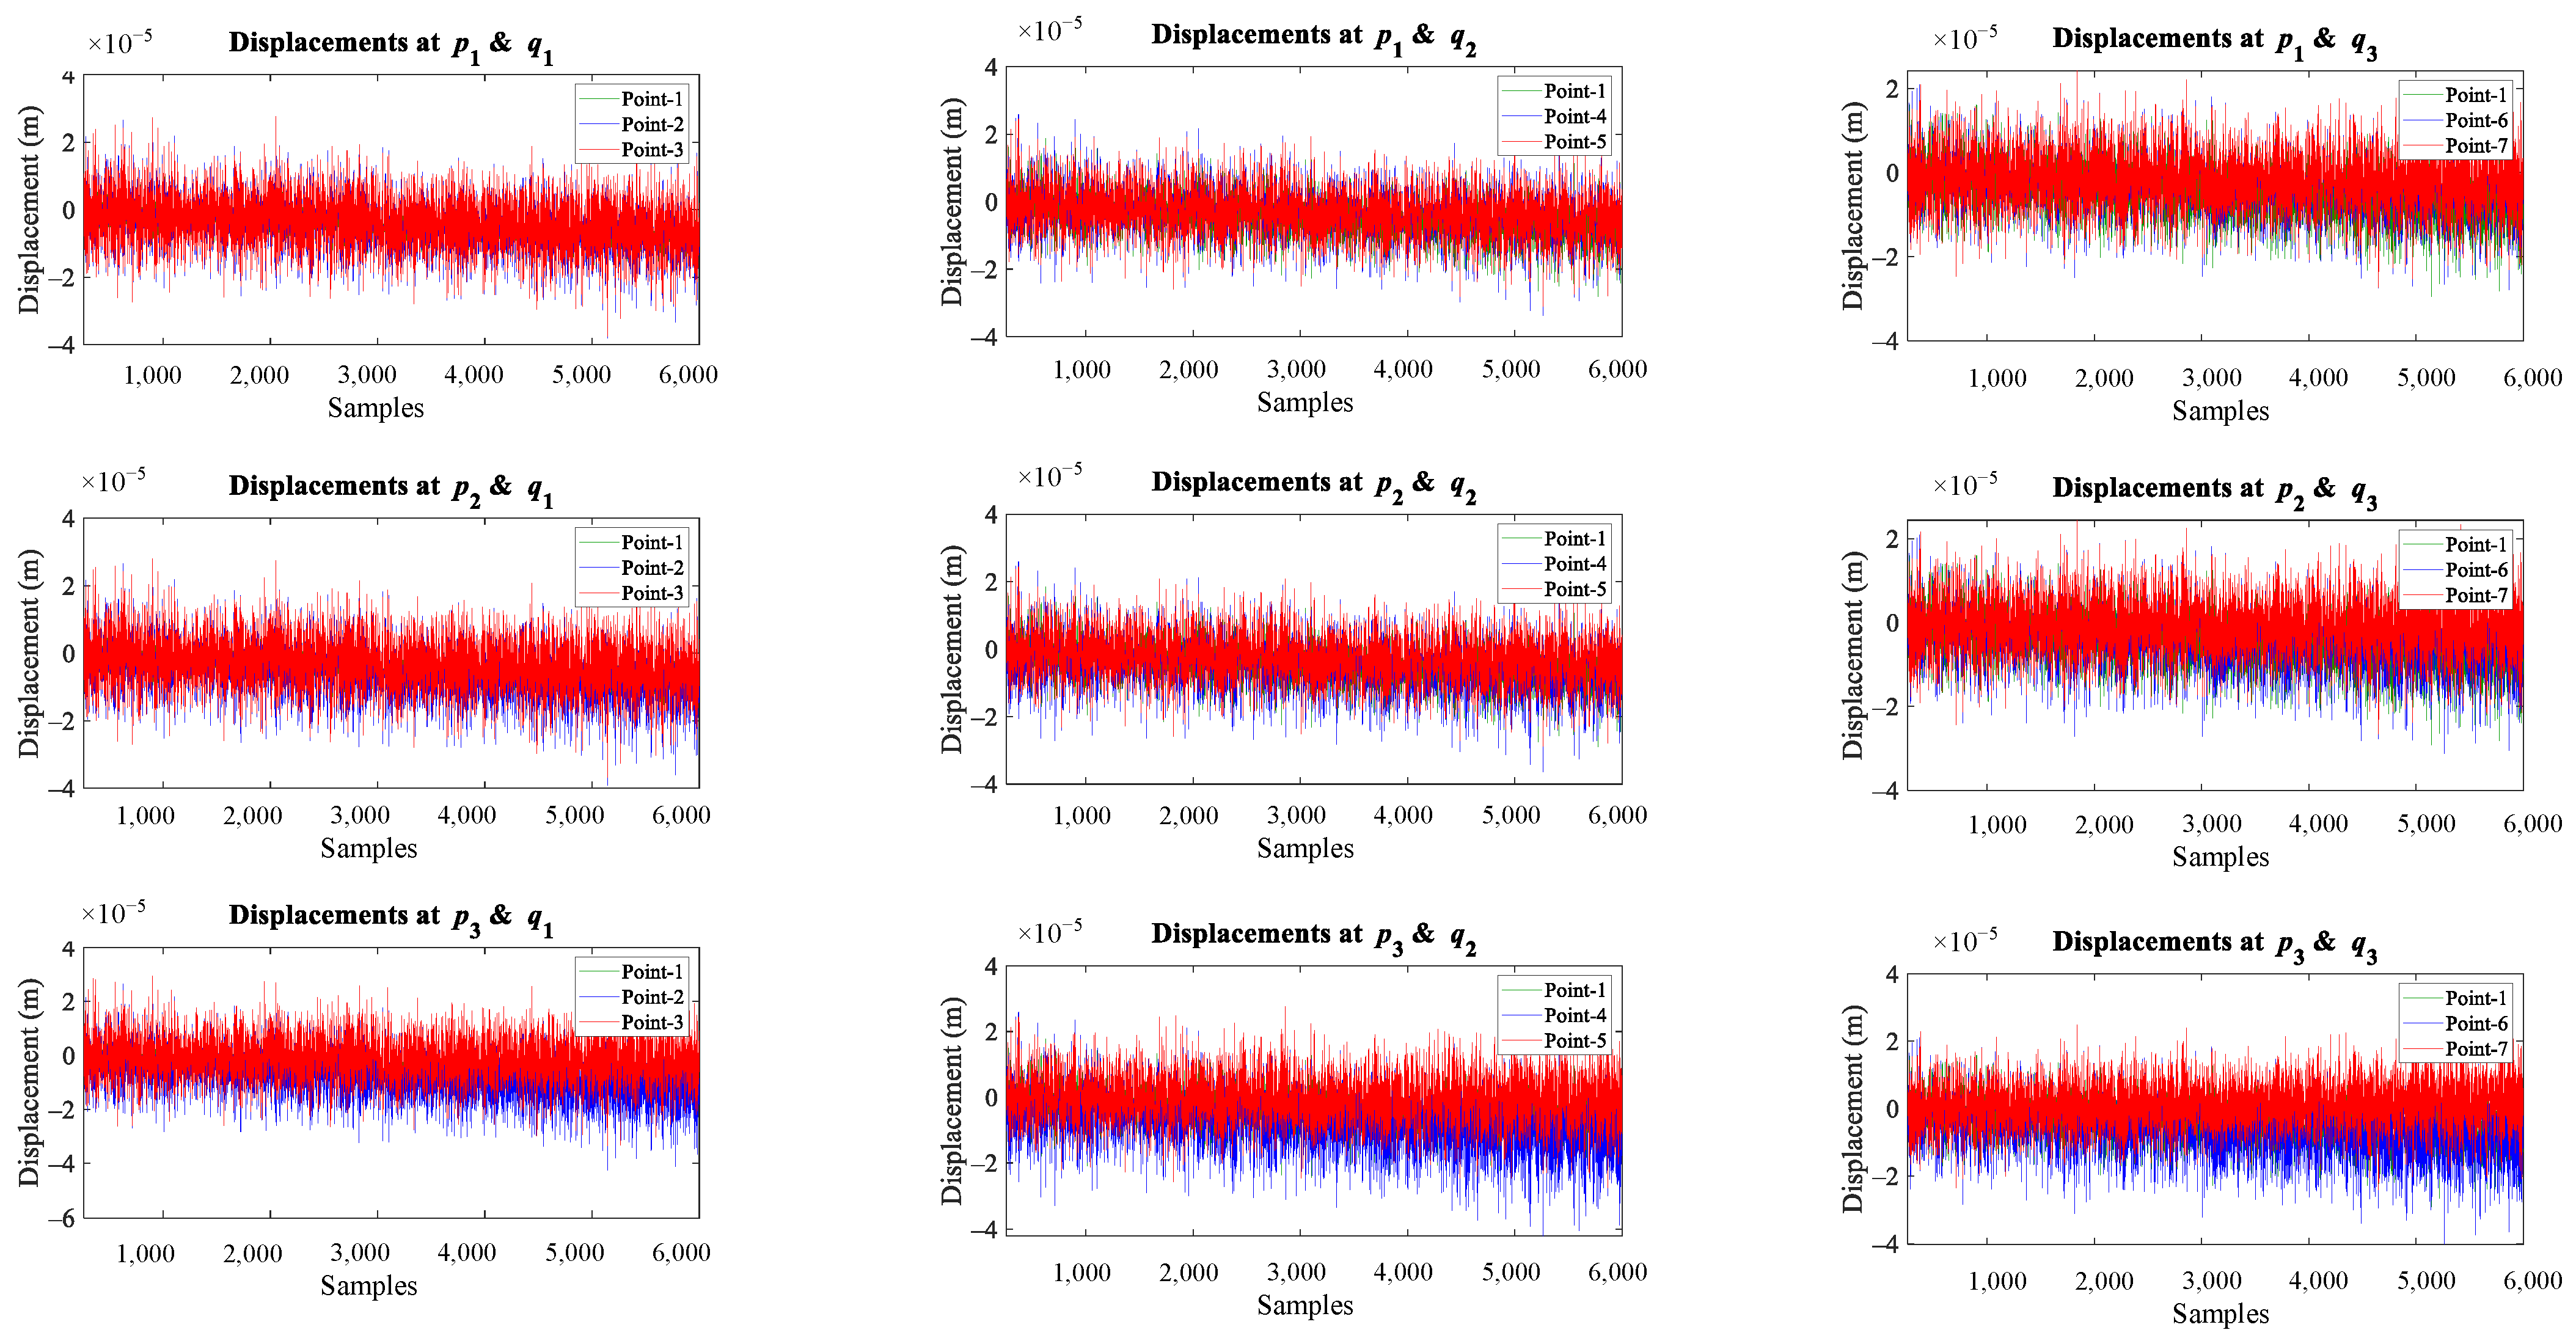
4.3. Effect of Spatial Location of Load on Breathing Crack Identification

The study of the spatial sensitivity of the applied load is important to know the potential of the proposed methods in practical applications. A large amount of data is required to better estimate the current results when using statistical methods.
Changing the spatial location of the load on the structure affects the sensitivity of the methods in identifying the breathing crack [39]. The application of the excitation load in the vicinity of the breathing crack in the structure increases the degree of non-linearity present in the vibration response, which is much higher than the response due to the same excitation force applied at the farthest point. In this paper, in order to study the sensitivity of the spatial location of the applied load to identify the breathing crack, the three methods are investigated at three different crack locations, and the response is measured in locations adjacent to and distant from the crack under different spatial locations of the exciting load.
Figure 26, Figure 27 and Figure 28 show some examples of the effect of changing the spatial location of the excitation load applied to a cantilever beam with a single breathing crack at different crack locations and p 3 = 0.5 using skewness, kurtosis, and entropy, respectively. The skewness coefficients and Shannon entropy methods exhibit excellent performance in almost all cases in detecting and locating breathing cracks (see Figure 26 and Figure 28), respectively. However, the quality of the results using the kurtosis coefficient method is not very good but can still provide helpful information about the crack’s presence and location (see Figure 27).
Figure 29, Figure 30 and Figure 31 show some examples of the influence of changing the spatial location of the excitation load applied to a simply supported beam with a single breathing crack at different crack locations and p 3 = 0.5 using skewness, kurtosis, and entropy, respectively. The Shannon entropy method demonstrates outstanding performance in detecting and locating breathing cracks in all cases (see Figure 31), followed by the skewness coefficient method (see Figure 29). However, when using the kurtosis method, the results are ambiguous and produce visibly poor results in locating breathing cracks in a simply supported beam, as illustrated in Figure 30. Interestingly, these approaches work well in detecting and locating breathing cracks when applying the excitation load at point-0.
The outcome of various investigations concluded that the Shannon entropy method demonstrated better performance in detecting and locating breathing cracks under two different boundary conditions and diverse spatial locations of the applied load. The results show that the sensitivity of the spatial location of loading in breathing crack identification varies according to the crack location and the type of boundary conditions. Therefore, the spatial location of the exciting load should be chosen appropriately, especially with skewness coefficients and kurtosis coefficients methods, in order to obtain accurate results (noticeable jump) for locating the breathing crack, as some points give good results and some do not. Regardless of the ability of the methods to locate the crack, all methods are capable of detecting the presence of the crack in the structure. However, the results show that choosing point-0 in our analysis is appropriate for detecting and locating the breathing crack in most studied cases.

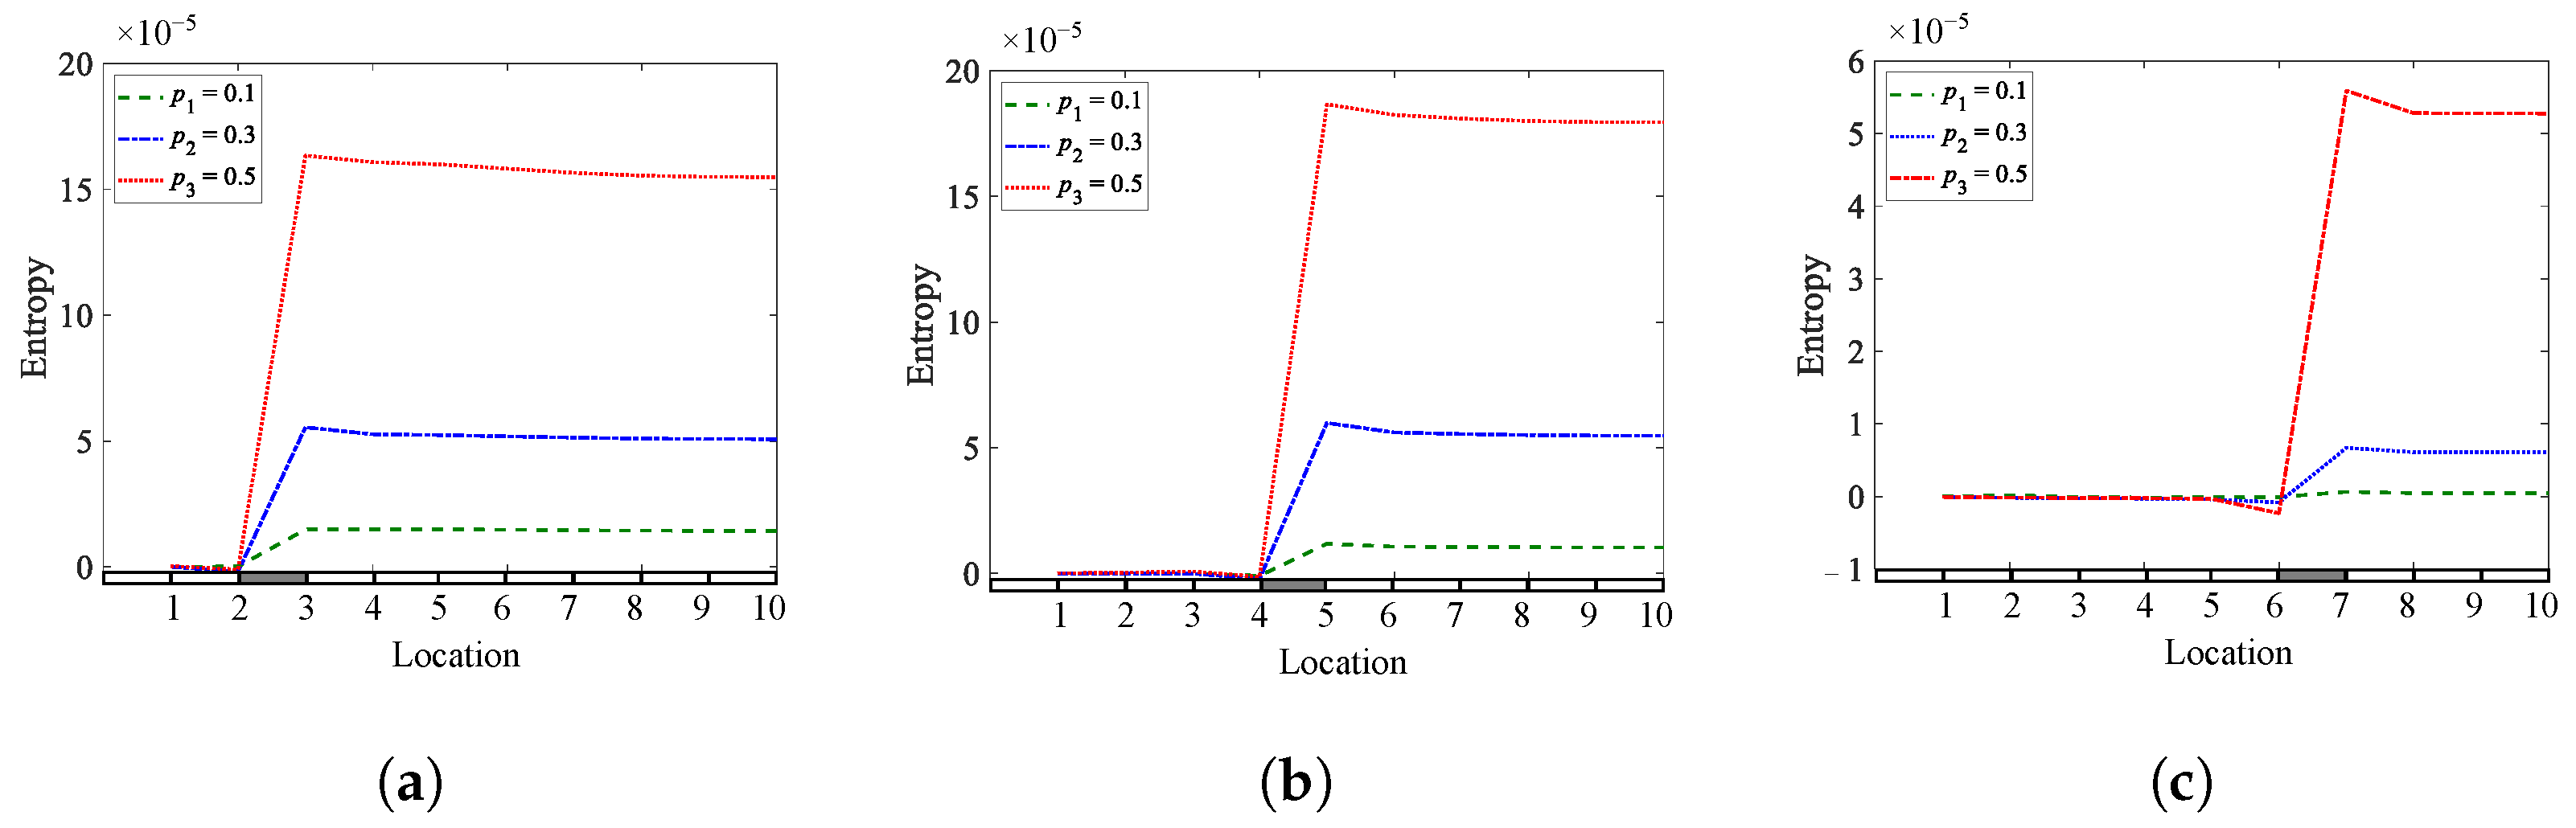
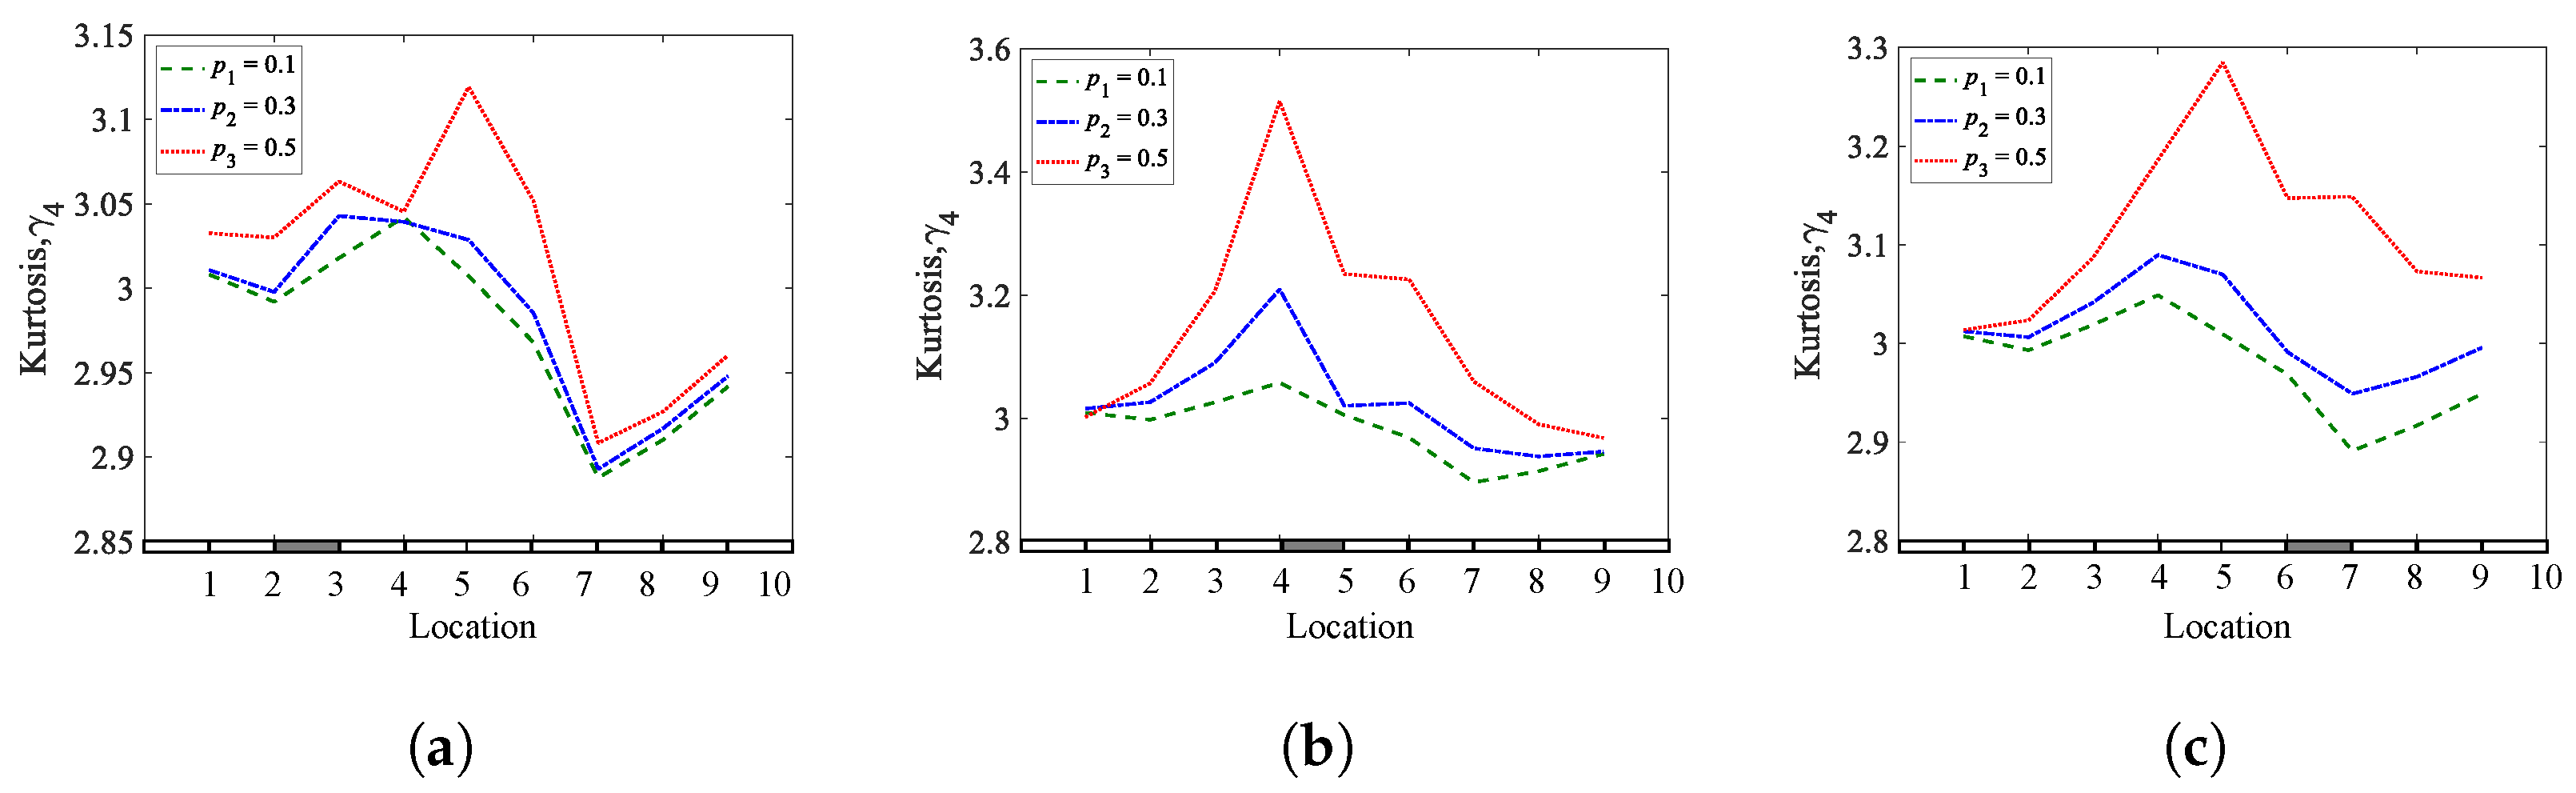
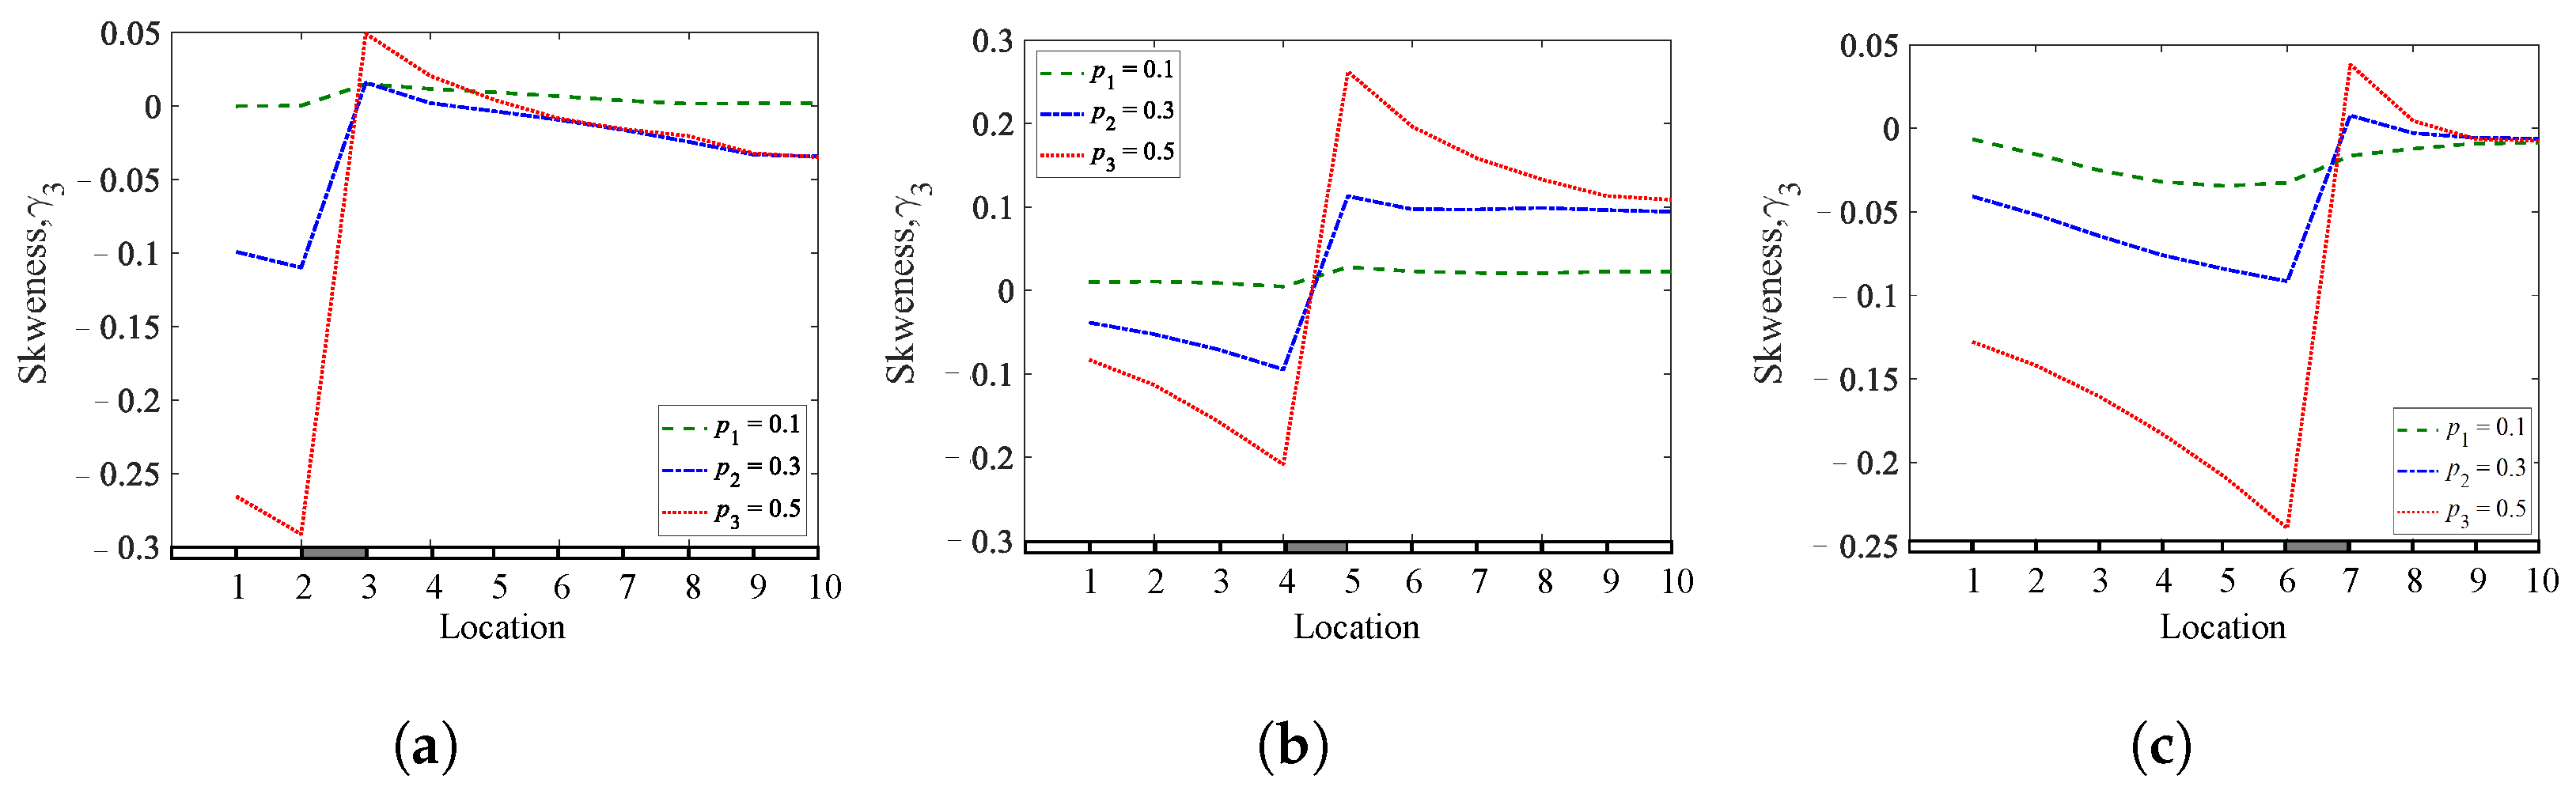
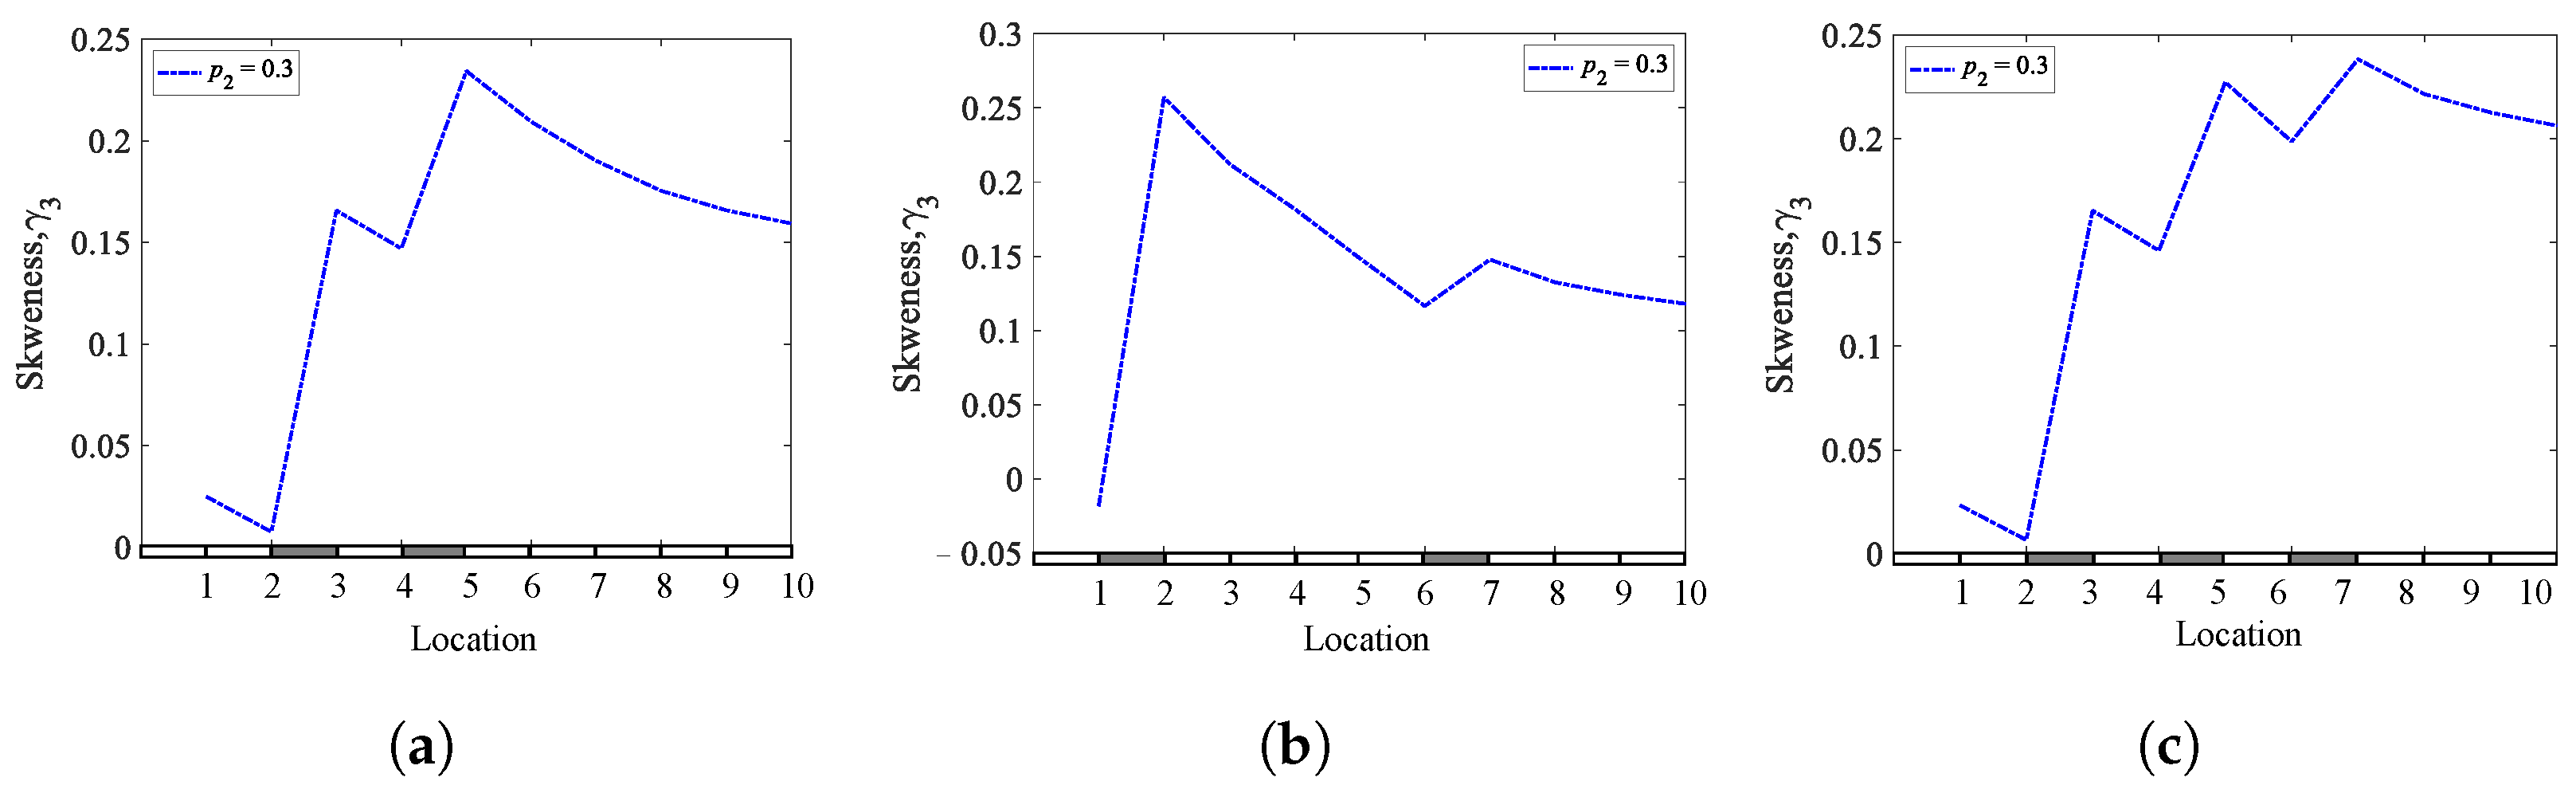
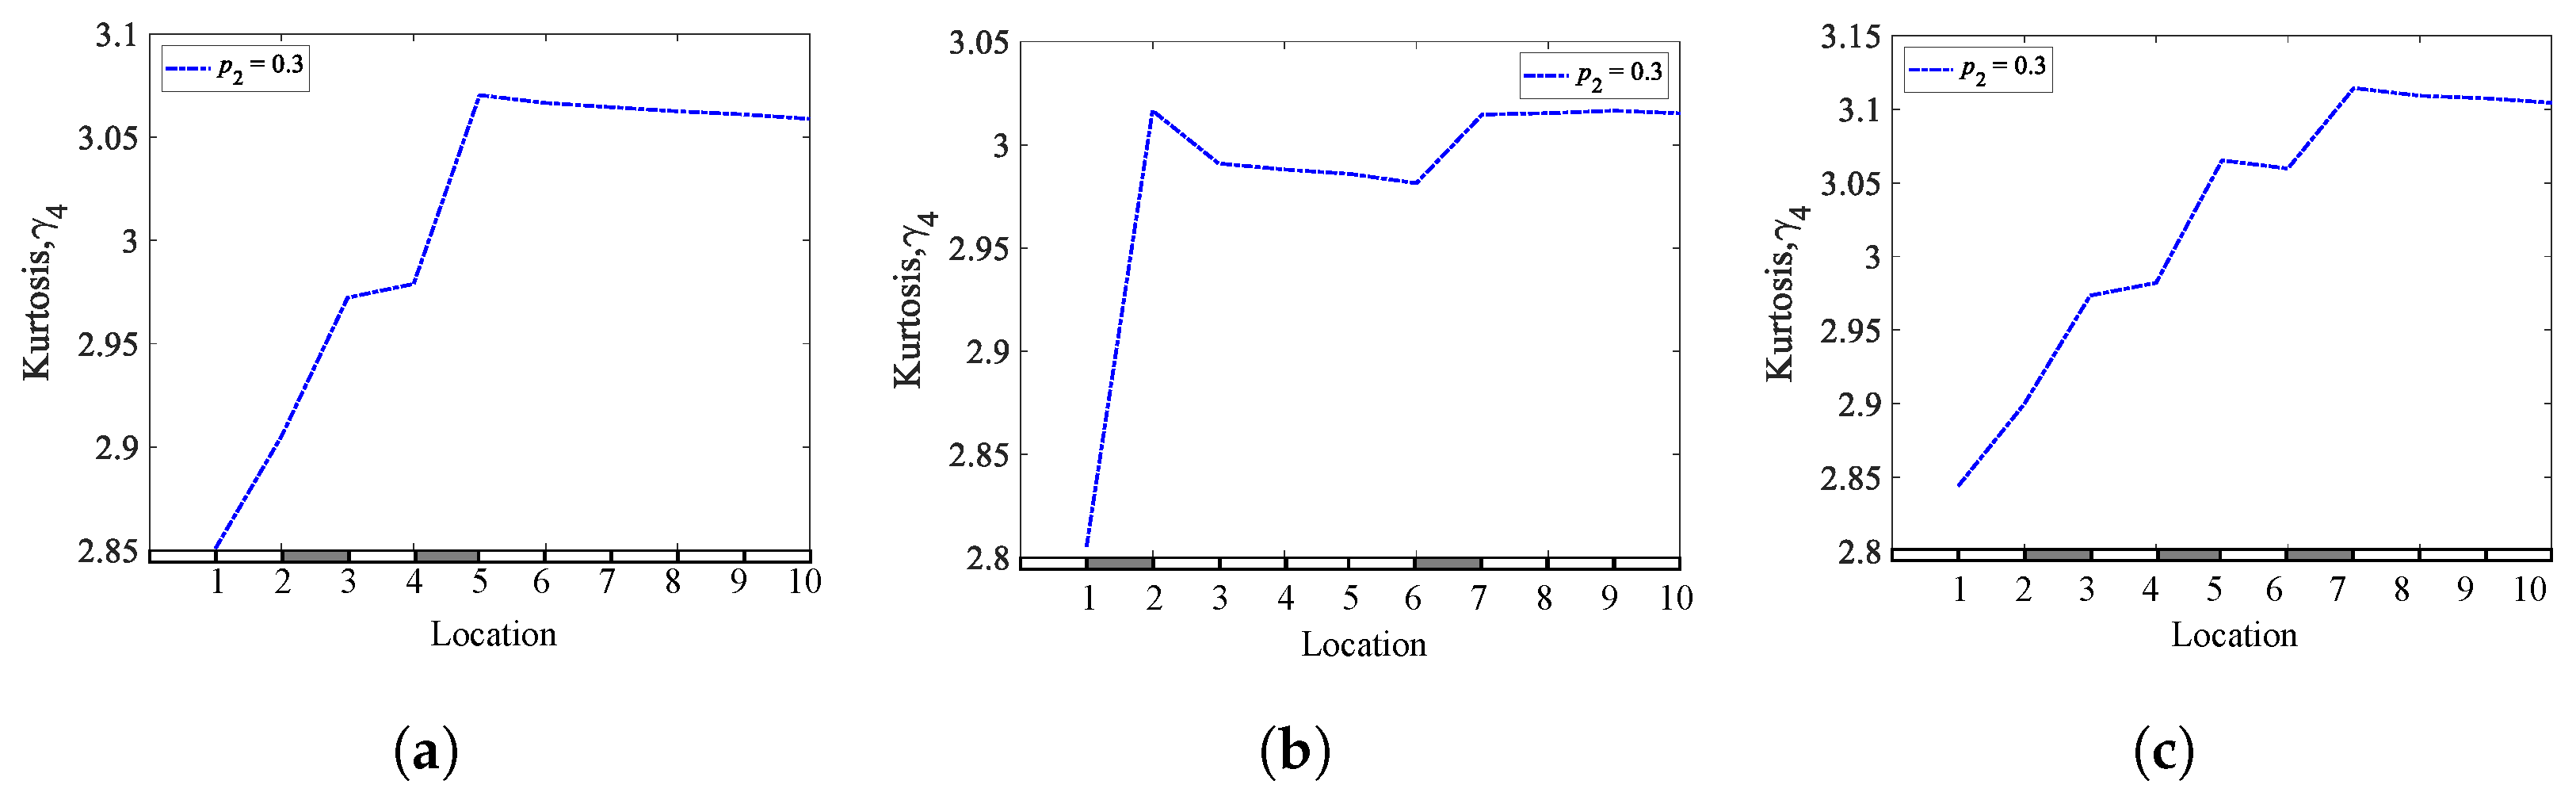
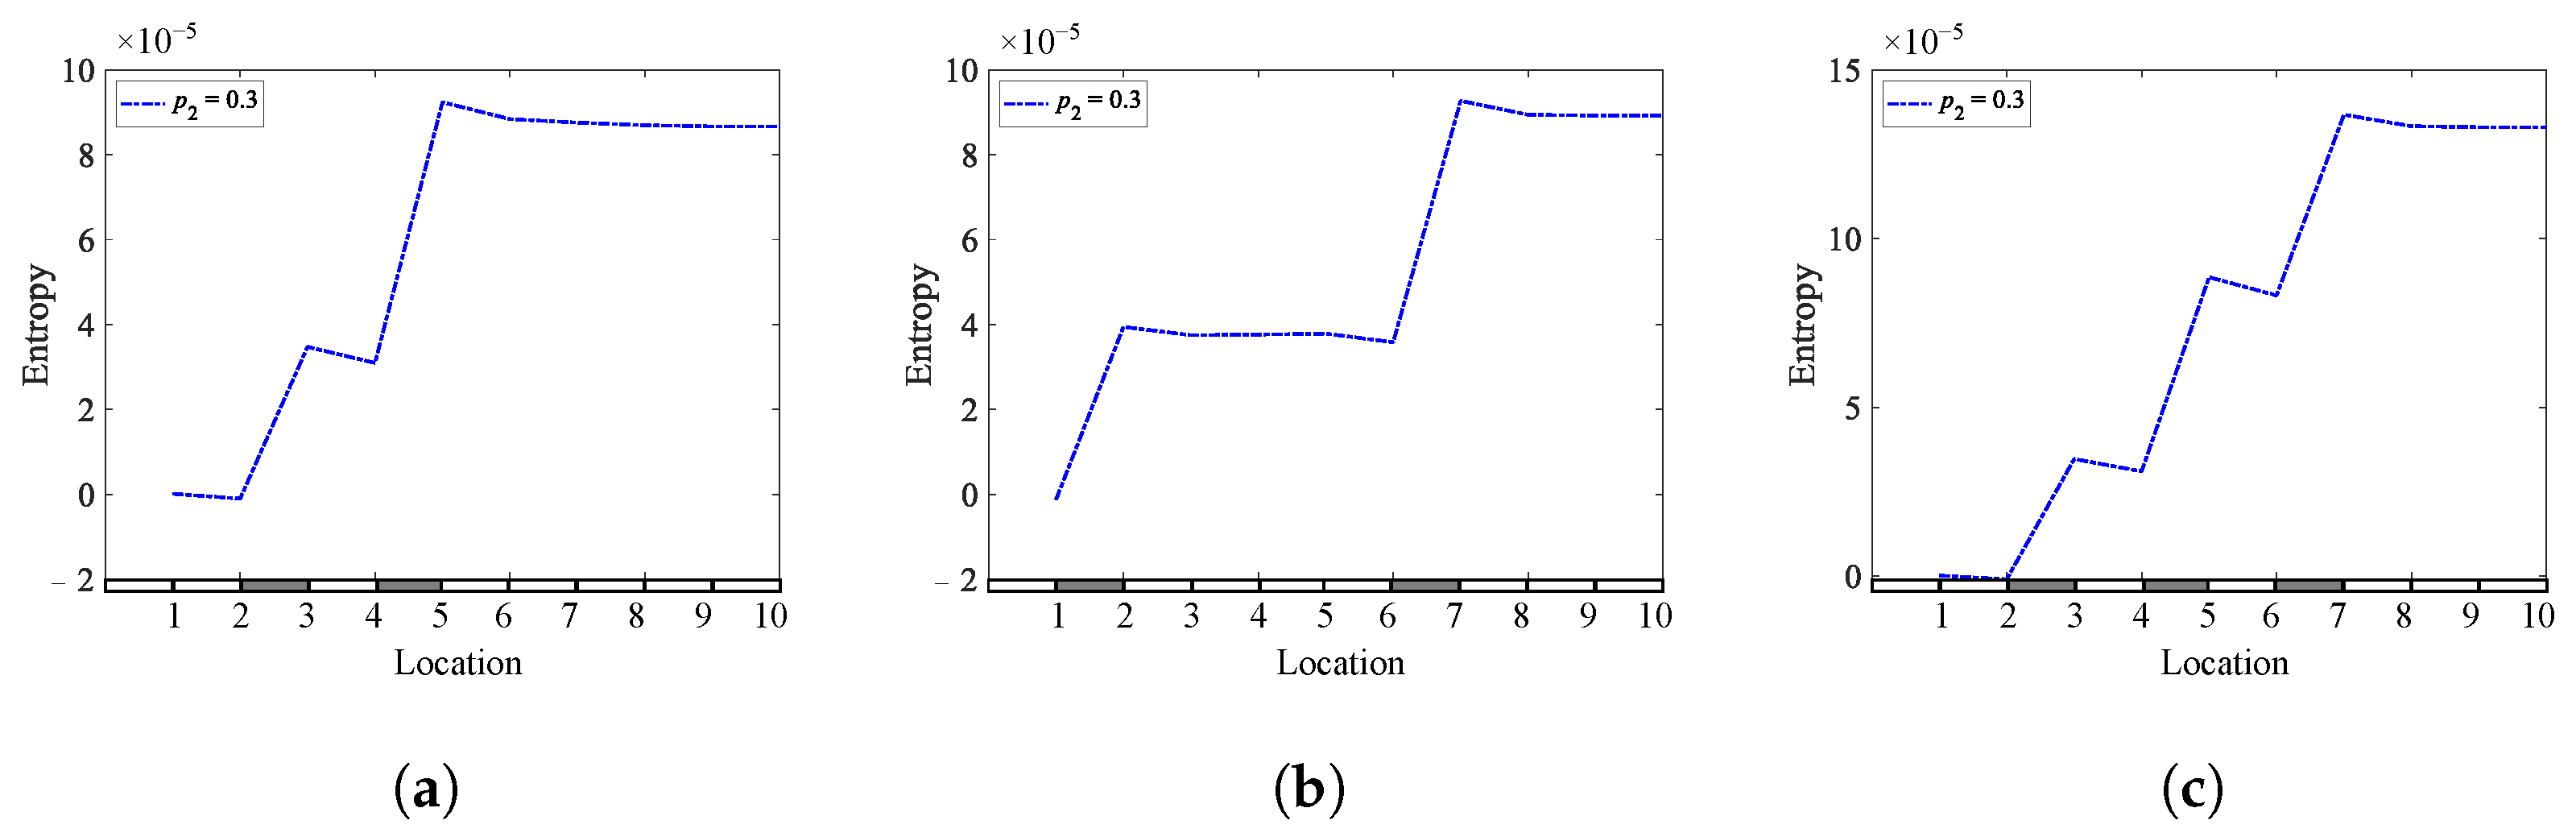
4.4. Multiple Breathing Cracks
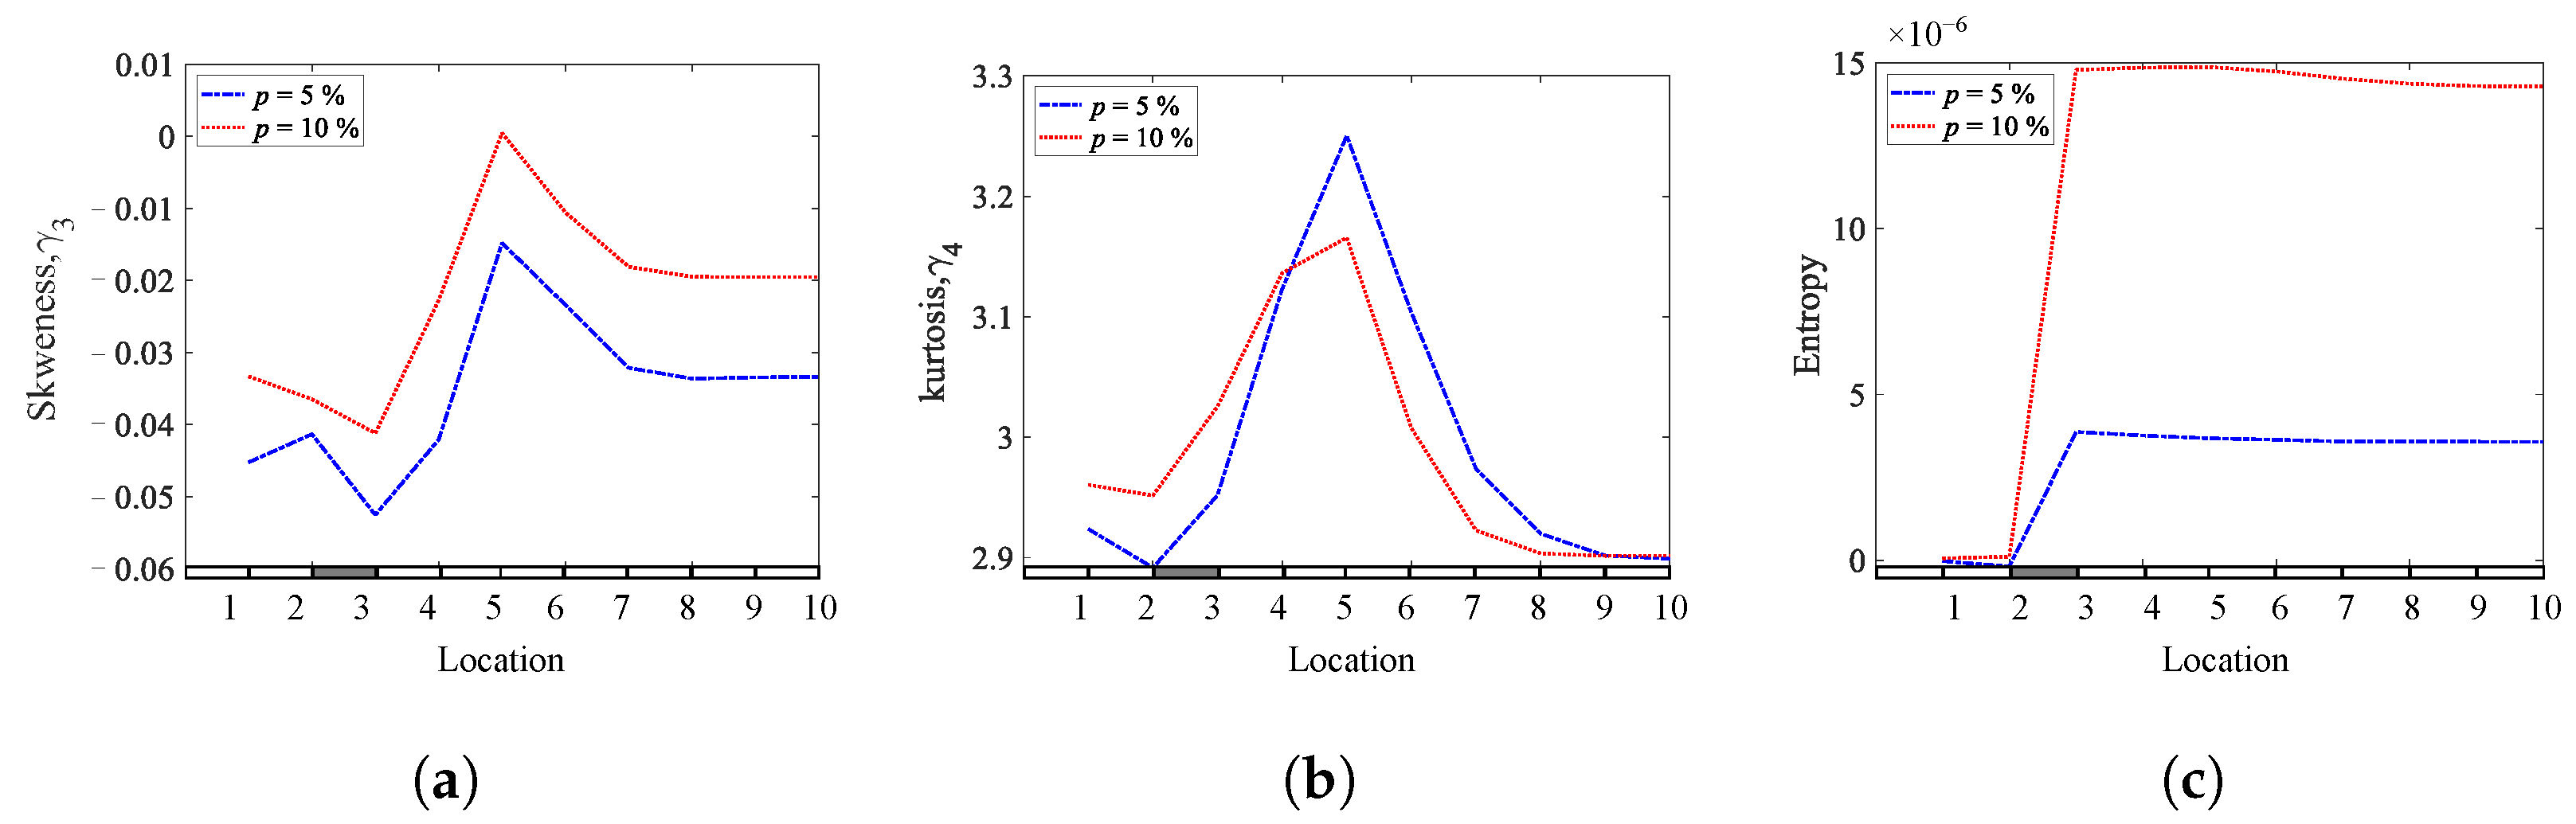
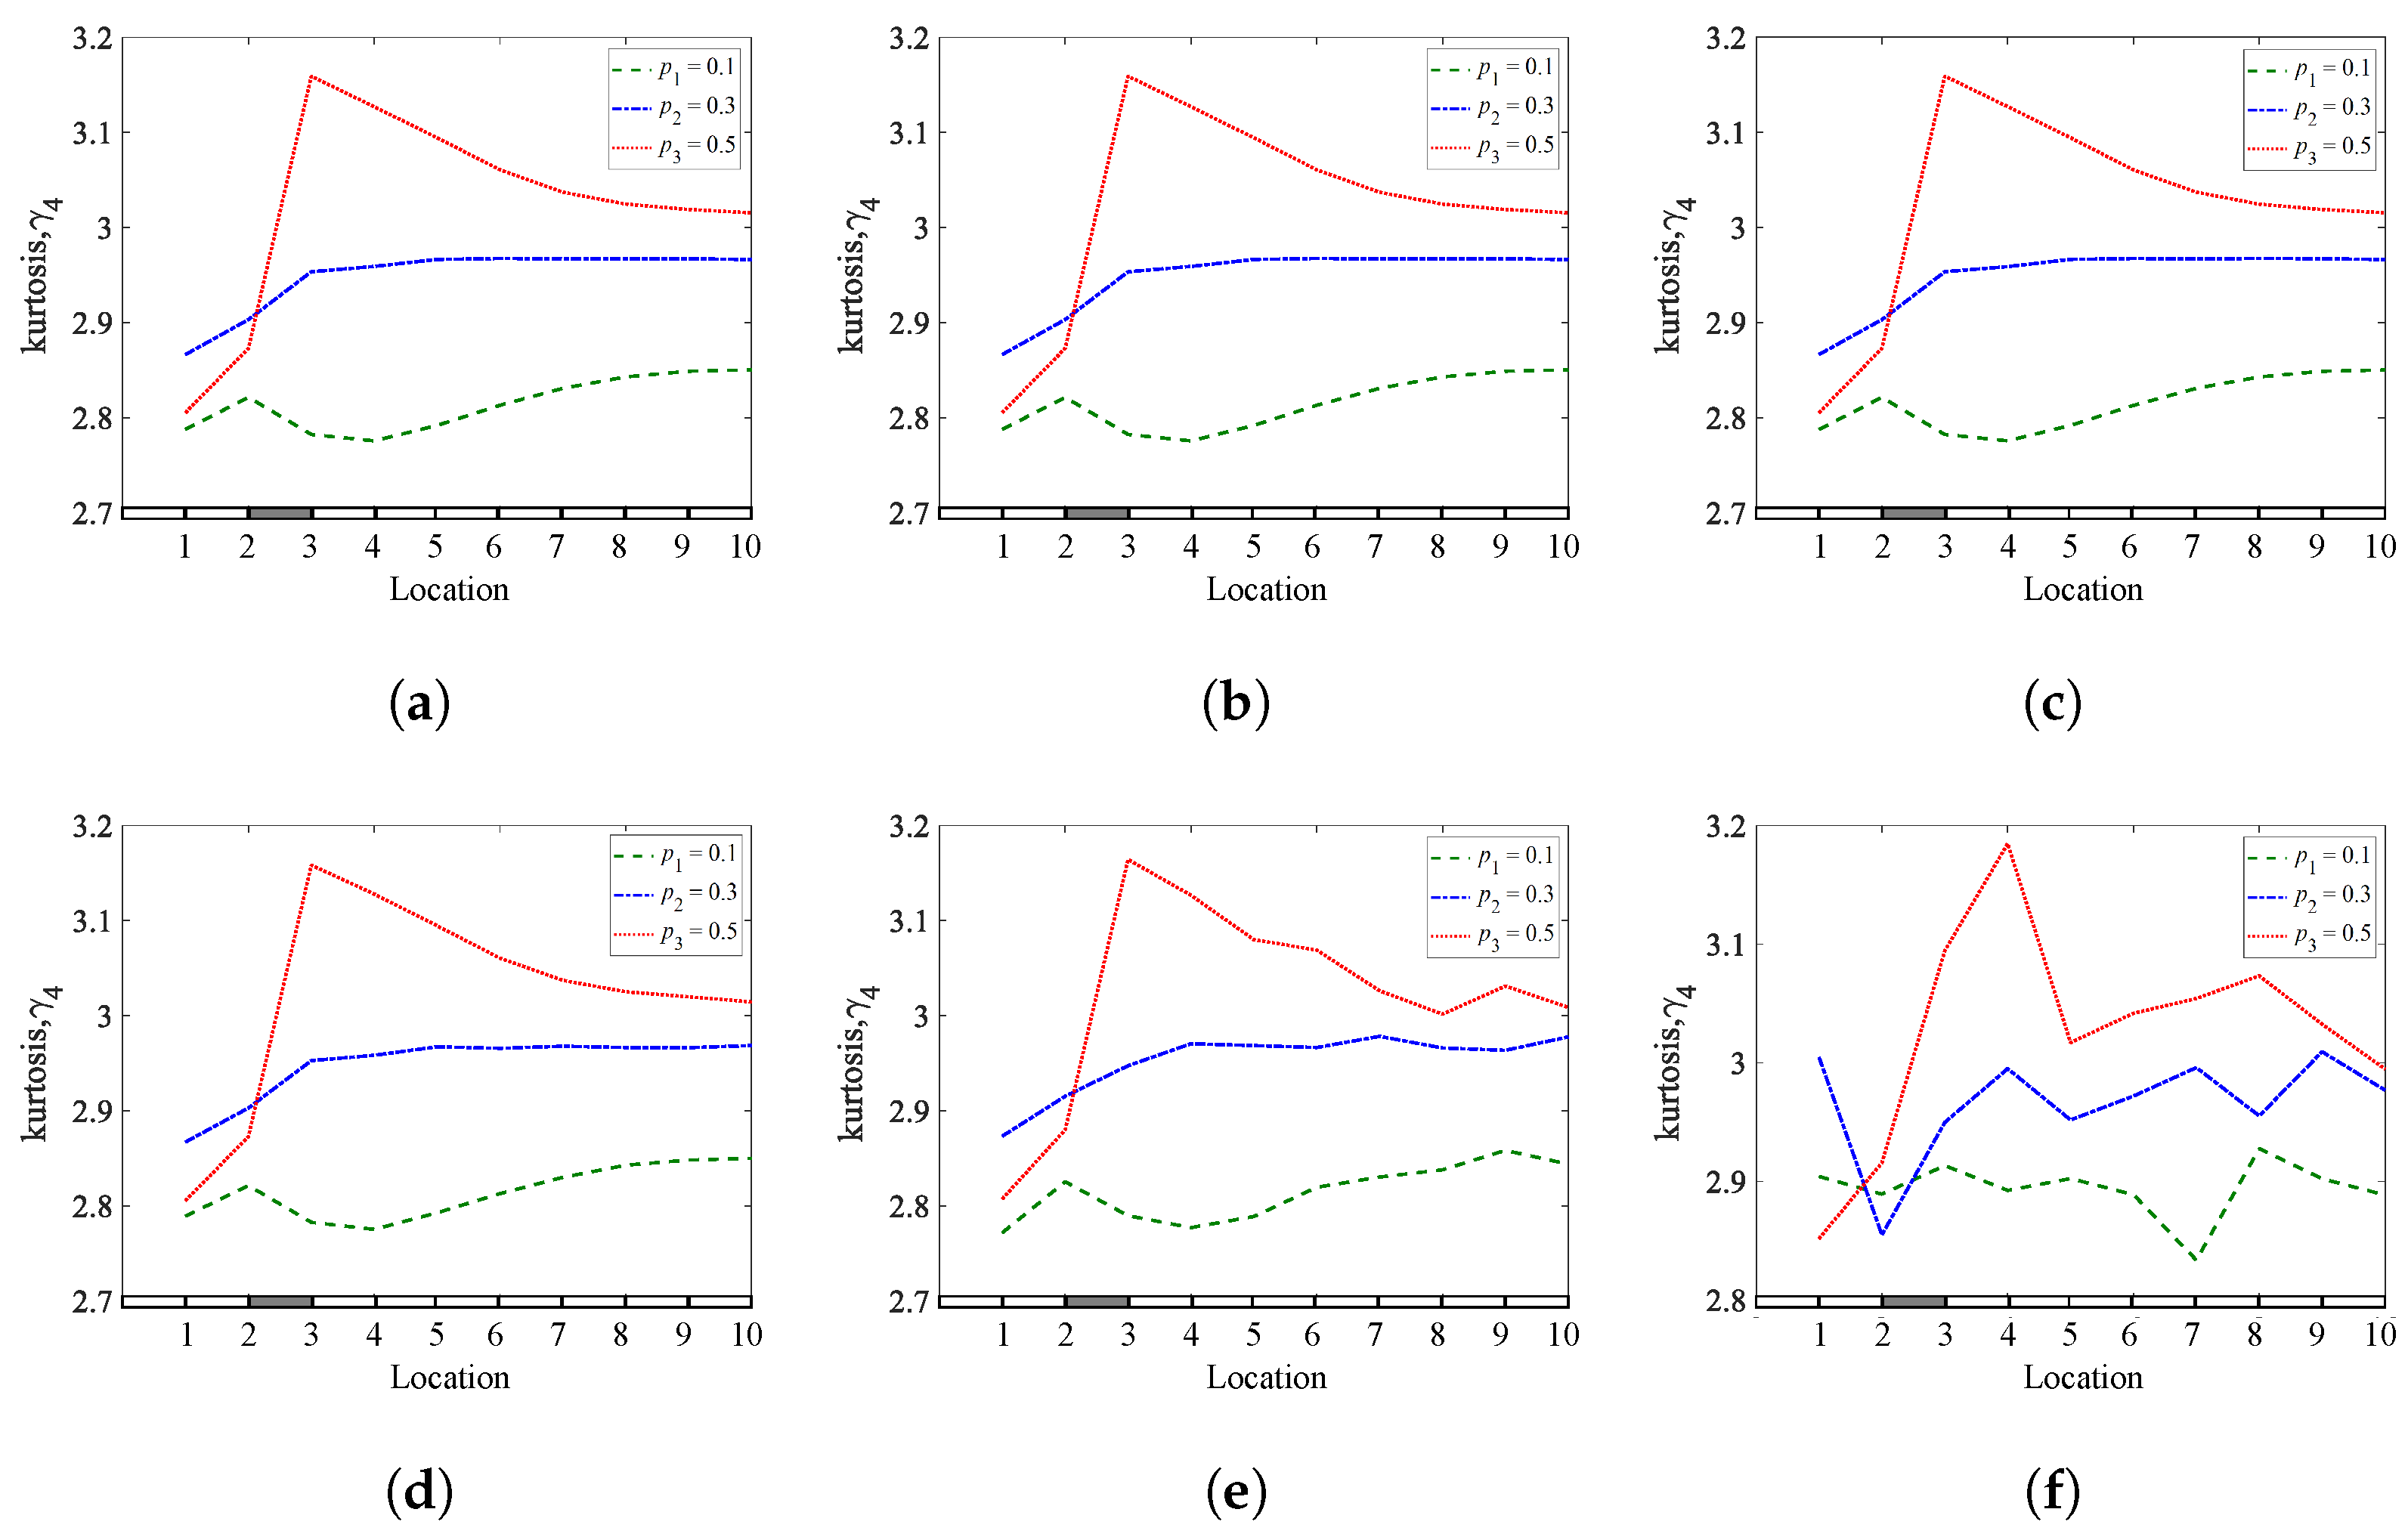
In SHM, detecting and localizing multiple breathing cracks is a topic of greater interest but a more significant challenge than single breathing crack detection and localization [63]. In this section, to detect multiple breathing cracks, the skewness, kurtosis, and Shannon entropy methods are applied to cantilever beams containing multiple breathing cracks. The beams are excited at the bottom (point-0) by white Gaussian noise excitation in the x-direction. Here, three different cases are introduced. The first and second cases have two breathing cracks but in different locations ( q 1 = 0.25 and q 2 = 0.45) and ( q 1 = 0.15 and q 2 = 0.65), respectively. The third case contains three breathing cracks located at ( q 1 = 0.25, q 2 = 0.45, and q 3 = 0.65) distant from the bottom to the top. The crack depth for the three cases is 10.5 mm ( p 2 = 0.30) of the total beam heights.
Figure 32, Figure 33 and Figure 34 present the results of the analyzed cantilever beams with multiple breathing cracks using the skewness, kurtosis, and Shannon entropy methods as a function of the crack locations, respectively. The results show that the three methods have good sensitivity and can detect and locate multiple breathing cracks, showing two jumps in the case of two cracks and three in the case of three cracks. By comparing the results of the three methods, the superiority of the Shannon entropy method is evident, as this is apparent through its ability to locate cracks accurately.
As a result of the continuous opening and closing of the breathing crack and the contact between the crack surfaces, the nonlinearity of the structure containing the breathing crack will be generated. In the case of multiple breathing cracks, for example, a beam with two breathing cracks, it is possible that at a particular time instant, one crack may be in an open state (damaged) while the other may be in a closed state (healthy). Thus, the nonlinearity generated due to the presence of the two breathing cracks may imply that there is only a single breathing crack because there is no apparent difference between the responses of the single crack and the two cracks. Such behavior can be considered one of the challenges facing any method used to identify multiple breathing cracks.
It can be concluded that the Shannon entropy method is superior to the skewness coefficients method, followed by the kurtosis coefficient method in multiple breathing cracks localization.
The results show that the Shannon entropy method gives powerful and accurate results for the all studied cases. It can be noticed that beams containing one crack have a single jump located at the crack location, beams with two cracks have two jumps, and beams with three cracks have three jumps. The results demonstrated that the Shannon entropy and skewness methods could provide valuable information about the crack presence and location. The kurtosis coefficient method could provide acceptable results for the case of a cantilever beam for both single and multiple breathing cracks. The kurtosis coefficients of the other beam models with different boundary conditions do not provide good results, except for at a crack depth of 17.5 mm ( p 3 = 0.50). This means that the kurtosis method provides reliable information about crack locations only in the case of large crack depths and is reliable regarding the presence of a breathing crack for many cases. It can be said that at a crack depth of 17.5 mm ( p 3 = 0.50), the jumps are more apparent for all cases. It can be concluded that the Shannon entropy method has the highest sensitivity and shows more information about the presence and location of cracks, followed by the skewness coefficients method then the kurtosis coefficients method.

4.5. Noise Immunity

In experimental tests, measurement noise affects the quality and sensitivity of the damage identification process. Therefore, noise immunity is essential to exhibit the robustness and applicability of the proposed methods in detecting and localizing breathing cracks. For the sake of simulating real cases, the white Gaussian noise is added to the recorded time-history of the displacement responses for the different methods so that the noise-contaminated signals can be obtained. In this section, cantilever beams with three different crack depths are selected. The three methods are adopted to compare and evaluate noise immunity at various conditions of measurement noise. In order to show diverse environmental conditions, five noise levels, i.e., S N R = 85, 65, 45, 25, and 10, are considered. The noise intensity is characterized by the signal-to-noise ratio (SNR), defined as [5,64]:
S N R = 10 lg P s P n ,
where P s represents the effective power of the signal, and P n represents the effective power of the noise.
Figure 35, Figure 36 and Figure 37 display the influence of noise levels on the performance of the three methods. The findings demonstrated that the three methods have robust noise immunity, particularly the Shannon entropy method. Numerical simulation results demonstrated that the three methods perform well under diverse noisy environmental conditions. The capability of the proposed methods to detect and localize breathing cracks under various noisy conditions is one of the significant benefits of these methods. Therefore, the proposed methods are competent to detect single and multiple breathing cracks in different noisy conditions.

5. Conclusions

This paper aims to detect and localize single and multiple fatigue cracks in beams subjected to Gaussian excitation using time-domain methods. The detection process exploits the non-Gaussianity generated by the system due to the nonlinearity resulting from the opening and closing of the breathing cracks. Several beam models containing single and multiple breathing cracks with different boundary conditions have been numerically investigated. Skewness, kurtosis, and Shannon entropy methods were applied to the longitudinal displacement, and the variance in the results indicates the presence and location of the breathing cracks. Identifying multiple breathing cracks is a more significant but challenging issue than single breathing cracks. As an exploration to identify multiple breathing cracks in beam structures, different beam models containing two and three breathing cracks were investigated. Furthermore, the effect of the number of measurements points and the effect of the spatial location of load in breathing crack identification were investigated. The results show that the proposed methods can detect and localize breathing cracks with different sensitivity levels. The Shannon entropy method provided more accurate and reliable results in detecting and localizing single and multiple breathing cracks. It is worth noting that the kurtosis coefficient is inherently less accurate than the skewness coefficient for a given sample size, with the former requiring higher-order statistics. Moreover, the three methods have strong immunity to noise, particularly the Shannon entropy method. When using statistical methods and to obtain more accurate results, a large amount of data is required. The Shannon entropy method is simple and can be recommended for damage detection and localization of single and multiple breathing cracks in beams in practical applications, even in noisy conditions. Furthermore, it is worth noting that the Shannon entropy method can be used at any spatial location of excitation, as it gives excellent results about the location and severity of the crack.
This work suggests a number of avenues for further research in relation to the use of the rotational degree of freedom response of 3D structures for effective detection and localization of breathing cracks for different boundary conditions.

Author Contributions

Conceptualization, T.A.-h., N.F.A., S.Z. and M.C.; methodology, T.A.-h., N.F.A. and M.C.; software, T.A.-h. and L.C.; validation, T.A.-h., N.F.A., L.C. and S.Z.; investigation, T.A.-h., N.F.A. and H.Z.; resources, H.Z., L.C. and S.Z.; data curation, T.A.-h., N.F.A. and L.C.; writing—original draft preparation, T.A.-h. and N.F.A.; writing—review and editing, N.F.A., L.C., H.Z., S.Z. and M.C.; project administration, L.C. and M.C.; supervision, N.F.A. and M.C.; funding acquisition, N.F.A. and M.C. All authors have read and agreed to the published version of the manuscript.

Funding

This work is partially supported by the Nantong Science and technology opening cooperation project in 2021 (No. BW2021001), the Key R&D Project of Anhui Science and Technology Department (202004b11020026), the Nanjing Science and Technology Project (No. 202002014) and the Anhui provincial international joint research center of data diagnosis and smart maintenance on bridge structures (No. 2021AHGHZD01).

Institutional Review Board Statement

Not applicable.

Informed Consent Statement

Not applicable.

Data Availability Statement

The data that support the findings of this study are available from the corresponding author upon reasonable request.

Conflicts of Interest

The authors declare no conflict of interest.

References

  1. Xu, W.; Su, Z.; Radzieński, M.; Cao, M.; Ostachowicz, W. Nonlinear pseudo-force in a breathing crack to generate harmonics. J. Sound Vib. 2021, 492, 115734. [Google Scholar] [CrossRef]
  2. Long, H.; Liu, Y.; Liu, K. Nonlinear vibration analysis of a beam with a breathing crack. Appl. Sci. 2019, 9, 3874. [Google Scholar] [CrossRef] [Green Version]
  3. Wei, C.; Shang, X. Analysis on nonlinear vibration of breathing cracked beam. J. Sound Vib. 2019, 461, 114901. [Google Scholar] [CrossRef]
  4. Al-Hababi, T.; Alkayem, N.F.; Cui, L.; Zhang, S.; Liu, C.; Cao, M. The Coupled Effect of Temperature Changes and Damage Depth on Natural Frequencies in Beam-Like Structures. Struct. Durab. Health Monit. 2022, 16, 15–35. [Google Scholar] [CrossRef]
  5. Cui, L.; Xu, H.; Ge, J.; Cao, M.; Xu, Y.; Xu, W.; Sumarac, D. Use of Bispectrum Analysis to Inspect the Non-Linear Dynamic Characteristics of Beam-Type Structures Containing a Breathing Crack. Sensors 2021, 21, 1177. [Google Scholar] [CrossRef]
  6. Prawin, J.; Rao, A.R. Breathing Crack Detection Using Linear Components and Their Physical Insight. In Advances in Structural Vibration; Springer: Berlin/Heidelberg, Germany, 2021; pp. 73–84. [Google Scholar]
  7. Bovsunovsky, A.; Surace, C. Non-linearities in the vibrations of elastic structures with a closing crack: A state of the art review. Mech. Syst. Signal Process. 2015, 62, 129–148. [Google Scholar] [CrossRef]
  8. Kharazan, M.; Irani, S.; Noorian, M.A.; Salimi, M.R. Effect of a breathing crack on the damping changes in nonlinear vibrations of a cracked beam: Experimental and theoretical investigations. J. Vib. Control 2020, 27, 1077546320960312. [Google Scholar] [CrossRef]
  9. Chomette, B. Nonlinear multiple breathing cracks detection using direct zeros estimation of higher-order frequency response function. Commun. Nonlinear Sci. Numer. Simul. 2020, 89, 105330. [Google Scholar] [CrossRef]
  10. Prawin, J. Breathing crack damage diagnostic strategy using improved MFCC features. J. Intell. Mater. Syst. Struct. 2021, 32, 2437–2462. [Google Scholar] [CrossRef]
  11. Li, D.; Xu, Z.; Ostachowicz, W.; Cao, M.; Liu, J. Identification of multiple cracks in noisy conditions using scale-correlation-based multiscale product of SWPT with laser vibration measurement. Mech. Syst. Signal Process. 2020, 145, 106889. [Google Scholar] [CrossRef]
  12. Prawin, J.; Rama Mohan Rao, A. Vibration-based breathing crack identification using non-linear intermodulation components under noisy environment. Struct. Health Monit. 2020, 19, 86–104. [Google Scholar] [CrossRef]
  13. Matveev, V.; Bovsunovsky, A. Vibration-based diagnostics of fatigue damage of beam-like structures. J. Sound Vib. 2002, 249, 23–40. [Google Scholar] [CrossRef]
  14. Kullaa, J.; Santaoja, K.; Eymery, A. Vibration-based structural health monitoring of a simulated beam with a breathing crack. Key Engineering Materials. Trans. Tech. Publ. 2013, 569, 1093–1100. [Google Scholar]
  15. Cheng, C.; Peng, Z.; Dong, X.; Zhang, W.; Meng, G. A novel damage detection approach by using Volterra kernel functions based analysis. J. Frankl. Inst. 2015, 352, 3098–3112. [Google Scholar] [CrossRef]
  16. Villani, L.G.; Da Silva, S.; Cunha, A., Jr. Damage detection in uncertain nonlinear systems based on stochastic Volterra series. Mech. Syst. Signal Process. 2019, 125, 288–310. [Google Scholar] [CrossRef] [Green Version]
  17. Prawin, J.; Rao, A.R.M. Extraction of Opening and Closing States of Cracked Structure using Adaptive Volterra Filter Model. Procedia Struct. Integr. 2019, 14, 234–241. [Google Scholar] [CrossRef]
  18. Peng, Z.; Li, J.; Hao, H.; Li, C. Nonlinear structural damage detection using output-only Volterra series model. Struct. Control Health Monit. 2021, 28, e2802. [Google Scholar] [CrossRef]
  19. Kullaa, J.; Miettinen, M. Fatigue crack modelling for damage detection. In Proceedings of the 8th European Workshop on Structural Health Monitoring (EWSHM 2016), Bilbao, Spain, 5–8 July 2016; pp. 5–8. [Google Scholar]
  20. Smith, S.; Wang, G.; Wu, D. Bayesian approach to breathing crack detection in beam structures. Eng. Struct. 2017, 148, 829–838. [Google Scholar] [CrossRef]
  21. Wang, X.; Wu, N. Crack identification at welding joint with a new smart coating sensor and entropy. Mech. Syst. Signal Process. 2019, 124, 65–82. [Google Scholar] [CrossRef]
  22. Lu, Z.R.; Yang, D.; Liu, J.; Wang, L. Nonlinear breathing crack identification from time-domain sensitivity analysis. Appl. Math. Model. 2020, 83, 30–45. [Google Scholar] [CrossRef]
  23. Asnaashari, E.; Sinha, J.K. Development of residual operational deflection shape for crack detection in structures. Mech. Syst. Signal Process. 2014, 43, 113–123. [Google Scholar] [CrossRef]
  24. Jiang, M.; Wang, D.; Kuang, Y.; Mo, X. A bicoherence-based nonlinearity measurement method for identifying the location of breathing cracks in blades. Int. J. -Non-Linear Mech. 2021, 135, 103751. [Google Scholar] [CrossRef]
  25. Prawin, J. Real-time reference-free breathing crack identification using ambient vibration data. Struct. Control. Health Monit. 2021, 135, e2903. [Google Scholar] [CrossRef]
  26. Prawin, J.; Lakshmi, K.; Rao, A.R.M. A novel singular spectrum analysis–based baseline-free approach for fatigue-breathing crack identification. J. Intell. Mater. Syst. Struct. 2018, 29, 2249–2266. [Google Scholar] [CrossRef]
  27. Li, Y.; Wang, X.; Liu, Z.; Liang, X.; Si, S. The entropy algorithm and its variants in the fault diagnosis of rotating machinery: A review. IEEE Access 2018, 6, 66723–66741. [Google Scholar] [CrossRef]
  28. Wang, Q.; Li, H.; Lin, J.; Zhang, C. Future trend forecast by empirical wavelet transform and autoregressive moving average. Sensors 2018, 18, 2621. [Google Scholar] [CrossRef] [Green Version]
  29. Figlus, T. A method for diagnosing gearboxes of means of transport using multi-stage filtering and entropy. Entropy 2019, 21, 441. [Google Scholar] [CrossRef] [Green Version]
  30. Shannon, C.E. A mathematical theory of communication. Bell Syst. Tech. J. 1948, 27, 379–423. [Google Scholar] [CrossRef] [Green Version]
  31. Diao, Y.; Zhang, X.; Sun, Z.; Guo, K.; Wang, Y. Wavelet entropy based structural damage identification under seismic excitation. Smart Mater. Struct. 2018, 27, 105002. [Google Scholar] [CrossRef]
  32. Wu, Z.; Zhang, Q.; Wang, L.; Cheng, L.; Zhou, J. Early fault detection method for rotating machinery based on harmonic-assisted multivariate empirical mode decomposition and transfer entropy. Entropy 2018, 20, 873. [Google Scholar] [CrossRef] [Green Version]
  33. Moreno-Gomez, A.; Amezquita-Sanchez, J.P.; Valtierra-Rodriguez, M.; Perez-Ramirez, C.A.; Dominguez-Gonzalez, A.; Chavez-Alegria, O. EMD-Shannon entropy-based methodology to detect incipient damages in a truss structure. Appl. Sci. 2018, 8, 2068. [Google Scholar] [CrossRef] [Green Version]
  34. Alkayem, N.F.; Shen, L.; Asteris, P.G.; Sokol, M.; Xin, Z.; Cao, M. A new self-adaptive quasi-oppositional stochastic fractal search for the inverse problem of structural damage assessment. Alex. Eng. J. 2022, 61, 1922–1936. [Google Scholar] [CrossRef]
  35. Sandoval, D.; Leturiondo, U.; Vidal, Y.; Pozo, F. Entropy indicators: An approach for low-speed bearing diagnosis. Sensors 2021, 21, 849. [Google Scholar] [CrossRef] [PubMed]
  36. Hosseini, S.M.; Ghasemi-Ghalebahman, A.; Azadi, M.; Jafari, S.M. Crack initiation detection in crankshaft ductile cast iron based on information entropy of acoustic emission signals under tensile loading. Eng. Fail. Anal. 2021, 127, 105547. [Google Scholar] [CrossRef]
  37. Makki Alamdari, M.; Samali, B.; Li, J.; Lu, Y.; Mustapha, S. Structural condition assessment using entropy-based time series analysis. J. Intell. Mater. Syst. Struct. 2017, 28, 1941–1956. [Google Scholar] [CrossRef]
  38. Amezquita-Sanchez, J.P. Entropy algorithms for detecting incipient damage in high-rise buildings subjected to dynamic vibrations. J. Vib. Control 2021, 27, 426–436. [Google Scholar] [CrossRef]
  39. Andreaus, U.; Baragatti, P. Cracked beam identification by numerically analysing the nonlinear behaviour of the harmonically forced response. J. Sound Vib. 2011, 330, 721–742. [Google Scholar] [CrossRef]
  40. Habtour, E.; Cole, D.P.; Riddick, J.C.; Weiss, V.; Robeson, M.; Sridharan, R.; Dasgupta, A. Detection of fatigue damage precursor using a nonlinear vibration approach. Struct. Control Health Monit. 2016, 23, 1442–1463. [Google Scholar] [CrossRef]
  41. Prawin, J.; Rao, A.R.M.; Lakshmi, K. Nonlinear identification of structures using ambient vibration data. Comput. Struct. 2015, 154, 116–134. [Google Scholar] [CrossRef]
  42. Kaul, S. Crack diagnostics in beams using wavelets, kurtosis and skewness. Nondestruct. Test. Eval. 2014, 29, 99–122. [Google Scholar] [CrossRef]
  43. Andreaus, U.; Baragatti, P. Experimental damage detection of cracked beams by using nonlinear characteristics of forced response. Mech. Syst. Signal Process. 2012, 31, 382–404. [Google Scholar] [CrossRef]
  44. Giannini, O.; Casini, P.; Vestroni, F. Nonlinear harmonic identification of breathing cracks in beams. Comput. Struct. 2013, 129, 166–177. [Google Scholar] [CrossRef]
  45. Boungou, D.; Guillet, F.; El Badaoui, M.; Lyonnet, P.; Rosario, T. Fatigue damage detection using cyclostationarity. Mech. Syst. Signal Process. 2015, 58, 128–142. [Google Scholar] [CrossRef]
  46. Al-Hababi, T.; Cao, M.; Saleh, B.; Alkayem, N.F.; Xu, H. A Critical Review of Nonlinear Damping Identification in Structural Dynamics: Methods, Applications, and Challenges. Sensors 2020, 20, 7303. [Google Scholar] [CrossRef]
  47. Chavoshi, S.Z.; Booker, J.; Bradford, R.; Martin, M. A review of probabilistic structural integrity assessment in the nuclear sector and possible future directions. Fatigue Fract. Eng. Mater. Struct. 2021, 44, 3227–3257. [Google Scholar] [CrossRef]
  48. Zhang, Y.; Macdonald, J.H.; Liu, S.; Harper, P.W. Damage detection of nonlinear structures using probability density ratio estimation. Comput.-Aided Civ. Infrastruct. Eng. 2021, 37, 878–893. [Google Scholar] [CrossRef]
  49. Kara, M. A higher order statistical moment based approach for the distribution of eigenvalues of beams with variable cracked depth. Mech. Syst. Signal Process. 2021, 161, 107965. [Google Scholar] [CrossRef]
  50. Cianetti, F.; Palmieri, M.; Braccesi, C.; Morettini, G. Correction formula approach to evaluate fatigue damage induced by non-Gaussian stress state. Procedia Struct. Integr. 2018, 8, 390–398. [Google Scholar] [CrossRef]
  51. Yu, L.; Zhu, J.H. Nonlinear damage detection using higher statistical moments of structural responses. Struct. Eng. Mech 2015, 54, 221–237. [Google Scholar] [CrossRef] [Green Version]
  52. Gres, S.; Ulriksen, M.D.; Döhler, M.; Johansen, R.J.; Andersen, P.; Damkilde, L.; Nielsen, S.A. Statistical methods for damage detection applied to civil structures. Procedia Eng. 2017, 199, 1919–1924. [Google Scholar] [CrossRef]
  53. Cacciola, P.; Impollonia, N.; Muscolino, G. Crack detection and location in a damaged beam vibrating under white noise. Comput. Struct. 2003, 81, 1773–1782. [Google Scholar] [CrossRef]
  54. Benfratello, S.; Cacciola, P.; Impollonia, N.; Masnata, A.; Muscolino, G. Numerical and experimental verification of a technique for locating a fatigue crack on beams vibrating under Gaussian excitation. Eng. Fract. Mech. 2007, 74, 2992–3001. [Google Scholar] [CrossRef]
  55. Lakshmi, K.; Rao, A.R.M. Output-only damage localization technique using time series model. Sādhanā 2018, 43, 1–17. [Google Scholar] [CrossRef] [Green Version]
  56. Avendaño-Valencia, L.D.; Fassois, S.D. Damage/fault diagnosis in an operating wind turbine under uncertainty via a vibration response Gaussian mixture random coefficient model based framework. Mech. Syst. Signal Process. 2017, 91, 326–353. [Google Scholar] [CrossRef]
  57. Chua, K.C.; Chandran, V.; Acharya, U.R.; Lim, C.M. Application of higher order statistics/spectra in biomedical signals—A review. Med. Eng. Phys. 2010, 32, 679–689. [Google Scholar] [CrossRef] [Green Version]
  58. Hoyle, R.H. Structural Equation Modeling: Concepts, Issues, and Applications; Sage: New York, NY, USA, 1995. [Google Scholar]
  59. Westfall, P.H. Kurtosis as peakedness, 1905–2014. RIP. Am. Stat. 2014, 68, 191–195. [Google Scholar] [CrossRef] [Green Version]
  60. Ceravolo, R.; Civera, M.; Lenticchia, E.; Miraglia, G.; Surace, C. Detection and Localization of Multiple Damages through Entropy in Information Theory. Appl. Sci. 2021, 11, 5773. [Google Scholar] [CrossRef]
  61. Mousavi, M.; Holloway, D.; Olivier, J.; Alavi, A.H.; Gandomi, A.H. A Shannon entropy approach for structural damage identification based on self-powered sensor data. Eng. Struct. 2019, 200, 109619. [Google Scholar] [CrossRef]
  62. Mobarak, H.; Wu, H.; Spagnol, J.P.; Xiao, K. New crack breathing mechanism under the influence of unbalance force. Arch. Appl. Mech. 2018, 88, 341–372. [Google Scholar] [CrossRef]
  63. Cao, M.; Radzieński, M.; Xu, W.; Ostachowicz, W. Identification of multiple damage in beams based on robust curvature mode shapes. Mech. Syst. Signal Process. 2014, 46, 468–480. [Google Scholar] [CrossRef]
  64. Liu, T.; Xu, H.; Ragulskis, M.; Cao, M.; Ostachowicz, W. A data-driven damage identification framework based on transmissibility function datasets and one-dimensional convolutional neural networks: Verification on a structural health monitoring benchmark structure. Sensors 2020, 20, 1059. [Google Scholar] [CrossRef] [PubMed] [Green Version]
Figure 1. Flowchart of the methodology used for breathing crack detection and localization.
Mathematics 10 01853 g001
Figure 2. Schematic representation of a cantilever FE beam model with a horizontal breathing crack.
Mathematics 10 01853 g002
Figure 3. Illustration of different boundary conditions: (a) Cantilever beam; (b) cantilever, simply supported beam; (c) fixed-fixed beam; (d) simply supported beam.
Mathematics 10 01853 g003
Figure 4. Crack modeling with a surface-to-surface contact method.
Mathematics 10 01853 g004
Figure 5. White Gaussian noise excitation.
Mathematics 10 01853 g005
Figure 6. Sampling intervals vs. displacement responses recorded from different sensors of a cantilever beam before and after crack location.
Mathematics 10 01853 g006
Figure 7. Sampling intervals vs. displacement responses recorded from different sensors of a cantilever, simply supported beam before and after crack location.
Mathematics 10 01853 g007
Figure 8. Sampling intervals vs. displacement responses recorded from different sensors of a fixed-fixed beam before and after crack location.
Mathematics 10 01853 g008
Figure 9. Sampling intervals vs. displacement responses recorded from different sensors of a simply supported beam before and after crack location.
Mathematics 10 01853 g009
Figure 10. Skewness coefficients of a cantilever beam for different crack depths and locations: (a) q 1 = 0.25; (b) q 2 = 0.45; (c) q 3 = 0.65.
Mathematics 10 01853 g010
Figure 11. Kurtosis coefficients of a cantilever beam for different crack depths and locations: (a) q 1 = 0.25; (b) q 2 = 0.45; (c) q 3 = 0.65.
Mathematics 10 01853 g011
Figure 12. Entropy of a cantilever beam for different crack depths and locations: (a) q 1 = 0.25; (b) q 2 = 0.45; (c) q 3 = 0.65.
Mathematics 10 01853 g012
Figure 13. Skewness coefficients of a cantilever, simply supported beam for different crack depths and locations: (a) q 1 = 0.25; (b) q 2 = 0.45; (c) q 3 = 0.65.
Mathematics 10 01853 g013
Figure 14. Kurtosis coefficients of a cantilever, simply supported beam for different crack depths and locations: (a) q 1 = 0.25; (b) q 2 = 0.45; (c) q 3 = 0.65.
Mathematics 10 01853 g014
Figure 15. Entropy of a cantilever, simply supported beam for different crack depths and locations: (a) q 1 = 0.25; (b) q 2 = 0.45; (c) q 3 = 0.65.
Mathematics 10 01853 g015
Figure 16. Skewness coefficients of a fixed-fixed beam for different crack depths and locations: (a) q 1 = 0.25; (b) q 2 = 0.45; (c) q 3 = 0.65.
Mathematics 10 01853 g016
Figure 17. Kurtosis coefficients of a fixed-fixed beam for different crack depths and locations: (a) q 1 = 0.25; (b) q 2 = 0.45; (c) q 3 = 0.65.
Mathematics 10 01853 g017
Figure 18. Entropy of a fixed-fixed beam for different crack depths and locations: (a) q 1 = 0.25; (b) q 2 = 0.45; (c) q 3 = 0.65.
Mathematics 10 01853 g018
Figure 19. Skewness coefficients of a simply supported beam for different crack depths and locations: (a) q 1 = 0.25; (b) q 2 = 0.45; (c) q 3 = 0.65.
Mathematics 10 01853 g019
Figure 20. Kurtosis coefficients of a simply supported beam for different crack depths and locations: (a) q 1 = 0.25; (b) q 2 = 0.45; (c) q 3 = 0.65.
Mathematics 10 01853 g020
Figure 21. Entropy of a simply supported beam for different crack depths and locations: (a) q 1 = 0.25; (b) q 2 = 0.45; (c) q 3 = 0.65.
Mathematics 10 01853 g021
Figure 22. A breathing crack identification of a cantilever beam at two small crack depths and at crack location of q 1 = 0.25: (a) Skewness; (b) Kurtosis; (c) Shannon entropy.
Mathematics 10 01853 g022
Figure 23. The effect of reducing the number of measurement points (5 points) on damage localization using skewness coefficients at various crack depths and locations: (a) q 1 = 0.25; (b) q 2 = 0.45; (c) q 3 = 0.65.
Mathematics 10 01853 g023
Figure 24. The effect of reducing the number of measurement points (5 points) on damage localization using kurtosis coefficients at various crack depths and locations: (a) q 1 = 0.25; (b) q 2 = 0.45; (c) q 3 = 0.65.
Mathematics 10 01853 g024
Figure 25. The effect of reducing the number of measurement points (5 points) on damage localization using Shannon entropy at various crack depths and locations: (a) q 1 = 0.25; (b) q 2 = 0.45; (c) q 3 = 0.65.
Mathematics 10 01853 g025
Figure 26. The effect of changing excitation locations on the skewness coefficients of a cantilever beam with a single breathing crack: (a) q 1 = 0.25; (b) q 2 = 0.45; (c) q 3 = 0.65.
Mathematics 10 01853 g026
Figure 27. The effect of changing excitation locations on the kurtosis coefficients of a cantilever beam with a single breathing crack: (a) q 1 = 0.25; (b) q 2 = 0.45; (c) q 3 = 0.65.
Mathematics 10 01853 g027
Figure 28. The effect of changing excitation locations on the Shannon entropy of a cantilever beam with a single breathing crack: (a) q 1 = 0.25; (b) q 2 = 0.45; (c) q 3 = 0.65.
Mathematics 10 01853 g028
Figure 29. The effect of changing excitation locations on the skewness coefficients of a simply supported beam with a single breathing crack: (a) q 1 = 0.25; (b) q 2 = 0.45; (c) q 3 = 0.65.
Mathematics 10 01853 g029
Figure 30. The effect of changing excitation locations on the kurtosis coefficients of a simply supported beam with a single breathing crack: (a) q 1 = 0.25; (b) q 2 = 0.45; (c) q 3 = 0.65.
Mathematics 10 01853 g030
Figure 31. The effect of changing excitation locations on the Shannon entropy of a simply supported with a single breathing crack: (a) q 1 = 0.25; (b) q 2 = 0.45; (c) q 3 = 0.65.
Mathematics 10 01853 g031
Figure 32. Skewness coefficients of a cantilever beam with multiple cracks for different crack depths and locations: (a) q = 0.25 and 0.45; (b) q = 0.15 and 0.65; (c) q = 0.25, 0.45, and 0.65.
Mathematics 10 01853 g032
Figure 33. Kurtosis coefficients of a cantilever beam with multiple cracks for different crack depths and locations: (a) q = 0.25 and 0.45; (b) q = 0.15 and 0.65; (c) q = 0.25, 0.45, and 0.65.
Mathematics 10 01853 g033
Figure 34. Entropy of a cantilever beam with multiple cracks for different crack depths and locations: (a) q = 0.25 and 0.45; (b) q = 0.15 and 0.65; (c) q = 0.25, 0.45, and 0.65.
Mathematics 10 01853 g034
Figure 35. The effect of noise levels on skewness coefficients of a cantilever beam: (a) Noise-free; (b) SNR = 85 dB; (c) SNR = 65 dB; (d) SNR = 45 dB; (e) SNR = 25 dB; (f) SNR = 10 dB.
Mathematics 10 01853 g035
Figure 36. The effect of noise levels on kurtosis coefficients of a cantilever beam: (a) Noise-free; (b) SNR = 85 dB; (c) SNR = 65 dB; (d) SNR = 45 dB; (e) SNR = 25 dB; (f) SNR = 10 dB.
Mathematics 10 01853 g036
Figure 37. The effect of noise levels on Shannon entropy of a cantilever beam: (a) Noise-free; (b) SNR = 85 dB; (c) SNR = 65 dB; (d) SNR = 45 dB; (e) SNR = 25 dB; (f) SNR = 10 dB.
Mathematics 10 01853 g037
Table 1. The first two natural frequencies of intact beams for different boundary conditions in Hz.
ModeCantilever
Beam
Cantilever, Simply
Supported Beam
Fixed-Fixed
Beam
Simply Supported
Beam
1238.55996.531434.70626.65
21424.802953.403659.901723.20
Table 2. The effectiveness of proposed methods for locating a single breathing crack for a variety of damage scenarios with different depths, locations, and boundary conditions.
MethodDepthCBCSSBFFBSSB
Location
q 1 q 2 q 3 q 1 q 2 q 3 q 1 q 2 q 3 q 1 q 2 q 3
Skewness p 1
p 2
p 3
Kurtosis p 1
p 2
p 3
Entropy p 1
p 2
p 3
CB: cantilever beam; CSSB: cantilever, simply supported beam; FFB: fixed-fixed beam; SSB simply supported beam; ✓: can locate damage; ✗: can not locate damage.
Publisher’s Note: MDPI stays neutral with regard to jurisdictional claims in published maps and institutional affiliations.

