Abstract
Many manufacturers sell products of differential quality to retailers or directly to consumers, and the retailers might promote high- or low-quality products. Given different channel structures, how can the supply chain be optimized? We developed a game-theoretic framework with a manufacturer and retailer as a leader and follower, respectively, and the retailer makes the promotional effort. We examined the effects of product quality, promotional effort, and hybrid channels on the supply chain performance in four dual-channel structures. We found that, regardless of qualities, retailers generally prefer to engage in the promotion even though manufacturers are reluctant to share promotional costs. However, promotional effort does not always improve the supply chain profit across channels, and there is an interaction between product-channel structure and promotional effort. The preferences of manufacturers and retailers in all feasible regions of quality levels within the aforementioned structures can be ranked. There exists a feasible region of quality levels where the supply chain can achieve the Pareto improvement without any additional coordination mechanism, and both players prefer the channel structure (Π4) that retailers sell high-quality products with promotional effort. Moreover, the extended analysis suggests that the less significant the product variety is, the less effort is made by the retailer to promote the products.
Keywords:
supply chain efficiency; multiproduct model; promotional effort; channel structure; game theory MSC:
91A80
1. Introduction
Commercial competition not only involves competition between enterprises but also competition between supply chains because, with outsourcing and globalization, the promotion has become an increasingly important aspect of supply chain management. Moreover, promotion is a crucial strategy for demand creation and market expansion. Promotional objectives are typically more critical than promotional methods, such as advertising, sampling, slotting allowances, and offering coupons, rebates, warranties, and service guarantees. Simply selling a great product is not sufficient. At some point in the life of almost every business, advertising becomes a crucial tool for increasing demand [1]. This paper focuses on promotion in a general sense rather than specific promotional methods. Although both retailers and manufacturers in a supply chain can simultaneously promote various products, a common practice is for one of the two to engage nearly exclusively in the promotion. In our multiproduct model, two types of product quality are allocated to two kinds of channels. In a decentralized channel, retailers, such as Taobao (for example, the total trading volume of Double 11 Shopping Carnival was up to 498,200,000,000 in 2020) or Walmart, undertake efforts to promote high- or low-quality products. As a famous e-platform, sellers on Taobao are mostly small merchants or individual suppliers (e.g., relative low-quality products), while Tmall hosts major brands (e.g., relative high-quality products). If only the retailer makes the promotional effort during the selling process, all the promotional costs must be incurred by the retailer.
Promotion, including that undertaken by the manufacturer, retailer, or jointly, has been well-documented in the literature [2,3,4,5,6]. Similar models, including the marketing mix, have been widely discussed [7,8,9,10]. The studies above have focused on specific promotional methods and ignored the position of promotion itself in the supply chain. None of these studies focused on aspects such as the optimization of supply chain quality and induction of product demand through promotion. In addition, no studies examined the effect of the promotional effort and product quality on supply chain profits across channels. This study will answer the following research questions to fill this research gap: (1) How does promotional effort optimize the hybrid-channel supply chain? (2) Is the retailer always willing to undertake promotional effort even when the manufacturer is reluctant to share promotional costs? (3) Does promotional effort always improve the supply chain profits across channels? (4) Are the preferences of manufacturers and retailers over the channel structures compatible? (5) Can the supply chain achieve Pareto improvement?
To accomplish the aims of this study, we developed a game-theoretic model to study the optimal channel decisions between retailers and manufacturers when the promotion is considered. In practice, the complexity of channel selection increases when the product variety and promotional effort involved in the marketing mix are considered. We present a game-theoretic model of two types of products (i.e., high- and low-quality products) and two channels (i.e., a centralized channel and a decentralized channel). Each product type is allocated to one of the two channel types. Thus, four dual-channel structures with and without promotional effort are obtained. These channels are derived from the hybrid-channel structure. For example, Levi Strauss and Jack & Jones provide low-quality products to consumers in their retail stores, but they supply relatively high-quality products to their terminal markets. To rank retailers’ and manufacturers’ structure preferences in those above four dual-channel structures without and with promotional effort, several comparisons must be made to differentiate their enhancement of supply chain efficiency.
The remainder of this paper is organized as follows. Section 2 presents the research background. Section 3 introduces four dual-channel structures with and without promotional effort, and for each, the demand and promotion analyses are given. Section 4 presents the structure preferences of manufacturers and retailers identified through the theoretical study. Section 5 presents the numerical analysis results for ranking retailers’ and manufacturers’ channel structures under different quality constraints. In Section 6, the proposed model’s rationality is verified using further numerical simulations. Finally, the conclusions are presented in Section 7.
2. Research Background
This study is the first to investigate whether retailers always undertake promotional effort under the same channel structure, which can be referred to as low-quality in a decentralized channel, high-quality in a centralized channel, and vice versa. Once promotional effort is undertaken, retailers must bear the relevant costs. Although retailers must bear additional costs, they can also obtain additional demand through promotional effort; moreover, this indicates that effort-induced demand does not depend on the product quality. Manufacturers can benefit from retailers’ promotional effort despite not making any effort. If the retailer and the manufacturer use the same channel structure, both of them can profit from the retailer’s promotional effort. In addition, manufacturers are the greatest beneficiaries of retailers’ promotional effort, mainly because they do not need to share promotional costs with the retailers. By contrast, retailers must make promotional effort and bear the associated costs. Retailers undertake promotional effort because the effort-induced demand is sufficient to offset the promotional cost and increase the aggregate profit of the retailer. However, there is an interaction between product-channel structure and promotion effort, and promotional effort might not always improve the supply chain profit across channels.
This paper is related to two lines of literature. The first is related to the relationship between channel structure and product quality, specifically the effect of channel structure on product quality [11,12,13] and the effect of product quality on channel structure [14,15,16]. This paper is particularly concerned with the effect of product quality on channel structure because it focuses on channel selection and quality choices. Huang et al. [17] discovered that a follower firm with cost asymmetry could strategically decentralize its sales channel to influence the leader firm’s quality choice when two products have low or moderate substitutability. Wang et al. [18] found that the equilibrium depends on the market type and that a manufacturer benefits the most from consumers’ high-quality valuations, strong loyalties, and channel centralization. Xiao et al. [19] determined that if offering a large variety of products is expensive, manufacturers prefer to use dual channels under the retailer Stackelberg channel leadership scenario rather than under the manufacturer Stackelberg scenario. However, if a large variety of products can be offered at a low cost, the manufacturer’s channel structure decision may be inverted. As a set, the papers above did not address the influence of promotional effort on manufacturers’ channel structure selection and quality allocation, which is the main focus of this paper. However, these papers provided the fundamental motivation and basis for this research.
The second related line of literature comprises the research on promotion. The studies in this line have examined the effect of promotion on channel structure. Karray [20] investigated equilibrium strategies for horizontal and vertical joint promotions in the supply chain and found that the effects of horizontal joint promotion on equilibrium profits depend on channel structure. Shi et al. [21] studied how the channel structure (decentralized or centralized) and the allocation of the product advertising authority affect the final advertising content and profits. The studies above have examined the relationship between promotion and channel structure. However, this paper emphasizes how promotional effort optimizes the hybrid-channel supply chain and ignores the effect of specific promotional methods. Numerous studies have been conducted on channel structure [22,23,24,25,26]. These studies have focused on matters rather than channel structure within promotional effort. We considered product qualities (high and low quality), promotional effort (effort-induced demand), and hybrid structures (centralized and decentralized channel) in this research to determine how manufacturers and retailers can increase supply chain efficiency.
We examined the effect of product variety on the channel strategy of agents (e.g., manufacturers and retailers) and the level of promotional effort. We investigated whether the channel strategies of the retailer and the manufacturer are stable when 0 < < 1 for products of varying quality. We found that the channel strategy is unstable when asymptotically increases and is given. Considering the manufacturer as an example, a dominant strategy of product-channel structure exists, which enhances the manufacturer’s feasible region of quality levels. Prima facie, the effort of the retailer should be related to the significance level of the product variety. When the interval length of is given, the smaller the value, the more effort must be made by the retailer irrespective of product qualities. In other words, the less significant the product variety, the less effort the retailer must make.
3. Methods—Modeling and Analysis
In principle, a manufacturer can design its distribution channel to sell its products either directly (i.e., in a centralized channel) or indirectly through an independent retailer (i.e., in a decentralized channel) for the terminal market [27]. In light of the multiproduct constraint, multichannel configuration, and promotional effort of the retailer, we studied and compared four hybrid-channel supply chain structures (Figure 1). We considered a case in which the supply chain consists of one manufacturer who provides products of varying quality and one retailer who provides promotional effort in a decentralized channel. In this case, a one-to-one correspondence between high-quality products, low-quality products, the decentralized channel, and the centralized channel is essential. In Case I, the retailer distributes a low-quality product through a decentralized channel and the manufacturer synchronously distributes a high-quality product through a centralized channel. By contrast, in Case II, the retailer distributes a high-quality product through a decentralized channel and the manufacturer synchronously distributes a low-quality product through a centralized channel. Case III is an expansion of the structure of Case I, and Case IV is an expansion of the structure of Case II. In Cases III and IV, the retailer is considered to expend promotional effort in a decentralized channel. For convenience, we considered the two hybrid-channel structures without promotional effort (Cases I and II) to be benchmark cases.

Figure 1.
Hybrid-channel supply chain configuration driven by multiple products and promotional effort.
Many studies have assumed that positing heterogeneous consumers reflect the real-world scenario. The term “heterogeneity” refers to the variation in the level of some attribute (e.g., product quality). Without loss of generality, we can assume that two types of products, namely high- and low-quality products, are sold by manufacturers. Moreover, we use the terms DH and DL to represent the market sizes of high- and low-quality products, respectively. To obtain the demand functions in different hybrid-channel structures, we adopted the framework of the utility theory and used a utility function applicable to heterogeneous consumers. Consequently, a consumer’s utility of product i = H, L (For simplicity, high and low are abbreviated as H and L, respectively, in the following text) in the terminal market, which can be expressed in Formula (1) as follows:
where and denote the quality and retail price of high-quality products, respectively, and and denote the quality and retail price of low-quality products, respectively. High-quality products are superior to low-quality products; thus . The term θ refers to the quality preference. This term reflects consumers’ heterogeneousness and is usually assumed to be distributed uniformly in the interval (0, 1) [28,29,30]. The utility function also implicitly assumes that any consumer with nonnegative utility will purchase one unit of product.
Game theory can be broadly applied as a frontier theoretical analysis tool in operations management to solve supply chain and marketing problems. In the aforementioned four cases, the manufacturer Stackelberg leader game was adopted to dynamically analyze the game relationships between the upstream, midstream, and downstream parts of the channel. Simultaneously, the Bertrand pricing game was used to explore the price strategy at a certain level of the dual-channel structure. Let us consider Case III as an example. In the first stage, the manufacturer allocates two types of products to two types of channels (e.g., low-quality products to a decentralized channel and high-quality products to a centralized channel). In the second stage, the manufacturer simultaneously determines the wholesale price of low-quality products in a decentralized channel and the selling price of high-quality products in a centralized channel. Finally, the retailer determines the selling price of low-quality products in a decentralized channel and the retailer synchronously makes promotional effort. We solved the aforementioned two games through backward induction.
3.1. Demand and Promotion Analysis
The consumer utility of high-quality products must be greater than that of low-quality products (i.e., uH > uL); otherwise, consumers will purchase low-quality products only. Low-quality products must meet a certain consumer utility threshold type (i.e., uL > 0); otherwise, consumers will not purchase any product. Thus, uH > uL > 0 is a necessary condition throughout the analysis. The demand functions of high- and low-quality products in the terminal market are analyzed using Equation (1).
where if and only if . Moreover, DH + DL is less than 1 when the market size is normalized to 1, which indicates that certain customers in the terminal market have negative utility for the current products. The remaining customers, Drc = 1 − (DH + DL) = pL/qL, then form the potential target of promotional effort by the retailer. The objective function of promotional effort used in this study is distinct from those used in other studies, which mainly focused on the level of promotional effort. The level of promotional effort is represented by s, which indicates that s new customers gain access to the market. The target object of the promotional effort is the remaining customers who hide their real requirements for high- and low-quality products. Accordingly, the terminal market can be segmented as follows: customers desiring high-quality products, customers desiring low-quality products, and the remaining customers with negative utility for the products (Figure 2).
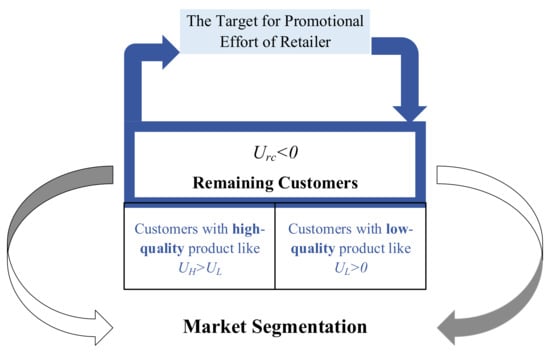
Figure 2.
Segmentation of the market into customers desiring high-quality products, customers desiring low-quality products, and the remaining customers.
Figure 2 indicates that the remaining customers with negative utility for products are potential customers for multiproduct manufacturers. The customers with negative utility for products are the target object of promotional effort rather than new customers accessing the market. Regardless of product quality, the demand function for the promotional effort by the retailer is , where ρ is the elastic coefficient, which represents the level of promotional effort, and 0 < ρ ≤ 1.
The promotional effort of the retailer may result in positive or negative utility. An increase in the effort-induced demand may generate increased profits for the retailer, which represents positive utility. However, an increase in the effort-induced demand also results in promotional costs for the retailer, and these are negative utility. The cost function of promotional effort [31] is given as follows: c(Ds) =, which is convex and increasing for any Ds value. The term k represents the cost coefficient of promotional effort, and k > 0. Without loss of generality, the term k can be normalized to one. This paper makes no assumption regarding the type of promotional effort used.
3.2. Pricing Strategy
In the process of supply chain quality management, multistage dynamic games exist. In this paper, only a two-stage dynamic game is considered. According to backward-induction computation, the retailer first selects its selling price in a decentralized channel and synchronously decides the amount of promotional effort (ρ) to expend. Next, the manufacturer charges the midstream retailer a wholesale price (w) and selects its selling price in a centralized channel; this represents a static Nash game. The parameters Πm and Πr denote the manufacturer’s profit and retailer’s profits, respectively. A manufacturer’s unit production cost that is a quadratic function of the product quality , i = H, L [27]. For convenience, the operational costs of different dual channels are not considered in this paper. The manufacturer’s and retailer’s profit functions in Case I can be written as follows:
For effective analysis, some constraints must be imposed. The selling prices must exceed the production costs such that pi > w > c(qi). Subject to the maximization of the manufacturer’s and retailer’s profit, we can obey the sequential game timing rules as follows:
The optimal solutions for wholesale selling prices with quality variations are then calculated (Table 1).

Table 1.
Optimal solutions for the wholesale selling prices for products with variations in the quality and promotional effort.
In Case II, the retailer distributes high-quality products through a decentralized channel and the manufacturer synchronously distributes low-quality products through a centralized channel. The manufacturer’s and retailer’s profit functions are expressed as follows:
The parameter setting and game timing rules in Case II are similar to those in Case I.
When the retailer makes the promotional effort in a decentralized channel, the sequential game timing rules undergo some changes. Thus, the sequential game timing rules in Case III differ from those in Cases I and II. The manufacturer’s and retailer’s profit functions in Case III can be written as follows:
where [DL + Ds] is the effort-induced demand for the low-quality product. The selling prices must exceed the production costs such that pi > w > c(qi). Subject to the maximization of the manufacturer’s and retailer’s profits, we can obey the sequential game timing rules as follows:
The optimal solutions for the wholesale selling prices for products with variations in the quality and promotional effort are then calculated (Table 1).
In Case IV, the retailer distributes high-quality products, making the promotional effort, through a decentralized channel and the manufacturer synchronously distributes low-quality products through a centralized channel. The manufacturer’s and retailer’s profit functions can be expressed as follows:
where [DH + Ds] is the effort-induced demand for the high-quality product. The parameter setting and game timing rules in Case IV are similar to those in Case III.
All the optimal solutions computed in Cases I to IV for the wholesale selling prices (w*) for products with variations in the quality and promotional effort are listed in Table 1. The optimal wholesale prices depend on qH and qL.
4. Results—Hybrid-Channel Supply Chain Optimization through Promotional Effort
The key aspect investigated in this study was the effect of two products of varying quality and promotional effort on the structure preferences of manufacturers and retailers. Players of the game tend to locally optimize their own profits sequentially without coordination rather than maximize the entire supply chain profit globally. Because different hybrid-channel structures exist, the agents in the supply chain exhibit heterogeneous behaviors in different cases.
Product demand and selling price vary with quality. Wholesale price and promotional effort can be viewed as functions of product qualities (, i = H, L). Thus, the manufacturer’s profit function varies with qualities irrespective of the channel structure. The profit functions of the manufacturer in different hybrid-channel structures are derived as follows:
Similarly, the retailer’s profit function also varies with product qualities irrespective of the channel structure. The profit functions of the retailer in different hybrid-channel structures can be derived as follows:
The optimal profits of the manufacturer and retailer in different structures all depend on qH and qL. We used several comparisons to determine whether the manufacturer and retailer benefit from the hybrid-channel structure with promotional effort.
4.1. Comparison: Case I versus Case III
Theorem 1.
For the retailer, low-quality product distribution driven by promotional effort in the decentralized channel (Πr3) outperforms low-quality product distribution in the decentralized channel without promotional effort (Πr1); For the manufacturer, the hybrid channel with promotional effort for low-quality product distribution (Πm3) outperforms the hybrid-channel without promotional effort for low-quality product distribution (Πm1).
When the retailer distributes low-quality products through a decentralized channel and the manufacturer synchronously distributes high-quality products through a centralized channel, both the retailer and the manufacturer benefit from the promotional effort of the retailer; thus, Πr3 > Πr1 and Πm3 > Πm1. Please see Appendix A for all the proofs.
4.2. Comparison: Case II versus Case IV
Theorem 2.
For the retailer, high-quality product distribution driven by promotional effort in the decentralized channel (Πr4) outperforms high-quality product distribution in the decentralized channel without promotional effort (Πr2). Moreover, for the manufacturer, the hybrid channel with promotional effort for high-quality product distribution (Πm4) outperforms the hybrid channel without promotional effort for high-quality product distribution (Πm2).
When the retailer distributes high-quality products through a decentralized channel and the manufacturer synchronously distributes low-quality products through a centralized channel, both the retailer and the manufacturer benefit from the promotional effort of the retailer; thus, Πr4 > Πr2 and Πm4 > Πm2.
Theorems 1 and 2 indicate that a retailer’s promotional effort, irrespective of the amount, absolutely benefits the retailer’s and manufacturer’s profits as long as they use the same hybrid-channel structure.
4.3. Comparison: Case I versus Case II
Theorem 3.
For the manufacturer, high-quality product distribution in the centralized channel (Πm1) is superior to low-quality product distribution in the centralized channel (Πm2) if qH(1 − qH)2 > qL(1 − qL)2. Moreover, for the retailer, high-quality product distribution in the decentralized channel (Πr2) is superior to low-quality product distribution in the decentralized channel (Πr1) under the same condition.
Theorem 4.
For the manufacturer, high-quality product distribution in the centralized channel (Πm1) is inferior to low-quality product distribution in the centralized channel (Πm2) if qH(1 − qH)2 < qL(1 − qL)2. Moreover, for the retailer, high-quality product distribution in the decentralized channel (Πr2) is inferior to low-quality product distribution in the decentralized channel (Πr1) under the same condition.
4.4. Comparison: Case III versus Case IV
Theorem 5.
For the retailer, high-quality product distribution driven by promotional effort in the decentralized channel (Πr4) is superior to low-quality product distribution driven by promotional effort in the decentralized channel (Πr3) if qH(1 − qH)2 > qL(1−qL)2. Moreover, for the manufacturer, the hybrid channel with promotional effort for high-quality product distribution (Πm4) is superior to the hybrid channel with promotional effort for low-quality product distribution (Πm3) if qH(1 − qH)2 < qL(1 − qL)2.
We can obtain the following inferences from Theorems 1–5:
- (i)
- When qH(1 − qH)2 > qL(1 − qL)2, Πm3 ≻ Πm1 ≻ Πm2 and Πm4 ≻ Πm2 for the manufacturer. Under the same condition, Πr4 ≻ Πr2 ≻ Πr1 and Πr4 ≻ Πr3 ≻ Πr1 for the retailer.
- (ii)
- When qH(1 − qH)2 < qL(1 − qL)2, Πm4 ≻ Πm2 ≻ Πm1 and Πm4 ≻ Πm3 ≻ Πm1 for the manufacturer. Under the same condition, Πr3 ≻ Πr1 ≻ Πr2 and Πr4 ≻ Πr2 for the retailer.
The solutions of some expressions, which contain indeterminate forms, cannot be determined theoretically [e.g., ∆Πm = Πm4 − Πm3, ∆Πm = Πm1 − Πm4, ∆Πr = Πr2 − Πr3 if qH(1 − qH)2 > qL(1 − qL)2 and ∆Πm = Πm2 − Πm3, ∆Πr = Πr4 − Πr3, ∆Πr = Πr1 − Πr4 if qH(1 − qH)2 < qL(1 − qL)2]. Therefore, numerical analysis was used to solve the indeterminate forms.
5. Results—Hybrid-Channel Supply Chain Optimization through Numerical Analysis
To solve the indeterminate forms, we used numerical analysis to rank the retailer’s and manufacturer’s channel structures in different mass intervals when the promotional effort is made.
5.1. Retailer’s Preferences
In theory, and if ; thus, only has to be compared with . As displayed in Figure 3, if is a critical plane, if and only if , ; , moreover, if , or , , where represents an implicit solution of the equation . Because is a binary high-order equation for qH and qL, qH value changes with qL value, and vice versa, which indicates that variables of qH and qL are correspondence relationships rather than independent relationships. For simplicity, we use numerical analysis to demonstrate that the existence of q∗H1 when qL is given (see blue areas in Figure 3) mainly results from a high-order equation, i.e., q∗H1 is an implicit function about qL. Meanwhile, similar observations have been made on the remaining analyses for other q∗H1 values (j = 2, 3, 4, 5, 6).
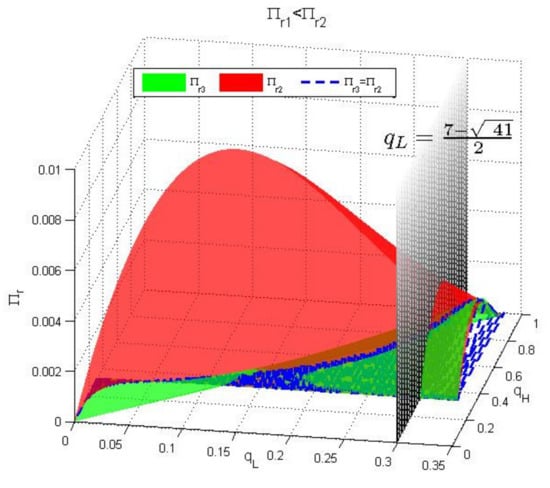
Figure 3.
Πr2 versus Πr3 when qH(1 − qH)2 > qL(1 − qL)2.
However, Πr3 ≻ Πr1 ≻ Πr2 and Πr4 ≻ Πr2 in theory if qH(1 − qH)2 < qL(1 − qL)2; thus, we must compare , and . Figure 4a shows that if and only if , ; otherwise , where represents an implicit solution of the equation Πr3 = Πr4. For simplicity, we use numerical analysis to demonstrate that the existence of q∗H2 when qL is given (see blue areas in Figure 4a) mainly results from a high-order equation, i.e., q∗H2 is an implicit function of qL.
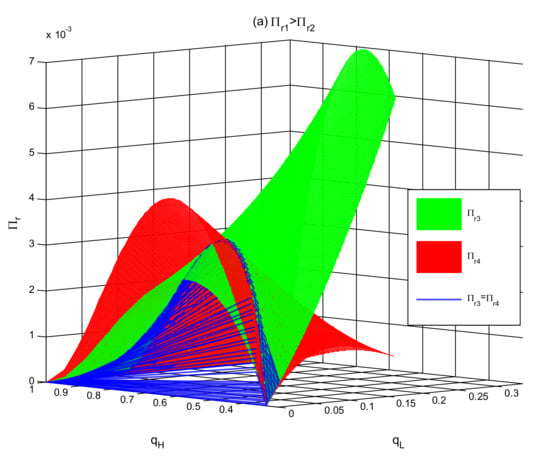
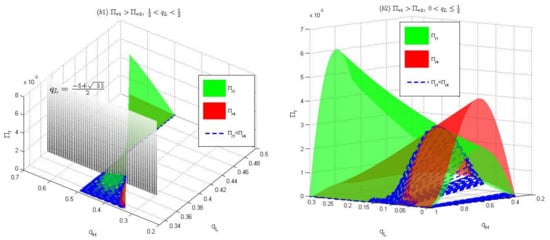
Figure 4.
Πr3 versus Πr4 versus Πr1 when qH(1 − qH)2 < qL(1 − qL)2.
Furthermore, comparing Πr4 with Πr1 is essential when Πr3 > Πr4. As displayed in Figure 4(b1), if is a critical plane, when , ; otherwise if , , where q∗H3 = qH3(qL) represents an implicit solution of the equation Πr4 = Πr1. For simplicity, we use numerical analysis to demonstrate that the existence of q∗H3 when qL is given (see blue areas in Figure 4b) mainly results from a high-order equation, i.e., q∗H3 is an implicit function about . In Figure 4(b2), if , ; otherwise, if , . These analyses about the combinations of the two-product qualities and the retailer’s preferences of channel structures are summarized in Table 2.

Table 2.
Retailer’s preference for channel structures in different mass intervals.
From the retailer’s channel preferences Πr4 ≻ Πr2 ≻ Πr3 ≻ Πr1 and Πr3 ≻ Πr1 ≻ Πr4 ≻ Πr2 in Table 2, we can find that Πr2 ≻ Πr3 and Πr1 ≻ Πr4, which indicates that promotional effort does not always improve the retailer’s profit across channels. It shows that there is an interaction between product-channel structure and promotional effort. In particular, the preference of Πr3 ≻ Πr1 ≻ Πr4 ≻ Πr2 shows that, given certain feasible region of quality levels shown in Table 2, the channel structure that the retailer sells the high-quality product and the manufacturer sells the low-quality product is a dominant strategy for the retailer.
5.2. Manufacturer’s Preferences
Theoretically, Πm4 ≻ Πm2 ≻ Πm1 and Πm4 ≻ Πm3 ≻ Πm1 if qH(1 − qH)2 < qL(1 − qL)2; thus, only Πm2 must be compared with Πm3. In Figure 5a, when is a critical plane, if , . Moreover, if , . In Figure 5b, if , . Moreover, if , , where represents an implicit solution of the equation Πm2 = Πm3. For simplicity, we use numerical analysis to demonstrate that the existence of q∗H4 when qL is given (see blue areas in Figure 5) mainly results from a high-order equation, i.e., q∗H4 is an implicit function about qL.
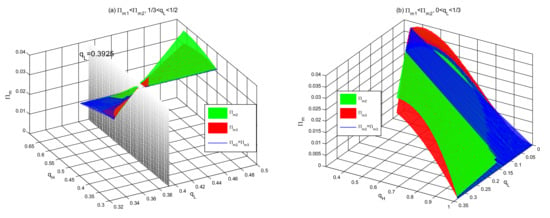
Figure 5.
Πm2 versus Πm3 when qH(1 − qH)2 < qL(1 − qL)2.
However, Πm3 ≻ Πm1 ≻ Πm2 and Πm4 ≻ Πm2 in theory if qH(1 − qH)2 > qL(1 − qL)2; thus, we only need to compare Πm3, Πm4, and Πm1. In Figure 6a, Πm3 < Πm4 if and only if , ; otherwise Πm3 > Πm4, where represents an implicit solution of the equation Πm3 = Πm4. For simplicity, we use numerical analysis to demonstrate that the existence of q∗H5 when qL is given (see blue areas in Figure 6a) mainly results from a high-order equation, i.e., q∗H5 is an implicit function about qL.
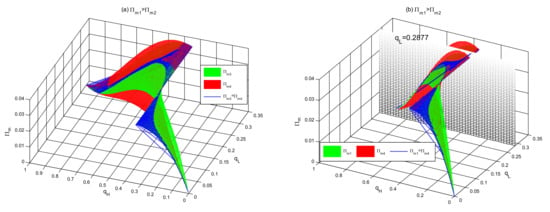
Figure 6.
Πm3 versus Πm4 versus Πm1 when qH(1 − qH)2 > qL(1 − qL)2.
Furthermore, comparing Πm4 with Πm1 is essential when Πm3 > Πm4. In Figure 6b, qL ≈ 0.2877 is a critical plane and Πm4 > Πm1 if 0 < qL ≤ 0.2877, q∗H6 < qH < q∗H5 or 0.2877 < qL < , qL < qH < q∗H5; otherwise, Πm4 < Πm1 if 0 < qL < 0.2877, qL < qH < q∗H6, where q∗H6 = qH6(qL) represents an implicit solution of the equation Πm4 = Πm1. For simplicity, we use numerical analysis to demonstrate that the existence of q∗H6 when qL is given (see blue areas in Figure 6b) mainly results from a high-order equation, i.e., q∗H6 is an implicit function of qL. These analyses of the combinations of the two-product qualities and the manufacturer’s preferences for channel structures are summarized in Table 3.

Table 3.
Manufacturer’s preference for channel structures in different mass intervals.
Like the aforementioned analysis in Table 2, similar observations can be made in Table 3. From the manufacturer’s channel preferencesΠm4 ≻ Πm2 ≻ Πm3 ≻ Πm1 and Πm3 ≻ Πm1 ≻ Πm4 ≻ Πm2, we can find thatΠm2 ≻ Πm3 and Πm1 ≻ Πm4, which indicates that promotional effort does not always improve the manufacturer’s profit across channels. It further shows that there is an interaction between product-channel structure and promotional effort. In particular, the preference of Πm4 ≻ Πm2 ≻ Πm3 ≻ Πm1 shows that, given certain feasible region of quality levels shown in Table 3, the channel structure that the retailer sells the high-quality product and the manufacturer sells the low-quality product is also a dominant strategy for the manufacturer.
5.3. Coordination between the Manufacturer and the Retailer
From Table 2 and Table 3, we know that the manufacturer and the retailer can mutually benefit when the retailer undertakes promotional efforts, i.e., Π3 and Π4. Further, we want to know if common mass intervals of product qualities exist to enable both the manufacturer and the retailer to prefer the structure Π3 or Π4. After the analysis, we find that the channel structure Π4 is the preferred one for both the manufacturer and the retailer, given the certain range of the mass interval of high- and low-product qualities shown in Table 4. Thus, the supply chain system can achieve the Pareto improvement without any additional coordination mechanism between the manufacturer and the retailer.

Table 4.
Coordination strategy between the manufacturer and the retailer.
By combining theoretical study with numerical analysis, some results were obtained for the retailer’s and manufacturer’s channel strategies with promotional effort. These results are listed in Table 2 and Table 3. To further comprehend our theoretical model and the obtained results, numerical simulations were performed for the four cases.
6. Results—Further Numerical Simulations and Discussions
To determine the effects of product variety and promotional effort on the agents’ channel strategies, we tested the robustness of the theoretical results by using numerical algorithms. We examined the retailer’s and manufacturer’s optimal rank under different mass intervals and promotional effort and used different parameter settings, product qualities, and promotional values, to investigate the results.
Figure 7 displays the numerical results for the retailer’s channel preference in different mass intervals, and Figure 7a is in agreement with Table 2 when qL = 0.1560. Through calculations, the threshold points , , , can be obtained when qL = 0.1560. When qL = 0.1560, Πr4 ≻ Πr2 ≻ Πr3 ≻ Πr1 if , Πr4 ≻ Πr3 ≻ Πr2 ≻ Πr1 if , Πr4 ≻ Πr3 ≻ Πr1 ≻ Πr2 if , Πr3 ≻ Πr4 ≻ Πr1 ≻ Πr2 if , Πr3 ≻ Πr1 ≻ Πr4 ≻ Πr2 if , respectively. When qL is given, as qH increases, the retailer’s channel strategy changes. Furthermore, in the aforementioned five mass intervals, the retailer’s maximum profit structure is selected. This structure enables the retailer to improve the supply chain system.
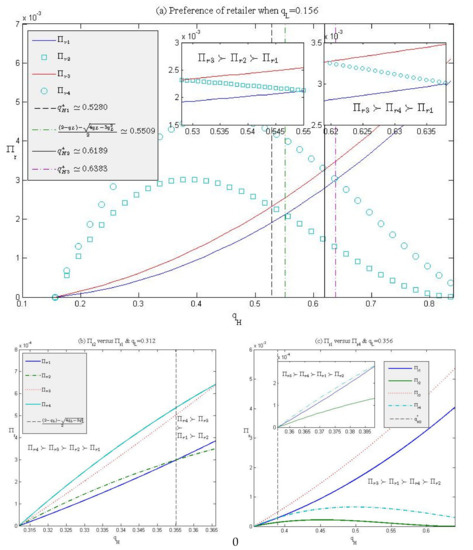
Figure 7.
Retailer’s channel structures in different mass intervals.
However, in some special mass intervals, the retailer’s optimal rank does not change even though qL increases. As displayed in Figure 7b, Πr4 ≻ Πr3 ≻ Πr2 ≻ Πr1 if when qL = 0.3120, which differs from the results . Moreover, Πr3 ≻ Πr4 ≻ Πr1 ≻ Πr2 if when qL = 0.3560 (Figure 7c), which differs from the result . Thus, in some special mass intervals, as qL increases, the retailer’s selection differs in mass intervals rather than the optimal rank.
Figure 8 displays the numerical results for the manufacturer’s channel preferences in different mass intervals, and Figure 8a is in agreement with Table 3 when . Through calculations, the threshold points , , , and are obtained when . When , Πm3 ≻ Πm1 ≻ Πm4 ≻ Πm2 if , Πm3 ≻ Πm4 ≻ Πm1 ≻ Πm2 if , Πm4 ≻ Πm3 ≻ Πm1 ≻ Πm2 if , Πm4 ≻ Πm3 ≻ Πm2 ≻ Πm1 if , Πm4 ≻ Πm2 ≻ Πm3 ≻ Πm1 if , respectively. When is given, as increases, the manufacturer’s channel strategy changes. Furthermore, in the aforementioned five mass intervals, the manufacturer’s maximum profit structure is selected. This structure enables the manufacturer to improve the supply chain system.
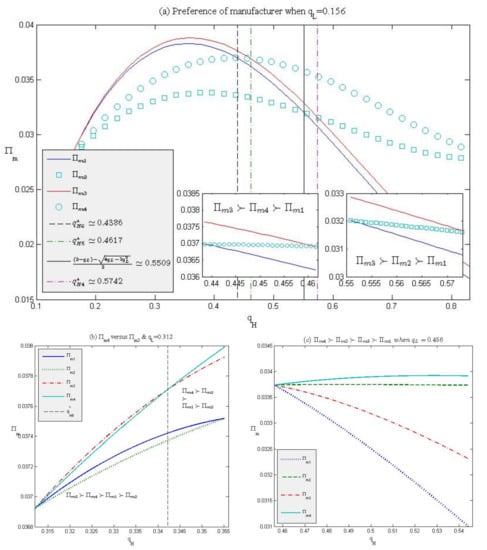
Figure 8.
Manufacturer’s channel structures in different mass intervals.
However, in some special mass intervals, the manufacturer’s optimal rank does not change even though qL increases. As displayed in Figure 8b, Πm3 ≻ Πm4 ≻ Πm1 ≻ Πm2 if when , which differs from the results . Moreover, as displayed in Figure 8c, Πm4 ≻ Πm2 ≻ Πm3 ≻ Πm1 if when , which differs from the results . As increases in some special mass intervals, the manufacturer’s selection differs in mass intervals rather than optimal rank.
Sensitivity analysis was conducted to determine the effect of product quality heterogeneity on promotional effort. The promotion of high-quality products requires more effort by the retailer than that of the low-quality product (Figure 9). According to constraints such as 0 < qL < and qL < qH < 1 − qL, as qL increases, the interval length (1 − 2qL) of qH asymptotically decreases, and the product variety () also decreases. When qL tends to qH, considerable benefits can be achieved by the retailer even if it makes only a small effort to promote high- or low-quality products. When 1 − 2qL is given and qL is minimal (qL → 0), the retailer must expend more promotional effort to achieve benefits, like ρ0.156 > ρ0.256 > ρ0.356 > ρ0.456 in the same premise condition.
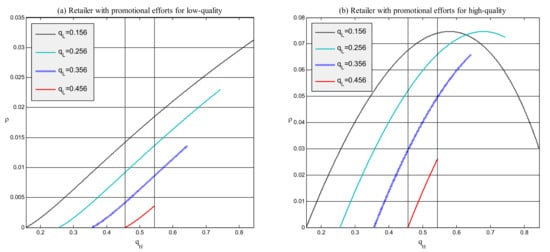
Figure 9.
Sensitivity analysis for the retailer’s promotional effort.
7. Conclusions
In this study, we determined the main factors that influence the effect of promotional effort on the optimization of supply chain quality decisions in the proposed leader-follower framework under the constraints of multiproduct promotion and a classic hybrid-channel structure. In contrast to previous studies on the relationship between channel management and promotional effort, this study mainly focused on how promotional effort optimizes the structure preferences of manufacturers and retailers in four dual-channel structures. The obtained results provide essential managerial implications for operational management and marketing practice.
Theoretically, in a low-quality decentralized channel, a retailer generally prefers to engage in the promotion even if the manufacturer is reluctant to share promotional costs. A similar phenomenon is observed in a high-quality decentralized channel. If the agents use the same channel structure, the retailer’s promotional effort, irrespective of the amount, is beneficial to the retailer’s and manufacturer’s profits. Numerical computation yielded intuitive and visual results that offset the drawbacks of theoretical analysis. The numerical approach provided more generalized results for the retailer’s and manufacturer’s channel strategies under different quality constraints.
This research provides a general framework for understanding how product variety affects supply chain efficiency and the level of promotion through numerical analysis. We discovered that the channel strategy is unstable under different quality combinations, which indicates how the manufacturer and retailer can improve the supply chain system. Most importantly, we found an effective feasible region of quality levels between high and low products, which achieves the Pareto efficiency for the manufacturer and retailer without any additional coordination mechanism. Our extended analysis suggests that the less significant the product variety is, the less effort is made by the retailer. This research indicates that product variety and promotional effort influence supply chain efficiency. The study analysis and results were based on deterministic demand, which is a limitation of this research. The validity of the conclusions obtained in this study should be examined when product demand uncertainty is significant. We can also consider endogenizing the manufacturer’s decision regarding product quality in future research.
Author Contributions
B.C., Conceptualization, Methodology, Formal analysis, Model-setting, Writing—original draft, Writing—review and editing; Q.Z., Conceptualization, Supervision, Funding acquisition, Methodology, Model-setting, Validation, Writing—original draft, Writing—review and editing; M.C., Conceptualization, Methodology, Writing—review and editing; All authors have read and agreed to the published version of the manuscript.
Funding
This research was partially funded by the Key Project of National Social Science Foundation of China (21AGL014); Natural Science Foundation of Guangdong—Guangdong Basic and Applied Basic Research Foundation (2021A1515011894); Guangdong 13th-Five-Year-Plan Philosophical and Social Science Fund (GD20CGL28); Shenzhen Science and Technology Program (JCYJ20210324093208022); The Ministry of Education of Humanities and Social Science project (21YJC630002); Natural Science Basic Research Program of Shaanxi (2020JQ-688); Scientific Research Program Funded by Shaanxi Provincial Education Department (20JK0704); Project funded by China Postdoctoral Science Foundation (2019M653574).
Institutional Review Board Statement
Not applicable.
Informed Consent Statement
Not applicable.
Data Availability Statement
Not applicable.
Conflicts of Interest
The authors declare no conflict of interest.
Appendix A
Detailed demand analysis If Di > 0 (i = H, L, rc), pH − pL < qH − qL and are constraint conditions for Equation (2) irrespective of the channel structure. By substituting all the optimal computational solutions from Table 1 into the aforementioned two inequations, we can obtain the necessary and sufficient conditions for the four considered cases such that 0 < qL < and qL < qH < 1 − qL.
Proof of Theorem 1.
By combining Equations (11) and (13), we can compute the increment in the retailer’s profit as follows:
Because 0 < qL < and qL < qH < 1−qL, and , that is, . Furthermore, . Because and , . Thus, the incremental function is strictly greater than zero (i.e., Πr3 > Πr1). By combining Equations (7) and (9), the increment in the manufacturer’s profit can be computed as follows:
Πm3 −Πm1 indicates that which is always nonnegative. □
Proof of Theorem 2.
By combining Equations (12) and (14), we can compute the increment in the retailer’s profit as follows:
Because , . Furthermore, . Because , . Thus, the incremental function is strictly greater than zero (i.e., Πr4 > Πr2). By combining Equations (8) and (10), we can compute the increment in the manufacturer’s profit as follows:
Πm4 −Πm2 indicates that which is always nonnegative. □
Proof of Theorems 3 and 4.
By combining Equations (11) and (12) or Equations (7) and (8), we can respectively compute the profit increment as follows:
The aforementioned two incremental functions indicate that the trends of ∆Πr and ∆Πm are the same. If qH(1 − qH)2 > qL(1 − qL)2, ∆Πr, ∆Πm > 0; otherwise, ∆Πr, ∆Πm < 0. Furthermore, we can solve qH from cubic equations with one variable, such as qH(1 − qH)2 = qL(1 − qL)2, where qL is a parameter, and vice versa. Thus, the following equation is obtained:
□
Proof of Theorem 5.
By combining Equations (13) and (14), we can compute the increment in the retailer’s profit when qH(1 − qH)2 > qL(1 − qL)2.
where
Temp1 can be decomposed into multiplied multinominal factors as follows:
Because qH(1 − qH)2 > qL(1 − qL)2, . Because and , . Moreover, because and . Thus the incremental function is strictly greater than zero (i.e., Πr4 > Πr3). By combining Equations (9) and (10), we can compute the increment in the manufacturer’s profit when qH(1 − qH)2 < qL(1 − qL)2.
where . Temp2 can be decomposed into multiplied multinominal factors as follows:
Because qH(1 − qH)2 < qL(1 − qL)2, . Because . Furthermore, . Thus, the incremental function is strictly greater than zero (i.e., Πm4 > Πm3). In conclusion, the following equation is obtained:
□
References
- Liu, B.; Cai, G.; Tsay, A. Advertising in asymmetric competing supply chains. Prod. Oper. Manag. 2014, 23, 1845–1858. [Google Scholar] [CrossRef]
- Dan, B.; Zhang, S.; Zhou, M. Strategies for warranty service in a dual-channel supply chain with value-added service competition. Int. J. Prod. Res. 2018, 56, 5677–5699. [Google Scholar] [CrossRef]
- Jiang, Y.; Liu, Y.; Shang, J.; Yildirim, P.; Zhang, Q. Optimizing online recurring promotions for dual-channel retailers: Segmented markets with multiple objectives. Eur. J. Oper. Res. 2018, 267, 612–627. [Google Scholar] [CrossRef]
- Li, Y.; Pan, J.; Tang, X. Optimal strategy and cost sharing of free gift cards in a retailer power supply chain. Int. Trans. Oper. Res. 2021, 28, 1018–1045. [Google Scholar] [CrossRef]
- Tai, P.D.; Duc, T.T.; Buddhakulsomsiri, J. Value of information sharing in supply chain under promotional competition. Int. Trans. Oper. Res. 2020, 29, 2649–2681. [Google Scholar] [CrossRef]
- Trivedi, M.; Gauri, D.K.; Ma, Y. Measuring the efficiency of category-level sales response to promotions. Manag. Sci. 2016, 63, 3473–3488. [Google Scholar] [CrossRef]
- Chen, J.; Liang, L.; Yao, D.Q.; Sun, S. Price and quality decisions in dual-channel supply chains. Eur. J. Oper. Res. 2017, 259, 935–948. [Google Scholar] [CrossRef]
- Ovezmyradov, B.; Kurata, H. Effects of customer response to fashion product stockout on holding costs, order sizes, and profitability in omnichannel retailing. Int. Trans. Oper. Res. 2019, 26, 200–222. [Google Scholar] [CrossRef]
- Wang, W.; Li, G.; Cheng, T. Channel selection in a supply chain with a multi-channel retailer: The role of channel operating costs. Int. J. Prod. Econ. 2016, 173, 54–65. [Google Scholar] [CrossRef]
- Yang, Z.; Hu, X.; Gurnani, H.; Guan, H. Multichannel distribution strategy: Selling to a competing buyer with limited supplier capacity. Manag. Sci. 2017, 64, 2199–2218. [Google Scholar] [CrossRef]
- Matsui, K. Asymmetric product distribution between symmetric manufacturers using dual-channel supply chains. Eur. J. Oper. Res. 2016, 248, 646–657. [Google Scholar] [CrossRef]
- Shao, J.; Krishnan, H.; McCormick, T.S. Distributing a product line in a decentralized supply chain. Prod. Oper. Manag. 2013, 22, 151–163. [Google Scholar] [CrossRef]
- Shao, L.; Li, S. Bundling and product strategy in channel competition. Int. Trans. Oper. Res. 2019, 26, 248–269. [Google Scholar] [CrossRef]
- Bian, J.; Guo, X.; Li, K. Distribution channel strategies in a mixed market. Int. J. Prod. Econ. 2015, 162, 13–24. [Google Scholar] [CrossRef][Green Version]
- Kalnins, A. Pricing variation within dual-distribution chains: The different implications of externalities and signaling for high-and low-quality brands. Manag. Sci. 2016, 63, 139–152. [Google Scholar] [CrossRef]
- Li, S.; Cheng, H.K.; Jin, Y. Optimal distribution strategy for enterprise software: Retail, saas, or dual channel? Prod. Oper. Manag. 2018, 27, 1928–1939. [Google Scholar] [CrossRef]
- Huang, Q.; Yang, S.; Shi, V.; Zhang, Y. Strategic decentralization under sequential channel structure and quality choices. Int. J. Prod. Econ. 2018, 206, 70–78. [Google Scholar] [CrossRef]
- Wang, S.; Hu, Q.; Liu, W. Price and quality-based competition and channel structure with consumer loyalty. Eur. J. Oper. Res. 2017, 262, 563–574. [Google Scholar] [CrossRef]
- Xiao, T.; Choi, T.M.; Cheng, T. Product variety and channel structure strategy for a retailer-Stackelberg supply chain. Eur. J. Oper. Res. 2014, 233, 114–124. [Google Scholar] [CrossRef]
- Karray, S. Cooperative promotions in the distribution channel. Omega 2015, 51, 49–58. [Google Scholar] [CrossRef]
- Shi, H.; Liu, Y.; Petruzzi, N. Informative advertising in a distribution channel. Eur. J. Oper. Res. 2019, 274, 773–787. [Google Scholar] [CrossRef]
- Cao, J.; So, K.; Yin, S. Impact of an “online-to-store” channel on demand allocation, pricing and profitability. Eur. J. Oper. Res. 2016, 248, 234–245. [Google Scholar] [CrossRef]
- Glock, C.H.; Kim, T. The effect of forward integration on a single-vendor– multi-retailer supply chain under retailer competition. Int. J. Prod. Econ. 2015, 164, 179–192. [Google Scholar] [CrossRef]
- Jin, Y.; Wu, X.; Hu, Q. Interaction between channel strategy and store brand decisions. Eur. J. Oper. Res. 2017, 256, 911–923. [Google Scholar] [CrossRef]
- Lan, Y.; Li, Y.; Papier, F. Competition and coordination in a three-tier supply chain with differentiated channels. Eur. J. Oper. Res. 2018, 269, 870–882. [Google Scholar] [CrossRef]
- Li, W.; Chen, J. Backward integration strategy in a retailer Stackelberg supply chain. Omega 2018, 75, 118–130. [Google Scholar] [CrossRef]
- Shi, H.; Liu, Y.; Petruzzi, N. Consumer heterogeneity, product quality, and distribution channels. Manag. Sci. 2013, 59, 1162–1176. [Google Scholar] [CrossRef]
- Choi, C.J.; Shin, H.S. A comment on a model of vertical product differentiation. J. Ind. Econ. 1992, 40, 229–231. [Google Scholar] [CrossRef]
- Lehmann-Grube, U. Strategic choice of quality when quality is costly: The persistence of the high-quality advantage. RAND J. Econ. 1997, 28, 372–384. [Google Scholar] [CrossRef]
- Moorthy, K.S. Product and price competition in a duopoly. Mark. Sci. 1988, 7, 141–168. [Google Scholar] [CrossRef]
- Krishnan, H.; Kapuscinski, R.; Butz, D. Coordinating contracts for decentralized supply chains with retailer promotional effort. Manag. Sci. 2004, 50, 48–63. [Google Scholar] [CrossRef]
Publisher’s Note: MDPI stays neutral with regard to jurisdictional claims in published maps and institutional affiliations. |
© 2022 by the authors. Licensee MDPI, Basel, Switzerland. This article is an open access article distributed under the terms and conditions of the Creative Commons Attribution (CC BY) license (https://creativecommons.org/licenses/by/4.0/).