Review

A Comprehensive Bibliometric Analysis of Fractional Programming (1965–2020)

1
Department of Business Transformation, Surrey Business School, University of Surrey, Guildford GU2 7XH, UK
2
Department of Systems Engineering, Faculty of Economics, VŠB-Technical University of Ostrava, Sokolská třida 33, 702 00 Ostrava, Czech Republic
3
Department of Operations Management & Business Statistics, College of Economics and Political Science, Sultan Qaboos University, Muscat P.O. Box 50, Oman
4
Department of Instructional & Learning Technologies, College of Education, Sultan Qaboos University, Muscat P.O. Box 50, Oman
*
Author to whom correspondence should be addressed.
Mathematics 2022, 10(11), 1796; https://doi.org/10.3390/math10111796
Submission received: 19 March 2022 / Revised: 18 May 2022 / Accepted: 19 May 2022 / Published: 24 May 2022

Abstract

:
Fractional programming (FP) refers to a family of optimization problems whose objective function is a ratio of two functions. FP has been studied extensively in economics, management science, information theory, optic and graph theory, communication, and computer science, etc. This paper presents a bibliometric review of the FP-related publications over the past five decades in order to track research outputs and scholarly trends in the field. The reviews are conducted through the Science Citation Index Expanded (SCI-EXPANDED) database of the Web of Science Core Collection (Clarivate Analytics). Based on the bibliometric analysis of 1811 documents, various theme-related research indicators were described, such as the most prominent authors, the most commonly cited papers, journals, institutions, and countries. Three research directions emerged, including Electrical and Electronic Engineering, Telecommunications, and Applied Mathematics.

1. Introduction

A constrained optimization problem aims at selecting the best (optimal) solution from all feasible (possible) solutions via the optimization (maximization/minimization) of an objective function in the presence of a set of constraints. If the objective function involves a ratio of two functions, the problem is called fractional programming (FP). The earliest known FP is probably the equilibrium model of Von Neumann [1], where the objective function was the maximization of the growth rate (Frenk and Schaible) [2]. Charnes and Cooper [3] had the merit to pioneer a methodical study on FP, in which a linear FP is converted into a linear program through a variable transformation. The first collection of results pertaining to FP with a single ratio can be found in Schlette [4]. Over two consecutive decades, two books, authored by Craven [5] and Stancu-Minasian [6] were published, each including a chapter on multi-ratio FP. The most recent bibliography on FP is by Stancu-Minasian [7]. Studies on FP span many fields of economics, management science, information theory, optic and graph theory, communication, and computer science, etc. Recent applications include bank asset and liability management (Chuluunbaatar, Rentsen [8]), cyber-security (Zheng et al. [9]), power allocation (Dao and Kim, [10]; He et al. [11]), device-to-device communication (Hamdi et al. [12], wireless communication (Ammar et al. [13]; Sboui et al. [14]), mobile edge computing (Ma et al. [15]), optimization of resources for satellites (Ding et al. [16]), oil refinery waste management (Zhumadillayeva et al. [17], optimization of the operating modes of catalytic reforming units (Orazbayev et al. [18]), data envelopment analysis (Toloo [19]), and consequential life cycle optimization (Zhao and You, [20]), to mention just a few studies. Per se, the spectrum of real-world applications of FP is significantly expanding, which renders it crucial that a review of related literature is conducted for a better understanding of the state-of-the-art, besides more informed identification of future research directions. From this perspective, a literature review provides scholars with the evidence to pursue prospective research venues (Grant, Booth [21]).
The bibliometric approach is adopted for conducting the proposed literature review on FP. Such an option lies in the superior features of the bibliometric review, which (i) provides a quantitative analysis of written publications (ii) includes geographical and institutional aspects in the analysis, and (iii) examines the indicators of performance, including developments over time periods, subject domains or disciplines, and types of literature and authorship. For an in-depth discussion on the advantages of a bibliometric review, we refer the reader to Ellegaard and Wallin [22].
Depending on the review’s purpose and approach, the most common types of literature reviews include the critical review, systematic (mapping) review, rapid review, narrative (traditional) review, scoping review, bibliography review, and the bibliometric review (Grant, Booth [21]).
A systematic review uses repeatable analytical methods to collect, analyze, and synthesize secondary data to inform practice (Munn et al. [23]). Systematic reviews formulate research questions that are broad or narrow in scope, and identify the data that are directly related to these questions. Very often, these reviews provide an exhaustive summary of current evidence that is relevant to a research question. In some cases, such reviews appraise research studies from a more critical perspective, and synthesize the findings qualitatively or quantitatively. Our initial search reveals that there are 216,274 systematic review records in the Web of Science (WoS), where the first paper is published by Alm [24], and the top-cited paper is due to Stroup et al. [25], with 12,610 citations.
A critical review is much more than a simple summary, as it involves an analysis, as well as an evaluation of the extant studies. It requires researchers to question the literature and to present their evaluation of the paper. Williams [26] highlights that reading critically and analyzing all elements of a research paper are essential for a high-quality critical review. Indeed, all aspects of the text should be considered, including the structure, the methods, the reasons and evidence, and the conclusions. According to our preliminary investigation, there are currently 29,873 critical review records in the WoS databases; Whiteside, Walton [27] and Podsakoff et al. [28] are the first and the top-cited (29,448 citations) critical review papers, respectively.
A narrative review has been considered as an objective, critical, and comprehensive analysis of information in a particular field. Using this method provides some opportunities for researchers to establish a theoretical framework for their research. However, the latter review type is criticized for its lack of explicit intent to maximize the scope of the data collection or its analysis. Our cursory analysis points out that there are 14,691 narrative review papers in the WoS databases., the first one being published by Buell [29]. Warburton et al. [30] is the top-cited systematic review paper, with 3686 citations.
A rapid review is a form of literature synthesis that systematically reviews a part of the literature. It uses several design decisions and practical steps to reduce the time needed to identify, aggregate, and answer the research question. This type of review assesses what is already known for research, and critically evaluates the existing studies (Thomas et al. [31]). Time limitation is the main weakness of a rapid review, which may lead to lower quality of the assessment, compared to other types of literature reviews. Our brief examination reveals that 1114 rapid review papers exist in the WoS. The first research is published by Settlage et al. [32], whereas Brooks et al. [33] is the top-cited paper, with 2869 citations.
A scoping review aims to search for the key concepts underpinning a field of study by mapping the language and data that surround these concepts, and by synthesizing the available evidence (Mays et al. [34] and Arksey, O’Malley [35]). A scoping review may often be a preliminary stage for a systematic review to determine the scope of coverage of a body of literature (Munn et al. [23]) Our preliminary investigations show that 9932 scoping review papers are recorded in the WoS; Arksey [36] and Peters et al. [37] are, respectively, the first and the top-cited (1099 citations) papers.
A bibliographical review involves the analysis and explanation of all concepts, definitions, hypotheses, theoretical approaches, studies, and antecedents of a particular topic (Esquirol-Caussa et al. [38]). A bibliographical review can support high-quality research by enabling the elaboration of the most appropriate research protocols, the integration of the best scientific evidence, and the best insights into the field of study (Eckert et al. [39]). Our preparatory research demonstrates that there exist 873 bibliographic review papers. Geddes, James [40] is the first paper under this category, whereas Zhang, Jiang [41] is the top-cited paper, with 1374 citations.
A bibliometric review provides an overall structure of a particular research field by using quantitative (statistical) analysis and distributed architecture research/literature production (Persson et al. [42]). In addition to a comprehensive review of the literature, it also considers other elements of the paper, such as the keywords, affiliation, title, and abstract, etc. Historically, the bibliometric review can be traced back to the 1920s (Hulme [43]). In our initial search, we found 14,717 records on bibliometric review in the WoS databases, with Fairthorne [44] as the first paper and Van Eck, Waltman [45] holding a top number, with 2205 citations.
Figure 1 compares the aforementioned types of literature reviews from four different standpoints: speed, methodological details, risk of bias, and comprehensiveness.
As can be seen, bibliometric reviews can be conducted faster than the other types of reviews, especially systematic reviews, which are the most time demanding, which is certainly due to the advanced level of the methodological details that they may require. Moreover, bibliometric studies are the most comprehensive but the least likely to be biased, as opposed to narrative reviews, where fewer methods are generally covered.
For an in-depth discussion regarding the types of literature reviews, we refer the reader to Grant and Booth [21].
Writing a literature review requires not only a good level of organization of the previous research (Shuttleworth [46] and Rowley, Slack [47]), but also an adequate choice of citation database. The proposed review of FP was conducted on the WoS. The choice for the WoS data source was due to the fact that (i) WoS is the largest and most trusted global citation database in the world, (ii) WoS is the most powerful research engine, providing the best-in-class publication and citation data for access and evaluation, and (iii) WoS collects and indexes high-quality research and creates the most comprehensive and complete citation network for every single record. The WoS data source is widely used for bibliometric reviews in many areas, including supply chain management (Govindan et al. [48]), blockchain (Guo et al. [49]), data envelopment analysis (Liu et al. [50]), sustainable business models (Rosato at al. [51]), energy metabolism (Tang et al. [52]), Fenton oxidation (Usman, Ho [53]), and uncertain group decision making (Wang et al. [54]). The WoS website provides a navigation environment for a broad search across disparate resources, and enables the graphical representation of publication trends.
Among the data sources that are available for researchers to find, cite, link, access, and reuse academic publications, MathSciNet, CrossRef, Google Scholar, Scopus, and WoS are the most commonly used.
(i)
MathSciNet is the most reliable source in the field of mathematics, and it originated in 1940 as the journal Mathematical Reviews. It is a bibliographic database created by the American Mathematical Society in 1996. MathSciNet encompasses almost 3.6 million items and over 2.3 million direct links to original articles from approximately 650 journals.
(ii)
CrossRef, as the first data source, was established in 2000 by 12 publishers to simplify the process of linking to research on other publishers’ platforms. In recent years, CrossRef has also been used for citation analysis, digital object identification (DOI), and metadata search (Harzing [55]).
(iii)
Google Scholar is one of the academic projects by Google, founded in November 2004 as an index for academic literature full text or metadata search. The objective of Google Scholar was to bring Google search simplicity to the academic environment, but it has crawled the whole web by indexing any record with seemingly academic structure (Martín-Martín et al. [56]). By using this inclusive approach, Google Scholar provides comprehensive coverage of scientific/academic documents without following the selective journal-based inclusion policies (Orduña-Malea et al. [57]; Van Noorden [58]; and Martín-Martín et al. [59]). Google Scholar covers over 300 million records (Delgado López-Cózar et al. [60]).
(iv)
Scopus was launched in 2004 as Elsevier’s abstract and citation data source. It is one of the largest abstract and citation databases of publications (with over 1.7 billion cited references), covering nearly 41,462 titles from approximately 11,678 publishers. It covers over 76 million records with 3 million new items added every year (Baas et al. [61]). Scopus is used by more than 3000 academic, government, and corporate institutions.
(v)
WoS was established by the Institute for Scientific Information (ISI). Later, it transferred to Thomson Reuters, and is currently a part of Clarivate Analytics. WoS contains the following six main citation databases: (i) Science Citation Index (SCI), (ii) Social Sciences Citation Index (SSCI), (iii) Arts & Humanities Citation Index (AHCI), (iv) Emerging Sources Citation Index (ESCI), (v) Book Citation Index (BCI), and (vi) Conference Proceedings Citation Index (CPCI). It is the world’s first citation database, with over 1.9 billion cited references from over 171 million records, including 34,358 titles such as journals, books, and conference proceedings).
Under the WoS website, the wealth of data extracted for the bibliometric review leads indubitably to data processing and interpretation challenges (Solomon [62]). To address these issues, visualization and mapping tools are the best suited for creating graphical representations of the data and enhancing users’ understanding. In this study, we employ the well-known VOSviewer software (Van Eck, Waltman [63,64,65]), which allows for a comprehensive bibliometric analysis, including the co-citation of cited references, cited authors, and cited journals. VOSviewer is a Java-based program that is able to construct, visualize, and explore node-link maps based on bibliographic data (see Van Eck, Waltman [63]). It focuses entirely on the visualization of bibliometric networks and provides distance-based visualizations rather than graph-based ones. Moreover, VOSviewer (i) possesses functionalities for zooming, scrolling, and searching, (ii) uses the “visualization of similarities” technique to construct a map, and (iii) provides bibliometric mapping and co-occurrence analysis on the title, abstract, and keywords. Furthermore, VOSviewer is an easy-to-use software and it is freely available to the bibliometric research community. Yet, VOSviewer cannot perform citation burst analysis. Such a deficiency has been tackled by using the application CiteSpace (Chen [66,67]), which enables us to show a temporal perspective on the publication and present citation burst.
There are other tools for creating bibliometric networks, but they cannot comprehensively cover all aspects of a bibliometric analysis, such as ‘bibliometric coupling’, ‘text mining’, and ‘co-occurrence analysis’. For instance, CitNetExplorer (van Eck and Waltman, [65,68]) and HistCite (Garfield [69]) only focus on citation analysis.
The rest of this study is organized as follows. Section 2 succinctly discusses the procedures employed for conducting the current study. In Section 3, the extracted information is analyzed from multiple perspectives, and appropriate conclusions are drawn. Finally, Section 4 concludes the paper.

2. Methodology

This section presents the procedures that are adopted for gathering, visualizing, and mapping data toward an efficient synthesis of the current literature on FP and its applications. We employ the WoS website as a data source, and VOSviewer software for constructing and visualizing bibliometric networks.

2.1. Data Source (WoS)

In order to search the relevant literature records, we proceeded as follows.
(i)
We select the “Web of Science Core Collection” database, which includes all of the mentioned indexes.
(ii)
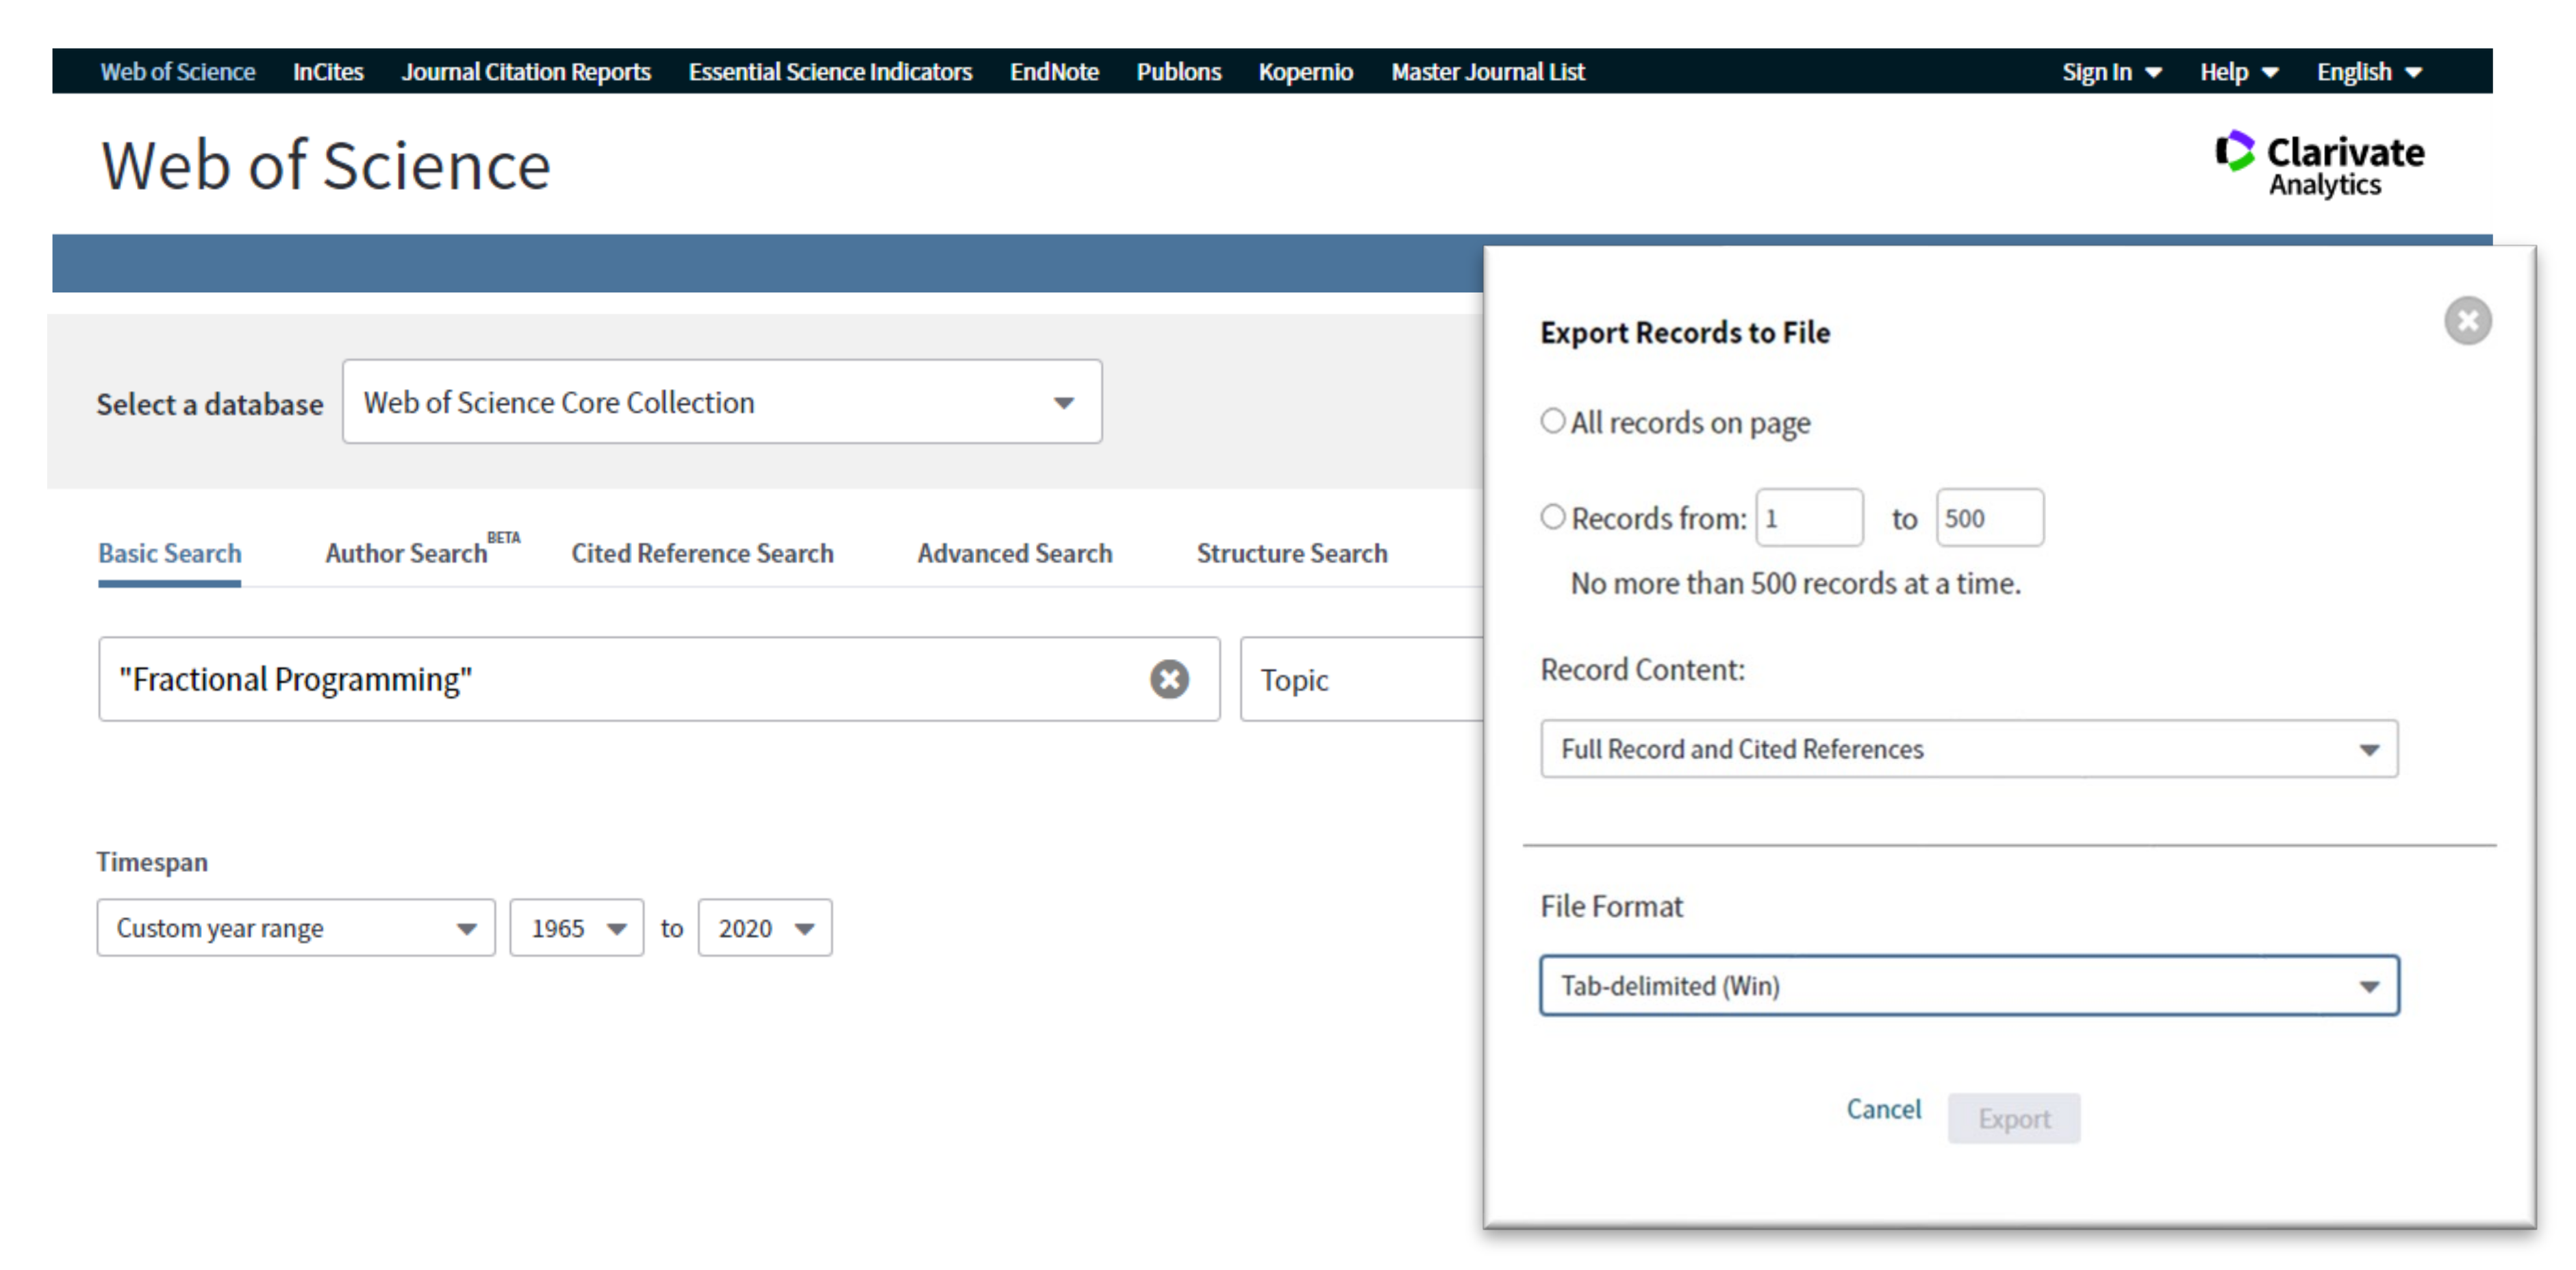
We select “Topic” from the search field list box and use “Fractional Programming”, “Fractional Optimization”, and “Ratio Optimization” as a suitable “Basic Search”.
(iii)
We select “Custom Year Range” from the “Timespan” list box, and we set 1965–2020 to cover 55 years.
The search returns 1811 published documents.
The collected data is used for a trend analysis (via WoS) and citation analysis (via VOSviewer) of publications.
A trend analysis of publications aims to collect data on published articles from multiple resources, to comprehensively evaluate the visibility and impact of the publications. It includes time trends, research direction, document types, prolific authors, institutions, and countries. As illustrated in Figure 2, the trend analysis is performed as follows.
(i)
Export the obtained records to a file by picking “Other File Format” from the “Export Records to File” list box.
(ii)
Select “Full Record and Cited References” from the “Record Content” list box.
(ii)
Choose “Tab-delimited (Win)” option from the “File Format” (the VOSviewer accepts this type of file format) list box.
Citation analysis is a common bibliometric method that has been successful in enhancing the retrieval of academic information. The importance of citation analysis has been highlighted in a large number of studies (see Shotton [70] for references).
Note that for the citation analysis via WoS, we select the “Comma-Separated Values” (CSV) option from the “File Format” list box.

2.2. Visualization and Mapping Networks

The VOSviewer software is employed for visualizing bibliometric networks using the data imported from the WoS data source. Our initial search for “VOSviewer” in the “Title, Abstract, Keywords” field of the WoS data source (done on 22 April 2021) reveals that this software has been used as an analysis tool in over 1195 papers.
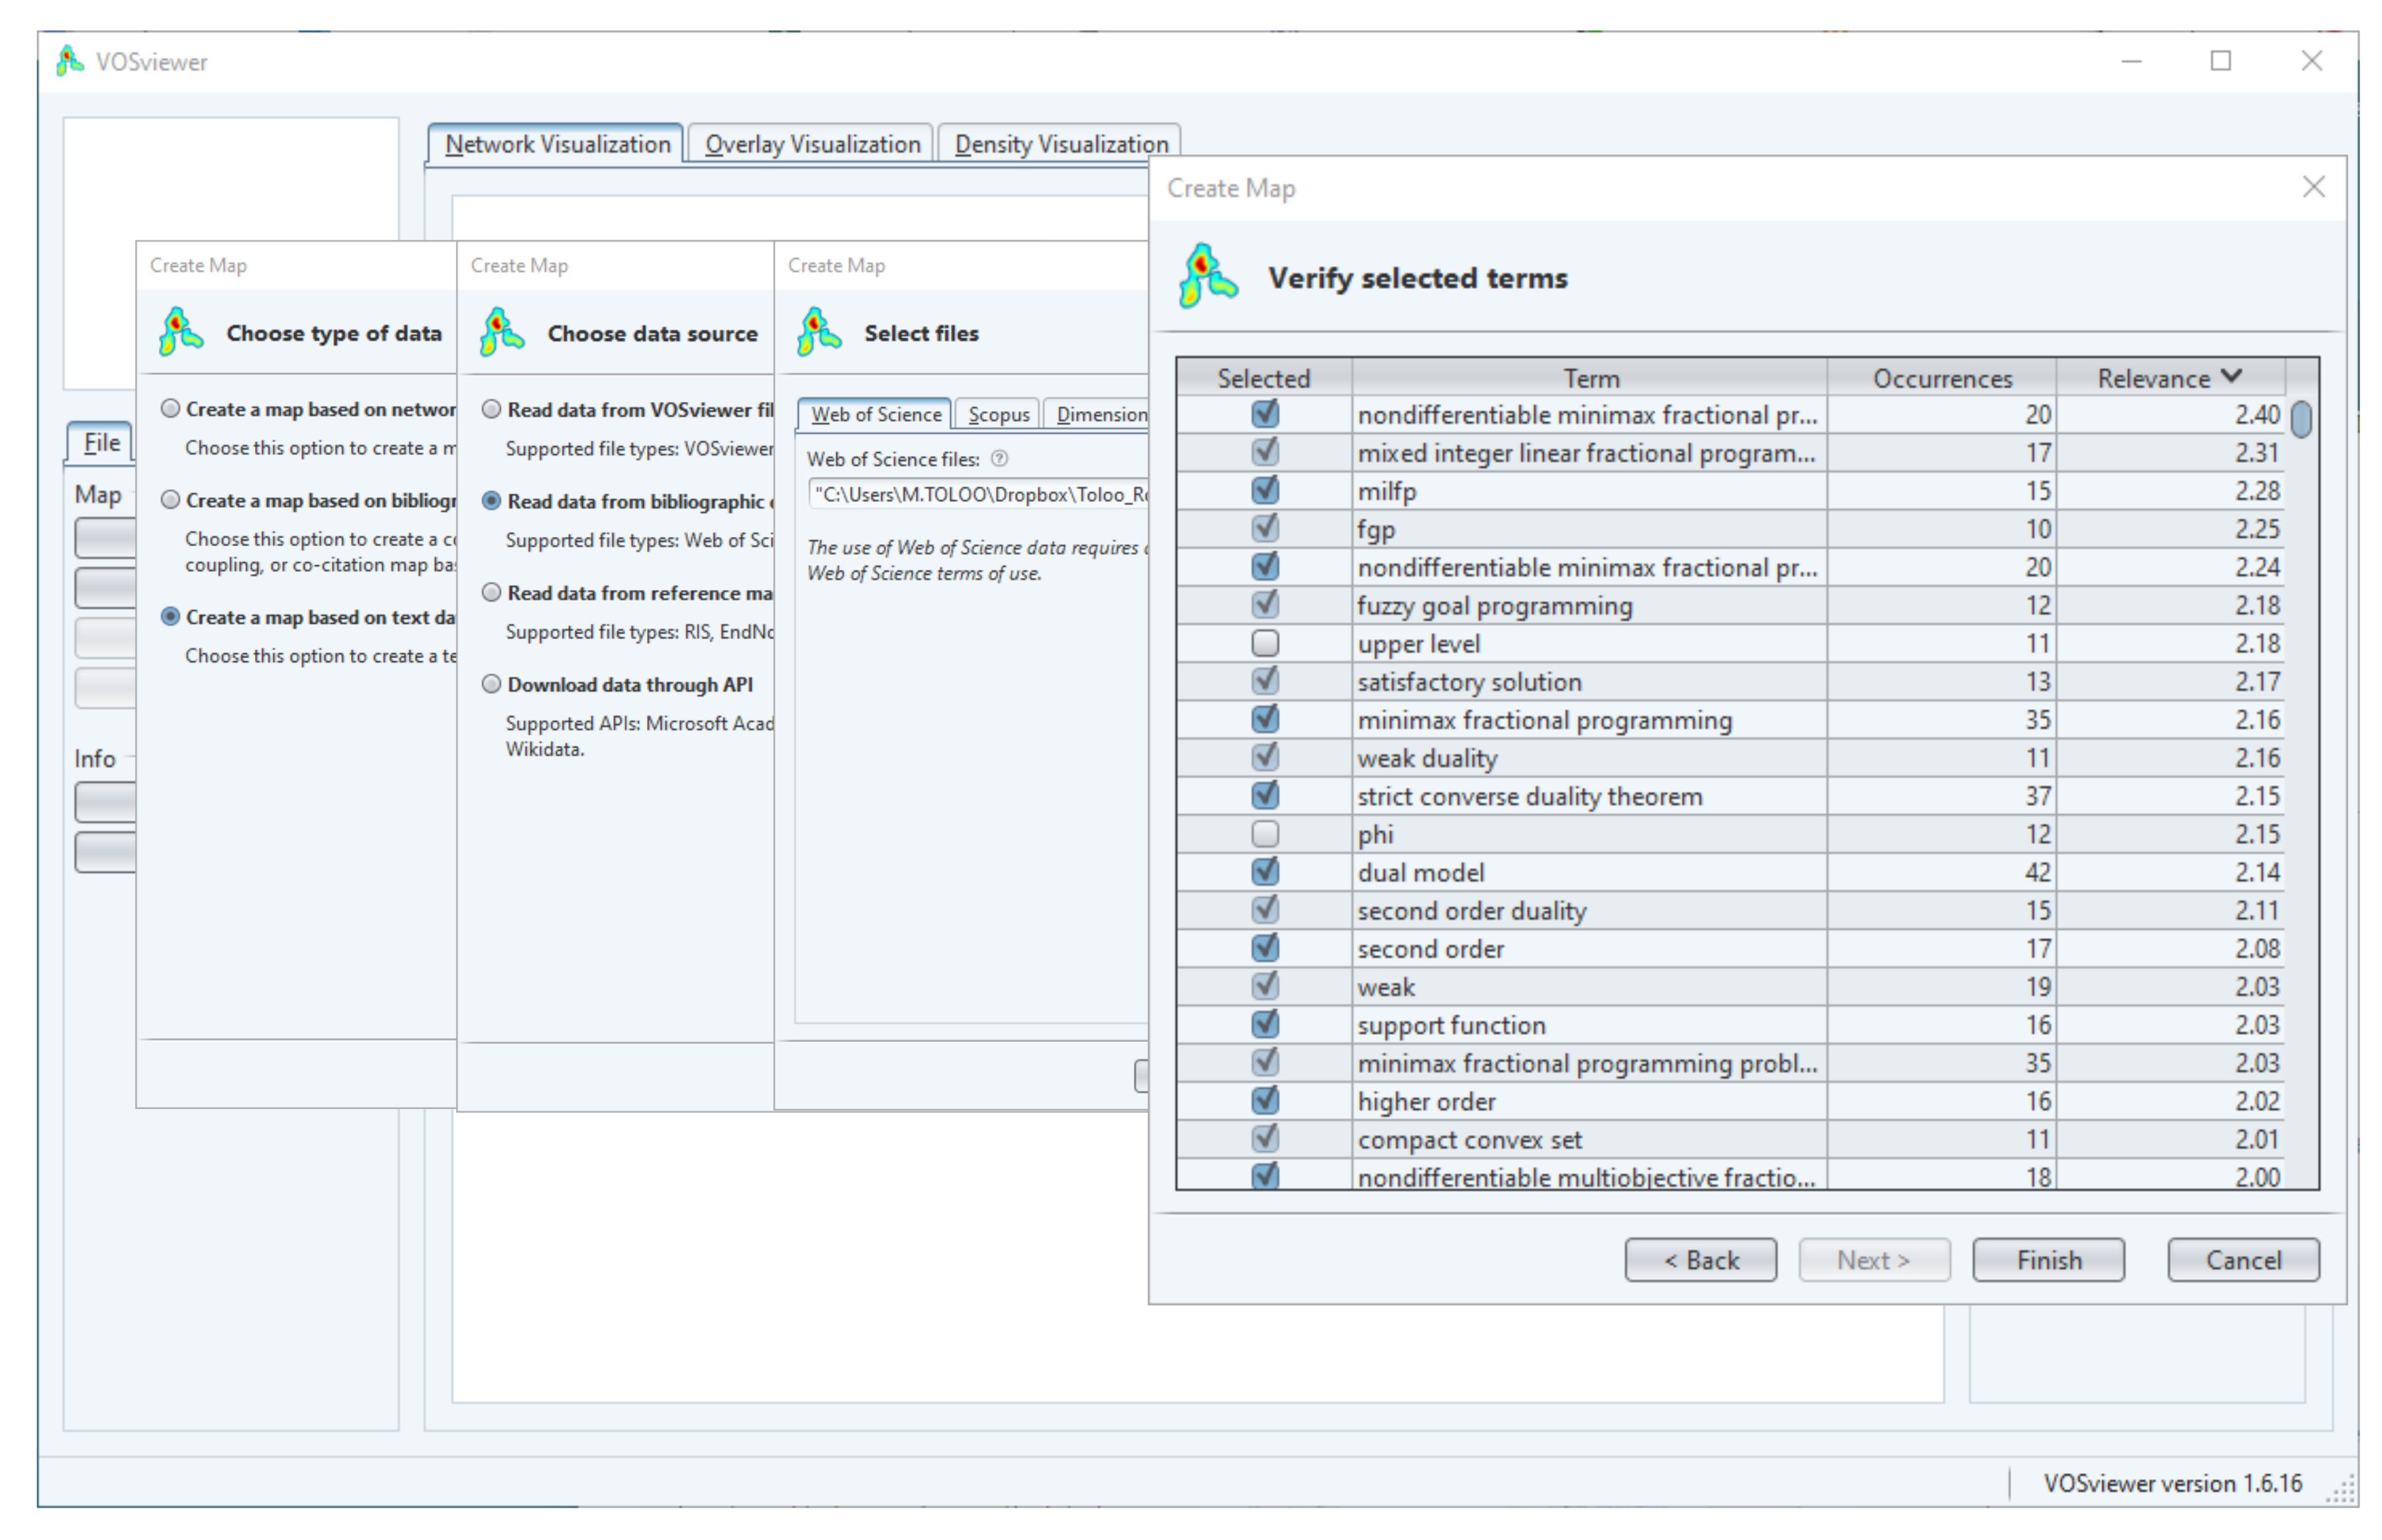
As illustrated in Figure 3, all the default settings of VOSviewer are kept unchanged. Any non-meaningful term (such as “upper level”, “phi”, “objective”, and “research”) can be excluded from the analysis by unchecking the corresponding case in the “Verify selected terms” dialog box displayed in VOSviewer.

3. Analysis

In this section, the results of the study are analyzed. The analysis starts with a descriptive bibliometric analysis, which includes the research direction, document type, prolific researchers, productive institutions, journals, and countries. Next, the visualization and mapping networks of the FP research landscape are presented by using the VOSviewer software, along with the associated cooperation networks. In addition, a thematic analysis of author keywords is performed to examine the co-occurrences network of FP research. The analysis section ends with burst citation analyses (BCA) of FP research from three different perspectives, comprising Keywords, Cited Authors, and Cited Journals. Burst detection finds the articles that receive particular attention from related scholars over a certain period (see Zhou et al. [71]).

3.1. Descriptive Bibliometric Analysis

The “Analyze Results” feature in WoS helps us to extract data from the selected field and produce a report of ranked values. We use this feature with the selected records to conduct a descriptive bibliometric analysis, which involves the distribution of types of documents, the most prolific articles, the authors, the institutions, and the countries.

3.1.1. Research Direction

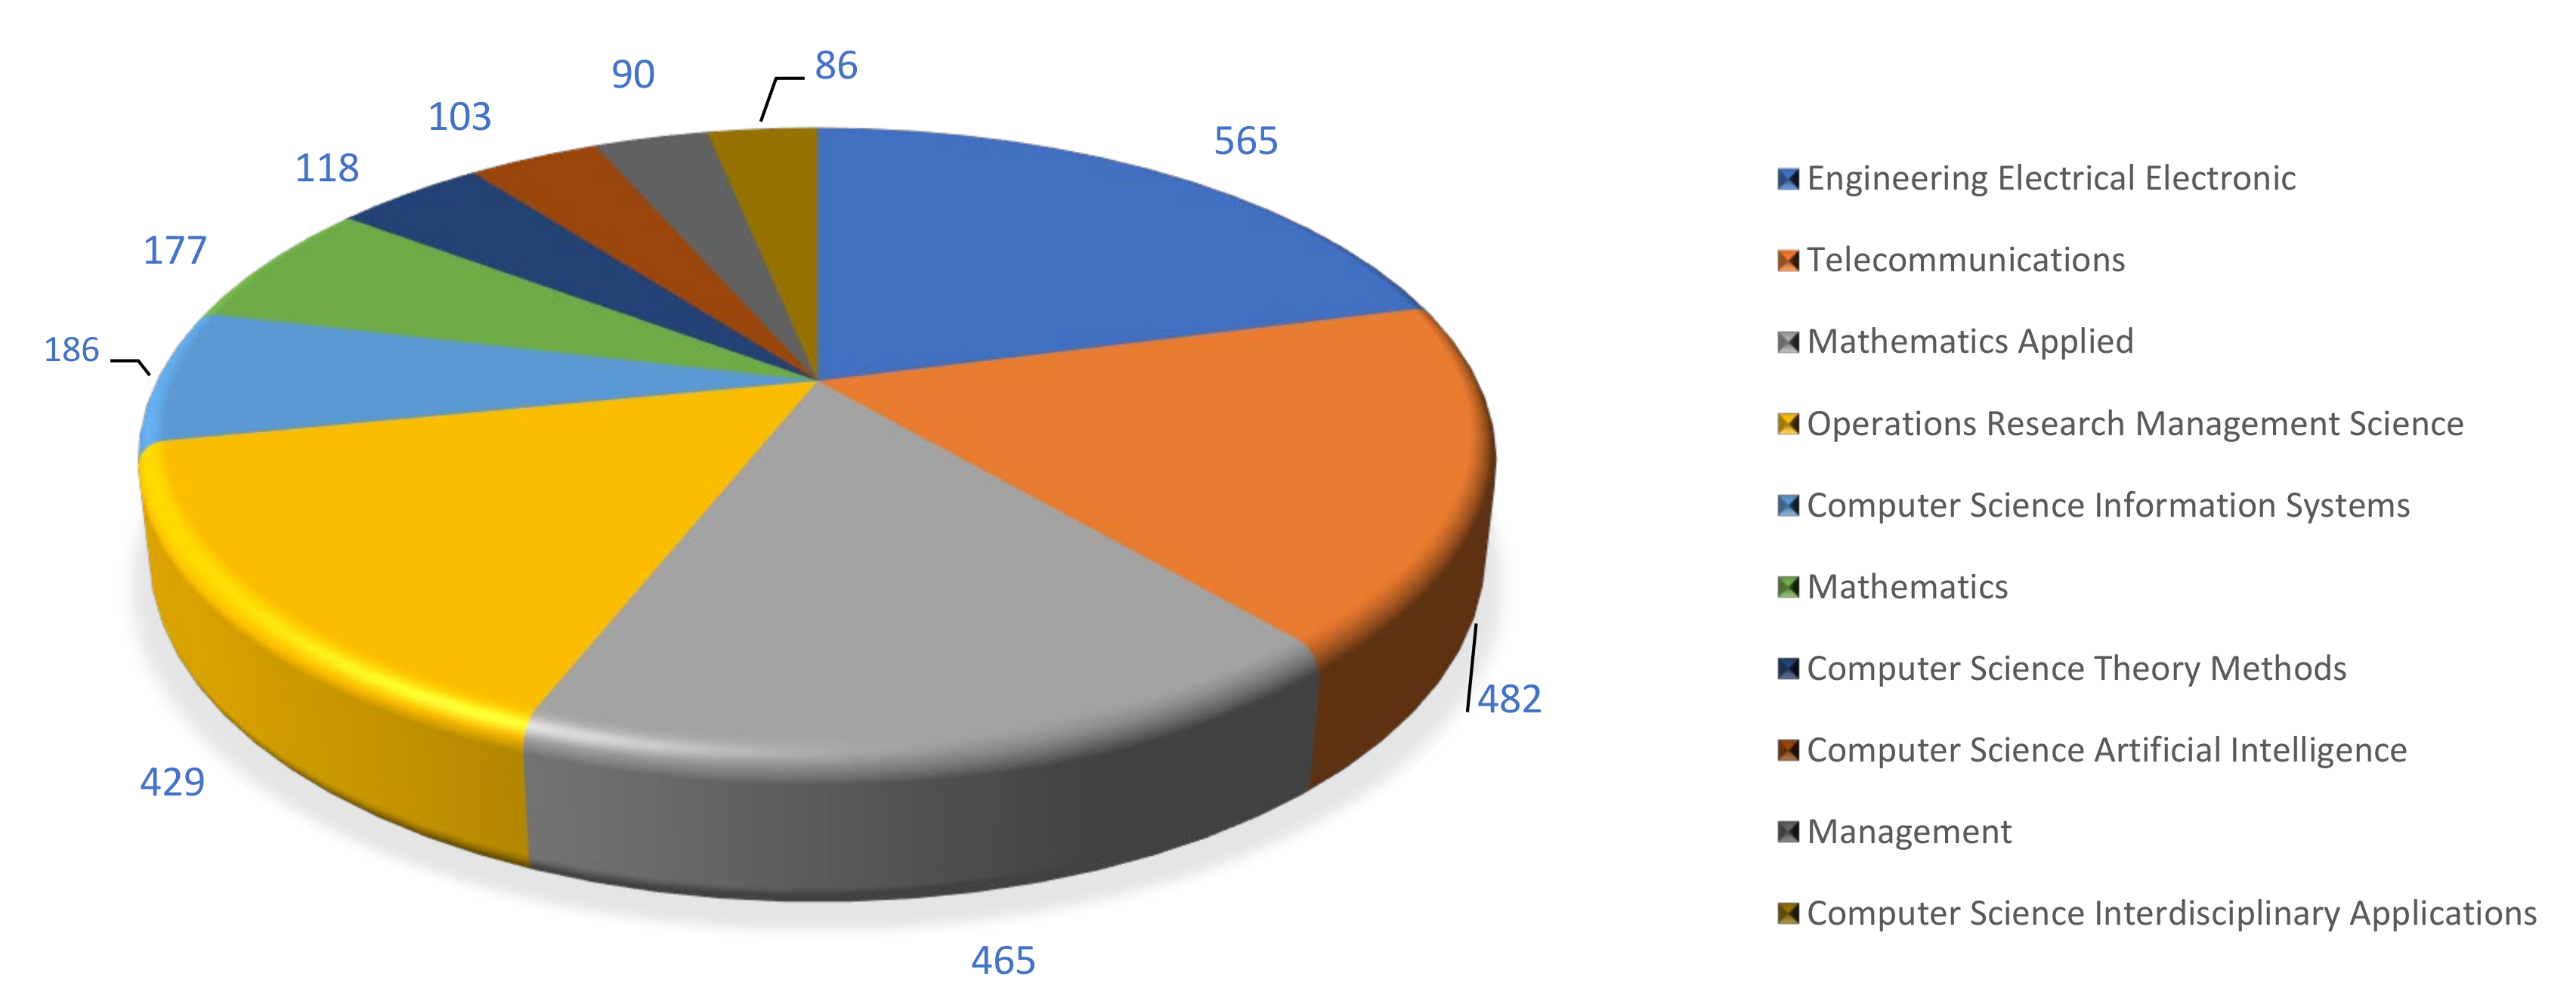
The first research trend consists of identifying “Web of Science categories” where FP-related documents are produced. There are 1811 published documents in the FP field from 1965 to 2020, falling under 25 categories. Figure 4 illustrates that the top three categories are Engineering Electrical Electronic, with 565 records, Telecommunications, with 482 records, and Applied Mathematics, with 465 records. In the meantime, fewer papers on FP have been found in Multidisciplinary Sciences, with only 22 records, with the same occurring in Water Resources, with 21 records, and Energy Fuels, with 18 records.
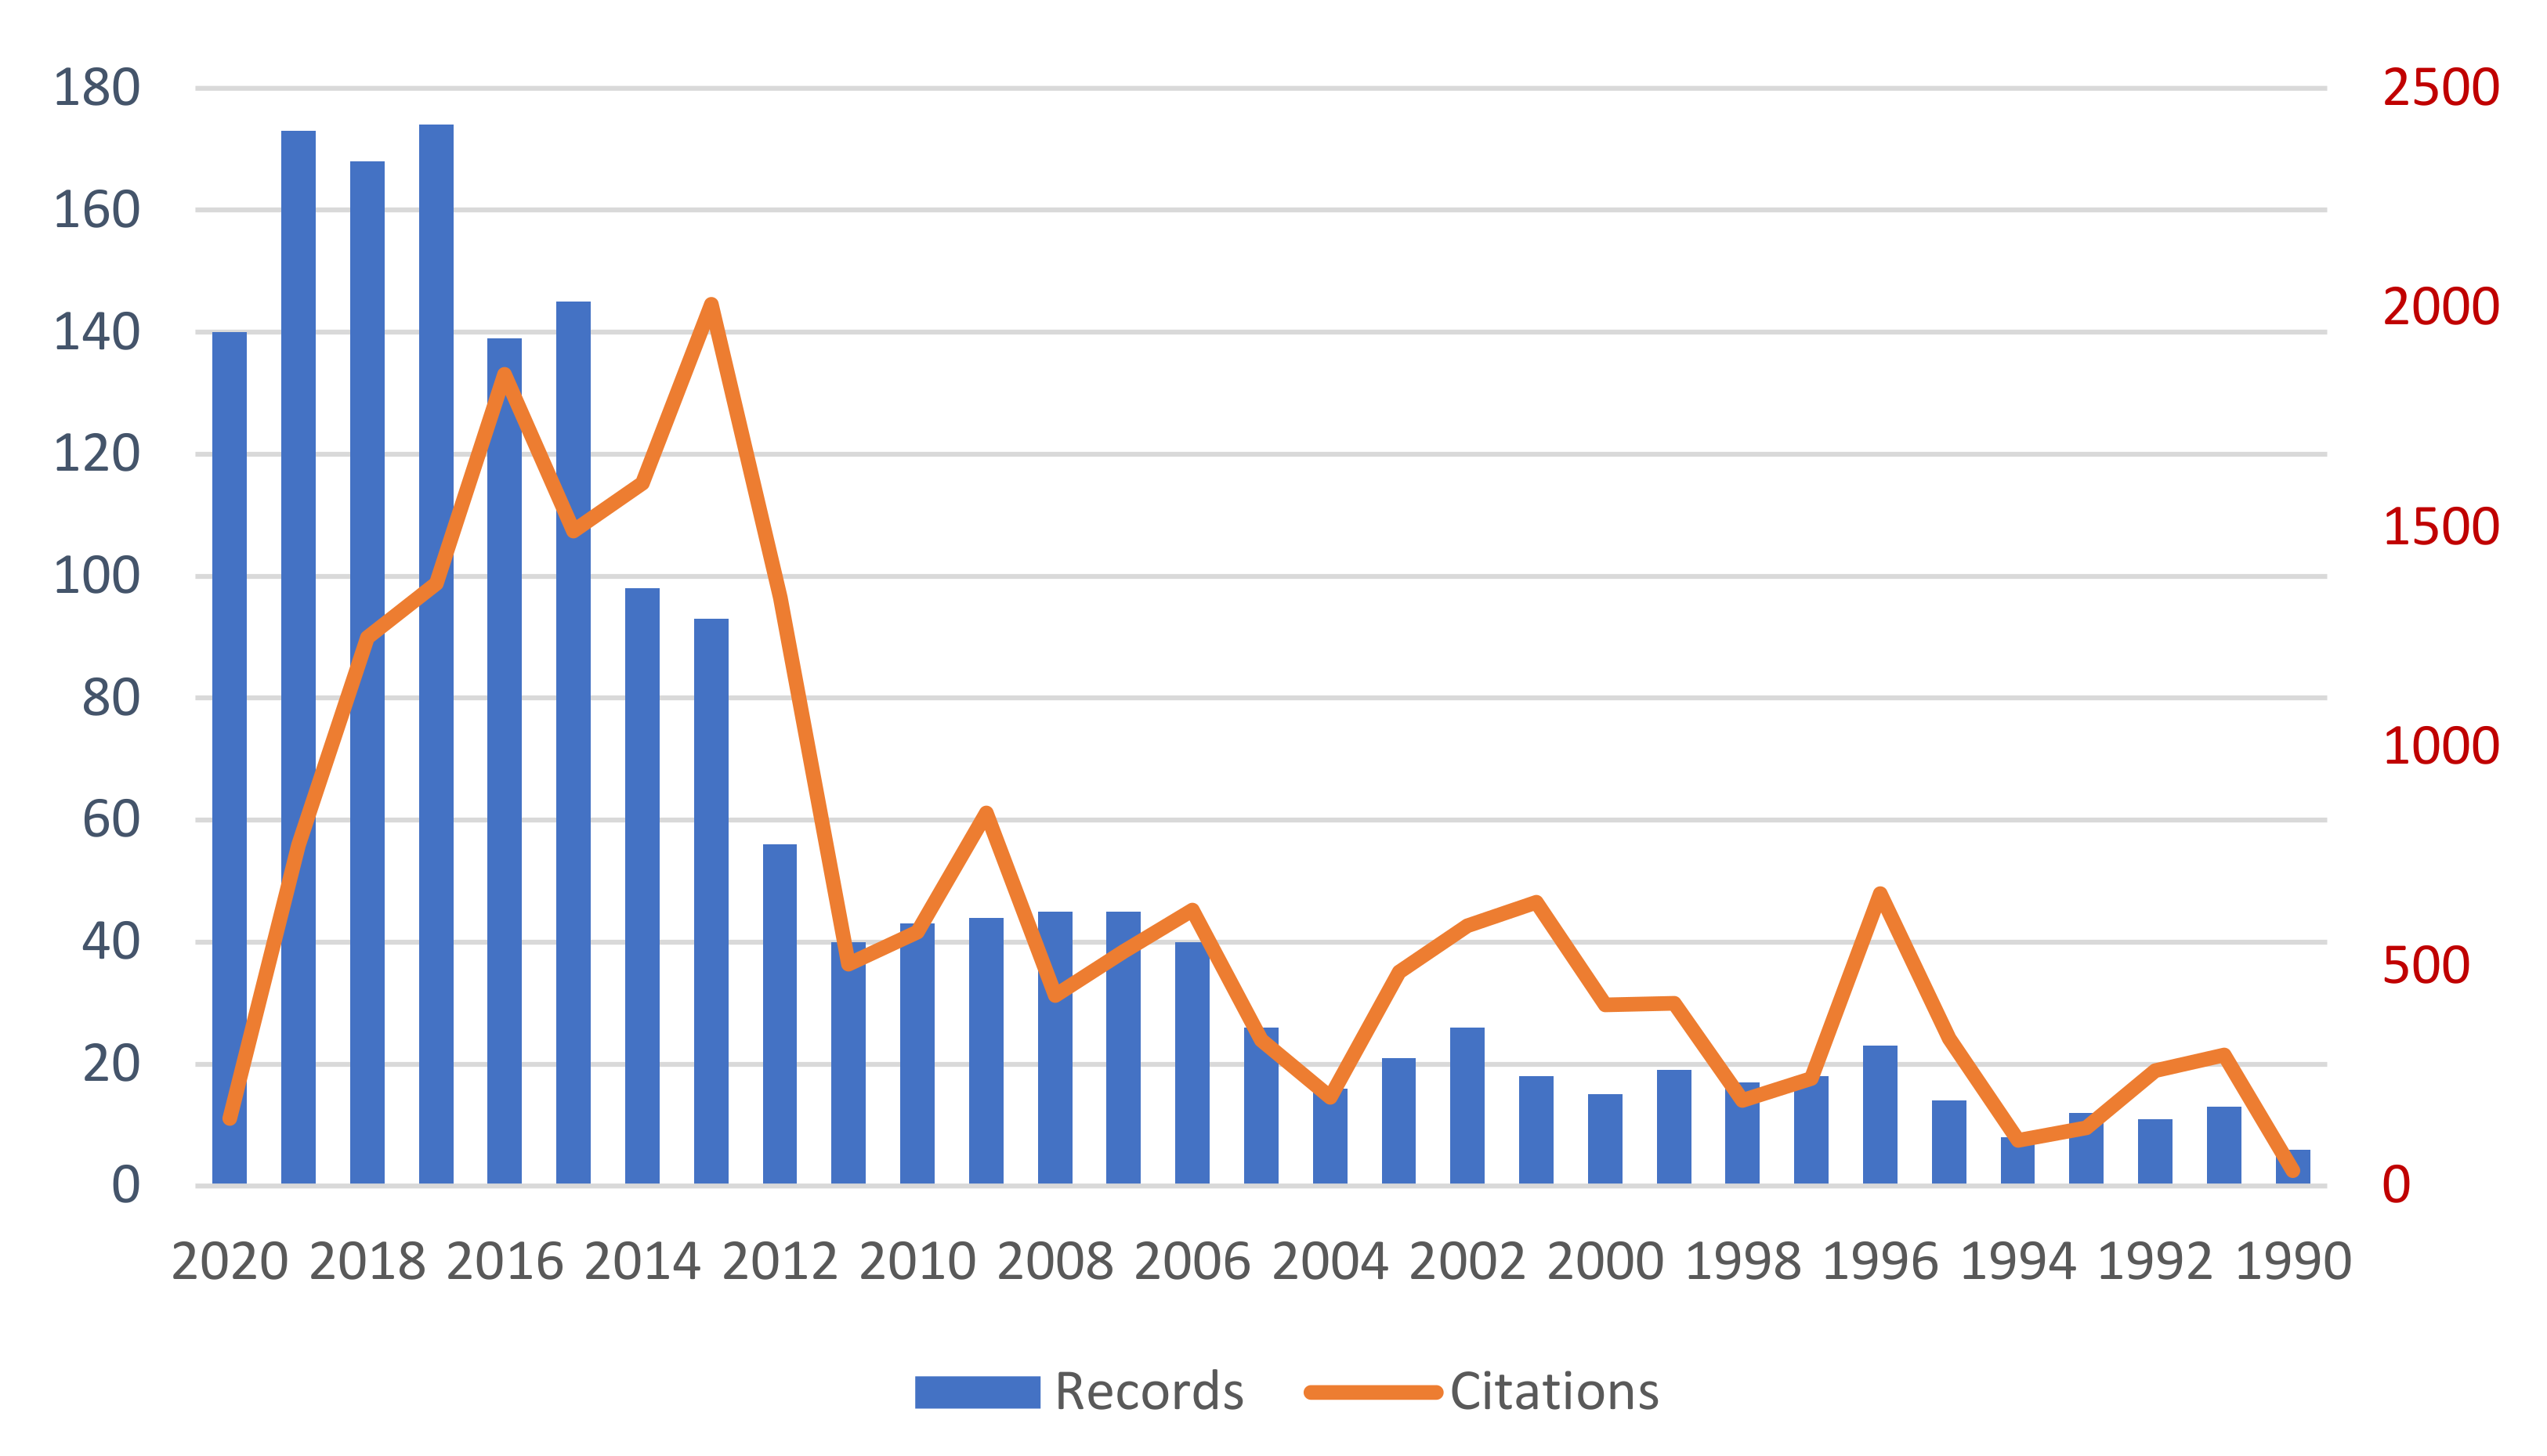
The analysis of the WoS’s outputs reveals that the majority of the publications that are related to FP appeared between 1990 and 2020, i.e., 1706 out of 1811 publications. As shown in Figure 5, the highest and the lowest numbers of publications are recorded in 2017 and 1990, respectively.

3.1.2. Document Types

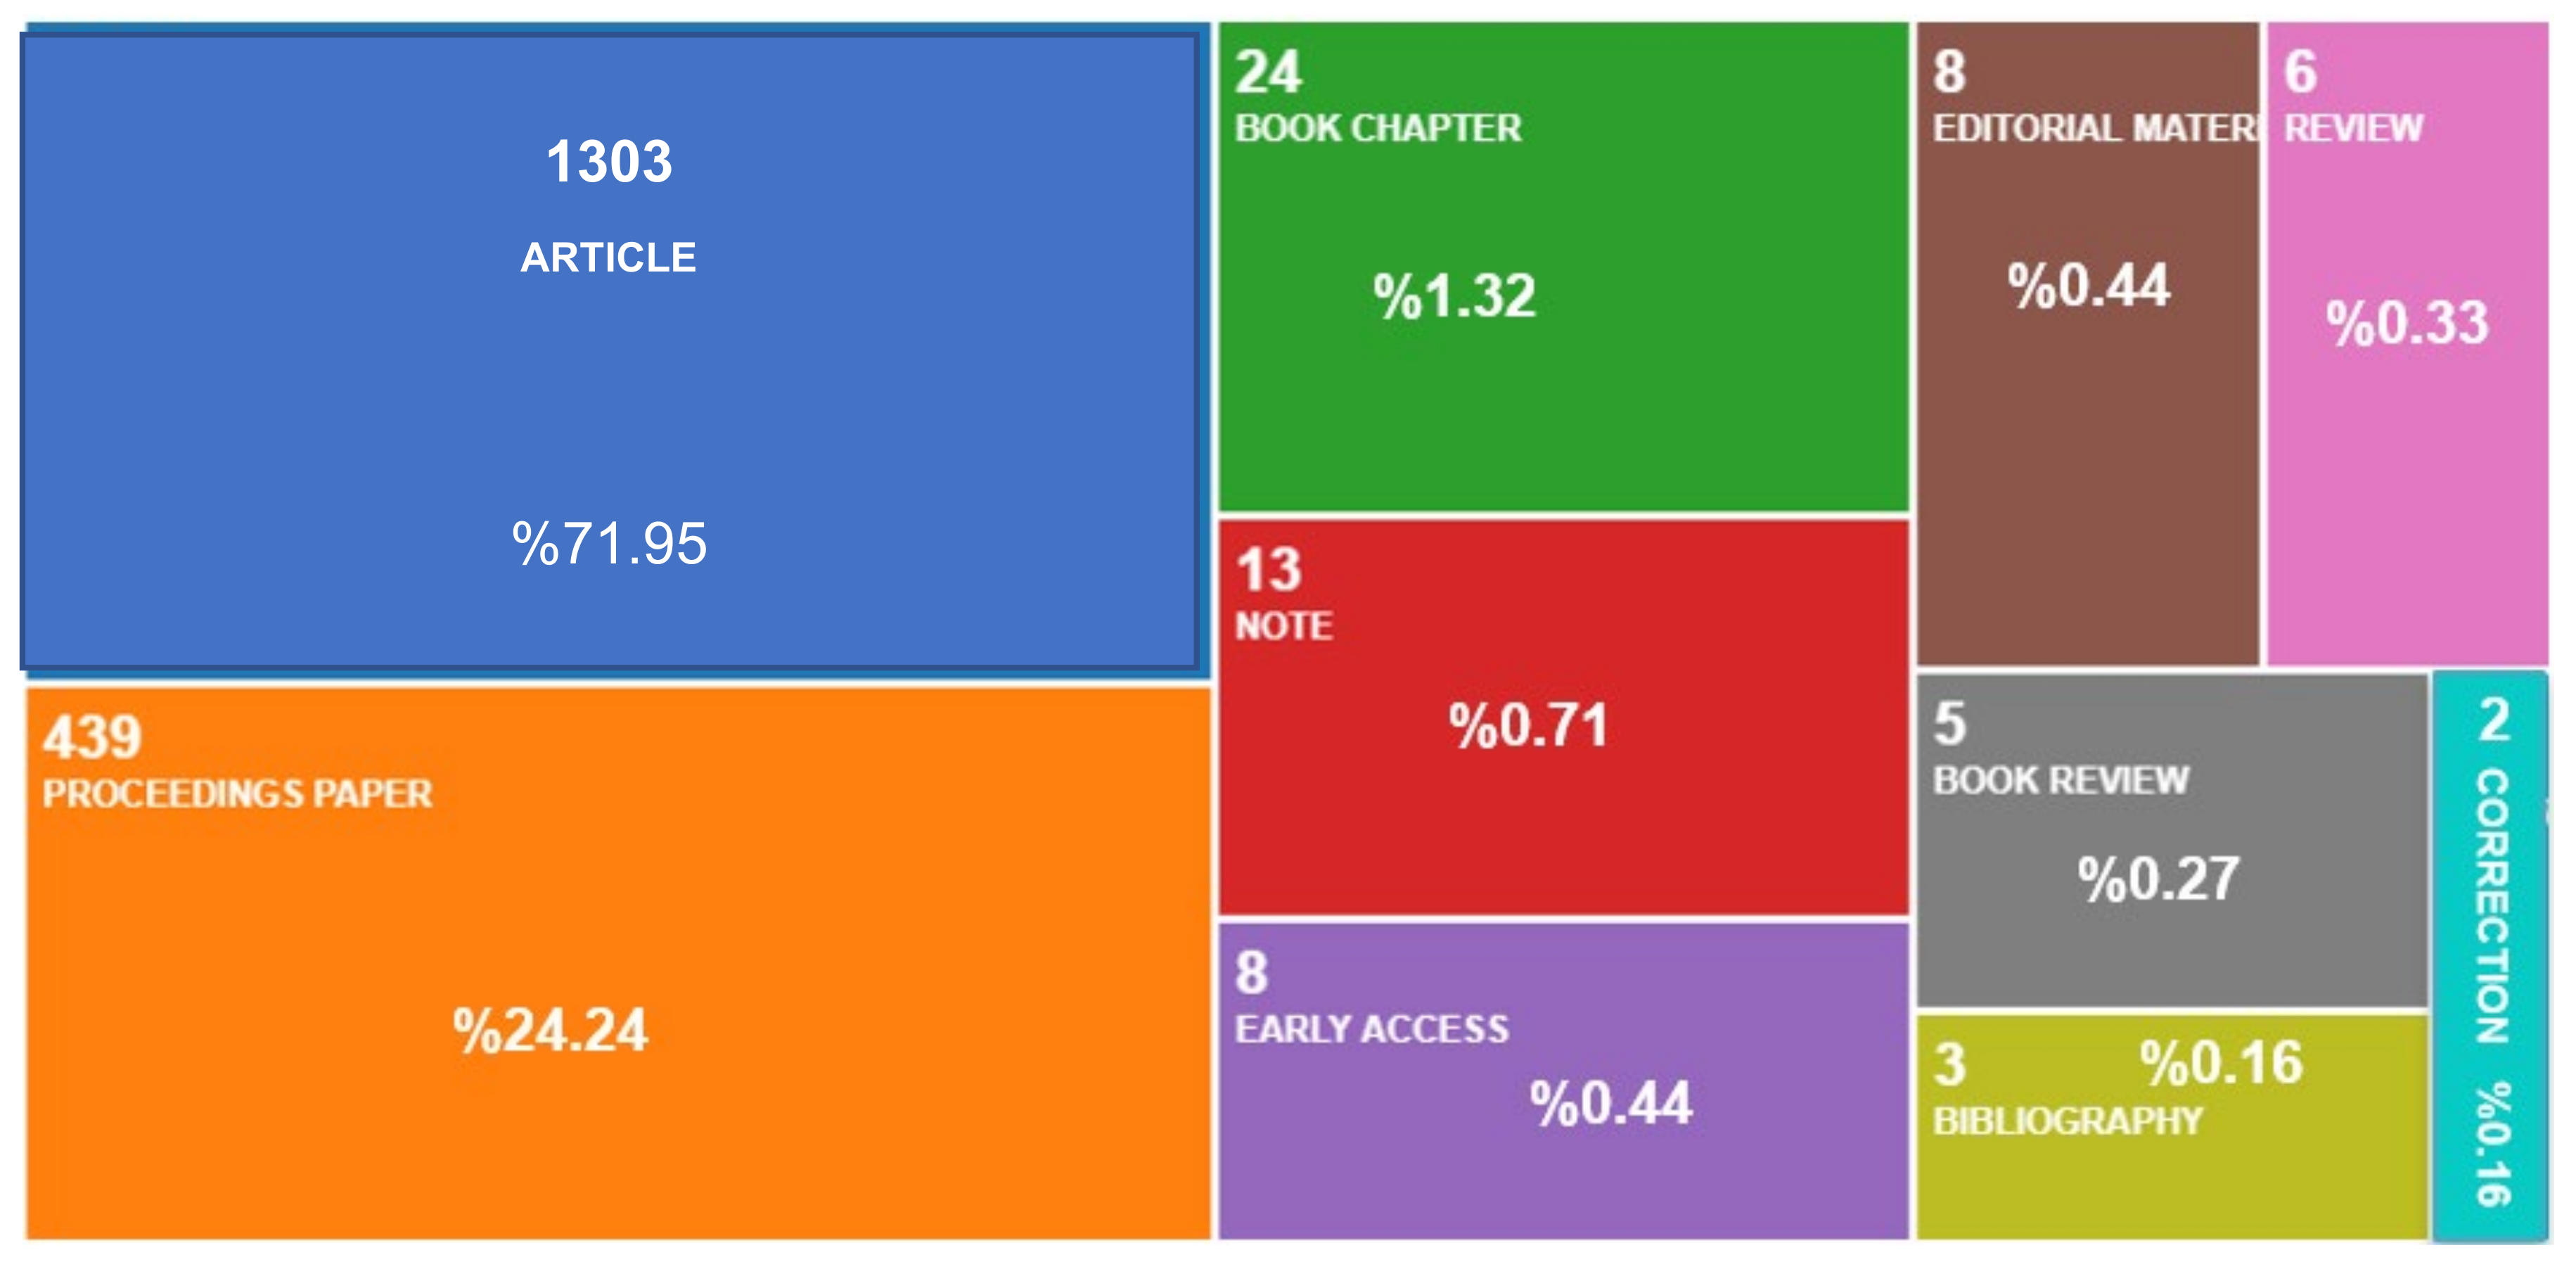
Among 1811 publications in the FP field between 1965 and 2020, there are 11 document types. We employ a treemap chart to visualize various document types in this study. On a treemap, each item is represented by a rectangular shape, where smaller rectangles represent the sub-groups. As shown in Figure 6, articles and proceeding papers are the main choices for researchers in the FP field.
The most frequent types consist of 1303 (71.95%) original articles. Meanwhile, there are 439 (24.24%) proceedings papers, 24 (1.32%) book chapters, 13 (0.71%) notes, 8 (0.44%) Early Access, 6 (0.33%) reviews, and only 3 (0.16%) bibliographies. Additionally, in our dataset, out of 1811 records, 643 of them are open access.

3.1.3. Prolific Scholars

With regard to the authors’ factor, researchers evaluate the records by using seven indicators, including the total number of publications (TP), the percentage of TP accounting for total publications (%TP), the top three affiliated countries, the total number of citations (TC), the average number of citations per publication (TC/TP), the H index, and the number of publications that are cited more than 10 times (>10). These indicators are widely used in bibliometric analyses to reflect the general situation of the publications. Based on our dataset, there are 3036 authors in total, and the top 9 prolific authors are listed in Table 1.
Accordingly, You, FQ has been indicated as being the most productive scholar, with 38 (2.09%) publications. This author is also ranked at the top of the list in terms of the H index, and according to >10 indicators. However, this researcher ranks second with respect to the TC indicator, where Ng, DWK takes the lead. A similar pattern is detected for the TC/TP ratio with You, FQ ranked third, following Ng, DWK and Schaible, S. Among the top nine authors, Zalmai GJ seems to be the least cited, with a TC = 98 and a >10 indicator of only 3.

3.1.4. Prolific Journals

Table 2 exhibits the most prolific journals, evaluated based on six indicators.
It is clear that the majority of the papers have been published by The European Journal of Operational Research and the Journal of Optimization Theory and Applications, with 55 (3.03%) documents for each journal. However, these two journals exhibit different trends for other indicators. For instance, The European Journal of Operational Research ranked second for TC and >20 indicators, while the Journal of Optimization Theory and Applications ranked third for the H index, fifth for both TC and >20, and sixth for the ratio TC/TP indicators. Interestingly, IEEE Transactions on Wireless Communications stands at the top of the list for the indicator TC. Such a result corroborates the outcomes of the research direction, which indicate that 1047 published documents, i.e., 57.8% of the reviewed records, fall under the categories of Engineering Electrical Electronic, as well as Telecommunications.

3.1.5. Prolific Institutions

The same indicators used to analyze the prolific authors are adopted to evaluate the institutional affiliations of the authors for the publications analyzed. Among 1097 institutions, the top 10 prolific institutions are listed in Table 3.
Interestingly, 7 out of the top 10 universities are located in China. Nonetheless, the Indian Institute of Technology System (IIT System, India) ranks first for the TP and TP% indicators. Based on the TC/TP indicator, Dresden University of Technology leads the list, which may reveal the in-depth research and wide recognition of FP in this institution.

3.1.6. Prolific Countries

Regarding the countries of affiliation, the publications are evaluated through the six indicators, as presented in Table 4.
According to both the total number and the percentage of publications, China is the most prolific country, with 626 (34.56%) publications, followed by USA, with 286 (15.79%) and India, with 271 (14.96). With six Asian countries/regions (China, India, Taiwan, Japan, Iran, and South Korea) listed among the top 10 most prolific countries, these results suggest that Asian universities are the most high-performing, according to the FP-related research.

3.2. Visualization and Mapping Network

This section is dedicated to visualizing the networks of scientific research that are related to FP, which include bibliometric networks such as collaboration networks, semantic networks, and publication citation networks. Collaboration and publication citation networks are used to create a comprehensive overview of the FP research landscape. The author’s keyword co-occurrence network is also analyzed to track the research themes in the FP field.

Cooperation Networks of FP

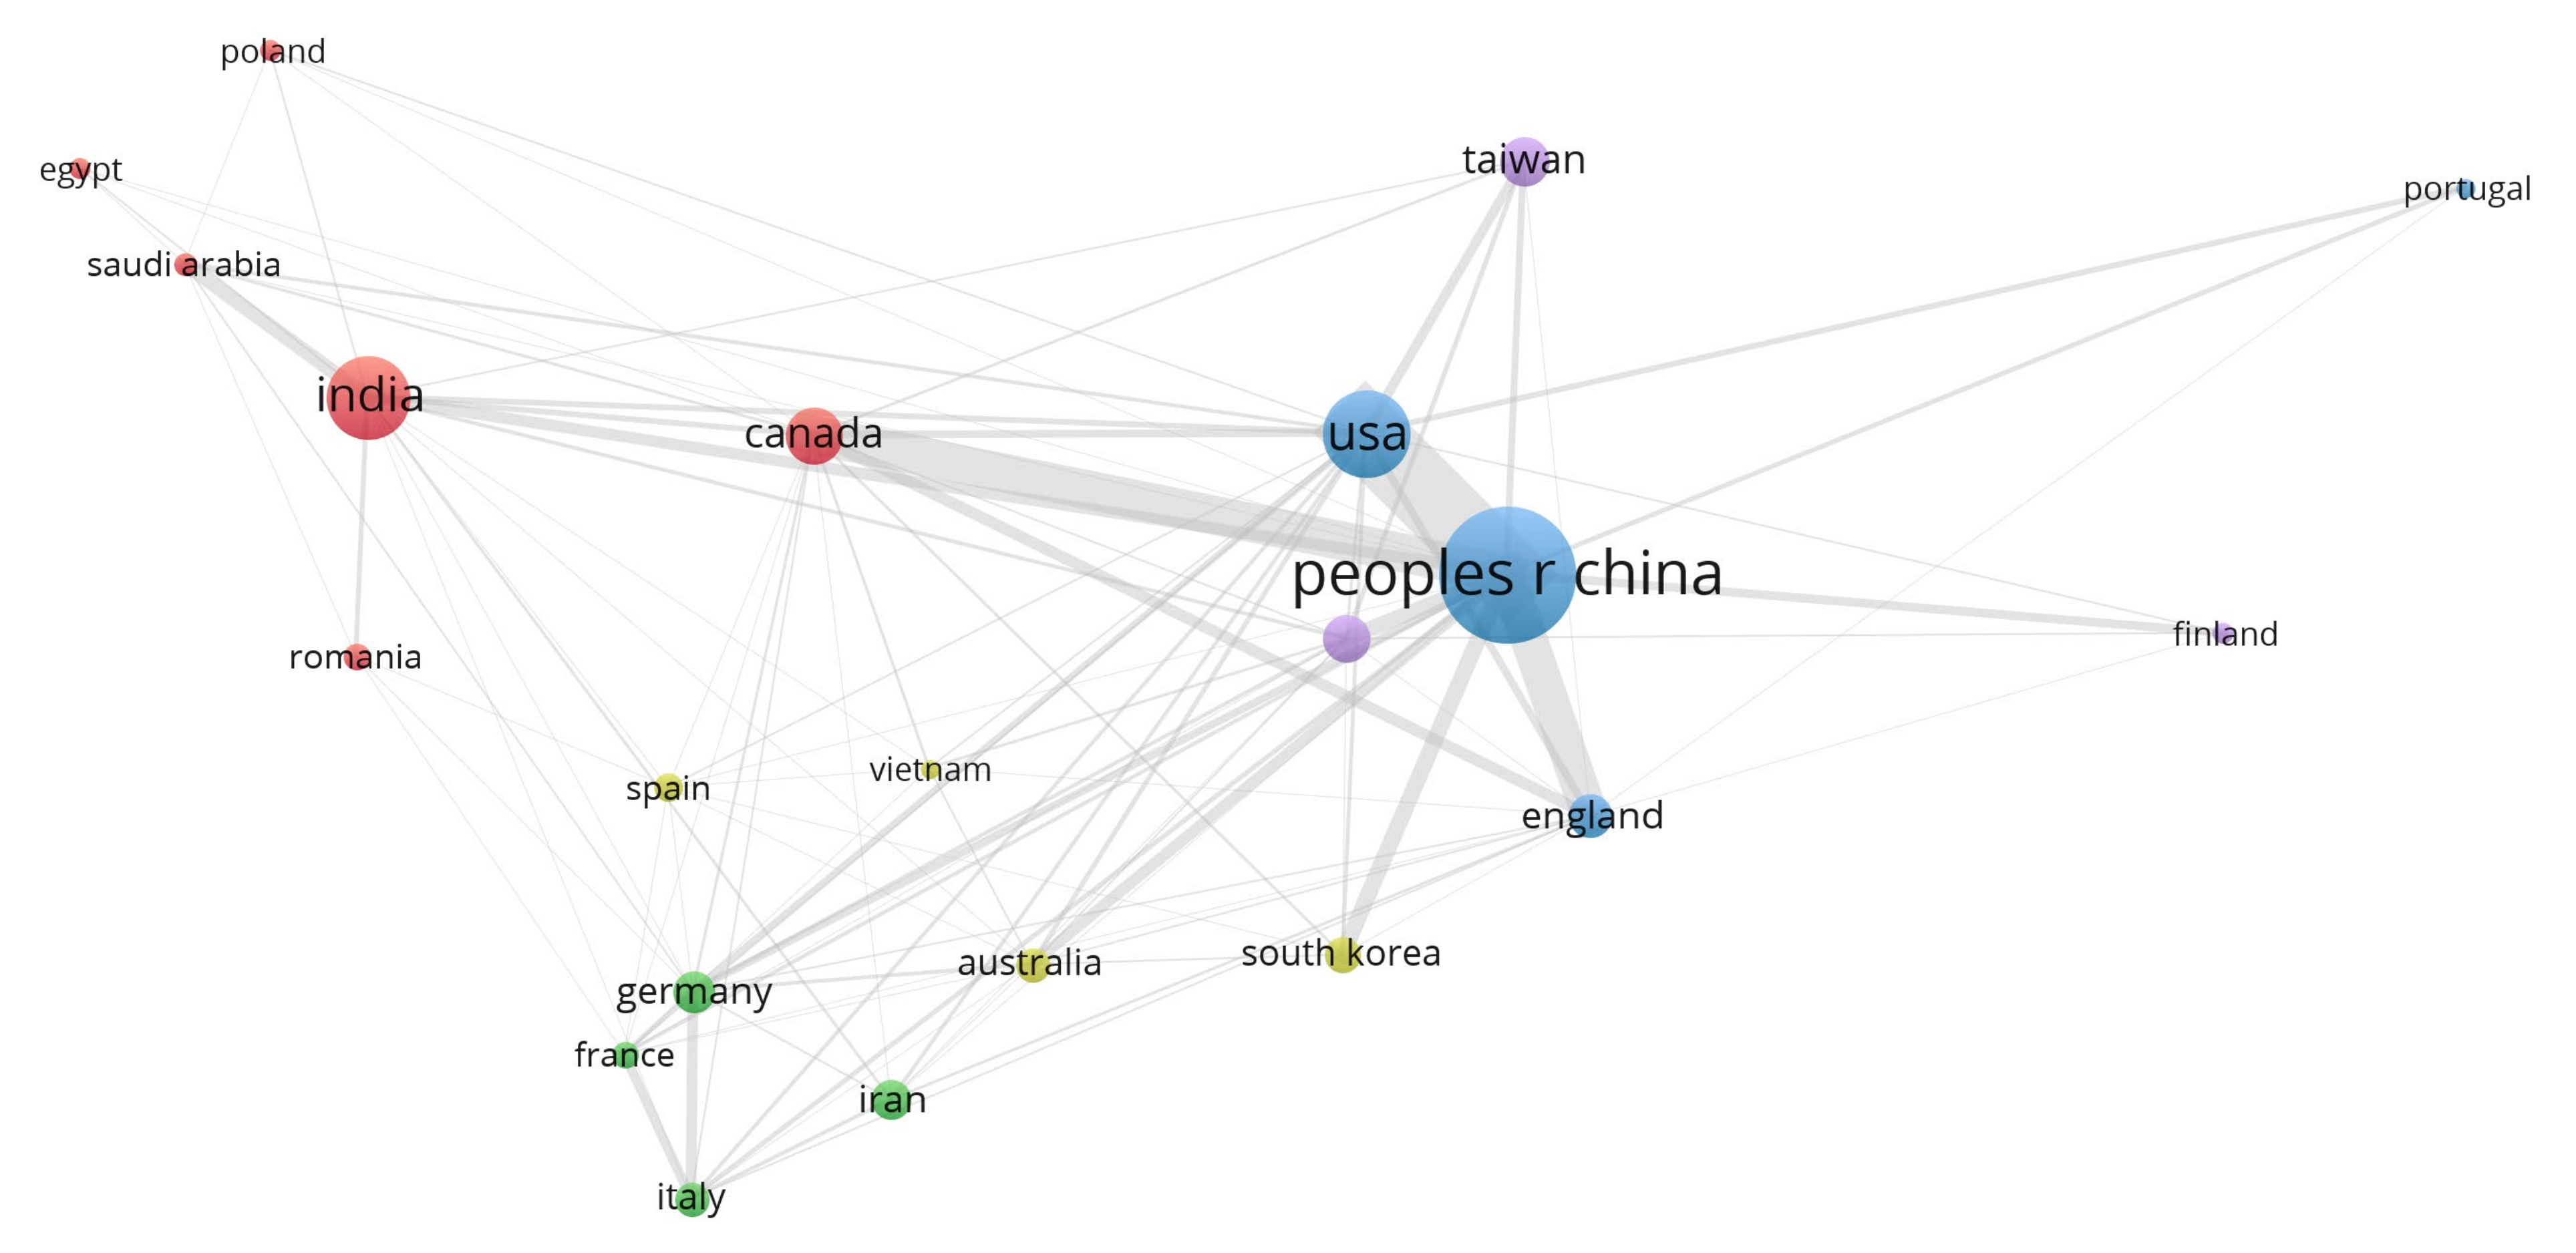
In order to examine the scope of collaboration among researchers in different countries from 1965 to 2020, VOSviewer is used to construct the country collaboration network shown in Figure 7.
Each color represents one category. The size of the node depicts the number of publications. The links between the nodes show the presence of authorship collaboration, while the thickness of the link reflects the strength of the collaboration. In view of the latter criterion, China’s collaboration with USA, Canada, and England seems to be the strongest. China’s research ties with India, South Korea, Australia, and Taiwan are relatively weaker.
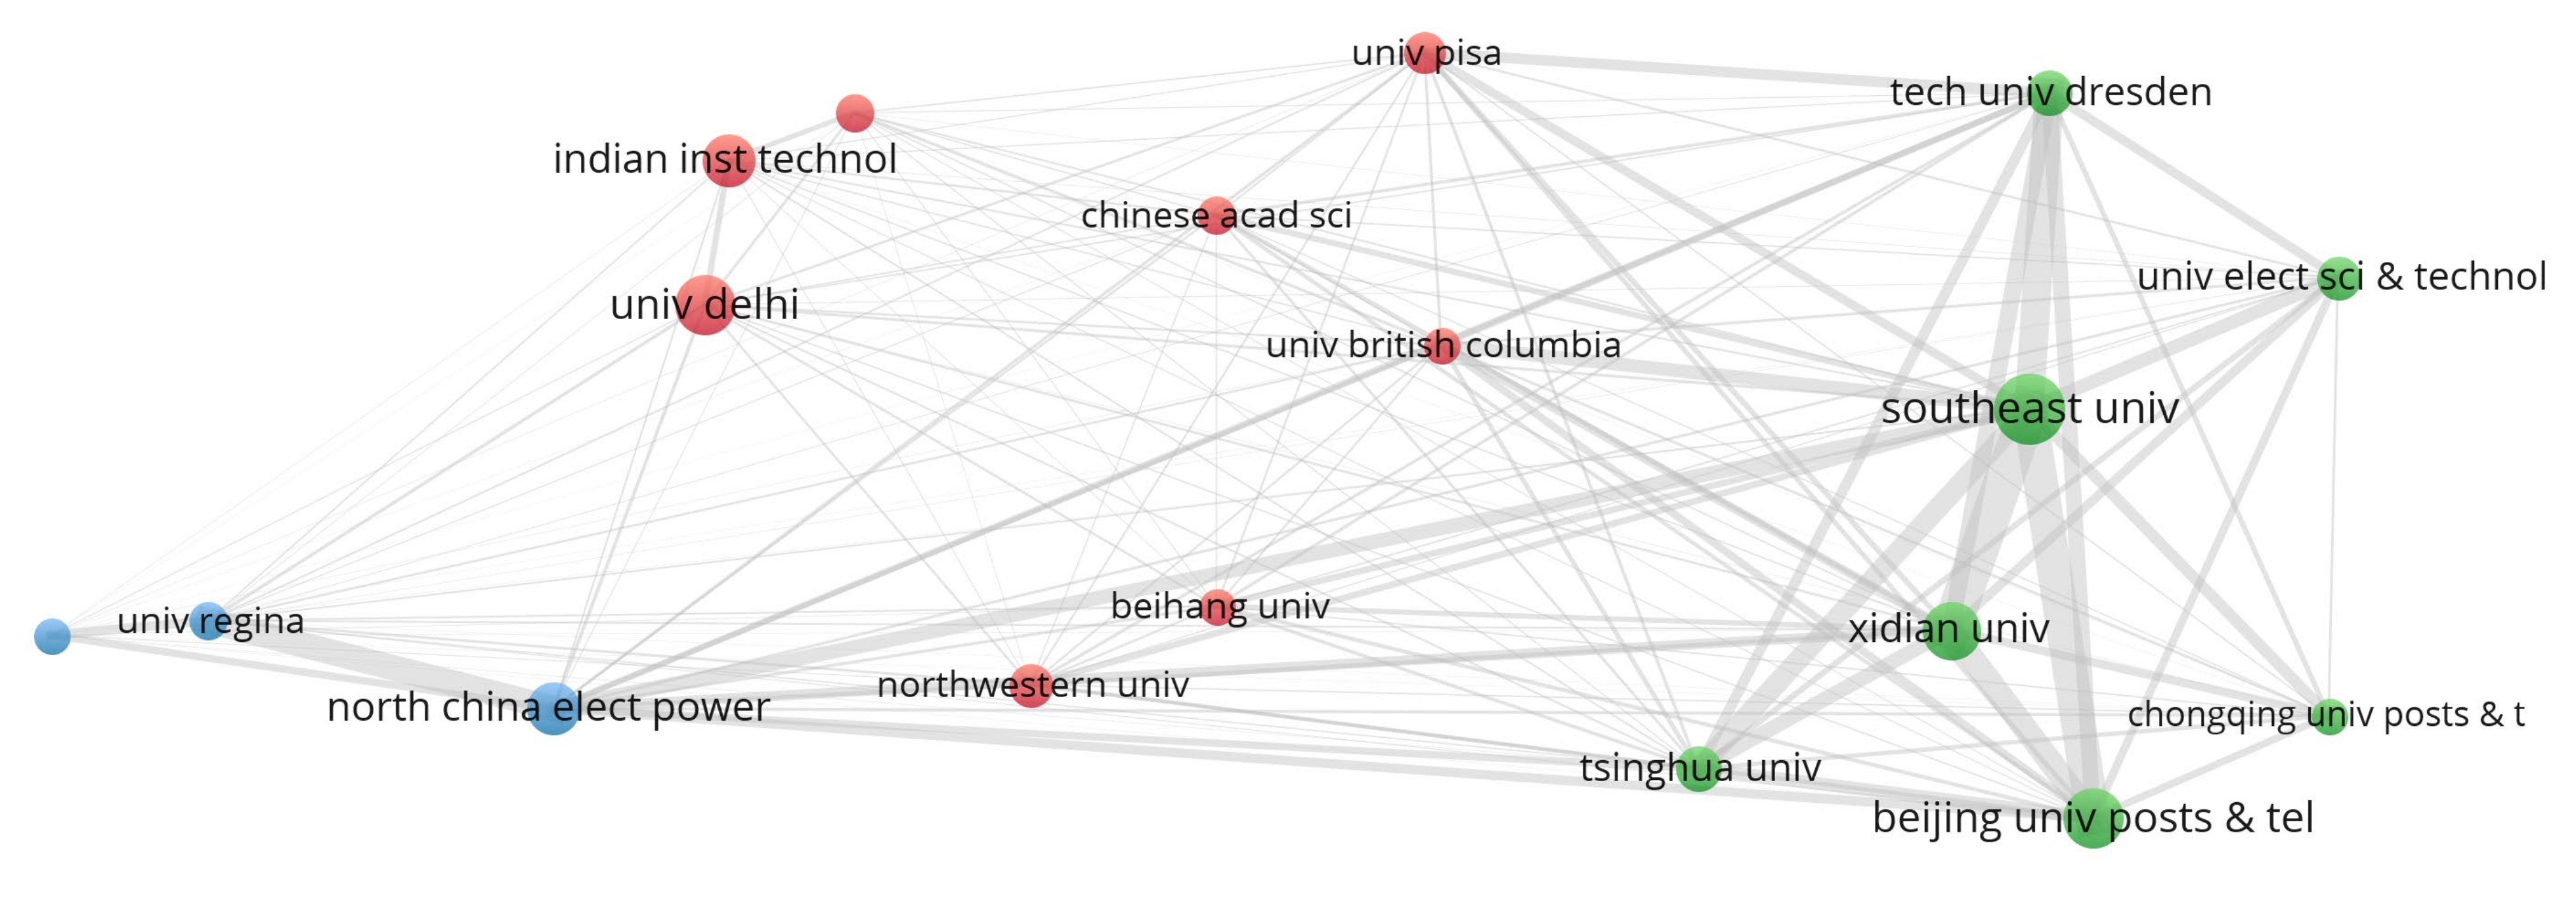
With respect to institutional collaboration, Figure 8 presents the relationships between the top 15 connected institutions from 1965 to 2020.
Over a total of 1097 institutions that contributed to the FP literature, 54 institutions produced more than 10 research publications. Southeast University, Beijing University of Posts & Telecommunications, Tsinghua University, and Xidian University, all from China, and the German university Technische Universität Dresden are the most collaboration-intensive institutions.
The ten most-cited articles published in FP and identified within our study are listed below. We should underline here that no theoretical article can be found in this list, because the publishers of such conceptual papers are not usually indexed in WoS. For instance, the prominent Charnes–Cooper transformation approach (Charnes, Cooper [3]), which plays a chief role in applying FP in various disciplines, has been published in the Naval Research Logistics Quarterly journal, which is not indexed by WoS.
  • Ng, D.W.K., Lo, E.S., and Schober, R. [72]. Wireless information and power transfer: Energy efficiency optimization in OFDMA systems. IEEE Transactions on Wireless Communications, 12(12), 6352–6370, 2013. Total citations: 354 Average per-year citation: 39.33.
  • Ng, D.W.K., Lo, E.S., and Schober, R. [73]. Energy-efficient resource allocation in OFDMA systems with large numbers of base station antennas. IEEE Transactions on Wireless Communications, 11(9), 3292–3304, 2012. Total Citations: 353; Average per-year citations: 35.30.
  • Carlsson, C. and Fullér, R. [74]. Fuzzy multiple criteria decision making: Recent developments. Fuzzy sets and systems, 78(2), 139–153, 1996. Total citations: 287; Average per-year citations: 11.04.
  • Isheden, C., Chong, Z., Jorswieck, E., and Fettweis, G. [75]. Framework for link-level energy efficiency optimization with informed transmitter. IEEE Transactions on Wireless Communications, 11(8), 2946–2957, 2012. Total citations: 254; Average per-year citations: 25.5.
  • Pastor, J. T., Ruiz, J. L., and Sirvent, I. [76]. An enhanced DEA Russell graph efficiency measure. European Journal of Operational Research, 115(3), 596–607, 1999. Total citations: 214; Average per-year citations: 9.30.
  • Huang, C., Zappone, A., Alexandropoulos, G. C., Debbah, M., and Yuen, C. [77]. Reconfigurable intelligent surfaces for energy efficiency in wireless communication. IEEE Transactions on Wireless Communications, 18(8), 4157–4170, 2019. Total citations: 209; Average per-year citations: 69.67.
  • Wu, Q., Tao, M., Ng, D.W.K., Chen, W., and Schober, R. [78]. Energy-efficient resource allocation for wireless powered communication networks. IEEE Transactions on Wireless Communications, 15(3), 2312–2327, 2015. Total citations: 201; Average per-year citations: 33.50
  • Cozman, F.G. [79]. Credal networks. Artificial intelligence, 120(2), 199–233, 2000. Total citations: 186 Average per-year citations: 8.45.
  • Zhou, Z., Dong, M., Ota, K., Wang, G., and Yang, L.T. [80]. Energy-efficient resource allocation for D2D communications underlaying cloud-RAN-based LTE-A networks. IEEE Internet of Things Journal, 3(3), 428–438, 2015. Total citations: 179; Average per-year citations: 29.83.
  • Ng, D.W.K., Lo, E.S., and Schober, R. [81]. Energy-efficient resource allocation for secure OFDMA systems. IEEE Transactions on Vehicular Technology, 61(6), 2572–2585, 2012. Total citations: 171; Average per-year citations: 17.01.
The most highly cited article was published by Ng, Lo, and Schober in 2013, and reached 354 citations. Among the 10 most highly cited articles, the majority were published after 2010, with only two papers published before 2000. The most prolific author, Ng D.W.K., has four papers in the list of the top-cited papers, ranked 1st, 2nd, 7th, and 10th, and published in 2013, 2012, 2015, and 2012, respectively. This researcher’s papers reached 1079 citations. None of the other most prolific authors were ranked on the same scale. The smallest difference in the number of citations was between the first and the second articles.
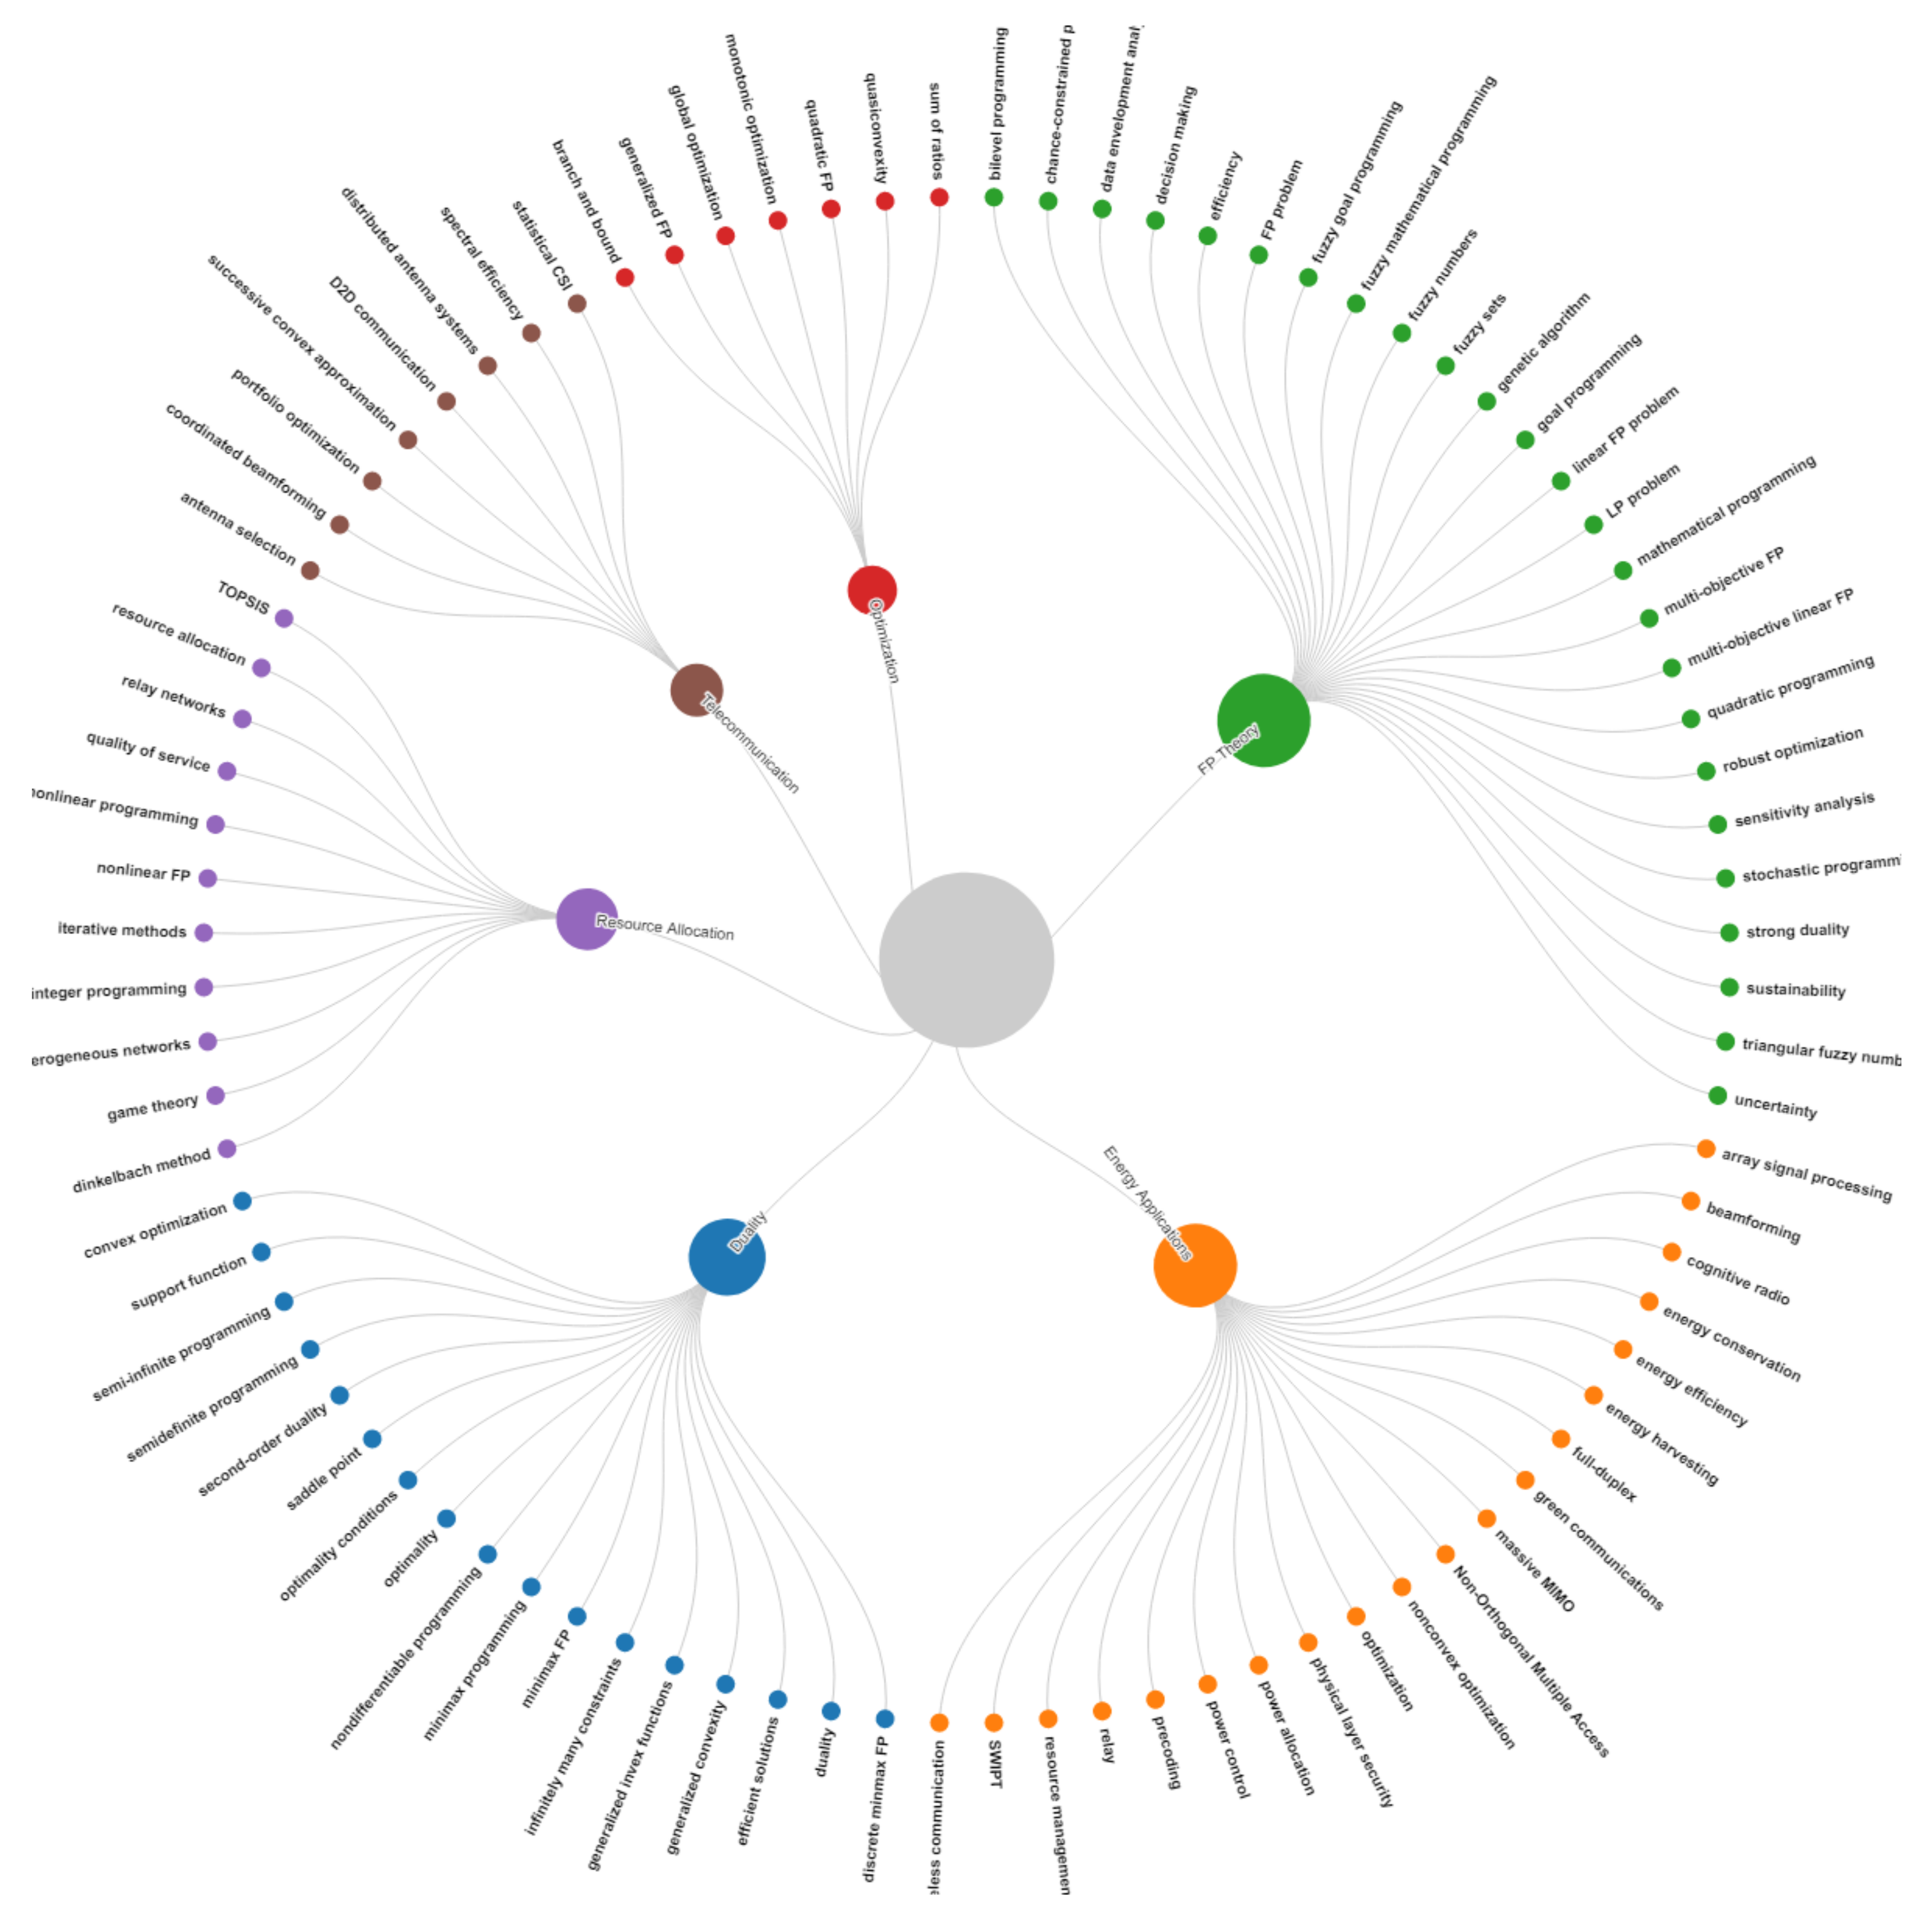
In order to carry out a comprehensive bibliometric analysis, the authors’ keywords within the published articles were examined. These keywords reflect the main ideas and concepts of the papers, and, hence, they represent an important way for connecting authors with readers. In this study, VOSviewer is used to visualize the authors’ keywords co-occurrences network, and to identify the themes of the papers published in FP (see Figure 9).
The results indicate that the authors used 3386 different keywords. The keywords that were used more than 10 times include “energy efficiency” and “resource allocation”, which are by far the most frequent, followed by “quality”, “power allocation”, “linear fractional programming” and “global optimization”. The keywords occur within six different clusters of different colors, representing the following themes:
  • FP Theory (green color) contains author keywords such as: “bilevel programming”, “chance-constructed programming”, “data envelopment analysis”, “decision making”, “efficiency”, “FP problem”, “fuzzy goal programming”, fuzzy mathematical programming”, “fuzzy numbers”, “fuzzy sets”, “genetic algorithm”, “goal programming”, “linear FP problem”, “LP problem”, “mathematical programming”, “multi-objective FP”, “multi-objective linear FP”, “quadratic programming”, “robust optimization”, “sensitivity analysis”, “stochastic programming”, “strong duality”, “sustainability”, and “under”, etc.
  • Energy Application (orange color) is characterized by author keywords such as: “array signal processing”, “beamforming”, “cognitive ratio”, “energy conservation”, “energy efficiency”, “energy harvesting”, “full-duplex”, “green communication”, “massive MIMO”, “Non-Orthogonal multiple access”, “nonconvex optimization”, “optimization”, “physical layer security”, “power allocation”, “power control”, “precoding”, “relay”, “resource management”, and “SWIPT”, etc.
  • Duality (blue color) is represented by author keywords such as: “discrete minimax FP”, “duality”, “efficient solution”, “generalized convexity”, “generalized invex function”, “infinitely many construct”, “minimax FP”, “minimax programming”, “non-differentiable programming”, “optimality”, “optimality conditions”, “saddle point”, “second-order duality”, “semidefinite programming”, semi-infinite programming”, “support function”, and “convex optimization”, etc.
  • Resource Allocation (violet color) is represented by author keywords such as: “dinkelbach method”, “heterogeneous network”, “resource allocation”, “integer programming”, “interactive methods”, “non-linear FP”, “non-linear programming”, “quality of service”, “relay networks”, and “TOPSIS”, etc.
  • Telecommunication (brown color) contains author keywords such as: “antenna selection”, “coordinated beamforming”, “portfolio optimization”, “successive convex approximation”, “D2D communication”, “distributed antenna systems”, and “statistical CSI”, etc.
  • Optimization (red color) contains keywords connected to optimization, such as: “sum of ratios”, “quasiconvexity”, “quadratic FP”, “monotonic optimization”, “global optimization”, “generalized FP”, and “branch and bound”, etc.

3.3. Citation Burst Analysis

The burst detection technique is used to identify sharp increases of interest or particular attention in FP from 1965 to 2020. Table 5 exhibits the chronological evolution of authors’ keywords during the period of time. The second column shows burst strength which represents the intensity of the burst, that is, how great the change is in the word frequency that triggered the burst. In addition, the last column includes blue and red lines where the blue line portrays the beginning and end of a keyword through the years and the red line illustrates the period of keyword burst. To be more specific, CiteSpace (Chen [66,67]) is used to show the degree of attraction of scholars to different FP research fields, and to explicitly capture the active areas. Technically, CiteSpace uses the burst detection algorithm Kleinberg [82] to detect burst-terms with high-frequency change rates. In this research, the CiteSpace function unveils that 1991 was the year of mutation for the field of FP. Table 5 demonstrates that scientific production in FP includes duality, optimality condition, global optimization, optimality, sufficient conditions, fractional programming criteria, generalized convexity, multi-objective FP, invexity, duality theorem, convexity, energy efficiency, generalized FP, efficiency, resource allocation, goal programming, massive MIMO, fuzzy programming, minimax FP, SWIPT, sufficient optimality condition, nonlinear sum, downlink, and bound algorithm.
In order to enhance the comprehensive overview of FP, burst detection was further applied to analyze the most strongly cited authors. Table 6 illustrates the top 15 cited authors with the strongest citation bursts.
Bector appears at the top of the list, with a maximum burst strength of 28.35. Additionally, Mangasarian records the longest burst duration, spanning 1972 to 2007. Zappone exhibits the most recent citation burst, starting from 2017, which may suggest that this author’s work is likely to be a hot and leading topic in FP.
Table 7 presents the top 10 cited journals with the strongest citation bursts from 1965 to 2020.
The listed journals received frequent citations in FP-related papers over a certain period of time. The citation bursts of the Journal of Mathematical Analysis and Applications were the strongest (54.73). Among the top 10 cited journals, Operational Research and Naval Research Logistics present the longest burst durations of 44 years (1968–2011) and 41 years (1965–2005), respectively. The latter result suggests that FP-related publications cited these journals earlier and explosively. More recently, the citation burst of IEEE Access was the closest to 2020, the date of the present study, which means that this journal still has a substantial influence on the FP area, and thus, it can have impacts upon future research directions.

4. Discussion

One of the most striking results is undoubtedly the fact that 94.2% of the publications related to FP appeared after 1990, corresponding with the upsurge of the digital revolution, and characterized by the adoption and proliferation of digital computing and communication technologies.
The synchrony of these events is better perceived through the disciplines where FP has been duly applied, with the top categories being Engineering Electrical Electronic (31.19%), Telecommunications (26.61%), and Applied Mathematics (25.67%). Regardless of the disparities noted among the proportions of publications within the different categories, these results reflect without a doubt the practical scope of FP as a sharp tool for modeling problems across several disciplines. As such, it is perhaps essential to disseminate these facts to the broader scientific community with the intention of opening new research horizons.
These results do not corroborate with the profile of the most productive scholar, You, FQ, who is indicated as being the most productive scholar, with 2.09% of the total publications and a ranking at the top of the list for the H index and >10 indicators, while originating from energy systems engineering. Although the category of “energy” has the least number of publication records (0.99%), it is very likely that such a ranking is due to the term “engineering”, which falls into the first position, along with Electrical and Electronic, along with 31.49% of the records. Nevertheless, the ranking patterns of the TC indicators, as well as the ratio TC/TP, seem to be more consistent with the overall results, revealing Ng, DWK, who belongs to the wireless communication field, as the lead.
No conflict can be found regarding the journals ranking for the TC indicators. Here, IEEE Transactions on Wireless Communications stands at the top of the list, emphasizing the outcomes of the research direction, which indicate that 57.8% of the reviewed records fall under the categories Engineering Electrical Electronic and Telecommunications.
In terms of the affiliations of the scholars who are actively working on FP, 7 out of the top 10 higher education institutions are universities that are located in China, though the Indian Institute of Technology System (IIT System, India) ranks first for the TP and TP% indicators, whereas the Dresden University of Technology leads the list based on the TC/TP indicator, which may suggest a wide degree of recognition for FP in this institution.
With regard to both the total number and the percentage of publications, China is the most prolific country, with 626 (34.56%) publications, followed by USA, with 286 (15.79%), and India with 271 (14.96). With six Asian countries/regions (China, India, Taiwan, Japan, Iran, and South Korea) listed among the top 10 most prolific countries, these results suggest that Asian universities are the most high performing within FP-related research.
The collaboration of FP Chinese scholars appears to be the strongest, with peers in USA, Canada, and England, but it is somehow weaker compared to other scholars from India, South Korea, Australia, and Taiwan. It is worth noting that the majority of the top scholars who have been identified as working on FP in USA, Canada, England, and Australia, are presumably from a Chinese background. Accordingly, the aforementioned collaborative pattern can be partly viewed from the migration perspectives of mainland Chinese students and scholars, besides the flow of migrants that followed the Hong Kong handover in 1997 (Gürüz [83]).

5. Conclusions

This paper presented the first comprehensive review of the literature pertaining to FP. This review is unique, not only because it spans 55 years of FP-related research (1965–2020), but also because it was conducted through the bibliometric approach, a state-of-the-art methodology with proven superior features. Moreover, the importance of such a study stems from the emergence of FP as a piercing tool to model real-life problems that are likely to occur over a wide range of industries where the potential of FP still needs to be further explored. With 1811 records extracted from WoS data sources, we constructed a series of scientific maps of the publication numbers, countries, institutions, prolific authors, and journals. We also performed papers co-citation analysis, keywords co-occurrence analysis, and burst citation analysis on FP studies to provide a general overview of the field.
Our findings showed that China’s universities are leading the research in FP, as not only the most productive, but also the most superior in terms of the prolific universities that have been identified in the field, which counted 7 Chinese universities out of 10. Additionally, the strongest citation bursts place China at the top of the list from the high quality of the research perspective. Overall, universities from the USA and India succeed in the ranking, rendering the three countries as the main players in the FP research field.
With respect to the scientific journals, The European Journal of Operational Research (Eur. J. Oper. Res) has the most significant influence among the academic journals publishing FP research, followed by the the Journal of Optimization Theory and Applications (J. Optim. Theory. Appl.). Through thematic analysis, the extracted knowledge bases revealed that the research hotspots of FP studies focus on the FP Theory, Energy Application, Duality, Resource Allocation, Telecommunication, and Optimization. Finally, burst detection analysis revealed that more burst keywords emerged and changed more frequently during the period spanning 1990–2014, compared with the early stages of the research, suggesting that there were no steady research directions. However, the recent upsurge of keywords, such as “Multi-Objective FP”, “Energy Efficiency”, “Resource Allocation”, “Massive MIMO” (multiple-input and multiple-output), “SWIPT” (simultaneous wireless information and power transfer), and “Downlink” in FP studies undoubtedly unveils that there is a real proliferation of FP in applications pertaining to telecommunication and electrical engineering.

Author Contributions

Conceptualization, M.T. and R.K.; methodology, R.K.; software, R.K.; validation, M.T., A.O.; formal analysis, R.K.; investigation, M.T.; resources, M.T.; data curation, R.K.; writing—original draft preparation, M.T., R.K., A.O.; writing—review and editing, M.T.; visualization, M.T.; supervision, M.T.; project administration, M.T.; funding acquisition, M.T. All authors have read and agreed to the published version of the manuscript.

Funding

This study was supported by the Czech Science Foundation, grant number 19-13946S.

Institutional Review Board Statement

Not applicable.

Informed Consent Statement

Not applicable.

Data Availability Statement

Not applicable.

Conflicts of Interest

The authors declare no conflict of interest.

References

  1. Von Neumann, J. Uber ein okonomsiches gleichungssystem und eine verallgemeinering des browerschen fixpunktsatzes. Erge. Math. Kolloq. 1937, 8, 73–83. [Google Scholar]
  2. Frenk, H.; Schaible, S. Fractional Programming. In Encyclopedia of Optimization; Pardalos, P., Ed.; Springer: Boston, MA, USA, 2008; pp. 1080–1091. [Google Scholar]
  3. Charnes, A.; Cooper, W.W. Programming with linear fractional functionals. Nav. Res. Logist. Q. 1962, 9, 181–186. [Google Scholar] [CrossRef]
  4. Schlette, C. Analyse und Anwendungen von Quotientenprogrammen: Ein Beitrag zur Planung mit Hilfe der nichtlinearen Programmierung; Hain: Meisenheim am Glan, Germany, 1978. [Google Scholar]
  5. Craven, B.D. Fractional Programming; Heldermann: Berlin, Germany; John Wiley & Sons: Hoboken, NJ, USA, 1988; Volume 4. [Google Scholar]
  6. Stancu-Minasian, I.M. Fractional Programming: Theory, Methods and Applications; Springer: Dordrecht, The Netherlands, 1997. [Google Scholar]
  7. Stancu-Minasian, I.M. A ninth bibliography of fractional programming. Optimization 2019, 68, 2125–2169. [Google Scholar] [CrossRef]
  8. Chuluunbaatar, A.; Rentsen, E. Solving a fractional programming problem in a commercial bank. J. Ind. Manag. Optim. 2021. [Google Scholar] [CrossRef]
  9. Zheng, W.; Jung, T.; Lin, H. The Stackelberg Equilibrium for One-sided Zero-sum Partially Observable Stochastic Games. Automatica 2022, 140, 110231. [Google Scholar] [CrossRef]
  10. Dao, H.T.; Kim, S. Power Allocation for Energy Efficiency Maximization in Massive MIMO Systems. IEEE Trans. Veh. Technol. 2021, 70, 10570–10579. [Google Scholar] [CrossRef]
  11. He, Y.; Shen, M.; Zeng, F.; Zheng, H.; Wang, R.; Zhang, M.; Liu, X. Energy Efficient Power Allocation for Cell-free mmWave Massive MIMO with Hybrid Precoder. IEEE Commun. Lett. 2021, 26, 394–398. [Google Scholar] [CrossRef]
  12. Hamdi, M.; Hamed, A.B.; Yuan, D.; Zaied, M. Energy-Efficient Joint Task Assignment and Power Control in Energy Harvesting D2D Offloading Communications. IEEE Internet Things J. 2021, 9, 6018–6031. [Google Scholar] [CrossRef]
  13. Ammar, H.A.; Adve, R.; Shahbazpanahi, S.; Boudreau, G.; Srinivas, K.V. Downlink Resource Allocation in Multiuser Cell-free MIMO Networks with User-centric Clustering. IEEE Trans. Wirel. Commun. 2021, 21, 1482–1497. [Google Scholar] [CrossRef]
  14. Sboui, L.; Rezki, Z.; Alouini, M.S. On the Energy Efficiency of OFDMA Cellular Networks. IEEE Trans. Veh. Technol. 2021, 70, 10610–10619. [Google Scholar] [CrossRef]
  15. Ma, Z.; Zhang, S.; Chen, Z.; Han, T.; Qian, Z.; Xiao, M.; Chen, N.; Wu, J.; Lu, S. Towards Revenue-driven Multi-User Online Task Offloading in Edge Computing. IEEE Trans. Parallel Distrib. Syst. 2021, 33, 1185–1198. [Google Scholar] [CrossRef]
  16. Ding, C.; Wang, J.B.; Zhang, H.; Lin, M.; Li, G.Y. Joint Optimization of Transmission and Computation Resources for Satellite and High Altitude Platform Assisted Edge Computing. IEEE Trans. Wirel. Commun. 2021, 21, 1362–1377. [Google Scholar] [CrossRef]
  17. Zhumadillayeva, A.; Orazbayev, B.; Santeyeva, S.; Dyussekeyev, K.; Li, R.Y.M.; Crabbe, M.J.C.; Yue, X.G. Models for Oil Refinery Waste Management Using Determined and Fuzzy Conditions. Information 2020, 11, 299. [Google Scholar] [CrossRef]
  18. Orazbayev, B.; Zhumadillayeva, A.; Orazbayeva, K.; Iskakova, S.; Utenova, B.; Gazizov, F.; Ilyashenko, S.; Afanaseva, O. The System of Models and Optimization of Operating Modes of a Catalytic Reforming Unit Using Initial Fuzzy Information. Energies 2022, 15, 1573. [Google Scholar] [CrossRef]
  19. Toloo, M. An Equivalent Linear Programming Form of General Linear Fractional Programming: A Duality Approach. Mathematics 2021, 9, 1586. [Google Scholar] [CrossRef]
  20. Zhao, X.; You, F. Consequential Life Cycle Assessment and Optimization of High-Density Polyethylene Plastic Waste Chemical Recycling. ACS Sustain. Chem. Eng. 2021, 9, 12167–12184. [Google Scholar] [CrossRef]
  21. Grant, M.J.; Booth, A. A typology of reviews: An analysis of 14 review types and associated methodologies. Health Inf. Libr. J. 2009, 26, 91–108. [Google Scholar] [CrossRef]
  22. Ellegaard, O.; Wallin, J.A. The bibliometric analysis of scholarly production: How great is the impact? Scientometrics 2015, 105, 1809–1831. [Google Scholar] [CrossRef] [Green Version]
  23. Munn, Z.; Peters, M.D.J.; Stern, C.; Tufanaru, C.; McArthur, A.; Aromataris, E. Systematic review or scoping review? Guidance for authors when choosing between a systematic or scoping review approach. BMC Med. Res. Methodol. 2018, 18, 143. [Google Scholar] [CrossRef]
  24. Alm, G. Monography of Swedish fresh water ostracoda, along with the systematic review of Tribus Podocopa. Zool. Bidr. Fran Uppsala 1916, 4, 1–248. [Google Scholar]
  25. Stroup, D.F.; Berlin, J.A.; Morton, S.C.; Olkin, I.; Williamson, G.D.; Rennie, D.; Moher, D.; Becker, B.J.; Sipe, T.A.; Thacker, S.B.; et al. Meta-analysis of observational studies in epidemiology: A proposal for reporting. JAMA 2000, 283, 2008–2012. [Google Scholar] [CrossRef] [PubMed]
  26. Williams, J.S. Critical creative writing: A critical review. N. Writ. 2020, 17, 353–354. [Google Scholar] [CrossRef]
  27. Whiteside, G.S.; Walton, W.J. A Critical Review of Thirty Cases of Pyosalpinx. Bost. Med. Surg. J. 1900, 143, 310–313. [Google Scholar] [CrossRef]
  28. Podsakoff, P.M.; MacKenzie, S.B.; Lee, J.-Y.; Podsakoff, N.P. Common method biases in behavioral research: A critical review of the literature and recommended remedies. J. Appl. Psychol. 2003, 88, 879. [Google Scholar] [CrossRef] [PubMed]
  29. Buell, L. New Views of American Narrative: A Review-Essay. Texas Stud. Lit. Lang. 1977, 19, 234–246. [Google Scholar]
  30. Warburton, D.E.R.; Nicol, C.W.; Bredin, S.S.D. Health benefits of physical activity: The evidence. CMAJ 2006, 174, 801–809. [Google Scholar] [CrossRef] [PubMed] [Green Version]
  31. Thomas, J.; Newman, M.; Oliver, S. Rapid evidence assessments of research to inform social policy: Taking stock and moving forward. Evid. Policy J. Res. Debate Pract. 2013, 9, 5–27. [Google Scholar] [CrossRef]
  32. Settlage, P.; Bogumill, B.M.; Bogumill, G.P.; Jameson, D.; Bunge, R.P. Serial sections of the human brain in rapid review. Anat. Rec. 1955, 121, 463. [Google Scholar]
  33. Brooks, S.K.; Webster, R.K.; Smith, L.E.; Woodland, L.; Wessely, S.; Greenberg, N.; Rubin, G.J. The psychological impact of quarantine and how to reduce it: Rapid review of the evidence. Lancet 2020, 395, 912–920. [Google Scholar] [CrossRef] [Green Version]
  34. Mays, N.; Roberts, E.; Popay, J. Synthesising research evidence. In Studying the Organisation and Delivery of Health Services: Research Methods, 1st ed.; Fulop, N.B., Allen, P., Clarke, A., Eds.; Psychology Press: London, UK, 2001; pp. 188–219. [Google Scholar]
  35. Arksey, H.; O’Malley, L. Scoping studies: Towards a methodological framework. Int. J. Soc. Res. Methodol. 2005, 8, 19–32. [Google Scholar] [CrossRef] [Green Version]
  36. Arksey, H. Scoping the field: Services for carers of people with mental health problems. Health Soc. Care Community 2003, 11, 335–344. [Google Scholar] [CrossRef] [PubMed]
  37. Peters, M.D.J.; Godfrey, C.M.; Khalil, H.; McInerney, P.; Parker, D.; Soares, C.B. Guidance for conducting systematic scoping reviews. JBI Evid. Implement 2015, 13, 141–146. [Google Scholar] [CrossRef] [Green Version]
  38. Esquirol-Caussa, J.; Sanchez-Aldeguer, J.; Santamaria, I.D. A bibliographical review: The basis of our research. Physiother. Updat. 2017, 13, 33–36. [Google Scholar]
  39. Eckert, M.; Volmerg, J.S.; Friedrich, C.M. Augmented reality in medicine: Systematic and bibliographic review. JMIR mHealth uHealth 2019, 7, e10967. [Google Scholar] [CrossRef] [PubMed]
  40. Geddes James, J. Dictionaries in English and Foreign Languages—A Bibliographical Review. Libr. J. 1929, 54, 843–849. [Google Scholar]
  41. Zhang, Y.; Jiang, J. Bibliographical review on reconfigurable fault-tolerant control systems. Annu. Rev. Control 2008, 32, 229–252. [Google Scholar] [CrossRef]
  42. Persson, O.; Glänzel, W.; Danell, R. Inflationary bibliometric values: The role of scientific collaboration and the need for relative indicators in evaluative studies. Scientometrics 2004, 60, 421–432. [Google Scholar] [CrossRef]
  43. Hulme, E.W. Statistical Bibliography in Relation to the Growth of Modern Civilization; Butler & Tanner: Somerset, UK, 1923. [Google Scholar]
  44. Fairthorne, R. Progress in Documentation—Empirical Hyperbolic Distributions (Bradford-Zipf-Mandelbrot) For Bibliometric Description and Prediction. J. Doc. 1969, 25, 319. [Google Scholar] [CrossRef]
  45. Van Eck, N.J.; Waltman, L. Software survey: VOSviewer, a computer program for bibliometric mapping. Scientometrics 2010, 84, 523–538. [Google Scholar] [CrossRef] [Green Version]
  46. Shuttleworth, M. Pretest-Posttest Designs. Experimental Research|Experiment|Research Methods. 2009. Available online: https://explorable.com/pretest-posttest-designs (accessed on 18 March 2022).
  47. Rowley, J.; Slack, F. Conducting a literature review. Manag. Res. N. 2004, 27, 31–39. [Google Scholar] [CrossRef]
  48. Govindan, K.; Fattahi, M.; Keyvanshokooh, E. Supply chain network design under uncertainty: A comprehensive review and future research directions. Eur. J. Oper. Res. 2017, 263, 108–141. [Google Scholar] [CrossRef]
  49. Guo, Y.M.; Huang, Z.L.; Guo, J.; Guo, X.R.; Li, H.; Liu, M.Y. A bibliometric analysis and visualization of blockchain. Futur. Gener. Comput. Syst. 2021, 116, 316–332. [Google Scholar] [CrossRef]
  50. Liu, J.S.; Lu, L.Y.Y.; Lu, W.-M.; Lin, B.J.Y. Data envelopment analysis 1978–2010: A citation-based literature survey. Omega 2013, 41, 3–15. [Google Scholar] [CrossRef]
  51. Rosato, P.F.; Caputo, A.; Valente, D.; Pizzi, S. “2030 Agenda and sustainable business models in tourism: A bibliometric analysis. Ecol. Indic. 2021, 121, 106978. [Google Scholar] [CrossRef]
  52. Tang, M.; Hong, J.; Guo, S.; Liu, G.; Shen, G.Q. A bibliometric review of urban energy metabolism: Evolutionary trends and the application of network analytical methods. J. Clean. Prod. 2021, 279, 123403. [Google Scholar] [CrossRef]
  53. Usman, M.; Ho, Y.-S. A bibliometric study of the Fenton oxidation for soil and water remediation. J. Environ. Manage. 2020, 270, 110886. [Google Scholar] [CrossRef]
  54. Wang, X.; Xu, Z.; Su, S.-F.; Zhou, W. A comprehensive bibliometric analysis of uncertain group decision making from 1980 to 2019. Inf. Sci. 2021, 547, 328–353. [Google Scholar] [CrossRef]
  55. Harzing, A.-W. Two new kids on the block: How do Crossref and Dimensions compare with Google Scholar, Microsoft Academic, Scopus and the Web of Science? Scientometrics 2019, 120, 341–349. [Google Scholar] [CrossRef]
  56. Martín-Martín, A.; Orduna-Malea, E.; Thelwall, M.; López-Cózar, E.D. Google Scholar, Web of Science, Scopus: A systematic comparison of citations in 252 subject categories. J. Informetr. 2018, 12, 1160–1177. [Google Scholar] [CrossRef] [Green Version]
  57. Orduña-Malea, E.; Ayllón, J.M.; Martín-Martín, A.; López-Cózar, E.D. Methods for estimating the size of Google Scholar. Scientometrics 2015, 104, 931–949. [Google Scholar] [CrossRef] [Green Version]
  58. Van Noorden, R. Google Scholar pioneer on search engine’s future. Nature 2014. [Google Scholar] [CrossRef]
  59. Martín-Martín, A.; Thelwall, M.; Orduna-Malea, E.; López-Cózar, E.D. Google Scholar, Microsoft Academic, Scopus, Dimensions, Web of Science, and OpenCitations’ COCI: A multidisciplinary comparison of coverage via citations. Scientometrics 2021, 126, 871–906. [Google Scholar] [CrossRef]
  60. López-Cózar, E.D.; Orduña-Malea, E.; Martín-Martín, A. Google scholar as a data source for research assessment. In Springer Handbooks; Springer: Berlin/Heidelberg, Germany, 2019; pp. 95–127. [Google Scholar]
  61. Baas, J.; Schotten, M.; Plume, A.; Côté, G.; Karimi, R. Scopus as a curated, high-quality bibliometric data source for academic research in quantitative science studies. Quant. Sci. Stud. 2020, 1, 377–386. [Google Scholar] [CrossRef]
  62. Solomon, D. A different view: An inquiry into visualization of bibliometric data. In Proceedings of the ASEE Annual Conference & Exposition, Seattle, WA, USA, 14–17 June 2015; pp. 1–11. [Google Scholar]
  63. Van Eck, N.J.; Waltman, L. VOSviewer manual. Leiden Univeristeit Leiden 2013, 1, 1–53. [Google Scholar]
  64. Van Eck, N.J.; Waltman, L. Text mining and visualization using VOSviewer. arXiv 2011, arXiv:1109.2058. [Google Scholar]
  65. Van Eck, N.J.; Waltman, L. Visualizing bibliometric networks. In Measuring Scholarly Impact; Springer: Berlin/Heidelberg, Germany, 2014; pp. 285–320. [Google Scholar]
  66. Chen, C. CiteSpace II: Detecting and visualizing emerging trends and transient patterns in scientific literature. J. Am. Soc. Inf. Sci. Technol. 2006, 57, 359–377. [Google Scholar] [CrossRef] [Green Version]
  67. Chen, C. Searching for intellectual turning points: Progressive knowledge domain visualization. Proc. Natl. Acad. Sci. USA. 2004, 101, 5303–5310. [Google Scholar] [CrossRef] [Green Version]
  68. Van Eck, N.J.; Waltman, L. CitNetExplorer: A new software tool for analyzing and visualizing citation networks. J. Inform. 2014, 8, 802–823. [Google Scholar] [CrossRef] [Green Version]
  69. Garfield, E. From the science of science to scientometrics. Visualizing the history of science with HistCite software. J. Inform. 2009, 3, 173–179. [Google Scholar] [CrossRef] [Green Version]
  70. Shotton, D. CiTO, the Citation Typing Ontology, and its use for annotation of reference lists and visualization of citation networks. In Proceedings of the Bio-Ontologies 2009 Special Interest Group Meeting at ISMB, Stockholm, Sweden, 27–28 June 2009. [Google Scholar]
  71. Zhou, W.; Chen, J.; Huang, Y. Co-Citation analysis and burst detection on financial bubbles with scientometrics approach. Econ. Res. Istraživanja 2019, 32, 2310–2328. [Google Scholar] [CrossRef] [Green Version]
  72. Ng, D.W.K.; Lo, E.S.; Schober, R. Wireless information and power transfer: Energy efficiency optimization in OFDMA systems. IEEE Trans. Wirel. Commun. 2013, 12, 6352–6370. [Google Scholar] [CrossRef] [Green Version]
  73. Ng, D.W.K.; Lo, E.S.; Schober, R. Energy-efficient resource allocation in OFDMA systems with large numbers of base station antennas. IEEE Trans. Wirel. Commun. 2012, 11, 3292–3304. [Google Scholar] [CrossRef]
  74. Carlsson, C.; Fullér, R. Fuzzy multiple criteria decision making: Recent developments. Fuzzy Sets Syst. 1996, 78, 139–153. [Google Scholar] [CrossRef] [Green Version]
  75. Isheden, C.; Chong, Z.; Jorswieck, E.; Fettweis, G. Framework for link-level energy efficiency optimization with informed transmitter. IEEE Trans. Wirel. Commun. 2012, 11, 2946–2957. [Google Scholar] [CrossRef] [Green Version]
  76. Pastor, J.T.; Ruiz, J.L.; Sirvent, I. An Enhanced DEA Russell graph efficiency measure. Eur. J. Oper. Res. 1999, 115, 596–607. [Google Scholar] [CrossRef]
  77. Huang, C.; Zappone, A.; Alexandropoulos, G.C.; Debbah, M.; Yuen, C. Reconfigurable intelligent surfaces for energy efficiency in wireless communication. IEEE Trans. Wirel. Commun. 2019, 18, 4157–4170. [Google Scholar] [CrossRef] [Green Version]
  78. Wu, Q.; Tao, M.; Ng, D.W.K.; Chen, W.; Schober, R. Energy-efficient resource allocation for wireless powered communication networks. IEEE Trans. Wirel. Commun. 2015, 15, 2312–2327. [Google Scholar] [CrossRef] [Green Version]
  79. Cozman, F.G. Credal networks. Artif. Intell. 2000, 120, 199–233. [Google Scholar] [CrossRef] [Green Version]
  80. Zhou, Z.; Dong, M.; Ota, K.; Wang, G.; Yang, L.T. Energy-efficient resource allocation for D2D communications underlaying cloud-RAN-based LTE-A networks. IEEE Internet Things J. 2015, 3, 428–438. [Google Scholar] [CrossRef] [Green Version]
  81. Ng, D.W.K.; Lo, E.S.; Schober, R. Energy-efficient resource allocation for secure OFDMA systems. IEEE Trans. Veh. Technol. 2012, 61, 2572–2585. [Google Scholar] [CrossRef]
  82. Kleinberg, J. An impossibility theorem for clustering. In Advances in Neural Information Processing Systems 15, Proceedings of the 2002 Neural Information Processing Systems Conference, Vancouver, BC, Canada, 9–14 December 2002; MIT Press: Cambridge, MA, USA, 2003; pp. 463–470. [Google Scholar]
  83. Gürüz, K. Higher Education and International Student Mobility in the Global Knowledge Economy|State University of New York Press; Suny Press: Albany, NY, USA, 2011. [Google Scholar]
Figure 1. Schematic of the main differences between the types of literature review.
Mathematics 10 01796 g001
Figure 2. Search settings in WoS.
Mathematics 10 01796 g002
Figure 3. VOSviewer analysis process.
Mathematics 10 01796 g003
Figure 4. Top 10 FP categories.
Mathematics 10 01796 g004
Figure 5. Number of publications and citations (1990–2020).
Mathematics 10 01796 g005
Figure 6. Types of publications related to FP.
Mathematics 10 01796 g006
Figure 7. Co-authorship collaboration between the 20 most collaboration-intensive countries.
Mathematics 10 01796 g007
Figure 8. Co-authorship collaboration of the 15 most collaboration-intensive institutions.
Mathematics 10 01796 g008
Figure 9. Author keywords co-occurrences network, n > 10.
Mathematics 10 01796 g009
Table 1. Most prolific scholars of Fractional Programming.
AuthorsTPTP%TCTC/TPH indexTop>10Active Years
TotalFPCitation
You, FQ 382.09111429.325216133192005–2021
Lai, HC251.3828411.36131159131999–2018
Zappone, A251.3855722.2822923092009–2021
Huang, GH221.2132114.59721161111996–2021
Schaible, S221.2183738.053111131131977–2012
Sakawa, M211.1640419.24371061101978–2011
Zalmai, GJ180.99985.441171331985–2018
Ahmad, I170.931679.471572862004–2021
Ng, DWK170.93145285.414111355112009–2021
TP = Total Publication; TC = Total Citation; TC/TP = Citation Per Item; >20 = more than 20 citations; C/Y = Cites/Year; C/P = Cites/Paper; FP= Fractional Programming.
Table 2. Top 10 most productive journals in Fractional Programming.
H Index
Source TitlesTPTP%TCTC/TPG IndexTotalFP>20ActiveC/YC/P
Eur. J. Oper. Res.553.03129023.456984062020197812,550.84552
J. Optim. Theory. Appl.553.0388616.11295169161519682504.47132.74
IEEE. Access.502.764949.88278165139201316,068.88128.58
J. Glob. Optim.472.5996420.51304127161319913850.20115.51
J. Math. Anal. Appl.402.2160315.08400241151119603776.61230.60
IEEE. Trans. Wirel.392.15236860.724612662222200214,532.26276.11
IEEE. Trans. Veh. 331.8289727.18415258151119724988.33244.43
IEEE Int. Conf. Commun.311.711274.19760711989575.6618.42
IEEE. GLOBECOM291.60983.38116765219841009.6837.36
IEEE Trans. Commun.281.5488531.61631348131119729097.76445.79
TP = Total Publication; TC = Total Citation; TC/TP = Citation Per Item; >20 = more than 20 citations; C/Y = Cites/Year; C/P = Cites/Paper; FP= Fractional Programming.
Table 3. Most productive universities in Fractional Programming.
OrganizationsCountryTPTCTP% TC/TPH Index>20
Indian Institute of TechnologyIndia756943.999.251511
Southeast UniversityChina627973.3012.851310
University of DelhiIndia521922.763.6972
Beijing University Posts TelecommunChina464032.458.7694
Xidian UniversityChina437842.2918.231612
North China Electric Power UniversityChina388202.0221.851513
Tsinghua UniversityChina294491.5415.48118
University of Electronic Science and TechnologyChina291601.545.5263
Chinese Academy of SciencesChina282471.498.82102
Dresden University of TechnologyGermany275981.4422.1596
TP = Total Publication; TC = Total Citation; TC/TP = Citation Per Item; >20 = more than 20 citations; FP= Fractional Programming.
Table 4. Most productive countries for Fractional Programming.
CountriesTPTP %TCTC/TPH Index>50
China62634.56800512.794035
USA28615.79518018.114032
India27114.9616596.12214
Canada1297.12271321.032710
Taiwan1005.52131913.19207
Japan965.30196220.442513
England774.25107513.96175
Germany723.97192126.681710
Iran673.704486.69113
South Korea553.033346.07110
Italy532.9266112.47123
Australia512.8182316.14143
TP = Total Publication; TC = Total Citation; TC/TP = Citation Per Item; >50 = more than 50 citations; FP= Fractional Programming.
Table 5. Top 25 keywords with the strongest citation bursts.
Author Keywords Strength Begin-End 1965–2020
Duality 28.231990–2014▂ ▂ ▂ ▂ ▂ ▂ ▂ ▂ ▂ ▂ ▂ ▂ ▂ ▂ ▂ ▂ ▂ ▂ ▂ ▂ ▂ ▂ ▂ ▂ ▂▃ ▃ ▃ ▃ ▃ ▃ ▃ ▃ ▃ ▃ ▃ ▃ ▃ ▃ ▃ ▃ ▃ ▃ ▃ ▃ ▃ ▃ ▃ ▃ ▃ ▂ ▂ ▂ ▂ ▂ ▂
Optimality Condition 14.551995–2014▂ ▂ ▂ ▂ ▂ ▂ ▂ ▂ ▂ ▂ ▂ ▂ ▂ ▂ ▂ ▂ ▂ ▂ ▂ ▂ ▂ ▂ ▂ ▂ ▂ ▂ ▂ ▂ ▂ ▂ ▃ ▃ ▃ ▃ ▃ ▃ ▃ ▃ ▃ ▃ ▃ ▃ ▃ ▃ ▃ ▃ ▃ ▃ ▃ ▃ ▂ ▂ ▂ ▂ ▂ ▂
Global Optimization 14.032000–2014▂ ▂ ▂ ▂ ▂ ▂ ▂ ▂ ▂ ▂ ▂ ▂ ▂ ▂ ▂ ▂ ▂ ▂ ▂ ▂ ▂ ▂ ▂ ▂ ▂ ▂ ▂ ▂ ▂ ▂ ▂ ▂ ▂ ▂ ▂ ▃ ▃ ▃ ▃ ▃ ▃ ▃ ▃ ▃ ▃ ▃ ▃ ▃ ▃ ▃▂ ▂ ▂ ▂ ▂ ▂
Optimality 10.462005–2014▂ ▂ ▂ ▂ ▂ ▂ ▂ ▂ ▂ ▂ ▂ ▂ ▂ ▂ ▂ ▂ ▂ ▂ ▂ ▂ ▂ ▂ ▂ ▂ ▂ ▂ ▂ ▂ ▂ ▂ ▂ ▂ ▂ ▂ ▂ ▂ ▂ ▂ ▂ ▂ ▃ ▃ ▃ ▃ ▃ ▃ ▃ ▃ ▃ ▃▂ ▂ ▂ ▂ ▂ ▂
Sufficient Condition 9.382000–2014▂ ▂ ▂ ▂ ▂ ▂ ▂ ▂ ▂ ▂ ▂ ▂ ▂ ▂ ▂ ▂ ▂ ▂ ▂ ▂ ▂ ▂ ▂ ▂ ▂ ▂ ▂ ▂ ▂ ▂ ▂ ▂ ▂ ▂ ▂ ▃ ▃ ▃ ▃ ▃ ▃ ▃ ▃ ▃ ▃ ▃ ▃ ▃ ▃ ▃ ▂ ▂ ▂ ▂ ▂ ▂
Fractional Programming 8.372005–2014▂ ▂ ▂ ▂ ▂ ▂ ▂ ▂ ▂ ▂ ▂ ▂ ▂ ▂ ▂ ▂ ▂ ▂ ▂ ▂ ▂ ▂ ▂ ▂ ▂ ▂ ▂ ▂ ▂ ▂ ▂ ▂ ▂ ▂ ▂ ▂ ▂ ▂ ▂ ▂ ▃ ▃ ▃ ▃ ▃ ▃ ▃ ▃ ▃ ▃ ▂ ▂ ▂ ▂ ▂ ▂
Criteria 8.271995–2014▂ ▂ ▂ ▂ ▂ ▂ ▂ ▂ ▂ ▂ ▂ ▂ ▂ ▂ ▂ ▂ ▂ ▂ ▂ ▂ ▂ ▂ ▂ ▂ ▂ ▂ ▂ ▂ ▂ ▂ ▃ ▃ ▃ ▃ ▃ ▃ ▃ ▃ ▃ ▃ ▃ ▃ ▃ ▃ ▃ ▃ ▃ ▃ ▃ ▃ ▂ ▂ ▂ ▂ ▂ ▂
Generalized Convexity 7.391990–2014▂ ▂ ▂ ▂ ▂ ▂ ▂ ▂ ▂ ▂ ▂ ▂ ▂ ▂ ▂ ▂ ▂ ▂ ▂ ▂ ▂ ▂ ▂ ▂ ▂ ▃ ▃ ▃ ▃ ▃ ▃ ▃ ▃ ▃ ▃ ▃ ▃ ▃ ▃ ▃ ▃ ▃ ▃ ▃ ▃ ▃ ▃ ▃ ▃ ▃ ▂ ▂ ▂ ▂ ▂ ▂
Multi-Objective FP 6.862000–2019▂ ▂ ▂ ▂ ▂ ▂ ▂ ▂ ▂ ▂ ▂ ▂ ▂ ▂ ▂ ▂ ▂ ▂ ▂ ▂ ▂ ▂ ▂ ▂ ▂ ▂ ▂ ▂ ▂ ▂ ▂ ▂ ▂ ▂ ▂ ▃ ▃ ▃ ▃ ▃ ▃ ▃ ▃ ▃ ▃ ▃ ▃ ▃ ▃ ▃ ▃ ▃ ▃ ▃ ▃
Invexity 6.561990–2014▂ ▂ ▂ ▂ ▂ ▂ ▂ ▂ ▂ ▂ ▂ ▂ ▂ ▂ ▂ ▂ ▂ ▂ ▂ ▂ ▂ ▂ ▂ ▂ ▂ ▃ ▃ ▃ ▃ ▃ ▃ ▃ ▃ ▃ ▃ ▃ ▃ ▃ ▃ ▃ ▃ ▃ ▃ ▃ ▃ ▃ ▃ ▃ ▃ ▃ ▂ ▂ ▂ ▂ ▂ ▂
Duality Theorem 6.32000–2014▂ ▂ ▂ ▂ ▂ ▂ ▂ ▂ ▂ ▂ ▂ ▂ ▂ ▂ ▂ ▂ ▂ ▂ ▂ ▂ ▂ ▂ ▂ ▂ ▂ ▂ ▂ ▂ ▂ ▂ ▂ ▂ ▂ ▂ ▂ ▃ ▃ ▃ ▃ ▃ ▃ ▃ ▃ ▃ ▃ ▃ ▃ ▃ ▃ ▃ ▂ ▂ ▂ ▂ ▂ ▂
Convexity 6.171995–2014▂ ▂ ▂ ▂ ▂ ▂ ▂ ▂ ▂ ▂ ▂ ▂ ▂ ▂ ▂ ▂ ▂ ▂ ▂ ▂ ▂ ▂ ▂ ▂ ▂ ▂ ▂ ▂ ▂ ▂ ▃ ▃ ▃ ▃ ▃ ▃ ▃ ▃ ▃ ▃ ▃ ▃ ▃ ▃ ▃ ▃ ▃ ▃ ▃ ▃ ▂ ▂ ▂ ▂ ▂ ▂
Energy Efficiency 6.132015–2020▂ ▂ ▂ ▂ ▂ ▂ ▂ ▂ ▂ ▂ ▂ ▂ ▂ ▂ ▂ ▂ ▂ ▂ ▂ ▂ ▂ ▂ ▂ ▂ ▂ ▂ ▂ ▂ ▂ ▂ ▂ ▂ ▂ ▂ ▂ ▂ ▂ ▂ ▂ ▂ ▂ ▂ ▂ ▂ ▂ ▂ ▂ ▂ ▂ ▂ ▃ ▃ ▃ ▃ ▃ ▃
Generalized FP 6.041990–2009 ▂ ▂ ▂ ▂ ▂ ▂ ▂ ▂ ▂ ▂ ▂ ▂ ▂ ▂ ▂ ▂ ▂ ▂ ▂ ▂ ▂ ▂ ▂ ▂ ▂ ▃ ▃ ▃ ▃ ▃ ▃ ▃ ▃ ▃ ▃ ▃ ▃ ▃ ▃ ▃ ▃ ▃ ▃ ▃ ▃ ▂ ▂ ▂ ▂ ▂ ▂ ▂ ▂ ▂ ▂ ▂
Efficiency 5.971995–2014 ▂ ▂ ▂ ▂ ▂ ▂ ▂ ▂ ▂ ▂ ▂ ▂ ▂ ▂ ▂ ▂ ▂ ▂ ▂ ▂ ▂ ▂ ▂ ▂ ▂ ▂ ▂ ▂ ▂ ▂ ▃ ▃ ▃ ▃ ▃ ▃ ▃ ▃ ▃ ▃ ▃ ▃ ▃ ▃ ▃ ▃ ▃ ▃ ▃ ▃ ▂ ▂ ▂ ▂ ▂ ▂
Resource Allocation 5.92015–2020 ▂ ▂ ▂ ▂ ▂ ▂ ▂ ▂ ▂ ▂ ▂ ▂ ▂ ▂ ▂ ▂ ▂ ▂ ▂ ▂ ▂ ▂ ▂ ▂ ▂ ▂ ▂ ▂ ▂ ▂ ▂ ▂ ▂ ▂ ▂ ▂ ▂ ▂ ▂ ▂ ▂ ▂ ▂ ▂ ▂ ▂ ▂ ▂ ▂ ▂ ▃ ▃ ▃ ▃ ▃ ▃
Goal Programming 5.581995–2009 ▂ ▂ ▂ ▂ ▂ ▂ ▂ ▂ ▂ ▂ ▂ ▂ ▂ ▂ ▂ ▂ ▂ ▂ ▂ ▂ ▂ ▂ ▂ ▂ ▂ ▂ ▂ ▂ ▂ ▂ ▃ ▃ ▃ ▃ ▃ ▃ ▃ ▃ ▃ ▃ ▃ ▃ ▃ ▃ ▃ ▂ ▂ ▂ ▂ ▂ ▂ ▂ ▂ ▂ ▂ ▂
Massive MIMO 5.552015–2020 ▂ ▂ ▂ ▂ ▂ ▂ ▂ ▂ ▂ ▂ ▂ ▂ ▂ ▂ ▂ ▂ ▂ ▂ ▂ ▂ ▂ ▂ ▂ ▂ ▂ ▂ ▂ ▂ ▂ ▂ ▂ ▂ ▂ ▂ ▂ ▂ ▂ ▂ ▂ ▂ ▂ ▂ ▂ ▂ ▂ ▂ ▂ ▂ ▂ ▂ ▃ ▃ ▃ ▃ ▃ ▃
Fuzzy Programming 4.992000–2014 ▂ ▂ ▂ ▂ ▂ ▂ ▂ ▂ ▂ ▂ ▂ ▂ ▂ ▂ ▂ ▂ ▂ ▂ ▂ ▂ ▂ ▂ ▂ ▂ ▂ ▂ ▂ ▂ ▂ ▂ ▂ ▂ ▂ ▂ ▂ ▃ ▃ ▃ ▃ ▃ ▃ ▃ ▃ ▃ ▃ ▃ ▃ ▃ ▃ ▃ ▂ ▂ ▂ ▂ ▂ ▂
Minimax FP 4.772010–2014 ▂ ▂ ▂ ▂ ▂ ▂ ▂ ▂ ▂ ▂ ▂ ▂ ▂ ▂ ▂ ▂ ▂ ▂ ▂ ▂ ▂ ▂ ▂ ▂ ▂ ▂ ▂ ▂ ▂ ▂ ▂ ▂ ▂ ▂ ▂ ▂ ▂ ▂ ▂ ▂ ▂ ▂ ▂ ▂ ▂ ▃ ▃ ▃ ▃ ▃ ▂ ▂ ▂ ▂ ▂ ▂
SWIPT 4.762015–2020 ▂ ▂ ▂ ▂ ▂ ▂ ▂ ▂ ▂ ▂ ▂ ▂ ▂ ▂ ▂ ▂ ▂ ▂ ▂ ▂ ▂ ▂ ▂ ▂ ▂ ▂ ▂ ▂ ▂ ▂ ▂ ▂ ▂ ▂ ▂ ▂ ▂ ▂ ▂ ▂ ▂ ▂ ▂ ▂ ▂ ▂ ▂ ▂ ▂ ▂ ▃ ▃ ▃ ▃ ▃ ▃
Sufficient Optimality Condition 4.722005–2009 ▂ ▂ ▂ ▂ ▂ ▂ ▂ ▂ ▂ ▂ ▂ ▂ ▂ ▂ ▂ ▂ ▂ ▂ ▂ ▂ ▂ ▂ ▂ ▂ ▂ ▂ ▂ ▂ ▂ ▂ ▂ ▂ ▂ ▂ ▂ ▂ ▂ ▂ ▂ ▂ ▃ ▃ ▃ ▃ ▃ ▂ ▂ ▂ ▂ ▂ ▂ ▂ ▂ ▂ ▂ ▂
Nonlinear Sum 4.592005–2014 ▂ ▂ ▂ ▂ ▂ ▂ ▂ ▂ ▂ ▂ ▂ ▂ ▂ ▂ ▂ ▂ ▂ ▂ ▂ ▂ ▂ ▂ ▂ ▂ ▂ ▂ ▂ ▂ ▂ ▂ ▂ ▂ ▂ ▂ ▂ ▂ ▂ ▂ ▂ ▂ ▃ ▃ ▃ ▃ ▃ ▃ ▃ ▃ ▃ ▃ ▂ ▂ ▂ ▂ ▂ ▂
Downlink 4.522015–2020 ▂ ▂ ▂ ▂ ▂ ▂ ▂ ▂ ▂ ▂ ▂ ▂ ▂ ▂ ▂ ▂ ▂ ▂ ▂ ▂ ▂ ▂ ▂ ▂ ▂ ▂ ▂ ▂ ▂ ▂ ▂ ▂ ▂ ▂ ▂ ▂ ▂ ▂ ▂ ▂ ▂ ▂ ▂ ▂ ▂ ▂ ▂ ▂ ▂ ▂ ▃ ▃ ▃ ▃ ▃ ▃
Bound Algorithm 4.392005–2014 ▂ ▂ ▂ ▂ ▂ ▂ ▂ ▂ ▂ ▂ ▂ ▂ ▂ ▂ ▂ ▂ ▂ ▂ ▂ ▂ ▂ ▂ ▂ ▂ ▂ ▂ ▂ ▂ ▂ ▂ ▂ ▂ ▂ ▂ ▂ ▂ ▂ ▂ ▂ ▂ ▃ ▃ ▃ ▃ ▃ ▃ ▃ ▃ ▃ ▃ ▂ ▂ ▂ ▂ ▂ ▂
Table 6. Top 15 cited authors with the strongest citation bursts. The last column includes blue and red lines where the blue line portrays the beginning and end of a cited author through the years and the red line illustrates the period of a cited authors burst.
Cited AuthorsStrengthBegin -End1965–2020
Bector 28.351990–2011 ▂ ▂ ▂ ▂ ▂ ▂ ▂ ▂ ▂ ▂ ▂ ▂ ▂ ▂ ▂ ▂ ▂ ▂ ▂ ▂ ▂ ▂ ▂ ▂ ▂ ▃ ▃ ▃ ▃ ▃ ▃ ▃ ▃ ▃ ▃ ▃ ▃ ▃ ▃ ▃ ▃ ▃ ▃ ▃ ▃ ▃ ▃ ▂ ▂ ▂ ▂ ▂ ▂ ▂ ▂ ▂
Chandra 28.161988–2012▂ ▂ ▂ ▂ ▂ ▂ ▂ ▂ ▂ ▂ ▂ ▂ ▂ ▂ ▂ ▂ ▂ ▂ ▂ ▂ ▂ ▂ ▂ ▃ ▃ ▃ ▃ ▃ ▃ ▃ ▃ ▃ ▃ ▃ ▃ ▃ ▃ ▃ ▃ ▃ ▃ ▃ ▃ ▃ ▃ ▃ ▃ ▃ ▂ ▂ ▂ ▂ ▂ ▂ ▂ ▂
Weir 24.441990–2008▂ ▂ ▂ ▂ ▂ ▂ ▂ ▂ ▂ ▂ ▂ ▂ ▂ ▂ ▂ ▂ ▂ ▂ ▂ ▂ ▂ ▂ ▂ ▂ ▂ ▃ ▃ ▃ ▃ ▃ ▃ ▃ ▃ ▃ ▃ ▃ ▃ ▃ ▃ ▃ ▃ ▃ ▃ ▃ ▂ ▂ ▂ ▂ ▂ ▂ ▂ ▂ ▂ ▂ ▂ ▂
Zappone 23.612017–2020▂ ▂ ▂ ▂ ▂ ▂ ▂ ▂ ▂ ▂ ▂ ▂ ▂ ▂ ▂ ▂ ▂ ▂ ▂ ▂ ▂ ▂ ▂ ▂ ▂ ▂ ▂ ▂ ▂ ▂ ▂ ▂ ▂ ▂ ▂ ▂ ▂ ▂ ▂ ▂ ▂ ▂ ▂ ▂ ▂ ▂ ▂ ▂ ▂ ▂ ▂ ▂ ▃ ▃ ▃ ▃
Jagannathan 21.531968–1996▂ ▂ ▂ ▃ ▃ ▃ ▃ ▃ ▃ ▃ ▃ ▃ ▃ ▃ ▃ ▃ ▃ ▃ ▃ ▃ ▃ ▃ ▃ ▃ ▃ ▃ ▃ ▃ ▃ ▃ ▃ ▃ ▂ ▂ ▂ ▂ ▂ ▂ ▂ ▂ ▂ ▂ ▂ ▂ ▂ ▂ ▂ ▂ ▂ ▂ ▂ ▂ ▂ ▂ ▂ ▂
Ng 21.132015–2018▂ ▂ ▂ ▂ ▂ ▂ ▂ ▂ ▂ ▂ ▂ ▂ ▂ ▂ ▂ ▂ ▂ ▂ ▂ ▂ ▂ ▂ ▂ ▂ ▂ ▂ ▂ ▂ ▂ ▂ ▂ ▂ ▂ ▂ ▂ ▂ ▂ ▂ ▂ ▂ ▂ ▂ ▂ ▂ ▂ ▂ ▂ ▂ ▂ ▂ ▃ ▃ ▃ ▃ ▂ ▂
Vandenberghe 20.512016–2018▂ ▂ ▂ ▂ ▂ ▂ ▂ ▂ ▂ ▂ ▂ ▂ ▂ ▂ ▂ ▂ ▂ ▂ ▂ ▂ ▂ ▂ ▂ ▂ ▂ ▂ ▂ ▂ ▂ ▂ ▂ ▂ ▂ ▂ ▂ ▂ ▂ ▂ ▂ ▂ ▂ ▂ ▂ ▂ ▂ ▂ ▂ ▂ ▂ ▂ ▂ ▃ ▃ ▃ ▂ ▂
Miao 19.712012–2016▂ ▂ ▂ ▂ ▂ ▂ ▂ ▂ ▂ ▂ ▂ ▂ ▂ ▂ ▂ ▂ ▂ ▂ ▂ ▂ ▂ ▂ ▂ ▂ ▂ ▂ ▂ ▂ ▂ ▂ ▂ ▂ ▂ ▂ ▂ ▂ ▂ ▂ ▂ ▂ ▂ ▂ ▂ ▂ ▂ ▂ ▂ ▃ ▃ ▃ ▃ ▃ ▂ ▂ ▂ ▂
Mangasarian 19.521972–2007▂ ▂ ▂ ▂ ▂ ▂ ▂ ▃ ▃ ▃ ▃ ▃ ▃ ▃ ▃ ▃ ▃ ▃ ▃ ▃ ▃ ▃ ▃ ▃ ▃ ▃ ▃ ▃ ▃ ▃ ▃ ▃ ▃ ▃ ▃ ▃ ▃ ▃ ▃ ▃ ▃ ▃ ▃ ▂ ▂ ▂ ▂ ▂ ▂ ▂ ▂ ▂ ▂ ▂ ▂ ▂
Craven 19.41975–2008▂ ▂ ▂ ▂ ▂ ▂ ▂ ▂ ▂ ▂ ▃ ▃ ▃ ▃ ▃ ▃ ▃ ▃ ▃ ▃ ▃ ▃ ▃ ▃ ▃ ▃ ▃ ▃ ▃ ▃ ▃ ▃ ▃ ▃ ▃ ▃ ▃ ▃ ▃ ▃ ▃ ▃ ▃ ▃ ▂ ▂ ▂ ▂ ▂ ▂ ▂ ▂ ▂ ▂ ▂ ▂
Lai 19.181999–2014▂ ▂ ▂ ▂ ▂ ▂ ▂ ▂ ▂ ▂ ▂ ▂ ▂ ▂ ▂ ▂ ▂ ▂ ▂ ▂ ▂ ▂ ▂ ▂ ▂ ▂ ▂ ▂ ▂ ▂ ▂ ▂ ▂ ▂ ▃ ▃ ▃ ▃ ▃ ▃ ▃ ▃ ▃ ▃ ▃ ▃ ▃ ▃ ▃ ▃ ▂ ▂ ▂ ▂ ▂ ▂
Mishra 18.822006–2013▂ ▂ ▂ ▂ ▂ ▂ ▂ ▂ ▂ ▂ ▂ ▂ ▂ ▂ ▂ ▂ ▂ ▂ ▂ ▂ ▂ ▂ ▂ ▂ ▂ ▂ ▂ ▂ ▂ ▂ ▂ ▂ ▂ ▂ ▂ ▂ ▂ ▂ ▂ ▂ ▂ ▃ ▃ ▃ ▃ ▃ ▃ ▃ ▃ ▂ ▂ ▂ ▂ ▂ ▂ ▂
Liu18.251998–2014▂ ▂ ▂ ▂ ▂ ▂ ▂ ▂ ▂ ▂ ▂ ▂ ▂ ▂ ▂ ▂ ▂ ▂ ▂ ▂ ▂ ▂ ▂ ▂ ▂ ▂ ▂ ▂ ▂ ▂ ▂ ▂ ▂ ▃ ▃ ▃ ▃ ▃ ▃ ▃ ▃ ▃ ▃ ▃ ▃ ▃ ▃ ▃ ▃ ▃ ▂ ▂ ▂ ▂ ▂ ▂
Mond18.211978–2013▂ ▂ ▂ ▂ ▂ ▂ ▂ ▂ ▂ ▂ ▂ ▂ ▂ ▃ ▃ ▃ ▃ ▃ ▃ ▃ ▃ ▃ ▃ ▃ ▃ ▃ ▃ ▃ ▃ ▃ ▃ ▃ ▃ ▃ ▃ ▃ ▃ ▃ ▃ ▃ ▃ ▃ ▃ ▃ ▃ ▃ ▃ ▃ ▃ ▂ ▂ ▂ ▂ ▂ ▂ ▂
Hanson17.331989–2013▂ ▂ ▂ ▂ ▂ ▂ ▂ ▂ ▂ ▂ ▂ ▂ ▂ ▂ ▂ ▂ ▂ ▂ ▂ ▂ ▂ ▂ ▂ ▂ ▃ ▃ ▃ ▃ ▃ ▃ ▃ ▃ ▃ ▃ ▃ ▃ ▃ ▃ ▃ ▃ ▃ ▃ ▃ ▃ ▃ ▃ ▃ ▃ ▃ ▂ ▂ ▂ ▂ ▂ ▂ ▂
Table 7. Top 10 cited journals with the strongest citation bursts. The last column includes blue and red lines where the blue line portrays the beginning and end of a cited journal through the years and the red line illustrates the period of a cited authors burst.
Cited JournalsStrengthBegin-End1965–2020
J Math Anal Appl54.731984–2012▂ ▂ ▂ ▂ ▂ ▂ ▂ ▂ ▂ ▂ ▂ ▂ ▂ ▂ ▂ ▂ ▂ ▂ ▂ ▃ ▃ ▃ ▃ ▃ ▃ ▃ ▃ ▃ ▃ ▃ ▃ ▃ ▃ ▃ ▃ ▃ ▃ ▃ ▃ ▃ ▃ ▃ ▃ ▃ ▃ ▃ ▃ ▃ ▂ ▂ ▂ ▂ ▂ ▂ ▂ ▂
Ieee Access47.232018–2020▂ ▂ ▂ ▂ ▂ ▂ ▂ ▂ ▂ ▂ ▂ ▂ ▂ ▂ ▂ ▂ ▂ ▂ ▂ ▂ ▂ ▂ ▂ ▂ ▂ ▂ ▂ ▂ ▂ ▂ ▂ ▂ ▂ ▂ ▂ ▂ ▂ ▂ ▂ ▂ ▂ ▂ ▂ ▂ ▂ ▂ ▂ ▂ ▂ ▂ ▂ ▂ ▂ ▃ ▃ ▃
J Optimiz Theory App39.051984–2012▂ ▂ ▂ ▂ ▂ ▂ ▂ ▂ ▂ ▂ ▂ ▂ ▂ ▂ ▂ ▂ ▂ ▂ ▂ ▃ ▃ ▃ ▃ ▃ ▃ ▃ ▃ ▃ ▃ ▃ ▃ ▃ ▃ ▃ ▃ ▃ ▃ ▃ ▃ ▃ ▃ ▃ ▃ ▃ ▃ ▃ ▃ ▃ ▂ ▂ ▂ ▂ ▂ ▂ ▂ ▂
Optimization37.881995–2011▂ ▂ ▂ ▂ ▂ ▂ ▂ ▂ ▂ ▂ ▂ ▂ ▂ ▂ ▂ ▂ ▂ ▂ ▂ ▂ ▂ ▂ ▂ ▂ ▂ ▂ ▂ ▂ ▂ ▂ ▃ ▃ ▃ ▃ ▃ ▃ ▃ ▃ ▃ ▃ ▃ ▃ ▃ ▃ ▃ ▃ ▃ ▂ ▂ ▂ ▂ ▂ ▂ ▂ ▂ ▂
Nonlinear Programmin35.001972–2009▂ ▂ ▂ ▂ ▂ ▂ ▂ ▃ ▃ ▃ ▃ ▃ ▃ ▃ ▃ ▃ ▃ ▃ ▃ ▃ ▃ ▃ ▃ ▃ ▃ ▃ ▃ ▃ ▃ ▃ ▃ ▃ ▃ ▃ ▃ ▃ ▃ ▃ ▃ ▃ ▃ ▃ ▃ ▃ ▃ ▂ ▂ ▂ ▂ ▂ ▂ ▂ ▂ ▂ ▂ ▂
J Global Optim32.442002–2013▂ ▂ ▂ ▂ ▂ ▂ ▂ ▂ ▂ ▂ ▂ ▂ ▂ ▂ ▂ ▂ ▂ ▂ ▂ ▂ ▂ ▂ ▂ ▂ ▂ ▂ ▂ ▂ ▂ ▂ ▂ ▂ ▂ ▂ ▂ ▂ ▂ ▃ ▃ ▃ ▃ ▃ ▃ ▃ ▃ ▃ ▃ ▃ ▃ ▂ ▂ ▂ ▂ ▂ ▂ ▂
J Aust Math Soc B32.281988–2013▂ ▂ ▂ ▂ ▂ ▂ ▂ ▂ ▂ ▂ ▂ ▂ ▂ ▂ ▂ ▂ ▂ ▂ ▂ ▂ ▂ ▂ ▂ ▃ ▃ ▃ ▃ ▃ ▃ ▃ ▃ ▃ ▃ ▃ ▃ ▃ ▃ ▃ ▃ ▃ ▃ ▃ ▃ ▃ ▃ ▃ ▃ ▃ ▃ ▂ ▂ ▂ ▂ ▂ ▂ ▂
Nav Res Log29.131965–2005▃ ▃ ▃ ▃ ▃ ▃ ▃ ▃ ▃ ▃ ▃ ▃ ▃ ▃ ▃ ▃ ▃ ▃ ▃ ▃ ▃ ▃ ▃ ▃ ▃ ▃ ▃ ▃ ▃ ▃ ▃ ▃ ▃ ▃ ▃ ▃ ▃ ▃ ▃ ▃ ▃ ▂ ▂ ▂ ▂ ▂ ▂ ▂ ▂ ▂ ▂ ▂ ▂ ▂ ▂ ▂
Oper Res27.131968–2011▂ ▂ ▂ ▃ ▃ ▃ ▃ ▃ ▃ ▃ ▃ ▃ ▃ ▃ ▃ ▃ ▃ ▃ ▃ ▃ ▃ ▃ ▃ ▃ ▃ ▃ ▃ ▃ ▃ ▃ ▃ ▃ ▃ ▃ ▃ ▃ ▃ ▃ ▃ ▃ ▃ ▃ ▃ ▃ ▃ ▃ ▃ ▂ ▂ ▂ ▂ ▂ ▂ ▂ ▂ ▂
J Info & Optimiz Sci 27.121990–2012▂ ▂ ▂ ▂ ▂ ▂ ▂ ▂ ▂ ▂ ▂ ▂ ▂ ▂ ▂ ▂ ▂ ▂ ▂ ▂ ▂ ▂ ▂ ▂ ▂ ▃ ▃ ▃ ▃ ▃ ▃ ▃ ▃ ▃ ▃ ▃ ▃ ▃ ▃ ▃ ▃ ▃ ▃ ▃ ▃ ▃ ▃ ▃ ▂ ▂ ▂ ▂ ▂ ▂ ▂ ▂
Publisher’s Note: MDPI stays neutral with regard to jurisdictional claims in published maps and institutional affiliations.